
Abstract
A growing body of experimental literature investigates how student-level background characteristics are associated with dishonest behavior in early adolescence. However, results from prior studies are mixed. To revisit earlier findings, we conducted a comprehensive literature review and executed two consecutive, large-scale, incentivized surveys in Hungarian primary schools involving the same students in different academic years. We focused on eight student-level background characteristics: social status, cognitive ability, grade point average, disruptive school behavior, patience, age, altruism, and gender. Our analysis revealed no consistent patterns between students’ background characteristics and dishonest behavior. This finding aligns with the results of our detailed literature review, which suggests that adolescents’ dishonest behavior was inconsistently associated with their background characteristics in prior scholarship. We conclude that adolescents’ dishonest behavior is much more spontaneous, probably shaped by situational factors, and less predictable than previously thought.
Keywords
Introduction
Adolescents frequently engage in dishonest behavior, characterized by deceptive misreporting or omitting information for personal gain. They often withhold information from their parents (Perkins & Turiel, 2007; Smetana et al., 2009) to avoid parental punishment or restrictions, evade parental control, and assert a sense of autonomy (Finkenauer et al., 2002; Kerr et al., 1999; Marshall et al., 2005). For example, the prevalence of illicit alcohol and tobacco usage among European adolescents is significant. Statistics show that 20% of European adolescents have smoked and 49% have consumed alcohol in the last 30 days (ESPAD, 2020) 1 . This widespread usage implies that adolescents may be involved in deceptive practices, as acquiring these substances often requires dishonesty, such as misrepresenting their age. From the prevention perspective, it is essential to investigate how adolescents’ background characteristics are linked to their dishonest behavior and to understand who is involved in cheating.
Both psychologists and economists have shown a growing interest in experimental measures of dishonest behavior. These measures do not rely on involvement in illegal activities. Instead, they are based on dishonest misreporting that increases one’s utility, as evaluated in tasks like the die-under-the-cup task (Fischbacher & Föllmi-Heusi, 2013), 2 the coin toss task (Bucciol & Piovesan, 2011), 3 the sender-and-receiver game (Glätzle-Rützler & Lergetporer, 2015), 4 the mind game (Jiang, 2013) 5 and the spinning game (Talwar & Lee, 2008). 6 The importance of these experimental measures is that they are known to correlate significantly with various dishonest behaviors outside the laboratory, including fare evasion (Dai et al., 2018), deceptive market-related practices (Kröll & Rustagi, 2016), fraudulent job absenteeism (Hanna & Wang, 2017), tax evasion (Gächter & Schulz, 2016) and adolescents’ school misbehavior (Cohn & Maréchal, 2018).
Nevertheless, as we will highlight in our comprehensive literature review, the experimental research has yielded inconsistent results regarding the correlation between adolescents’ background characteristics and dishonest behavior. Most importantly, the previously revealed associations regarding direction, size, and statistical significance are not consistent across different studies. Since the associations were identified using small samples, in most cases containing a few hundred students from two to four (but never more than 10) schools, prior results might be context-specific, potentially due to the small-sample-bias (Button et al., 2013; Ioannidis, 2005; Kühberger et al., 2014).
By conducting two consecutive studies among over 1000 students in nearly 30 primary schools in Hungary, we contribute to the experimental research on adolescent dishonest behavior in several ways. First, we employed larger sample sizes than most previous research, which helps mitigate the risk of small-sample bias. Second, unlike prior studies that examined various student-level correlates of dishonest behavior in different samples, we investigated most of the previously analyzed student-level background characteristics within the same sample, testing their joint association with adolescents’ dishonest behavior. Third, we conducted two surveys spaced approximately seven months apart, allowing us to confirm the robustness of our findings through repeated measurements. Fourth, we assessed primary school students’ dishonest behavior by modifying a frequently used incentivized die-under-the-cup task. This modification allowed us to detect whether individual students had cheated while preserving their integrity. Finally, unlike most prior research on adolescents’ dishonest behavior, we adhered to our detailed pre-registration plan, which we submitted before receiving the endline data. This plan specified the coding of variables and the empirical model in advance, thereby preventing post hoc reasoning and the formation of hypotheses after the results were known (HARKing).
We find no consistent correlation between adolescents’ background characteristics and their dishonest behavior. Furthermore, by exploiting the panel nature of our data, we reveal that a surprisingly small share of students are persistent cheaters (those who cheated in both data waves).
Our null results are informative. First, the absence of significant findings in our study does not result from a small sample size. It indicates a lack of meaningful association since most measured associations are substantively small, and the estimated standard errors are tight to zero. Second, the finding of non-persistent cheating among adolescents indicates that dishonest behavior might be more of a spontaneous reaction rather than a planned and, thus, predictable and conscious decision.
Our results have implications for policy. Since adolescents’ dishonest behavior is more spontaneous than predictable, prevention efforts should not target specific demographic or social groups but rather address weaknesses in systems that might trigger impulsive rule-breaking behavior.
Literature Review
We focus on the literature that uses experimental measures of dishonest behavior in (early) adolescent students (Alan et al., 2019; Bucciol & Piovesan, 2011; Cadsby et al., 2019; Cohn & Maréchal, 2018; Glätzle-Rützler & Lergetporer, 2015; Kanngiesser et al. 2024; Kanngiesser et al., 2021; Maggian & Villeval, 2016; Maggioni & Rossignoli, 2020; Markiewicz & Gawryluk, 2020; Sai et al., 2022). 7 Since this is a relatively focused literature, we used the snowball search method to identify the relevant articles.
The Experimental Literature on (Early) Adolescents’ Dishonest Behavior.
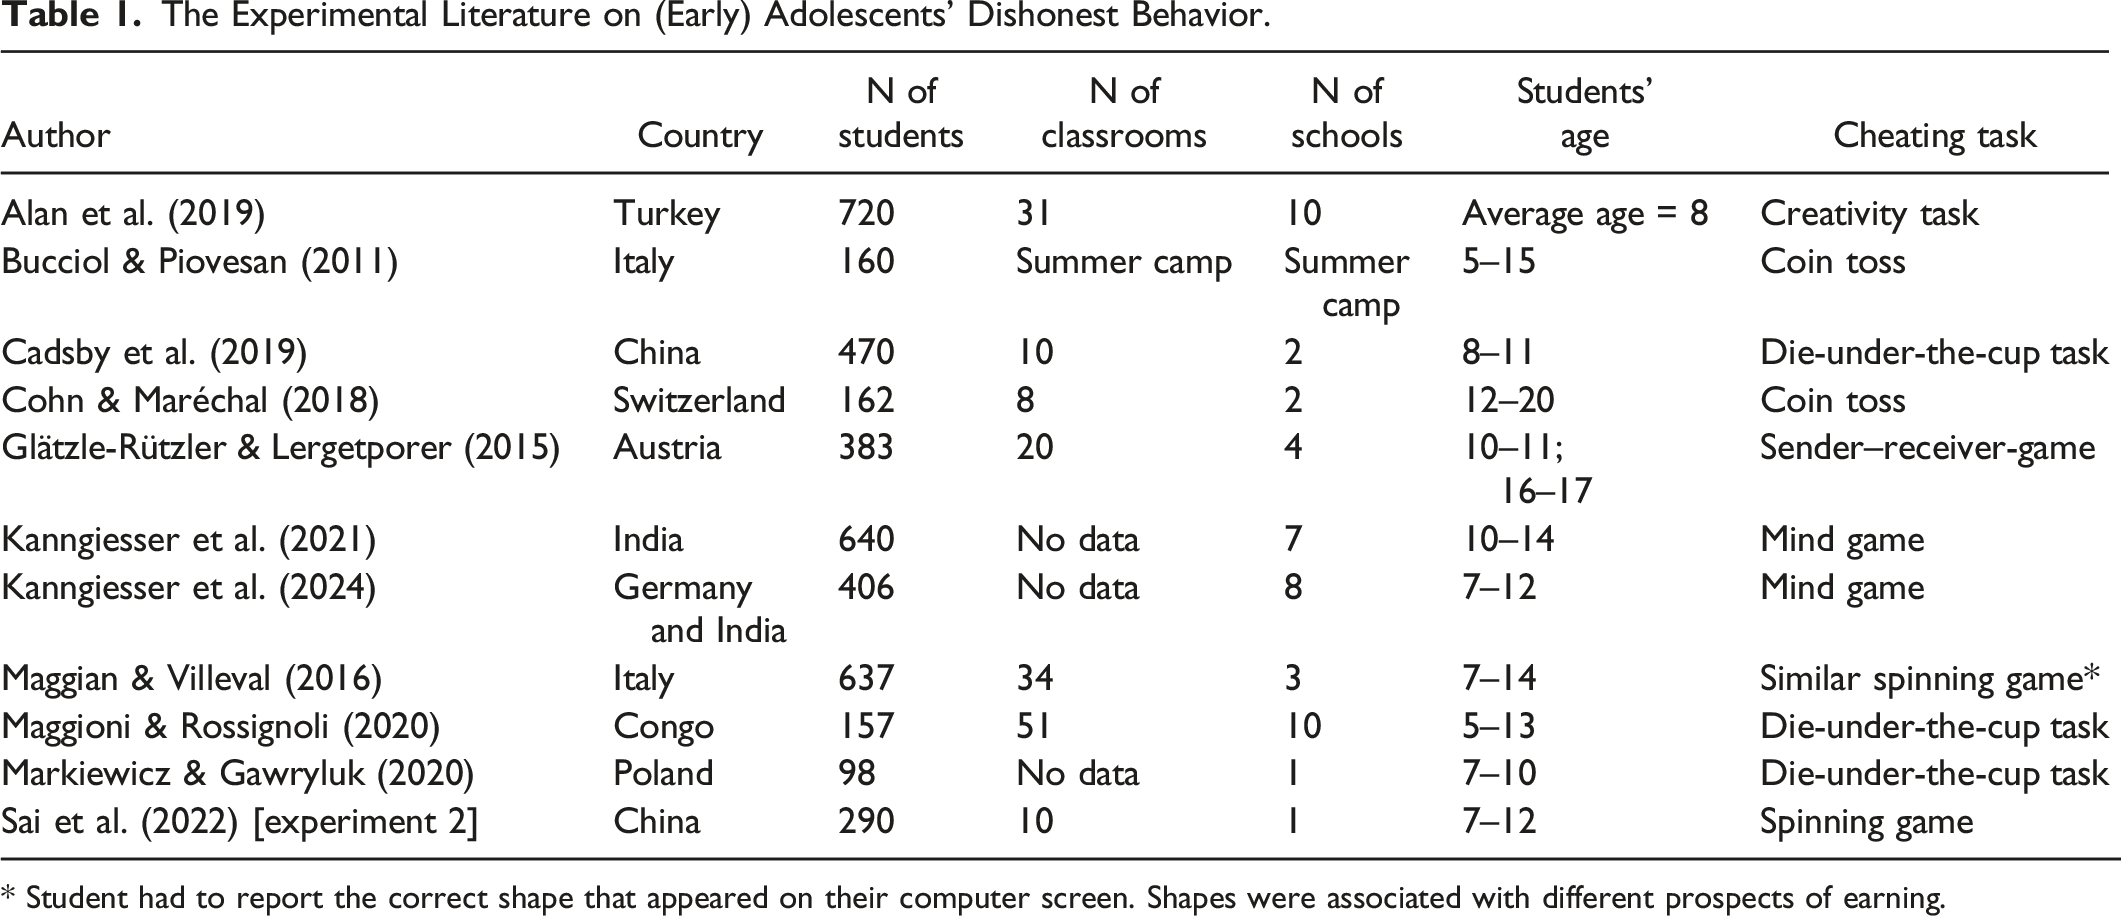
* Student had to report the correct shape that appeared on their computer screen. Shapes were associated with different prospects of earning.
The rest of the literature review is focused on the association between cheating and students’ background characteristics and is structured according to the mechanisms that might establish the particular association.
Social Status
It is often argued that self-focused social cognition might be behind the positive association between social status and dishonest behavior (Kraus et al., 2009; Kraus & Keltner, 2009). Due to higher status, people have more freedom and independence and experience fewer structural constraints, leading, on the one hand, to less respect for and recognition of others, less concern about others’ evaluations, and less acknowledgment that their own actions can affect others (Fiske, 1993). On the other hand, status-related privileges fuel feelings of entitlement and a more positive interpretation of self-interest and greed (Gino & Pierce, 2009; Wang et al., 2011). These feelings and cognitions can make people more inclined to engage in dishonest behavior. Supporting this argument, higher-status people have been found to break rules more frequently while driving, and experimentally induced (primed) higher social status increased the likelihood of taking goods from others (Piff et al., 2012).
Nevertheless, among adolescent students, the results are mixed concerning the link between social status and dishonest behavior. Supporting the previous argument about the positive relationship between social class and dishonest behavior, high-income 9 Turkish elementary school students in Istanbul were reported to cheat more than low-income students (Alan et al., 2019). By contrast, Kanngiesser et al. (2021) found a negative relationship between mothers’ educational background (another measure of social status) and dishonest behavior, as Indian students whose mothers had a university degree cheated less. Again differently, there is also literature that finds no relationship. For example, in a Swiss study, parental education was not associated with the dishonest misreporting of coin tosses (Cohn & Maréchal, 2018). Similarly, in the data gathered by Cadsby et al. (2019), mothers’ education did not correlate with students’ misreporting of the rolled number in a die-under-the-cup task.
Given the diversity of these results, future research should aim to disentangle the mechanisms that might elucidate why social status may be linked differently to dishonest behavior. This entails incorporating new measures for social status to capture these varied mechanisms empirically.
Cognitive Ability, Test Scores, and Grade Point Average (GPA)
Due to maturation, cognitive ability, test scores, and GPA 10 are argued to be positively associated with dishonest behavior. Specifically, dishonest behavior requires the mental capacity to generate and process information, and cognitive abilities must be developed to imagine and handle fictitious realities. In particular, lying (a specific form of dishonest behavior) requires the mental ability to maintain consistent and convincing stories. In line with these arguments, the psychological literature suggests that as children get older, they gradually develop the ability to avoid telling the truth (Talwar & Lee, 2002, 2008).
A further mechanism that may establish a positive relationship between dishonest behavior and cognitive ability/GPA is the desire to maintain a positive reputation of being smart (Zhao et al., 2018). Cheating means knowing how to exploit the weaknesses of a system and, as such, indicates high cognitive abilities, so people might cheat to maintain their reputation of being smart. For example, Zhao et al. (2018) found that 3-5-year-old preschool children in China cheated more by dishonestly misreporting that they had not peeked at the correct answer if they were primed before with a sentence claiming that they had a reputation for being smart, as opposed to students in either of the two (irrelevant or no reputation) control conditions.
Among adolescent students, Alan et al. (2019) found a positive relationship between cheating and IQ (Raven score), which supports the idea of a positive correlation. Furthermore, Maggioni and Rossignoli (2020) found among primary school students in Congo a positive association between students’ school performance (grades in mathematics and average GPA, respectively) and dishonest behavior measured with the die-under-the-cup task and dictator game. 11
In contrast, neither Cohn and Maréchal (2018) found a significant relationship between students’ cheating and their crystallized/fluid intelligence, nor did Cadsby et al. (2019) establish a statistically significant correlation between scores on the Raven’s Progressive Matrices test (a nonverbal test of cognitive intelligence) and students’ dishonest behavior.
Disruptive School Behavior and Patience
Disruptive school behavior and patience are linked to dishonest behavior via self-control. People with low self-control may struggle to regulate their behavior, which could manifest as disruptive behavior in the classroom and a tendency to be dishonest. The reason is that self-control is required to withhold impulsive behavior that is regretted later (Hofmann et al., 2012). This suggests that disruptive behavior is linked to more dishonesty, while patience is linked to less dishonesty.
Consistent with this reasoning, psychological research has found that persistent lying is positively associated with several disruptive behaviors (Gervais et al., 2000). Similarly, in the experimental literature in economics, Cohn and Maréchal (2018) found a positive relationship between cheating (misreporting coin tosses) and students’ misconduct in school, as measured by teachers’ reports on students’ disruptiveness, homework non-completion, and absenteeism.
As patience requires self-control, the assumed association between patience and dishonest behavior is negative. However, Alan et al. (2019) failed to find a statistically significant negative association between cheating and being patient, as measured by an incentivized allocation task. 12
Age
The association between age and dishonest behavior is controversial from a theoretical point of view. On the one hand, aging means maturation, thus, an increase in cognitive ability, which would predict that older students cheat more (Talwar & Lee, 2002, 2008). On the other hand, aging leads to increased self-control, suggesting older students should cheat less (Bucciol & Piovesan, 2011).
The empirical results concerning the relationship between age and dishonest behavior are far from clear. Glätzle-Rützler and Lergetporer (2015) specifically analyzed how age is associated with dishonest behavior measured in a sender-receiver game. Their findings showed that the negative correlation between age and dishonest behavior is context-specific and not universal. For example, they found a strong negative age effect if they examined all types of lies together. However, when analyzing different lies separately, the age effect was only visible in relation to a particular version of Pareto lying, when dishonesty was mutually beneficial for the person who committed dishonesty and others. In line with Glätzle-Rützler and Lergetporer (2015), Kanngiesser et al. (2024, 2021) and Sai et al. (2022) reported a negative association between age and dishonest behavior.
In contrast, Bucciol and Piovesan (2011) found that the probability of cheating is uniform across age groups. Their result suggests that countervailing forces such as maturation and an increase in self-control might cancel each other out, resulting in no correlation between age and dishonest behavior. Similarly to Bucciol and Piovesan (2011), Maggian and Villeval (2016), and Cohn and Maréchal (2018) found no statistically significant association between students’ cheating behavior and age.
Altruism
Prior research argues for a negative connection between altruism and cheating. These articles posit that cheating decreases if someone is altruistic (i.e., sensitive to the well-being of others instead of focused on their well-being). In contrast, if people cheat, they focus more on their own (rather than others’) well-being, which contrasts with the concept of altruism (Maggian & Villeval, 2016; O’Connor & Evans, 2019).
Empirical evidence does not fully align with the idea of this negative correlation. In a sample of preschool-aged children (aged three to eight years), O’Connor and Evans (2019) found that children who could understand others’ mental states cheated less, i.e., they were more successful in resisting the temptation to peek at a toy in the experimenter’s absence (the cheating measure).
Among adolescent students, Maggian & Villeval (2016) found a negative association between other-regarding preferences and students’ lying behavior, measured by a task in which students could misreport the observed geometric shape to secure monetary advantages. The authors measured various other-regarding preferences using a specific allocation task. 13
In contrast, Maggioni and Rossignoli (2020) and Alan et al. (2019) both found a statistically non-significant (at the 5% level) association between altruism and cheating.
Being Female
Most empirical literature finds that adult females are less engaged in dishonest behavior than adult males (Capraro, 2018; Dreber & Johannesson, 2008; Erat & Gneezy, 2012), but some studies find no gender difference (Childs, 2012). The roots of gender differences in dishonest behavior might be connected to gender differences in risk-taking (Byrnes et al., 1999), competition (Women & Made, 2009), and social preferences (Croson & Gneezy, 2009), as females take fewer risks, are less competitive, and are more likely to have other-regarding preferences than males.
Two studies in the experimental literature among adolescent students support the claim that girls respondents cheat less than boys (Cohn & Maréchal, 2018; Markiewicz & Gawryluk, 2020). However, except for these two studies, all the other reviewed studies found no statistically significant relationship between gender and dishonest behavior.
Data and Methods
Research Ethics and Transparency
Our two consecutive studies were reviewed and approved by the institutional review board of the HUN-REN Centre for Social Sciences (Budapest, Hungary). We obtained multiple consents from school principals, teachers, and parents. Data were anonymized so researchers could not trace individual students’ dishonesty. Students’ dishonest behavior remained private: neither teachers nor parents received feedback about individual students’ dishonest behavior. The pre-registration plan, the anonymized data file, and the analytical scripts used in this study are available on the study’s OSF page: https://osf.io/jhms2/.
The Two Studies
We conducted two consecutive studies among Hungarian primary school students. The two studies followed each other with a gap of approximately seven months. The fieldwork was computer-assisted and ran on an online platform. The participating schools and classrooms were the same in both experiments. The schools were not representative of Hungarian primary schools, as they were more likely to be rural schools with below-average-performing students.
Study 1 was conducted in May 2020 14 among fourth-to-eighth-grade students in 126 classrooms across 28 schools. Due to the COVID-19 pandemic and the transition to online education, students completed the 20-minute survey online at home without supervision. This led to self-selected participation, resulting in an approximate response rate of 60%, considering all students in the classrooms (N of participating students = 1142 students).
Study 2 was conducted in December 2020 15 among fifth-to-eighth-grade students in the same schools and classrooms, involving the same students but in the subsequent academic year 16 . Of the 126 classrooms and 28 schools in Study 1, we reached 82 classrooms and 19 schools in Study 2, with 1287 students participating. The 20-minute online survey was conducted within the school under supervised circumstances. Every student with parental consent who was present on the survey day participated.
In summary, the coverage of students and classrooms may differ across Study 1 and Study 2. Study 1 includes more classrooms but fewer students than Study 2, as Study 1 is based on a self-selected sample, while Study 2 involved all students from the classrooms. A subset of the students participated in both studies (N = 567), providing us with a panel dataset with two measurements of dishonest behavior.
Student-Level Background Characteristics
Both studies measured students’ background characteristics in the same way. 1. Number of books at home was used as a proxy for social status (Heppt et al., 2022).
17
This decision was motivated by two considerations. First, adolescent student might have relatively accurate knowledge about the number of books in their homes, but they might be less informed about their parents’ education or income, given the young age of the student respondents. Second, since prior studies have provided mixed evidence on the association between social status and dishonest behavior using proxies such as parental education or income, we aimed to stimulate discussion about the potential channels through which social status might be associated with dishonest behavior, as well as the appropriate proxy measure of this.
18
We measured the number of books once, at baseline in March 2020, and z-standardized it by considering the joint student population across Study 1 and Study 2. 2. Cognitive ability was measured using a math test developed by the Hungarian Educational Authority. The test consisted of four grade-specific questions where students must apply their mathematical knowledge to solve everyday problems. The math test is computer-graded; therefore, it is not subject to grader bias. We used the percentage of the correct answers, so the variable ranges between ‘0’ and ‘1’. We measured students’ math achievement by employing different test questions in Study 1 and Study 2. 3. GPA is the average of students’ end-of-semester grades from the last semester: namely, grades in mathematics, Hungarian grammar (writing), and Hungarian literature (reading). GPA is teacher-reported, with a higher number indicating a better GPA. Since teachers are responsible for grading the students, GPA may not be free from grader bias. Students’ GPA refers to their GPA from the last semester; hence, it varies between Study 1 and Study 2. 4. Disruptive behavior is a teacher-reported measure concerning the following off-task misbehaviors: talking or laughing with classmates, sending letters, walking around, being noisy, being late, eating or chewing gum, playing or reading something, and teasing others.
19
We measured disruptive behavior once, at baseline, in March 2020. We standardized the scores of students’ disruptive behavior by computing z-scores based on the joint student population across Study 1 and Study 2. 5. Patience is measured in a hypothetical, non-incentivized choice situation in which students could choose between a wristband today or two wristbands the following day.
20
We repeatedly measured students’ patience by asking the same corresponding question both in Study 1 and Study 2.
21
6. Age is the difference between the date of the actual survey and the student’s birthday divided by 365. 7. Altruism measures students’ willingness to lend money to a classmate in a hypothetical situation (Kiss & Keller, 2022).
22
We repeatedly measured students’ altruism by asking the corresponding question in Study 1 and Study 2. 8. We coded female students ‘1’ and male students ‘0’ to measure students’ gender.
Descriptive Statistics of the Variables in the Analysis.
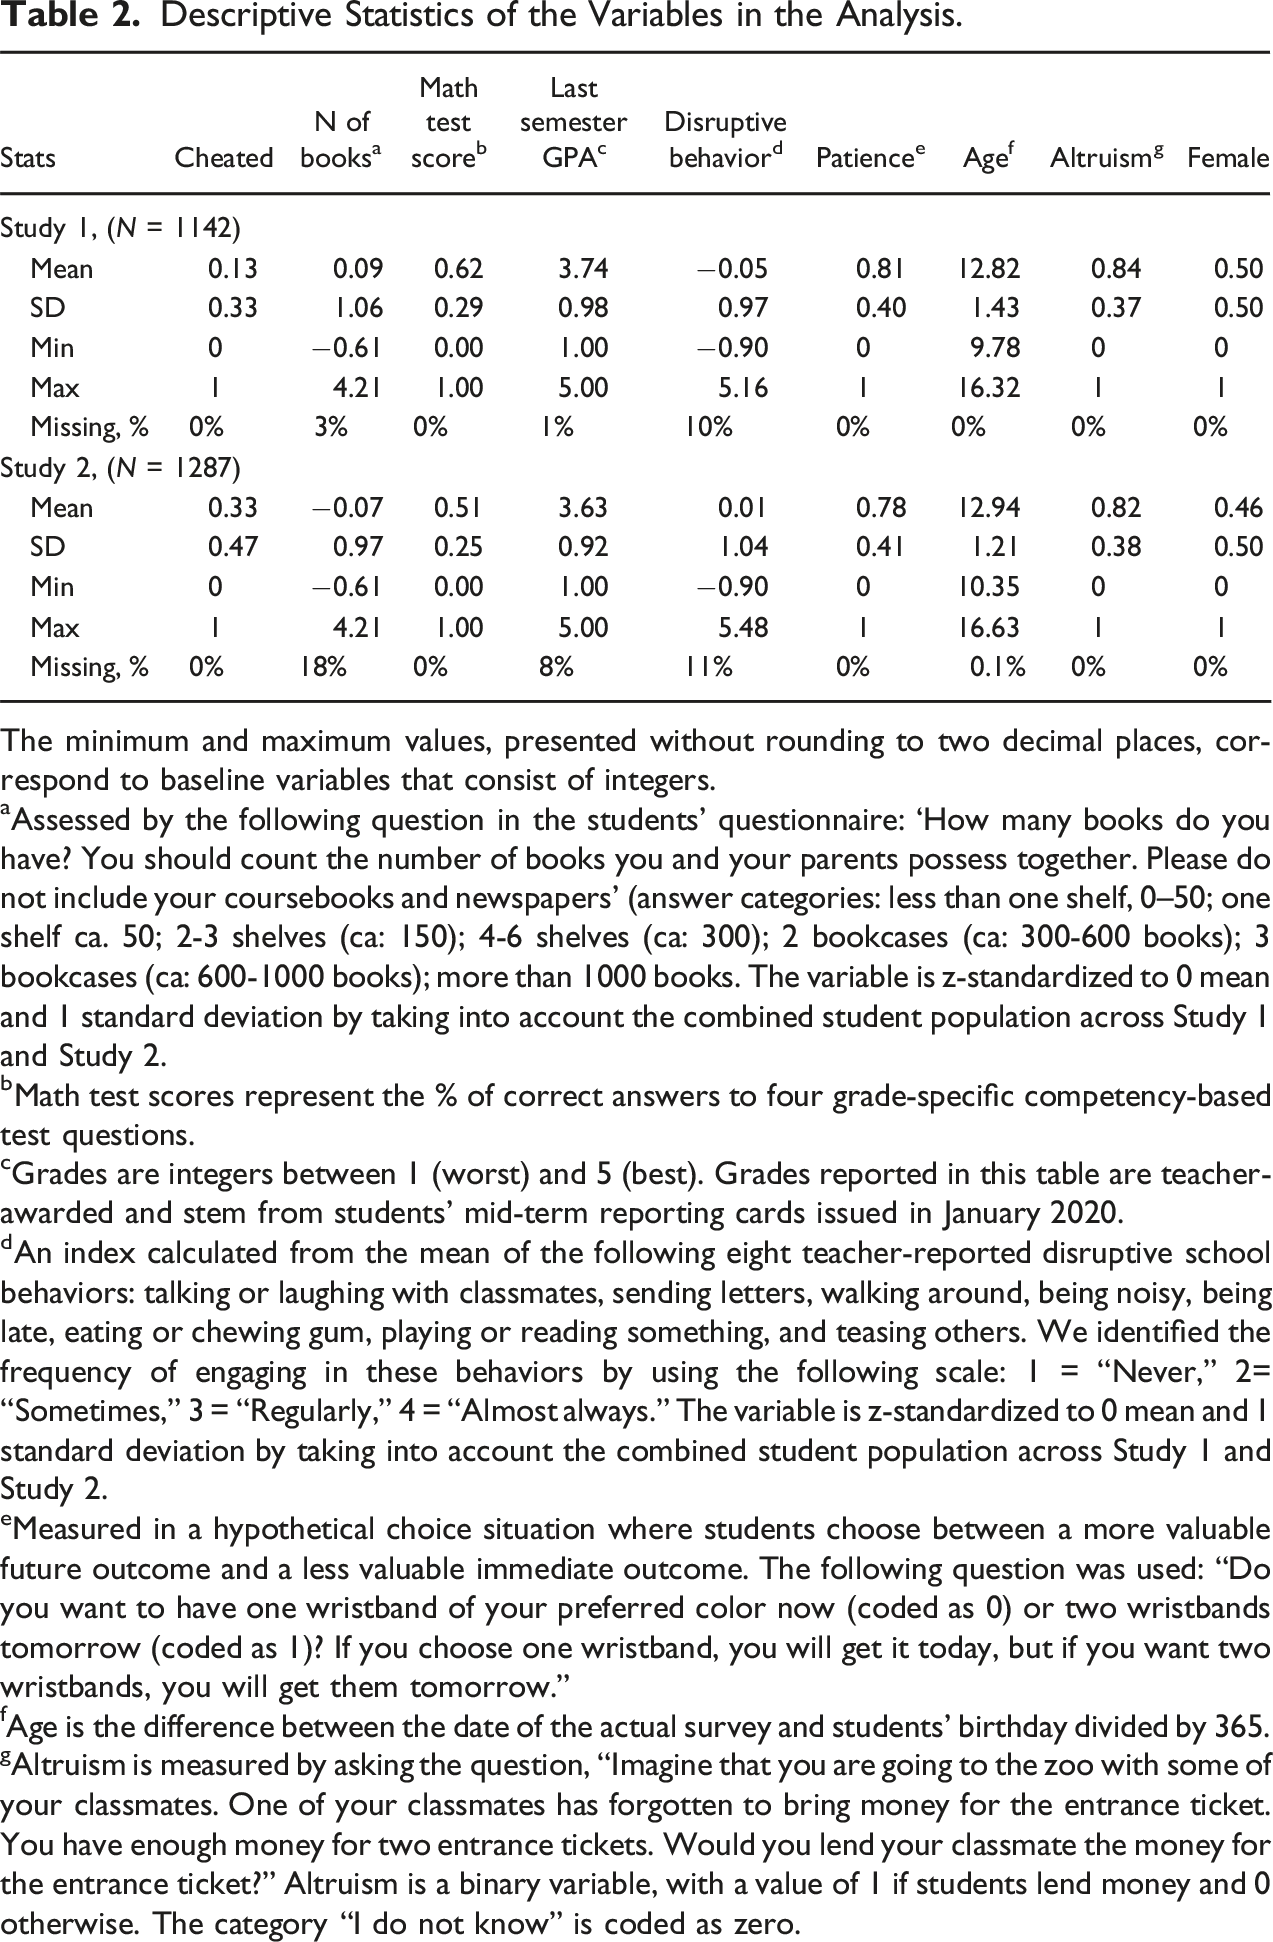
The minimum and maximum values, presented without rounding to two decimal places, correspond to baseline variables that consist of integers.
aAssessed by the following question in the students’ questionnaire: ‘How many books do you have? You should count the number of books you and your parents possess together. Please do not include your coursebooks and newspapers’ (answer categories: less than one shelf, 0–50; one shelf ca. 50; 2-3 shelves (ca: 150); 4-6 shelves (ca: 300); 2 bookcases (ca: 300-600 books); 3 bookcases (ca: 600-1000 books); more than 1000 books. The variable is z-standardized to 0 mean and 1 standard deviation by taking into account the combined student population across Study 1 and Study 2.
bMath test scores represent the % of correct answers to four grade-specific competency-based test questions.
cGrades are integers between 1 (worst) and 5 (best). Grades reported in this table are teacher-awarded and stem from students’ mid-term reporting cards issued in January 2020.
dAn index calculated from the mean of the following eight teacher-reported disruptive school behaviors: talking or laughing with classmates, sending letters, walking around, being noisy, being late, eating or chewing gum, playing or reading something, and teasing others. We identified the frequency of engaging in these behaviors by using the following scale: 1 = “Never,” 2= “Sometimes,” 3 = “Regularly,” 4 = “Almost always.” The variable is z-standardized to 0 mean and 1 standard deviation by taking into account the combined student population across Study 1 and Study 2.
eMeasured in a hypothetical choice situation where students choose between a more valuable future outcome and a less valuable immediate outcome. The following question was used: “Do you want to have one wristband of your preferred color now (coded as 0) or two wristbands tomorrow (coded as 1)? If you choose one wristband, you will get it today, but if you want two wristbands, you will get them tomorrow.”
fAge is the difference between the date of the actual survey and students’ birthday divided by 365.
gAltruism is measured by asking the question, “Imagine that you are going to the zoo with some of your classmates. One of your classmates has forgotten to bring money for the entrance ticket. You have enough money for two entrance tickets. Would you lend your classmate the money for the entrance ticket?” Altruism is a binary variable, with a value of 1 if students lend money and 0 otherwise. The category “I do not know” is coded as zero.
On average, students are 0.57 years older (SD = 0.05) in Study 2 than in Study 1, corresponding to the circa seven months that elapsed between the two studies.
The correlation between the baseline variables is low, as shown in Figures A1 and A2. Most pairwise correlation coefficients are below 0.1. Thus, multicollinearity between the covariates does not undermine the estimation.
The Measurement of Dishonest Behavior: Cheating
We measured dishonesty by employing a modified version of the die-under-the-cup task (Fischbacher & Föllmi-Heusi, 2013).
In the original version of the task, participants conducted a private roll of a six-sided fair die, keeping the result hidden. They were then promised a financial reward based on the outcome they reported: larger numbers meant larger payouts. 23 Consequently, misreporting the actual rolled outcome was financially advantageous for the participant. Thus, the initial die-under-the-cup task allowed the researchers to gain insight into the overall level of dishonesty among participants by comparing the average reported outcome to the expected outcome of 3.5 in a fair die roll. However, it did not facilitate the examination of individual levels of dishonesty.
Therefore, in Study 1, we assessed students’ dishonest behavior using a method designed to identify whether individual students had engaged in cheating while maintaining their integrity (Keller & Kiss, 2021). The procedure unfolded in several steps: 1. Students were tasked with ranking six objects of varying monetary value (pencil box, pouch, mug, pen, keyring, badge) based on their personal preferences, assigning the rank 1 to their most desired object. 2. Students were then informed that they would receive one of the ranked objects based on the number they reported to have rolled. 3. Next, students rolled a virtual die and observed the number they had rolled. 4. We again presented students with their subjective preference list and showed how each object on their list corresponded to a specific number ranging from 1 to 6. Specifically, we explained that 1 represented their most desired object, 2 represented their second-most desired object, and so on, up to 6, which represented their least desired object. 5. Subsequently, students were asked to input the number they had rolled. The instructions emphasized that the object they would receive depended on the reported number, granting them the freedom to report any number between 1 and 6. This created a situation where students could potentially report a number different from the one they had actually rolled.
This setup tempted students to report a number different from the one they had rolled to obtain more desired objects. With the computer-assisted online survey platform storing both the rolled and reported numbers, we could detect students’ dishonest behavior. Among the 1142 students, 144 were found to have misreported the rolled number, resulting in a cheating rate of 12.61%.
In Study 2, we used a different task to measure students’ dishonest behavior, as some students might have already been familiar with the task used in Study 1. Students were asked in the computer-assisted online survey platform to roll a virtual die in private and report the number rolled. Students were informed that they would receive a bookmark if they rolled the numbers 1, 2, 3, 4, or 5 and a mug if they rolled 6. The monetary value of the mug was clearly higher than that of the bookmark, making it more desirable to students. However, the students were unaware that the survey platform was programmed to use a five-sided virtual die that would never produce a 6. This information was intentionally concealed from the students. Therefore, reporting a 6 was a clear indication of cheating. As we had used deception when prompting students with deliberately opaque information, we debriefed them at the end of the survey and gave each one a mug instead of the bookmark. Of the 1287 students, 419 (32.56%) were found to have cheated. 24
Considering students who participated in both waves, cheating in Study 1 is not associated with cheating in Study 2, as revealed by a corresponding bivariate regression analysis not reported here (coef. = 0.06, p = 0.34). Therefore, students’ prior dishonest behavior is not associated with their later cheating behavior. Further evidence for this is that only 25 students cheated in both studies. 25
Empirical Model
We use the following classroom fixed-effect linear probability model to analyze the correlation between adolescents’ background characteristics and their dishonest behavior
We estimate equation (1) first for each background characteristic separately and then by incorporating all background characteristics jointly. In the latter approach, we replaced missing values in the specific background characteristics with zeros and included a dummy variable in the estimation to account for the missing status in that variable to retain all available cases and avoid data loss.
Findings
Figure 1 presents dyadic standardized associations between each student-level background characteristic and dishonest behavior expressed in the standard deviation units of the cheating variable. The corresponding full regression results can be found in Appendix Tables A1 and A2 for Study 1 and Study 2, respectively. The results have three key aspects.
Dyadic Association Between Each Student-Level Background Characteristic and Dishonest Behavior: Coefficient Plot Showing Standardized Point Estimates with 95% Confidence Intervals
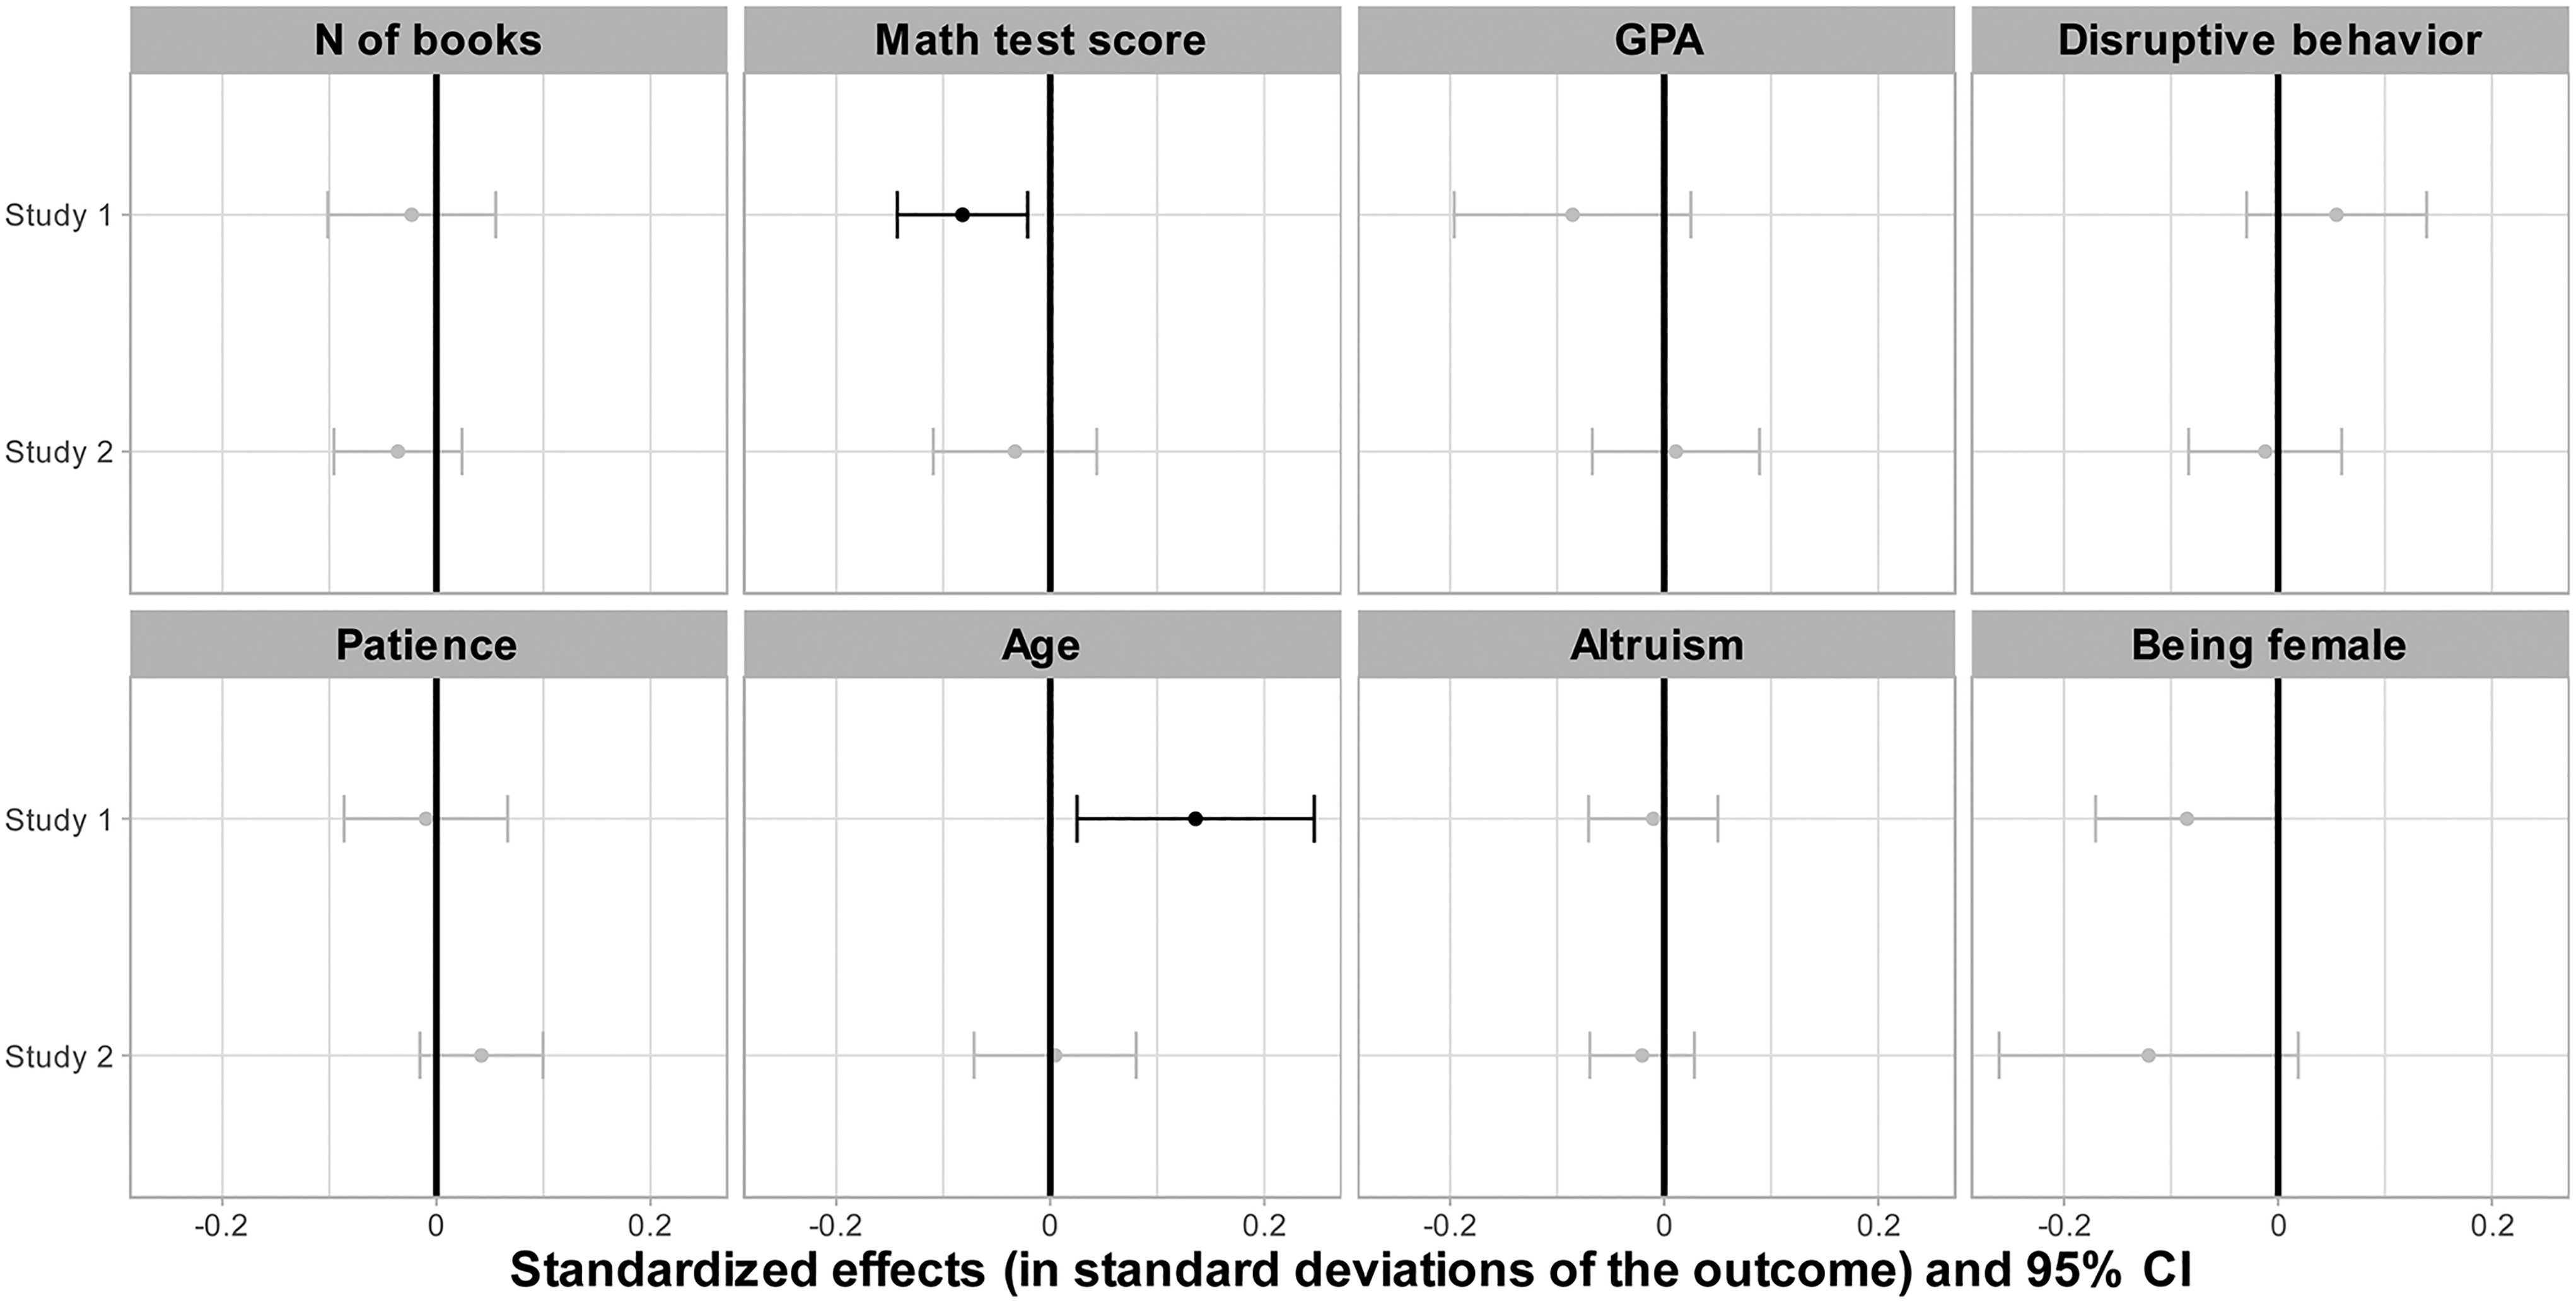
First, most estimates are small and statistically insignificant. Visual inspection of Figure 1 shows that in both studies, in the case of five out of the eight observed background characteristics (N of books, Math test score, Disruptive behavior, Patience, Altruism), the point estimates and their standard errors are tightly centered around zero, suggesting a lack of association between these characteristics and dishonest behavior.
Second, the statistically significant associations found in Study 1 are ad-hoc and do not exhibit a consistent pattern across the two waves. For instance, Study 1 shows a statistically significant negative association between math test scores and dishonest behavior, representing 8% of the cheating variable’s standard deviation. However, in Study 2, an insignificant association is found, representing only 3% of the cheating variable’s standard deviation, which is less than half of the association found in Study 1. Additionally, in Study 1, a positive and statistically significant dyadic association is found between students’ age and dishonest behavior, which is 14% of the cheating variable’s standard deviation. However, this association becomes negligible (less than 1%) in Study 2.
Third, some statistically significant associations do not align with the theory and thus require cautious interpretation. For example, in Study 1, a negative association between math test scores and dishonest behavior is observed, which contradicts the theoretical considerations and some prior empirical findings.
Figure 2 displays the multivariate standardized associations between student-level background characteristics and dishonest behavior derived from models that incorporate all background characteristics jointly (the final models in Tables A1 and A2). The figure places the results of Study 1 and Study 2 in the context of prior literature.
Multivariate Association Between Adolescents’ Background Characteristics and Dishonest Behavior in Prior Literature, Study 1 and Study 2: Coefficient Plot Showing Standardized Point Estimates with 95% Confidence Intervals
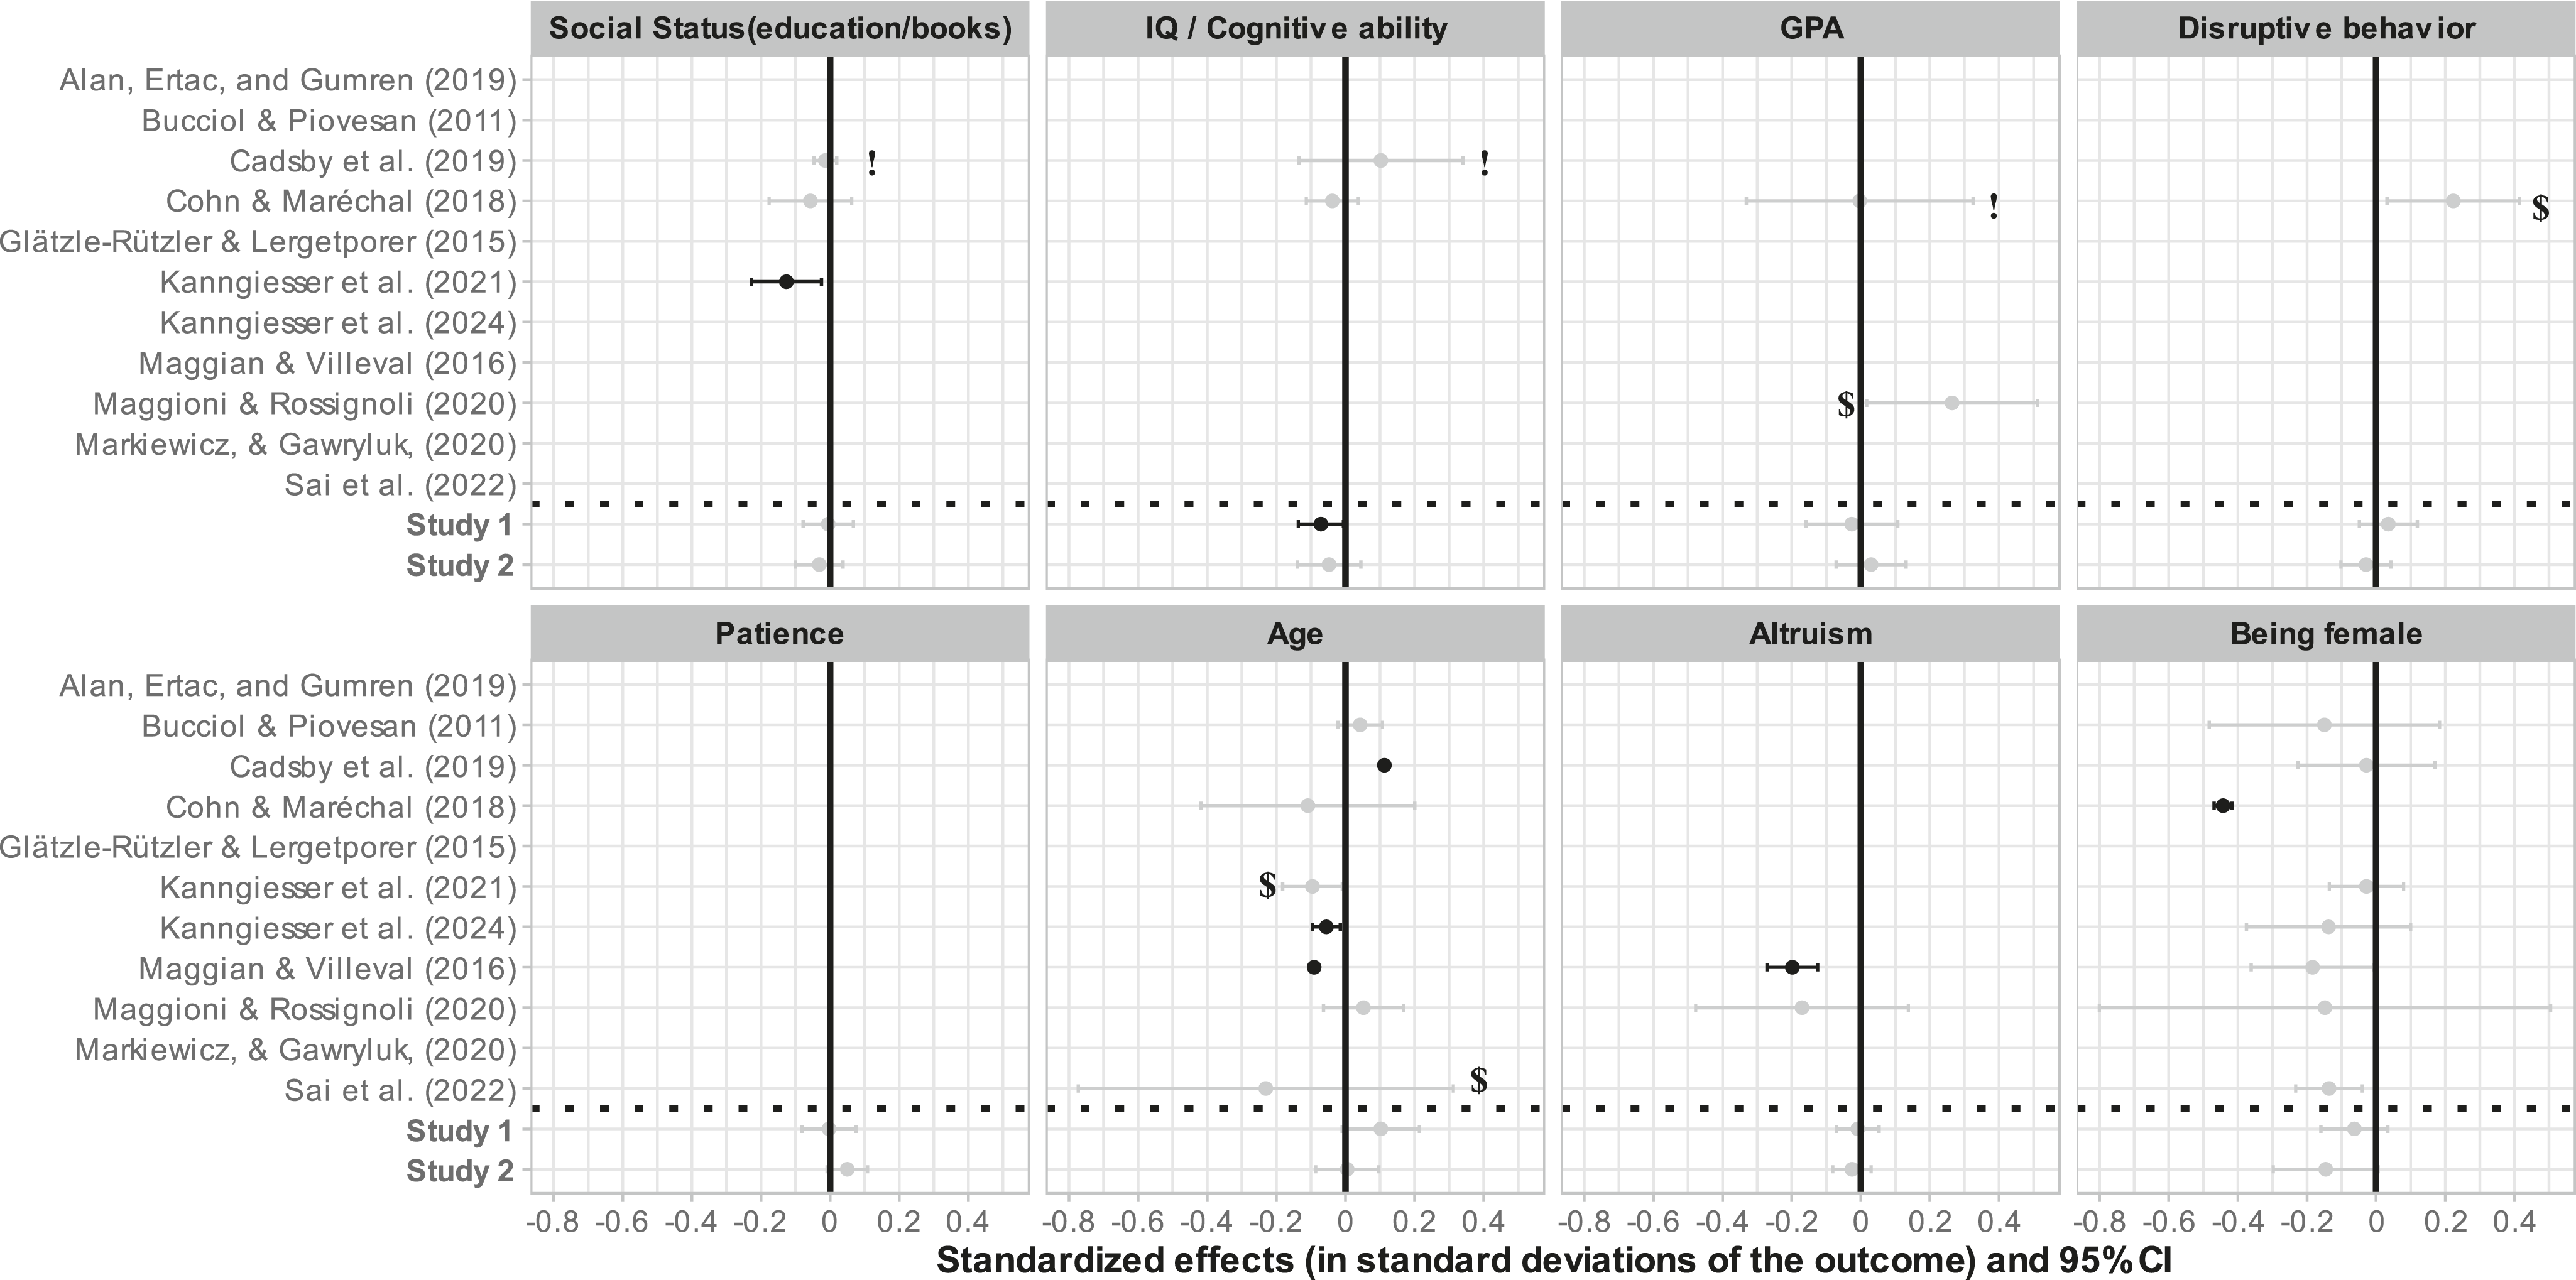
To ensure comparability across the studies, all presented coefficients originate from the same statistical model, identical to the one used in our analysis (OLS/linear probability models with classroom fixed-effects and standard errors clustered at the school level). This means that the plotted coefficients concerning the reviewed literature might differ from those published in the original papers, as the results of earlier scholarship were recalculated using data provided by the authors.
Two main conclusions can be drawn from Figure 2. First, comparing the dyadic and multivariate associations between Study 1 and Study 2 reveals that some dyadic correlations (e.g., age in Study 1) do not remain statistically significant in the multivariate results. This suggests that future research should incorporate a wide range of control variables to reveal the net associations between students’ background variables and their dishonest behavior.
Second, when comparing the results of Study 1 and Study 2 to those of prior literature, it becomes evident that our results represent precisely measured zero associations (with tight standard errors), while some results in prior literature were imprecisely measured (with expansive standard errors). For future research, this underscores the importance of using reasonably large sample sizes to precisely measure associations between students’ background variables and their dishonest behavior.
The null results remain robust across various specifications. For instance, we defined subsamples based on students’ participation in the two studies and assessed the robustness of the correlation between adolescents’ background characteristics and their dishonest behavior among those students who participated in both Study 1 and Study 2 (Table A3); those students who participated only in Study 1 but not in Study 2 (Table A4); and among those who participated only in Study 2 but not in Study 1 (Table A4). The results are qualitatively similar to those presented in the main analysis, indicating the absence of a correlation between dishonest behavior and students’ background characteristics. Furthermore, robustness checks using split samples by gender and analyzing the correlations separately for female (Table A5) and male (Table A6) students further reinforce the null result.
As an aside, we note that in Study 1, where students completed the survey at home rather than in their classroom, the adjusted R-squared statistic indicates that classroom fixed-effects explain only 3% of the variation in adolescents’ dishonest behavior. However, in Study 2, the same statistic shows that classroom fixed-effects explain 23% of the variation in adolescents’ dishonest behavior. The difference in adjusted R-squared statistics between the two studies suggests that unobserved group norms may play a role in explaining adolescents’ dishonest behavior.
Analyzing the small panel sample reinforces our finding that adolescents’ background characteristics have limited explanatory power in relation to their dishonest behavior. In the panel sample, the same students participated in both studies (N = 567). However, only a small fraction of students (4%) cheated in both studies, while the majority (61%) did not cheat in either of the studies. The remaining 35% of students cheated in only one study, but their behavior was not consistent, indicating that they were not acute cheaters. Therefore, adolescents’ dishonest behavior may be impulsive or situational rather than persistent.
Discussion and Conclusion
This paper contributes to the experimental literature on the relationship between adolescents’ background characteristics and cheating behavior by conducting a comprehensive literature review and two consecutive surveys on adolescents’ dishonest behavior. The survey sample comprised Hungarian primary school students aged 10–14. We measured students’ dishonest behavior using incentivized cheating tasks that rely on dishonest misreporting. 26 We found that the adolescents’ background characteristics are little correlated with their dishonest behavior. This result supports our interpretation of the literature, which suggests that adolescents’ dishonest behavior is weakly and inconsistently associated with their background characteristics.
Our results have implications for institutional policy aimed at mitigating adolescents’ dishonest behavior. Specifically, the findings presented here suggest that there is no particular social or demographic group of students that are more likely to cheat. Therefore, it may not be worthwhile designing interventions tailored to specific demographic groups of students. Furthermore, since we cannot predict who cheats, prevention efforts should focus on reducing the tempting situations that trigger adolescents’ impulses to cheat.
Our results have implications for future empirical research in two respects. First, group-level background characteristics might influence students’ dishonest behavior more than individual-level background characteristics. For instance, in our study, when students filled in the survey at home, their classroom belonging (the classroom fixed-effects) did not explain their dishonest behavior. However, for students who had filled in the survey at school, their classroom belonging explained a sizable proportion of their dishonest behavior. 27 This finding echoes the results of prior scholarship, which highlight that organizational culture shapes dishonest behavior (Gentina et al., 2017; Kish-Gephart et al., 2010). It also suggests that future research should investigate how specific group norms can influence individual students’ dishonest behavior.
Second, it is also plausible that adolescents’ background characteristics relate to their dishonest behavior, but the measurements the prior scholarship and we deployed are insufficient. Hence, future research should explore alternative measurement approaches for those background characteristics commonly used in the literature to better uncover their association with adolescents’ dishonest behavior.
We conclude that the weak associations found between adolescents’ background characteristics and their dishonest behavior align with the inconsistent findings of prior research. We recommend shifting the focus from social background characteristics to situational circumstances. Therefore, instead of identifying who cheats based on social background characteristics, upcoming research should focus on understanding under which situational factors individuals are likely to cheat.
Supplemental Material
Supplemental Material - Who Cheats? Adolescents’ Background Characteristics and Dishonest Behavior: A Comprehensive Literature Review and Insights From Two Consecutive Surveys
Supplemental Material for Who Cheats? Adolescents’ Background Characteristics and Dishonest Behavior: A Comprehensive Literature Review and Insights From Two Consecutive Surveys by Tamás Keller, Hubert János Kiss in The Journal of Early Adolescence
Footnotes
Acknowledgments
The authors extend their sincere gratitude to Alessandro Bucciol, Gail D. Heyman, Patricia Kanngiesser, Valeria Maggian, Mario A. Maggioni, Liyang Sai, and Fei Song for providing their data and agreeing to re-estimate their published results. Without their help, the comprehensive comparison of prior scholarship presented in Figure 2 would not have been possible.
Declaration of Conflicting Interests
The author(s) declared no potential conflicts of interest with respect to the research, authorship, and/or publication of this article.
Funding
The author(s) disclosed receipt of the following financial support for the research, authorship, and/or publication of this article: Tamás Keller gratefully acknowledges the funding received from the Hungarian National Research, Development and Innovation Office (NKFIH) under Grant numbers K-135766 and K-135195. Additional support was provided by the János Bolyai Research Scholarship of the Hungarian Academy of Sciences (BO/00569/21/9), as well as the New National Excellence Program of the Ministry for Culture and Innovation, sourced from the National Research, Development and Innovation Fund (Grant Number: ÚNKP-23-5-CORVINUS-149), Hubert J. Kiss acknowledges the financial support by the Hungarian Academy of Sciences, Momentum Grant No. LP2021-2.
Ethical Statement
Notes
Author Biographies
References
Supplementary Material
Please find the following supplemental material available below.
For Open Access articles published under a Creative Commons License, all supplemental material carries the same license as the article it is associated with.
For non-Open Access articles published, all supplemental material carries a non-exclusive license, and permission requests for re-use of supplemental material or any part of supplemental material shall be sent directly to the copyright owner as specified in the copyright notice associated with the article.