
Abstract
The objective of this study was to investigate the demographic distribution of selected health-related behaviors and their relationship with different indicators of well-being. The data come from Wave 1 of the youth panel of Understanding Society household panel study. The Strengths and Difficulties Questionnaire (SDQ) measured socio-emotional difficulties. Markers of happiness in different life domains were combined to assess levels of happiness. Generally, younger youth participated in more health-protective behaviors, while older youth reported more health-risk behaviors. Higher consumption of fruit and vegetables and greater participation in sport were associated with higher odds of high happiness. Healthier eating was associated with lower odds of socio-emotional difficulties, while increased fast food consumption was associated with higher odds of socio-emotional difficulties. Smoking, drinking, and decreased sport participation were all associated with socio-emotional difficulties. Health-protective behaviors were associated with happiness, while health-risk behaviors were associated with socio-emotional difficulties.
Introduction
A recent United Nations Children’s Fund (UNICEF) report ranked the United Kingdom (UK) the worst out of 21 countries across six dimensions of youth-risk behaviors and subjective well-being (UNICEF, 2007). How to accurately measure well-being and the dimensions to include in those measures are highly debated, particularly in the UK (Self, Thomas, Randall, & Office for National Statistics, 2012). Traditionally, the well-being of a country has been based on economic factors; however, these measures do not directly apply to younger populations who are not economically active. The UNICEF report provides several dimensions of well-being including (1) material well-being, (2) health and safety, (3) educational well-being, (4) family and peer relationships, (5) behaviors and risks, and (6) subjective well-being. The UK was the second worst out of 21 countries for the dimensions of behaviors and risks and subjective well-being (Self et al., 2012). Given these data, it is important to understand why the UK youth are doing poorly and what relationship, if any, there is between these two dimensions of well-being. In this paper, we focus on two measures of subjective well-being (happiness and socio-emotional difficulties) and on health-related behaviors (smoking, drinking, diet, and exercise).
Early adolescence is a time of relatively good physical health, and there are continuities in health and health-related behaviors throughout the life course. The most favorable profiles for health and health-related behaviors are seen during early adolescence, with less favorable patterns emerging as adolescence proceeds (Blum & Nelson-Mmari, 2004; Due et al., 2011; Ravens-Sieberer et al., 2009). Prior UK and international studies have documented patterns of health and health-related behaviors (Currie et al., 2008; The Health and Social Care Information Centre, 2007), and some have gone on to examine links between the different aspects of health-related behaviors and well-being in youth. For example, studies suggest that physical activity (Fulkerson, Sherwood, Perry, Neumark-Sztainer, & Story, 2004; Iannotti et al., 2009) and fruit and vegetable (Fulkerson et al., 2004) intake are positively, and smoking (Aneshensel & Huba, 1983; E. Goodman & Capitman, 2000) and sedentary behaviors (Iannotti et al., 2009; Ravens-Sieberer et al., 2009) are negatively, associated with health and well-being in youth. These studies tend to cluster one or two health-related behaviors together, that is, smoking and alcohol, sedentary behaviors, and diet and physical activity, to examine their associations with well-being we are not aware of a study that has included a wide range of health-related behaviors.
The links between multiple markers of health-related behaviors and well-being in youth are not well understood. Conflicting results over the direction of causality between health-related behaviors and well-being have contributed to the uncertainty of the links between multiple health-related behaviors and well-being (Aneshensel & Huba, 1983; Boden, Fergusson, & Horwood, 2010; Fergusson, Boden, & Horwood, 2009; E. Goodman & Capitman, 2000; Munafò, Hitsman, Rende, Metcalfe, & Niaura, 2007; Rohde, Lewinsohn, Brown, Gau, & Kahler, 2003; Steuber & Banner, 2006; Wang et al., 1999). However, many of these studies have focused on one or two health-related behaviors, and findings may differ when multiple health-related behaviors are included in one model.
The relationship between health-related behaviors and markers of well-being in youth may differ by demographic characteristics such as gender. Studies have shown gender differences in the associations between some health-related behaviors and well-being (Fulkerson et al., 2004; Munafò et al., 2007; Whitbeck, Yu, McChargue, & Crawford, 2009; Wiles et al., 2008). Health-related behaviors such as smoking and physical activity, taken up during adolescence, have been shown to track into adulthood, as have physical and mental health problems (Blum & Nelson-Mmari, 2004; Due et al., 2011; R. Viner, 2005; R. M. Viner & Barker, 2005; R. M. Viner & Cole, 2005). Thus, adolescence is a potentially prime period for interventions aimed at improving population health and well-being. However, given the UK’s low standing in youth well-being, we need to better understand the associations with youth well-being in the context of the UK.
This study adds to what is already known by examining whether a range of health-related behavioral markers are linked to well-being in a sample of the UK youth. This is done by using data from Understanding Society, the UK Household Longitudinal Study (UKHLS) Youth Panel. First, descriptions of the patterning of selected health-related behaviors such as smoking, alcohol, dietary patterns (intake of fruit and vegetables, crisps, sweets, fizzy drinks, and fast food) and sporting activities and well-being by gender and age are examined. Second, the associations between these health-related behaviors and well-being in youth are explored.
Method
Sample
Data for this study come from Understanding Society, the UKHLS. The UKHLS is a nationally representative longitudinal study, which began in 2009 with an aim of recruiting over 100,000 individuals in 40,000 households. This analysis is based on data from Wave 1 of the UKHLS. More detailed information on the sampling frame and data collection procedures are available in Burton, Laurie, and Lynn (2011). The data used in this study comes from the young people aged 10 to 15 who completed the Youth Self-completion Survey (N = 4,899 living in 3,656 households).
Measures
Youth health-related behaviors
Smoking is a dichotomous variable coded “Yes” or “No,” in response to the question “do you ever smoke cigarettes at all?”
Alcohol use was measured by the question, “How many times in the last four weeks have you had an alcoholic drink?” Response options were “Most days,” “Once or twice a week,” “2 or 3 times,” “Once only,” and “Never.” The two highest consumption categories were combined because of small cell sizes.
Fruit/vegetables consumption was measured by the question, “how many portions of fresh fruit and vegetables do you eat on a typical day?” Four response options were provided “5 or more portions,” “3-4 portions,” “1-2 portions,” and “None.” Because of the small cell sizes in the two lowest consumption categories, responses were recoded to a 3-point scale, ranging from 0-2 portions to 5 or more portions.
Crisps/ sweets/fizzy drinks was measured by one item, “how many days in a usual week do you eat crisps or sweets or have fizzy drinks such as Coke or lemonade?” Responses included, “Every day or nearly every day,” “About once a week,” “Every now and then,” and “Never or hardly ever.”
Fast food was measured by the single item, “how many days in a usual week do you eat fast food such as McDonalds, Burger King, KFC, or other take-aways like that?” Response categories were the same as for the crisps/sweets/fizzy drink question.
Sports participation was measured by the question, “how many days in a usual week do you play sports, do aerobics or do some other keep fit activity?” Response options were “Every day,” “5-6 days,” “3-4 days,” “1-2 days,” “Less often than once,” and “Never or hardly ever.” The lowest two participation categories were combined because of small cell sizes, resulting in responses recoded to range from less than once per week to every day.
Youth well-being
Happiness with life was measured by a series of six questions about how respondents felt about different aspects of their life including school work, appearance, their family, friends, school, and, finally, life as a whole. Each question had seven emoticons expressing feelings ranging from “completely happy” to “not at all happy.” The items were combined into an overall happiness scale (alpha 0.77) where higher scores indicate greater happiness (Chan & Koo, 2010).
Socio-emotional difficulties were reported using the SDQ, an instrument used to screen for behavioral problems in children aged 3 to 16 years (R. Goodman, 1997). The SDQ is made up of 25 items, each scored on a 3-point Likert-type scale that can be summed into five subscales (emotional problems, conduct problems, hyperactivity/inattention, peer relationship problems, and pro-social behavior). A total difficulties score is created by summing the first four subscales (range 0-40). Those who score in the range 20 to 40 points on the self-rated SDQ are considered to be at a risk of clinically relevant socio-emotional difficulties (R. Goodman, 2010). We use this criterion to dichotomize this measure with a high score indicating socio-emotional difficulties.
Covariates
Parental educational qualifications
The highest qualification level of the parent(s) was a 6-point categorical variable ranging from no qualifications to degree-level or higher. This question was asked of each parent who participated in the UKHLS adult interview. We use the highest qualifications attained by either parent, with degree level as the reference category.
Household income
The total net previous month household income was equivalized for household composition using the Organisation for Economic Co-operation and Development (OECD) modified equivalence scale and then recoded into quintiles for the analysis. Household income was asked of one adult household member during the UKHLS adult interview. The fifth category (highest income) was the reference group.
Age
The young person’s age in years was entered into models as a continuous variable. For descriptive purposes, age was dichotomized into 10 to 12 and 13 to 15 years.
Gender
Gender was coded as a binary variable with boys as the reference category.
Analysis
Happiness and SDQ scales had skewed distributions indicating that linear regression models of these data without transformations may not be appropriate; therefore, the scales were dichotomized. Those with scores in the top 10% of the distribution of the happiness scale were identified as being happy. We use Goodman’s criterion for clinically relevant problems (R. Goodman, 2010) to dichotomize the SDQ to measure socio-emotional difficulties.
All statistical analyses were carried out in SAS Version 9.2 (SAS Institute, 2003). Logistic regression models were estimated for happiness and socio-emotional difficulties with standard errors estimated allowing the clustering of young people within households. Prevalence of health-related behaviors was determined for gender and age group. Three versions of models predicting happiness and socio-emotional difficulties were estimated: (1) bivariate models with one health behavior at a time as the independent variable; (2) bivariate models that control for age, gender, the highest parental qualification, and household income; and (3) multivariate models that included all health-related behaviors that were significantly associated with well-being in Model 2 and all control variables. Wald tests were used to estimate the combined effect of categories of the independent variable(s) on the measure of well-being. Reference categories for markers of health-related behaviors were the responses that were most commonly endorsed.
Bivariate interactions of health-related behavior variables with gender and age were tested. All interaction models controlled for either age or gender, dependent on the interaction being tested, the highest parental qualification, and household income. Additional simple effect tests of the interactions were conducted to determine whether the relationships between predictor variables and outcomes differed by level of the moderator variable (Aiken & West, 1991). For example, if there was a significant interaction between a health-related behavior and gender, additional tests of the relationship between the health-related behavior and the measure of well-being were carried out for boys and girls separately. If there are differences in the examined relationships by gender, a differential relationship is indicated (Aiken & West, 1991).
Results
Descriptive Findings
The study sample had slightly more males (weighted percentage = 51%) than females χ2(1, N = 4,899) = 4.39, p = .04, and there was an even spread of young respondents for all ages between 10 and 15 years χ2(5, N = 4,899) = 4.59, p = .47 (data not shown). Parental education and income distributions were consistent with other general population surveys (Berthoud, 2011; Blanden & Gregg, 2004).
Youth health-related behaviors
Overall, 7% of the youth reported having smoked cigarettes and 25% reported having had an alcoholic drink in the past four weeks (Table 1). While there was no difference in drinking behavior by gender, girls were more likely to report smoking, 8%, compared with 6% for boys χ2(1, N = 4,899) = 3.99, p = .05. Less than 15% of the young people reported eating the recommended five portions of fruits or vegetables per day. Girls adopted healthier eating habits than boys, eating more fruits and vegetables χ2(2, N = 4,899) = 36.19, p < .0001 and fewer fast food meals χ2(2, N = 4,899) = 16.89, p = .0002. By contrast, boys were more likely than girls to participate in sports, with 37% of the boys participating in sports every day compared with 22% of the girls χ2(4, N = 4,899) = 189.00,p < .0001.
Youth Indicators of Well-Being, Health-Related Behaviors, and Socio-Demographic Factors by Gender Among Youth in Understanding Society. a
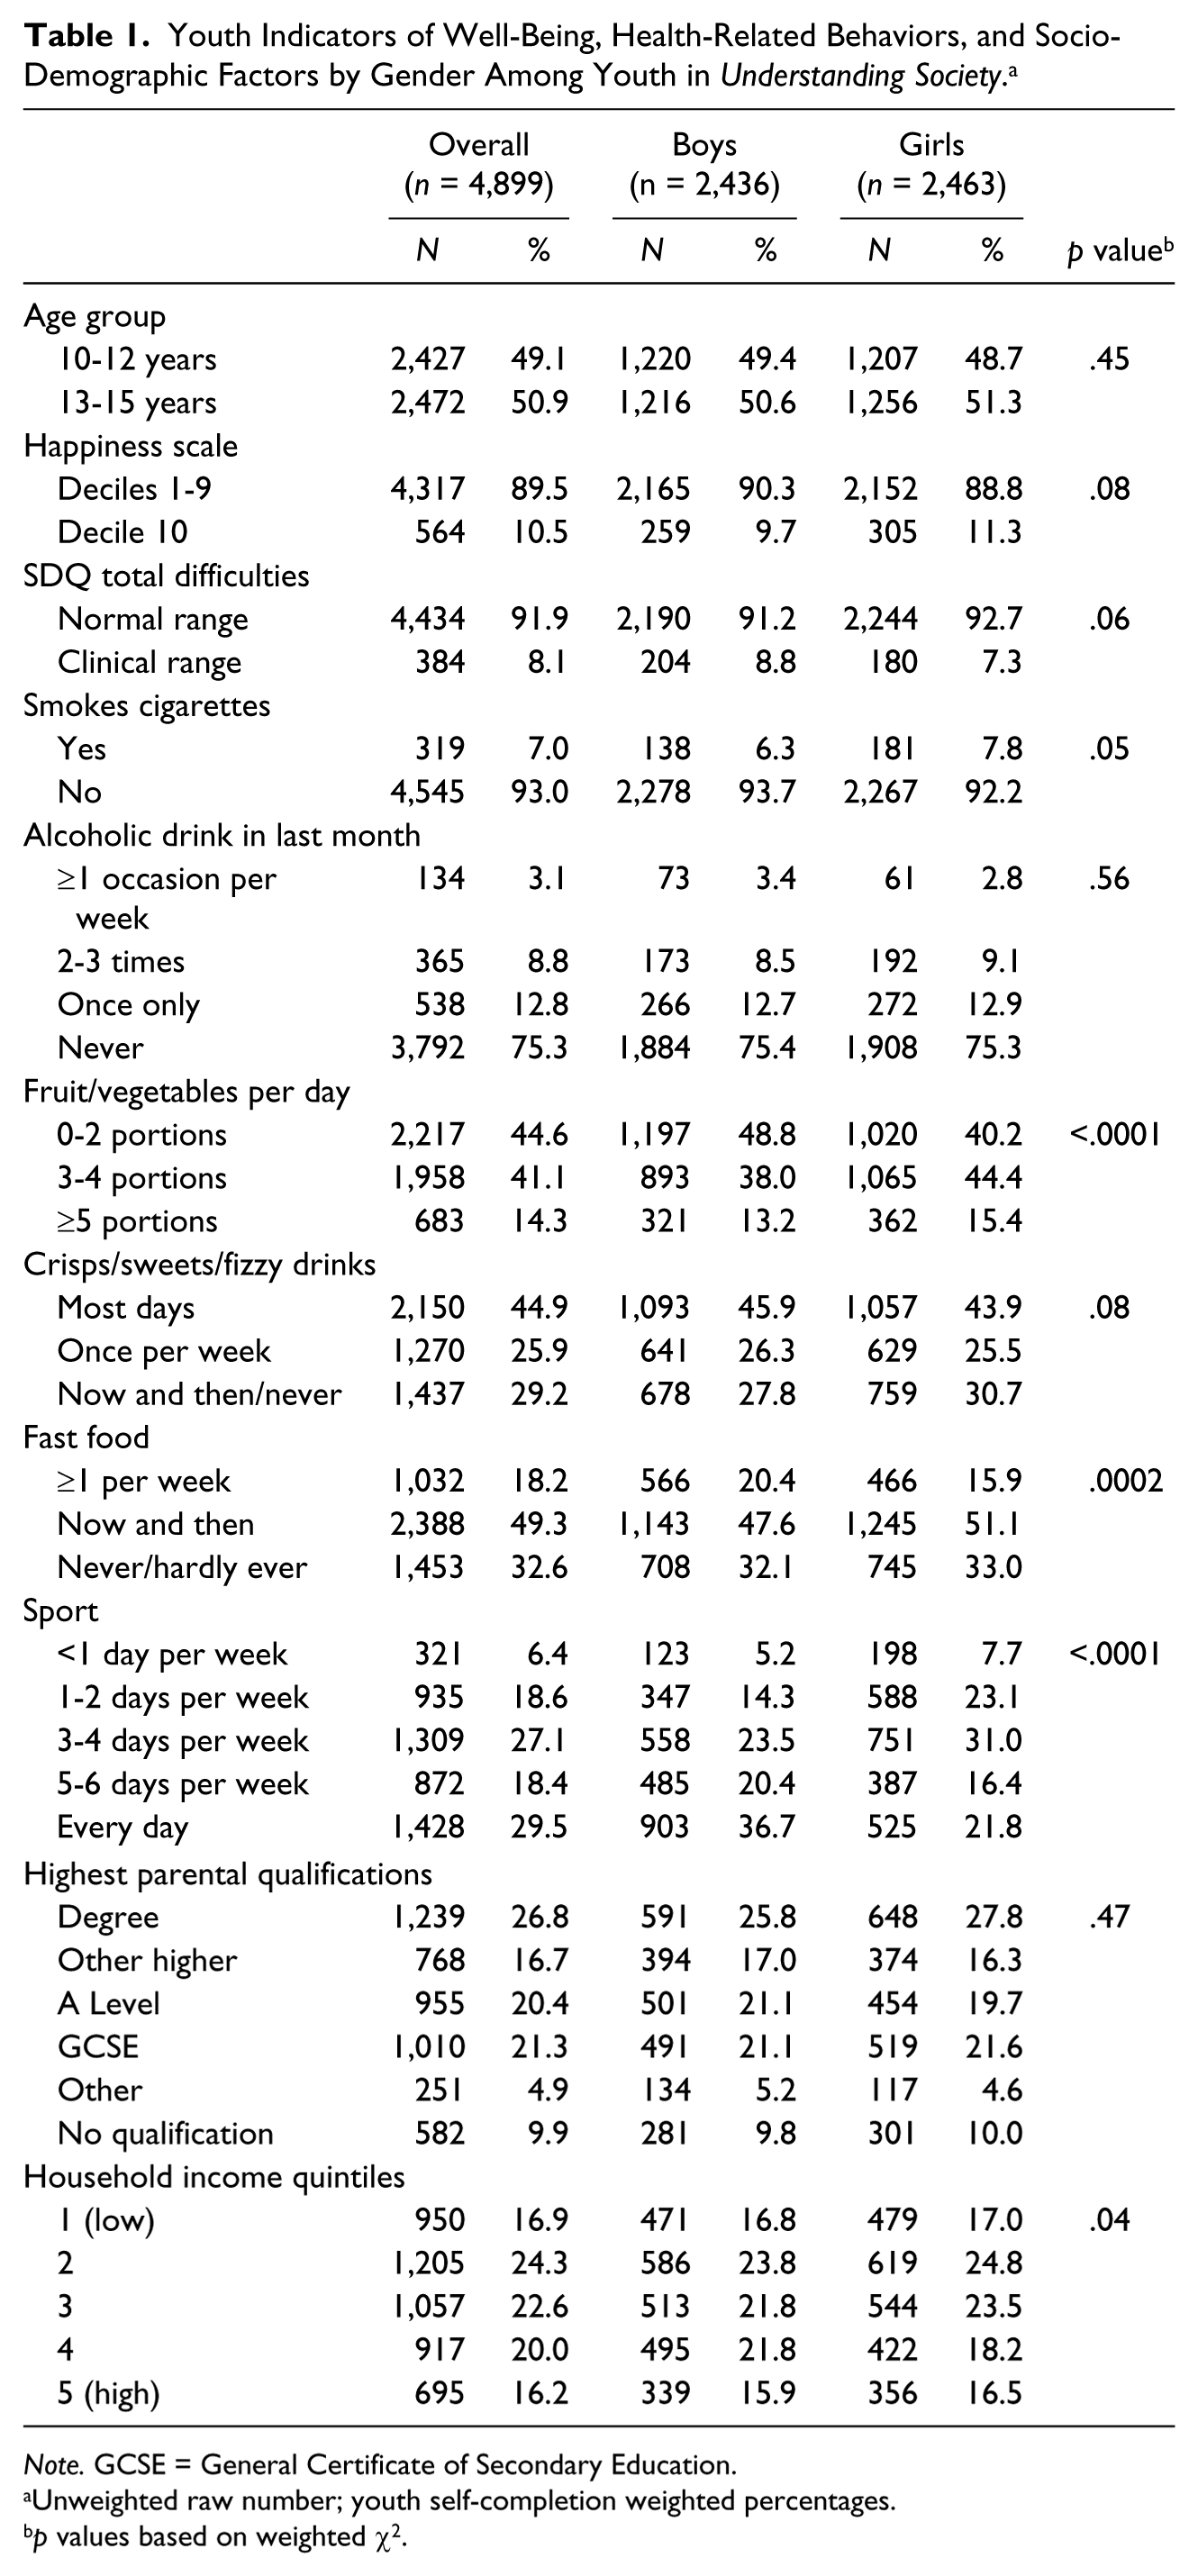
Note. GCSE = General Certificate of Secondary Education.
Unweighted raw number; youth self-completion weighted percentages.
p values based on weighted χ2.
Developmental changes in the uptake or maintenance of healthy lifestyles were evident (Table 2). Two percent of 10-12 year olds smoked compared with 12% of the 13-15 age group χ2(1, N = 4,899) = 221.24, p < .0001. Similarly, 8% of the younger age group compared with 41% of the older age group reported having drunk alcohol in the past month. Consumption of fruits and vegetables was low and appeared to drop with age with 17% of those 12 years or under reporting five or more portions per day compared with 12% of those aged 13 years or older χ2(2, N = 4,899) = 44.28, p < .0001. Youth aged 13 and older were more likely to consume fast food meals more than one time per week, 19%, χ2(2, N = 4,899) = 10.48, p = .0053 and to report eating crisps, sweets, and fizzy drinks on most days, 49%, χ2(2, N = 4,899) = 27.24, p < .0001 compared with the younger age group, 17% and 41%, respectively. Participation in sport was less common among the older age group χ2(4, N = 4,899) = 114.67, p < .0001.
Youth Indicators of Well-Being, Health-Related Behaviors, and Socio-Demographic Factors by Age Group Among Youth in Understanding Society. a

Note. GCSE = General Certificate of Secondary Education.
Unweighted raw number; youth self-completion weighted percentages.
p values based on weighted χ2.
Youth well-being
There were no differences by gender in the proportion of happy youth χ2(1, N = 4,899) = 3.05, p = .08 or youth with socio-emotional difficulties χ2(1, N = 4,899) = 3.53, p = .06. However, 10- to 12-year-olds were happier χ2(1, N = 4,899) = 97.34, p < .0001 while also being more likely to have socio-emotional difficulties χ2(1, N = 4,899) = 10.90, p = .001, compared with 13- to 15-year-olds.
Health-related behaviors and well-being
Happiness
Youth who reported smoking were about five times less likely to be happy compared with nonsmokers, Wald χ2(1, N = 4,899) = 20.91, p < .0001 (Table 3). Those youth who reported drinking in the last month were four to six times less likely, Wald χ2(3, N = 4,899) = 68.60, p < .0001, to be happy compared with nondrinkers. These estimates were attenuated on adjustment for covariates but associations remained strongly statistically significant.
Logistic Regression of Youth Happiness a on Health Behaviors.
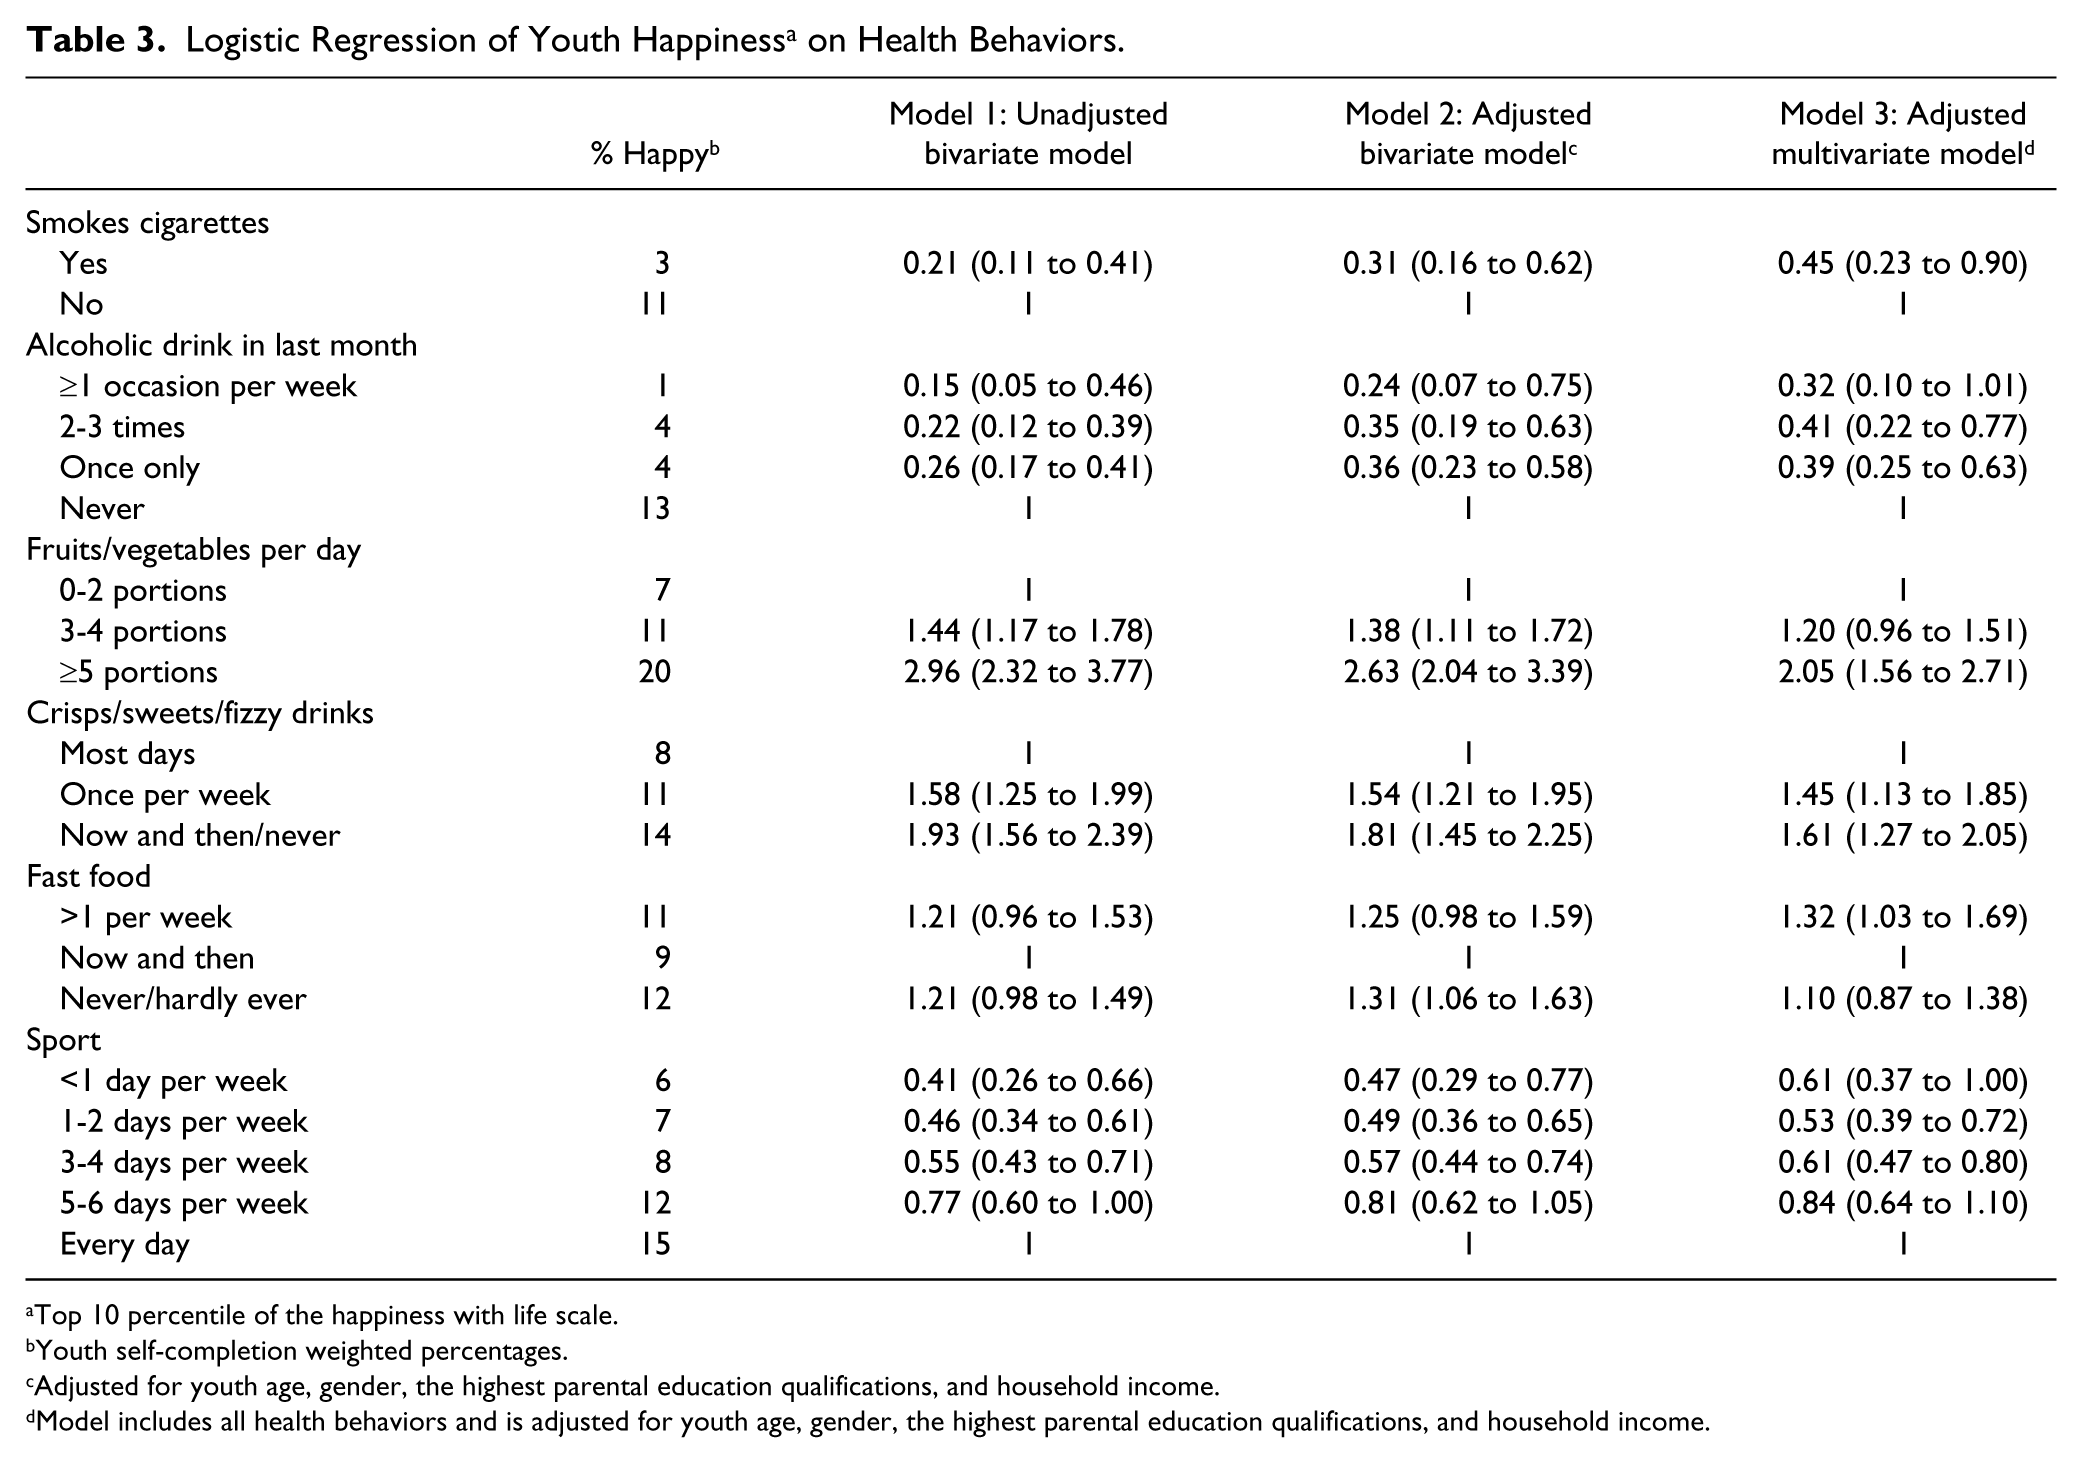
Top 10 percentile of the happiness with life scale.
Youth self-completion weighted percentages.
Adjusted for youth age, gender, the highest parental education qualifications, and household income.
Model includes all health behaviors and is adjusted for youth age, gender, the highest parental education qualifications, and household income.
More frequent consumption of fruits and vegetables was also associated with happiness with little attenuation in the association on adjustment for covariates, Wald χ2(2, N = 4,899) = 56.96, p < .0001. Less frequent consumption of crisps, sweets, and fizzy drinks was associated with an increased likelihood of being happy, Wald χ2(2, N = 4,899) = 28.84, p < .0001. Fast food consumption had no bivariate association with happiness, but a statistically significant positive association emerged on adjustment for covariates, with lower consumption associated with happiness, Wald χ2(2, N = 4,899) = 7.07, p = .03. There was a linear relationship between greater frequency of sports participation and happiness, and, while there was some attenuation with the addition of socio-demographic covariates, the overall pattern still held, Wald χ2(7, N = 4,899) = 34.87, p < .0001.
In models simultaneously adjusted for all health-related behaviors, smoking, Wald χ2(1, N = 4,899) = 5.20, p = .02, and drinking alcohol in the past month, Wald χ2(3, N = 4,899) = 24.50, p < .0001, were associated with lower odds of happiness. More frequent consumption of fruits and vegetables, Wald χ2(2, N = 4,899) = 27.43, p < .0001, increased sports participation, Wald χ2(4, N = 4,899) = 22.87, p = .0001, and less frequent consumption of crisps, sweets, or fizzy drinks, Wald χ2(2, N = 4,899) = 16.73, p = .0002, were associated with higher odds of happiness.
Socio-emotional difficulties
On the whole, statistical adjustment for covariates resulted in statistically stronger relationships between health-related behaviors and socio-emotional difficulties (Table 4). Smoking, for example, was associated with an almost 3-fold increase in the odds of socio-emotional difficulties that strengthened to an almost 4-fold increase on adjustment for covariates, Wald χ2(1, N = 4,899) = 52.59, p < .0001. Drinking alcohol once or more per week was associated with just under a 2-fold increased odds of socio-emotional difficulties, and, after adjustment, this strengthened to over a 2.5-fold increase in the odds, Wald χ2(3, N = 4,899) = 12.65, p = .006. Markers of an “unhealthy” diet were all associated with socio-emotional difficulties. Youth who participated in sport the least had the highest odds of difficulties, Wald χ2(4, N = 4,899) = 38.83, p < .0001. Simultaneous adjustment for all health-related behaviors revealed smoking, Wald χ2(1, N = 4,899) = 34.63, p < .0001, markers of dietary intake and sports participation, Wald χ2(4, N = 4,899) = 25.47, p < .0001, as having independent associations with socio-emotional difficulties.
Logistic Regression of Socio-Emotional Difficulties a on Health Behaviors.
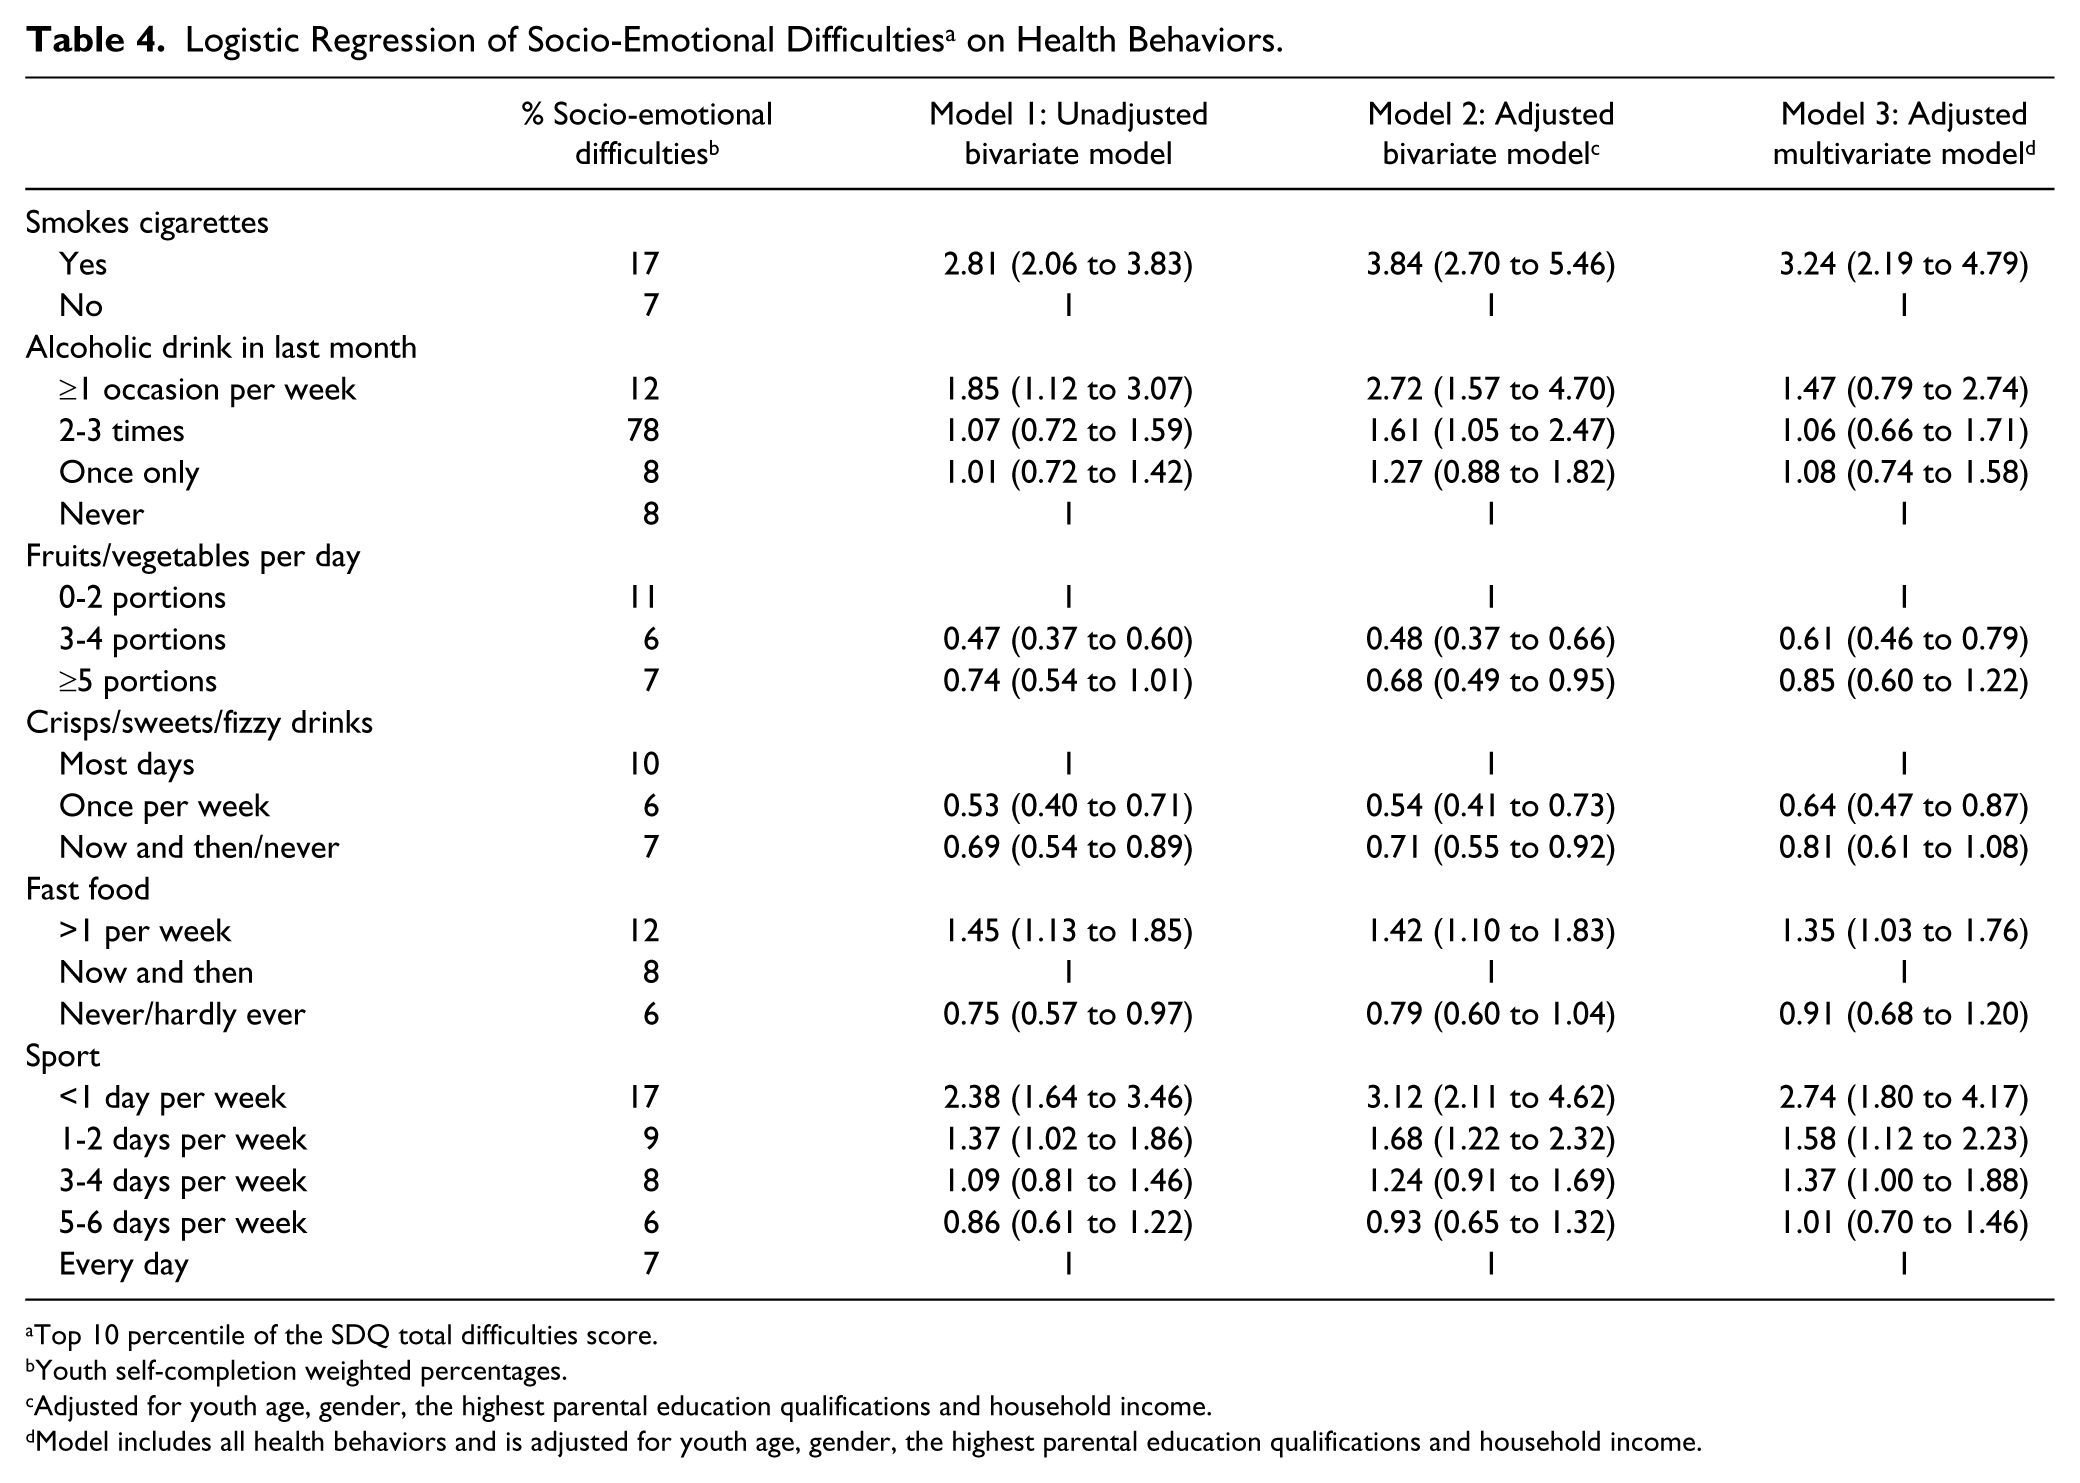
Top 10 percentile of the SDQ total difficulties score.
Youth self-completion weighted percentages.
Adjusted for youth age, gender, the highest parental education qualifications and household income.
Model includes all health behaviors and is adjusted for youth age, gender, the highest parental education qualifications and household income.
Moderation effects
For socio-emotional difficulties, there were interactions between gender and smoking (Figure 1) and sports participation (Figure 2). The findings suggest that girls who smoked had significantly higher odds of socio-emotional difficulties, Wald χ2(1, N = 4,899) = 6.3007, p < .01, compared with boys who smoked. Girls who reported less frequent participation in sports were less likely to have socio-emotional difficulties, Wald χ2(4, N = 4,899) = 10.46, p = .03, compared with boys. The overall trend for sports participation and socio-emotional difficulties was statistically significant for boys but not for girls, thereby suggesting a more detrimental effect for boys who participate in sport infrequently compared with girls.
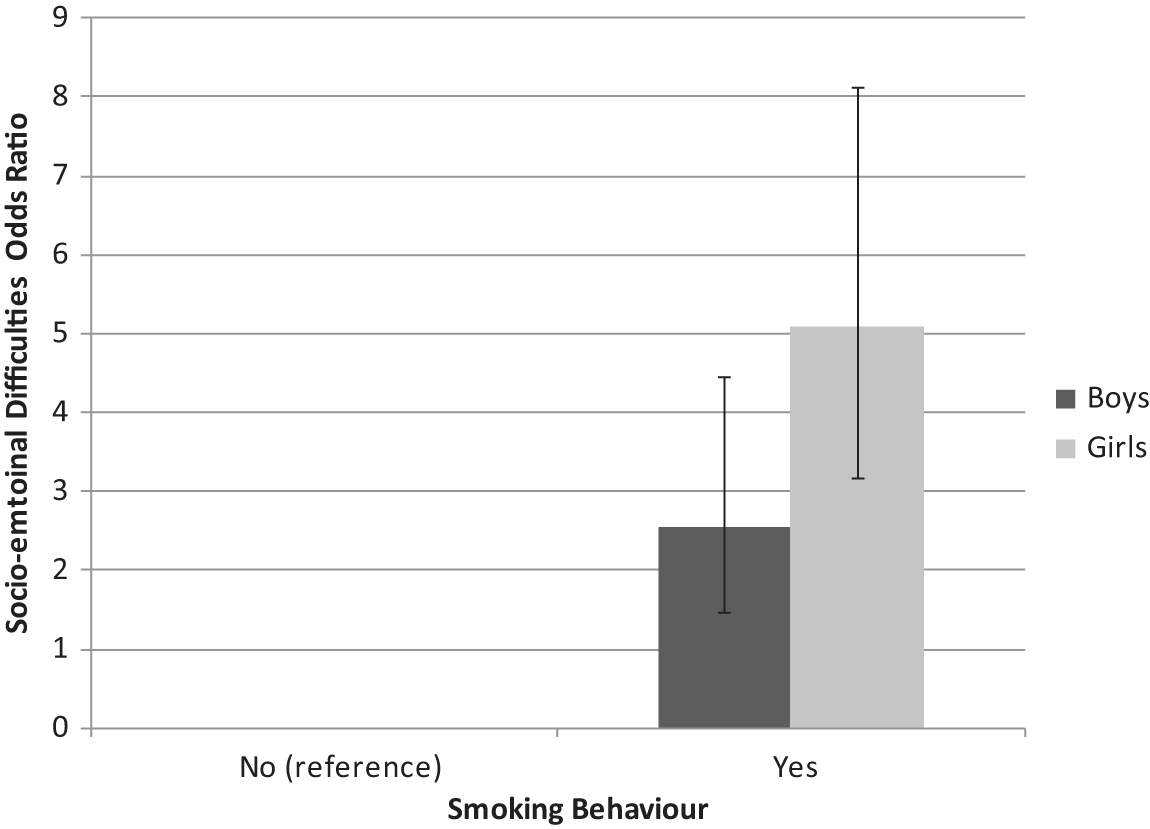
Effects of smoking by gender interaction (p = .01) on odds ratio for socio-emotional difficulties. Adjusted for youth age, gender, the highest parental education qualifications, and household income.
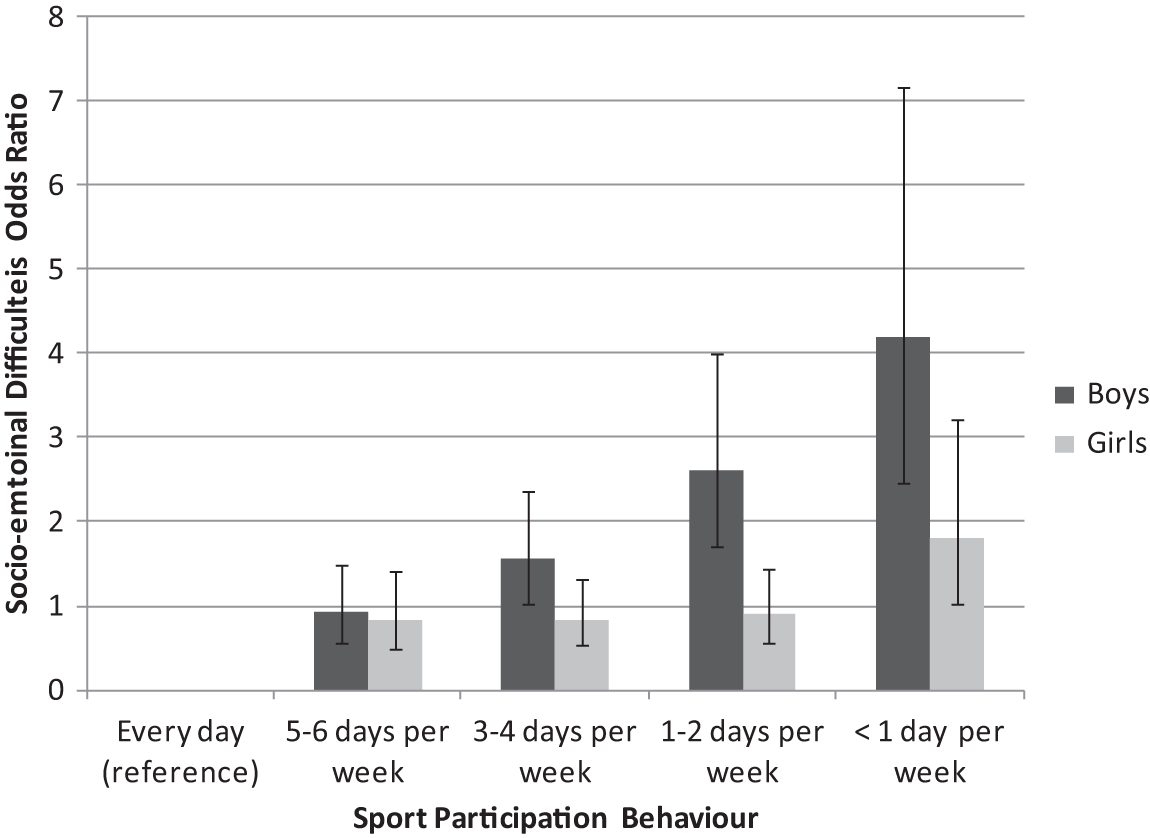
Effects of sports participation by gender interaction (p = .03) on odds ratio for socio-emotional difficulties. Adjusted for youth age, gender, the highest parental education qualifications, and household income.
Discussion
We found gender and age differences in certain aspects of health-related behaviors and positive and negative aspects of well-being in youth. Independent of other health-related behaviors, smoking and alcohol use were strongly negatively associated with happiness in youth, and smoking was strongly associated with socio-emotional difficulties. In general, markers of an “unhealthy” diet were linked to a reduced likelihood of being happy and an increased likelihood of socio-emotional difficulties with the exception of the consumption of fast food and happiness. Frequency of sport participation was strongly linked to both aspects of well-being in the expected direction.
We know that health-related behaviors and elements of well-being track throughout the life course and that patterning of these can be set in youth (Due et al., 2011; R. Viner, 2005; R. M. Viner & Cole, 2005). Therefore, generating a picture of a range of health-related behaviors, activities, and well-being in a contemporary UK sample of young people is of great value. We found similar patterns of fruit and vegetable intake, drinking, and smoking as reported in the Health Survey for England (The Health and Social Care Information Centre, 2007). In addition, the links between some health-related behaviors, such as diet and physical exercise, that we observe are consistent with those seen elsewhere (Iannotti et al., 2009). A large body of work has documented the benefits of a healthy diet and physical activity for health (Strong et al., 2005).
We cannot draw causal inferences based on these cross-sectional data. However, observed variations in the distributions of health-related behaviors in relation to markers of well-being suggest that different causal processes may be at play. Our modeling results further point to these possible differences. For example, there was an amplification of the association between smoking and socio-emotional difficulties on adjustment for socio-demographic factors. This suggests that these factors, age, gender, household income, and parental educational attainment may be suppressing the link with smoking. Thus, if all smokers had the same socio-demographic characteristics, the relationship between smoking and socio-emotional difficulties would be shown to be greater. In contrast, because happiness is differently distributed across gender, age, and socioeconomic position, the reduced odds of happiness associated with smoking are attenuated.
While the causal pathways may differ for different markers of well-being, participation in health-related behaviors does not usually occur in isolation. Youth usually participate in a combination of health-related behaviors and the sequence of initiation of those health-related behaviors is also important in understanding the causal process. As observed here, there was attenuation of the associations between health-related behaviors and markers of well-being when all health behaviors were included in the model suggesting some covariation between behaviors. Therefore, the combination of these behaviors may result in different levels of well-being depending on which behaviors were started first and which ones persist throughout adolescence.
Gender differences in the uptake and persistence of health-related behaviors may be one moderator of the emergence and maintenance of health behaviors. Descriptive statistics showed that girls were more likely to smoke and eat fruits and vegetables, but they were also less likely to consume fast food and participate in sports than boys. Our findings also suggest that girls who smoke are more likely to have socio-emotional difficulties compared with boys, perhaps because girls who smoke may do so in response to negative events or problems (Munafò et al., 2007; Needham, 2007; Whitbeck et al., 2009); conversely, girls may start smoking and then experience increased socio-emotional difficulties, more so than boys (Needham, 2007; Whitbeck et al., 2009).
Less frequent sports participation corresponded to a significant increase in the likelihood of socio-emotional difficulties among boys but not among girls. One potential explanation may be the social aspects and impacts on self-esteem that accompany boys’ participation in sports as has been found in the recent research (Aşçi, Gökmen, Tiryaki, & Aşçi, 1997; Gadbois & Bowker, 2007; Gruber, 1986; Stein, Fisher, Berkey, & Colditz, 2007). Conversely, many girls do not participate in sports, but they may have beneficial social interactions outside the sphere of sports. While other studies have observed associations between reduced sport participation and well-being in boys, few have tested for an interaction between gender and sport participation (Fulkerson et al., 2004; Milligan et al., 1997; Wiles et al., 2008). The one study that tested for an interaction in a longitudinal study did not find any differences by gender (Wiles et al., 2008).
Strengths and Limitations
Our findings are drawn from data from a large contemporary sample of young people, and we were able to consider multiple dimensions of health-related behaviors and activities in relation to the different aspects of well-being.
Our study is the first to assess independent associations of multiple health-related behaviors on experiential well-being. However, our findings are based on cross-sectional data, thereby limiting the extent of causal inference that can be made.
The findings from this study highlight the need for future research on longitudinal samples. One area requiring further investigation is in determining how health-related behaviors develop and covary over time. Do specific health-related behaviors lead to the increase or decrease of others, and, if so, what are the mechanisms that lead to those changes in behavior? Understanding how health-related behaviors are interrelated will inform the dialogue on causality. Understanding the causal pathways is important for the development of future interventions and policies as one pathway may be stronger for initiation/cessation of certain health-related behaviors, while the other may be a pathway for the maintenance of the behavior. The findings from this study showed independent relationships between health-related behaviors and well-being. This suggests that interventions and policies should address a wide range of behaviors and the factors that lead to increases or decreases in the uptake and maintenance of health-related behaviors.
Conclusion
There are clear associations between health-related behaviors and experienced positive and negative well-being. In light of the recent UNICEF report, and known continuities in health-related behaviors, interventions aimed at reducing risky health-related behaviors in youth need to be identified and implemented. Such interventions have the potential to reduce inequalities in health and well-being throughout the life course.
Footnotes
Declaration of Conflicting Interests
The author(s) declared no potential conflicts of interest with respect to the research, authorship, and/or publication of this article.
Funding
The author(s) disclosed receipt of the following financial support for the research, authorship, and/or publication of this article: This study was supported by UK Economic and Social Research Council (ESRC): Understanding Society: The UK Longitudinal Household Study (RES-586-47-0001); Understanding Society, the UK Longitudinal Studies Centre (RES-586-47-0002); the Research Centre on Micro-Social Change (MiSoC) (Award no. RES-518-28-001); and the ESRC International Centre for Lifecourse Studies in Society and Health (RES-596-28-0001).