
Abstract
Introduction:
Mismatch negativity (MMN) is a neural response to unexpected deviations from a regular sequence of stimuli. A diminished MMN is highly replicated in schizophrenia; however, whether this is observed in bipolar disorder (BD) is less clear.
Aim:
To conduct a meta-analysis of MMN alterations in people with BD compared to healthy controls.
Methods:
Electronic databases were searched until 20/10/2025, for between-subjects studies examining MMN amplitudes and or latencies in BD patients compared with controls. 15 studies consisting of 437 BD patients and 815 controls were included in this analysis.
Results:
The primary outcome was the difference in MMN amplitude between the BD and control groups, from studies using standard MMN paradigms. Meta-analysis revealed diminished MMN amplitudes (n = 14) in BD versus controls (standardised mean difference = 0.47, 95% confidence interval [0.28, 0.66], p < 0.0001). Exploratory secondary meta-regressions revealed no significant relationship between MMN amplitude and age, sex, symptoms, or illness duration. Subgroup analyses revealed MMN amplitude group difference for paradigms using duration versus frequency deviants.
Conclusion:
MMN amplitude deficits are observed in bipolar disorder. As MMN deficits are consistently observed in schizophrenia, whether the MMN deficits observed in BD relate to psychotic symptoms or specific BD subtypes remains unclear. Limitations of this meta-analysis include low study numbers for some of the meta-regressions. Most included studies did not separate bipolar subtypes; therefore, it was not possible to determine whether the observed effects relate to affective or psychotic symptoms. Future research should distinguish putative BD subtypes and include measures of symptoms to clarify the potential of MMN as a clinical marker to guide treatment decisions.
Introduction
Bipolar disorder (BD) is a mental health condition characterised by episodes of mania, depression or an admixture of both, typically with interspersed periods of euthymia. There are putative subtypes of BD; type 1 (BD1) is characterised by manic episodes during which individuals may experience psychotic symptoms laden with affective symptoms. Type 2 (BD2) is characterised by depressive episodes and hypomanic episodes, which typically lack the psychotic symptoms seen in BD1 (Goodwin and Jamison, 2007). Evidence suggests that BD patients may experience similar cognitive deficits to those with psychosis (Bora and Pantelis, 2015), and during psychotic periods there may be substantial overlap in symptoms.
The mismatch negativity (MMN) is a pre-attentive negative event-related potential (ERP) elicited when a deviant stimulus is presented following a sequence of repeated stimuli (Sams et al., 1985). It is typically elicited using an “oddball” paradigm, where a series of auditory stimuli is repeated (the standard stimulus), before presenting a “deviant” stimulus, which differs from the standard either in pitch (frequency) or duration, or both (for review, see Garrido et al., 2009). The deviant probability is the proportion of stimuli presented that violate statistical regularity. The MMN may be detected by magnetoencephalography or electroencephalography (MEG/EEG), and specifically, it is the difference waveform obtained by subtracting the ERP to predicted (standard) stimuli from unpredicted (deviant) stimuli. It has a peak latency between 100 and 250 ms after the deviant onset.
The MMN is thought to arise either from local neuronal adaptation to repeated stimuli (Jääskeläinen et al., 2004) or from a mismatch response when sensory input deviates from a memory-based model of regularity (Näätänen and Winkler, 1999). More recently, the predictive coding account unifies these theories, viewing MMN as a prediction error in a hierarchical predictive model of sensory input (Friston, 2005). A diminished MMN is a highly replicated finding in schizophrenia compared to healthy controls with large effect sizes (ES = 1.01 for duration deviants) (Umbricht and Krljes, 2005) and has been shown to correlate with neuropsychological impairments (Baldeweg et al., 2004). Whether such findings translate to affective psychoses is not clear.
Whether the observed MMN reductions in schizophrenia also occur in BD, particularly with respect to BD subtypes, is less clear. The last meta-analysis, while focused on schizophrenia, showed that BD patients have MMN deficits, to a lesser degree than those observed in schizophrenia (Erickson et al., 2016). Since the last meta-analysis (Erickson et al., 2016), five additional studies have measured MMN in BD patients. We update this previous work and extend it by including a meta-analysis of MMN latency, and exploring the effect of previous and current psychotic symptoms and specific BD subtypes on the MMN. We also analysed group differences in MMN amplitude variability with analysis of variance. The aim of this meta-analysis was to understand differences in MMN in BD patients compared with healthy controls.
Methods
Study design
This meta-analysis was performed in accordance with the Preferred Reporting Items for Systematic Reviews and Meta-Analyses (PRISMA) guidelines (Page et al., 2021) and was preregistered on PROSPERO (ID: CRD42024586131). Embase, Medline and APA PsycINFO databases were searched up until 20/10/2025. The following search terms were used: “bipolar affective disorder” OR “bipolar disorder” OR mania OR depression AND “mismatch negativity” OR MMN. No search limits were applied. Two independent reviewers (A.C. and R.M.) performed titles and abstract screening, and full texts of relevant studies were retrieved. Full-text screening was performed, and studies meeting the eligibility criteria were included in the meta-analysis. Authors were contacted via email when MMN values were not reported numerically or when there was ambiguity regarding the independence of data across publications. Out of six, five were unable to respond within the required timeframe (for more information, see Supplemental Information).
Selection criteria
Studies were included in the meta-analysis if (a) the study population included at least one bipolar disorder group and a healthy control group, with a sample size of greater than 5 per group; (b) diagnoses were established according to DSM-III, DSM-IV, DSM-V, ICD-9, ICD-10 or ICD-11 criteria; (c) group differences in MMN amplitude or latency were reported with sufficient statistical information to calculate effect sizes (means and standard deviations, or appropriate summary statistics); (d) the MMN was reported as the difference wave (ERP for the deviant minus ERP for the standard); and (e) the study employed a standard auditory MMN paradigm. Studies were excluded if (a) MEG rather than EEG was used, for methodological consistency between studies; (b) the study was published in a language other than English, and (c) non-standard MMN paradigms (e.g. emotional syllables) were used. After PROSPERO registration, the selection criteria were refined to restrict inclusion to EEG studies, to enhance methodological consistency in MMN measurement.
Study selection
The screening and selection process is summarised in the PRISMA flowchart (Figure 1). Following the removal of duplicates, 447 articles were independently screened by 2 reviewers (A.C. and R.M.). Titles and abstracts were assessed, and 40 full-text articles were evaluated for eligibility based on the pre-specified inclusion criteria. Of these, 15 studies met the inclusion criteria and were included in the meta-analysis. Data were extracted and checked by a second author (A.C. and R.M., respectively).
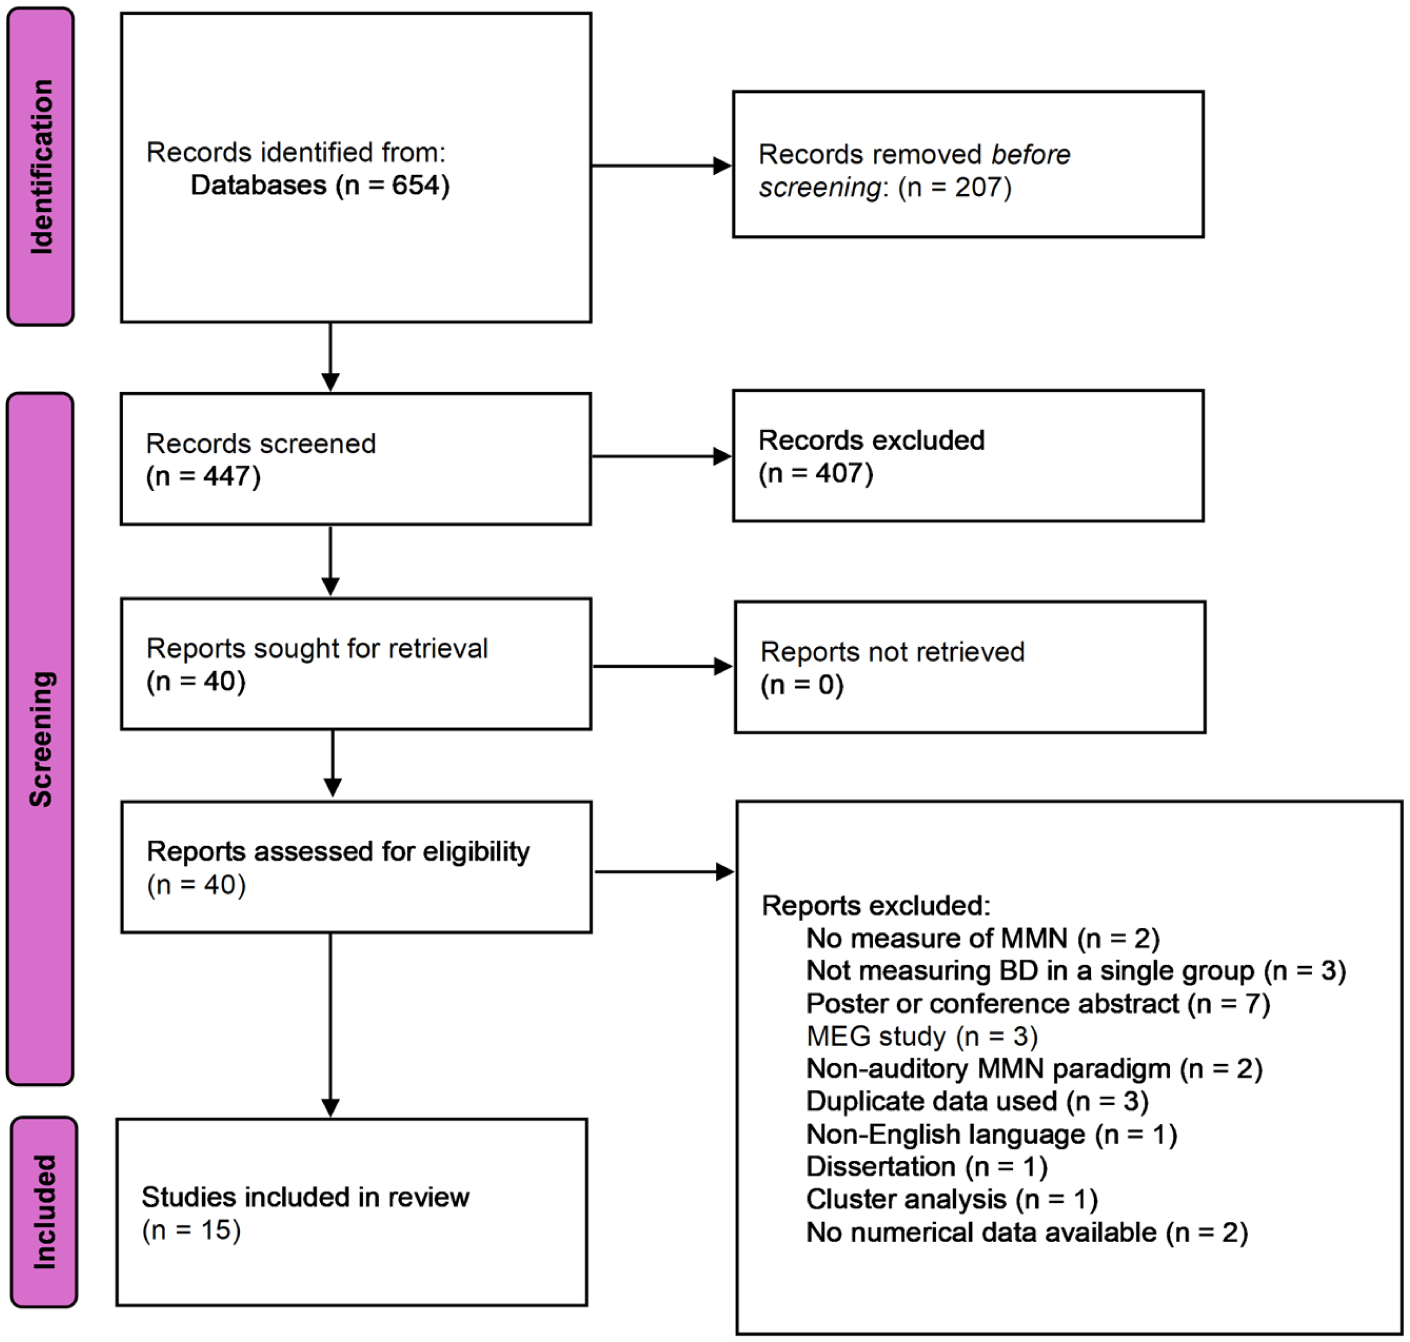
PRISMA flow diagram illustrating the process of selecting studies for the systematic review and meta-analysis.
Data extraction/recorded variables
The primary outcome of this meta-analysis was the effect size of MMN amplitudes in individuals with BD compared to controls. For each included study, the following data were extracted: study title, year of publication, author, sample size, diagnostic tool, diagnostic classification, mean and standard deviation (SD) of age, sex, paradigm type, deviant type, deviant probability, recording electrode, MMN amplitude (µv) (mean and SD), MMN latency (milliseconds) (mean and SD), duration of illness (years), and symptom scores from the Positive and Negative Syndrome Scale (PANSS) (positive and negative scores extracted separately) the Young Mania Rating Scale (YMRS), history of psychosis, and proportion of participants on anti-psychotic medication and mood-stabilising medications.
Risk of bias
Risk of bias was assessed independently by two authors (A.C. and R.M.) using The Newcastle–Ottawa Scale (Wells et al., 2000). Overall risk of bias ratings were calculated using the guidance specified by the tool.
Meta-analysis statistical methods
Statistical analyses were conducted using the metafor package, version 4.6.0, with RStudio, version 2024.12.0.467, (Posit Software, PBC). The primary meta-analysis estimated the effect size for the difference in MMN amplitude (µv) between the BD and control groups. Standardised effect sizes for individual studies were calculated using Hedge’s g (Hedges and Olkin, 2014) using a 95% confidence interval (CI) and a significance level of p < 0.05 (two-tailed). Pooled SDs were calculated based on sample size and individual SDs. All meta-analyses employed random-effects models using restricted maximum likelihood (REML) estimation to account for between-study variability. Effect sizes were interpreted as small (0.2–0.5), medium (0.5–0.8) or large (>0.8). Additionally, a secondary meta-analysis using the same methodology was conducted to examine differences in MMN latency (milliseconds) between groups. Where studies (n = 3) reported separate MMN values for each deviant type (Baldeweg and Hirsch, 2015; Domján et al., 2012; Umbricht et al., 2003), the values for duration deviants were included in the meta-analysis, as evidence suggests that duration deviants elicit stronger MMN differences in other clinical populations, and for consistency between the studies (Cheng et al., 2013; Tseng et al., 2021; Umbricht and Krljes, 2005). One twin study (Hall et al., 2007) reported separate MMN amplitudes for BD patients who were in concordant and discordant twin pairs, and in this case, a weighted average and pooled standard deviation were calculated for inclusion in the meta-analysis.
Between-study heterogeneity was assessed using Cochran’s Q statistic (Bowden et al., 2011), with heterogeneity quantified using I2. An I2 value of <0.5 was interpreted as having low heterogeneity, 0.5–0.75 as moderate heterogeneity and >0.75 as high heterogeneity (Higgins and Thompson, 2002). To examine for publication bias, Egger’s regression test was applied (Egger et al., 1997) and the results were visualised in a funnel plot. Trim-and-fill analyses were also performed.
Secondary subgroup analysis was conducted within the MMN amplitude meta-analysis to examine the effect of deviant type (frequency vs. duration). Examining the effect of paradigm type (oddball vs. roving) was not possible due to a low number of studies (n = 2) using the roving paradigm. Statistical significance for subgroup differences was assessed by first fitting separate random-effects models for each subgroup, followed by comparing subgroup summary estimates using a fixed-effects model with a Wald-type test. A p-value <0.05 was considered statistically significant.
Random-effects meta-regression models using REML estimation were used to examine the relationship between MMN amplitude effect sizes and variables including: symptom severity (measured by PANSS positive, PANSS negative, and YMRS scores), proportion of patients with psychotic symptoms, proportion of patients with BD1, proportion female, illness duration, age, proportion of participants on anti-psychotic medications and mood-stabilising medications, and deviant probability. However, many of these exploratory analyses were limited by fewer than 10 studies reporting these variables, meaning limited conclusions may be drawn. Weighted averages of the BD and control groups were calculated for % female and age. Where studies reported separate MMN amplitudes for duration and frequency deviants, effect sizes for the duration deviants were used in regression and subgroup analyses. Sensitivity analyses were done to confirm there was no significant difference between the results obtained using duration deviants and those obtained using frequency deviants. As the electrode site and amplitude quantification method (mean or peak window) can influence MMN amplitude, sensitivity analyses were also performed to evaluate the robustness of the findings. Separate random-effects meta-analyses were run, including studies reporting MMN amplitudes at the Fz electrodes only, and those using mean-window amplitude measures only.
Results
Retrieved studies for the meta-analysis
A total of 16 data sets (n = 15 studies) involving 1252 participants (weighted mean age: 35.7 years; 59.5% female) were included in this analysis. Figure 1 shows the PRISMA flowchart. The included studies are summarised in Table 1.
Study characteristics.
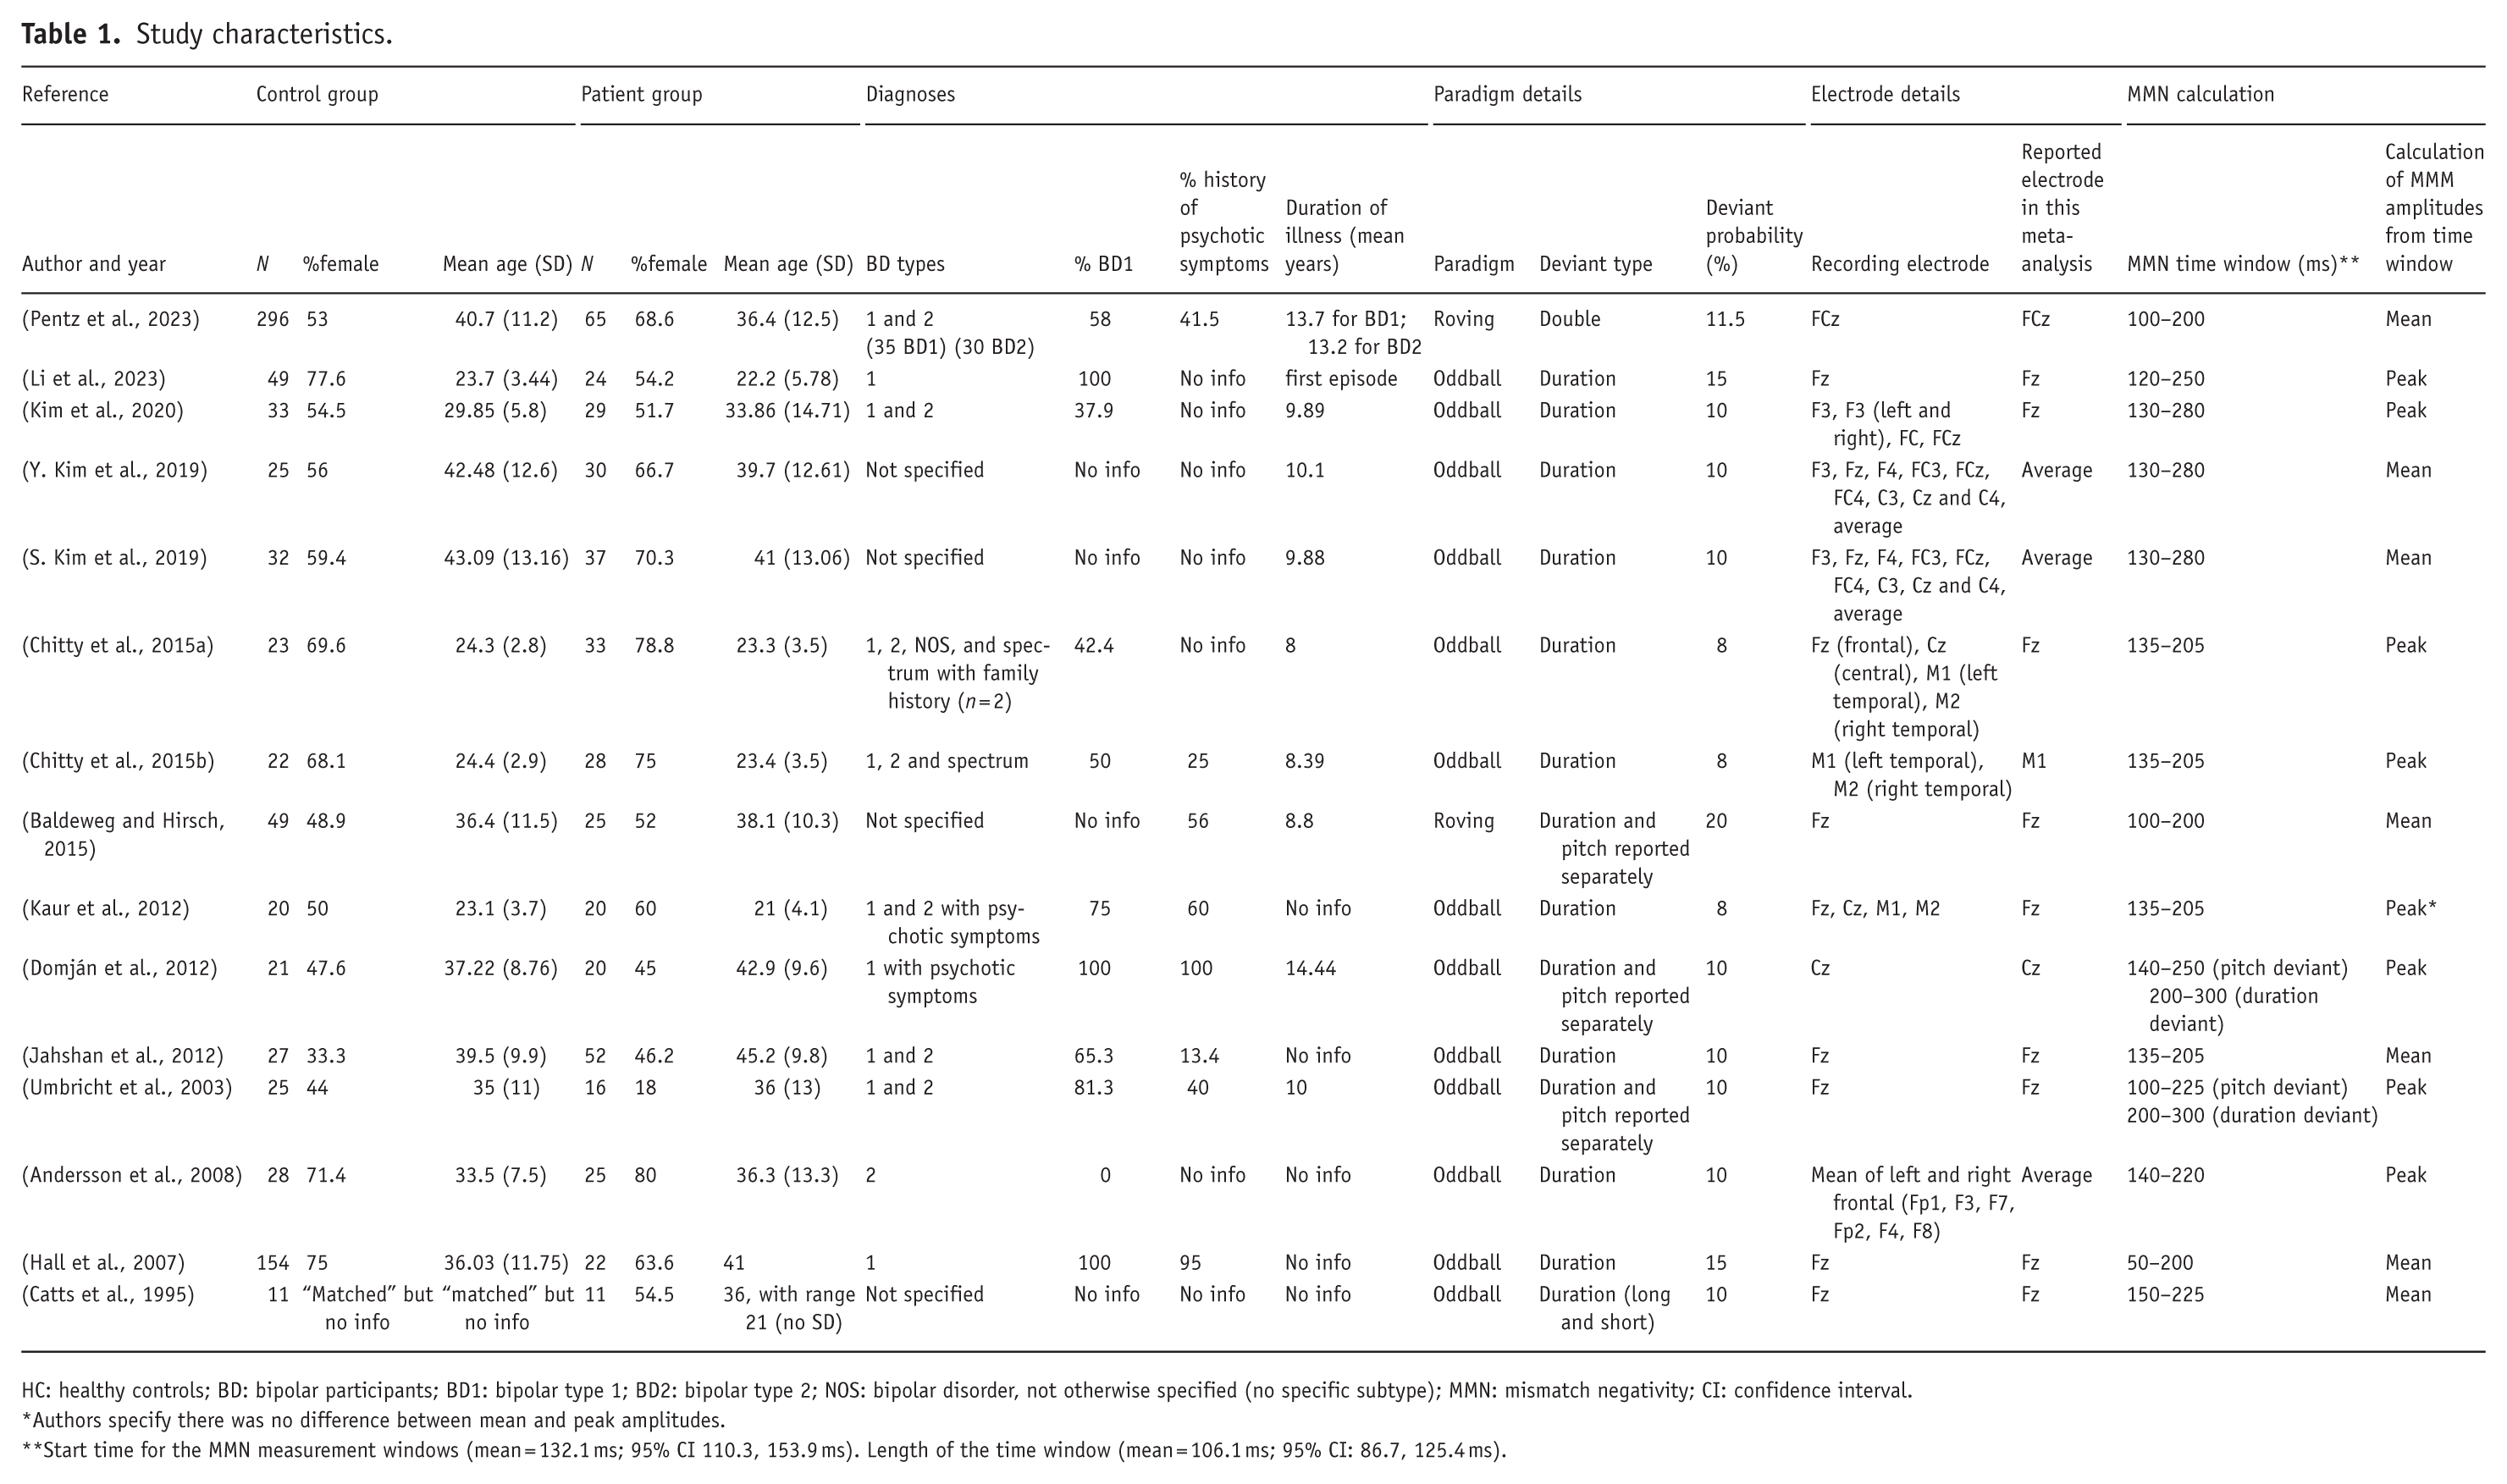
HC: healthy controls; BD: bipolar participants; BD1: bipolar type 1; BD2: bipolar type 2; NOS: bipolar disorder, not otherwise specified (no specific subtype); MMN: mismatch negativity; CI: confidence interval.
Authors specify there was no difference between mean and peak amplitudes.
Start time for the MMN measurement windows (mean = 132.1 ms; 95% CI 110.3, 153.9 ms). Length of the time window (mean = 106.1 ms; 95% CI: 86.7, 125.4 ms).
Risk of bias
Risk of bias was assessed using the Newcastle–Ottawa Scale (see Supplemental Table 1). Most studies were rated as moderate in quality, scoring between 5 and 8 out of 9. All studies adequately addressed participant selection and comparability, although reporting on exposure and outcome assessment was more variable. No study was rated as having a high risk of bias overall.
MMN amplitudes
MMN amplitude and latency data were recorded at various electrodes. Ten studies reported results from midline electrodes (Fz, Cz or FCz); however, three reported grand averages across a number of electrodes (Andersson et al., 2008; Kim et al., 2019a, 2019b). Fz, Fcz, Cz or averages were used in the meta-analysis; however, one study reported MMN values for mastoid electrodes (M1, M2) only, and therefore the polarity was reversed for inclusion in the meta-analysis (Chitty et al., 2015b). All studies reported MMN amplitudes with the exception of one, which only reported the latency (Andersson et al., 2008). Three studies reported both amplitude and latency (Domján et al., 2012; Li et al., 2023; Umbricht et al., 2003). All studies calculated the MMN as the difference wave between standard and deviant stimuli.
Three studies reported separate MMN amplitudes for duration and frequency deviants (Baldeweg and Hirsch, 2015; Domján et al., 2012; Umbricht et al., 2003), and the results for duration deviants only were included in the meta-analysis. One study reported separate MMN amplitudes for long- and short-duration deviants (Catts et al., 1995), and the long-duration deviants were included in the analysis as this stimulus is more consistent with those used in the other included studies. One study reported separate MMN amplitudes for BD subtypes 1 and 2 in addition to an overall group amplitude (obtained from authors as not present in manuscript), and the two subgroups were included without the average, as these patient groups were independent (Pentz et al., 2023). One twin study reported separate MMN amplitudes for BD patients who were in concordant and discordant twin pairs, and in this case, a weighted average and pooled standard deviation for all BD patients were calculated for inclusion in the meta-analysis (Hall et al., 2007).
An overall MMN amplitude effect size was calculated using data from 14 studies (15 data sets), including 412 participants with BD and 787 controls. The individual Hedge’s g random-effect sizes for each study are shown in Figure 2. Meta-analysis using a random-effects model estimated a standardised mean difference (SMD) of 0.47 (95% CI [0.28, 0.66], p < 0.0001). This finding remained significant in all interactions of the leave-one-out analysis (SMD range 0.44–0.53; all p < 0.0001). Meta-regressions showed that neither age (β = −0.016, p = 0.24) nor sex (β = 0.003, p = 0.69) nor duration of illness (β = −0.06, p = 0.21) significantly moderated the effect size. To further explore potential age-related effects on MMN amplitude, we examined the relationship between MMN effect sizes and mean participant age separately for bipolar and control groups. Pearson correlation showed no significant linear relationship between age and MMN amplitude in either the patient or control group.
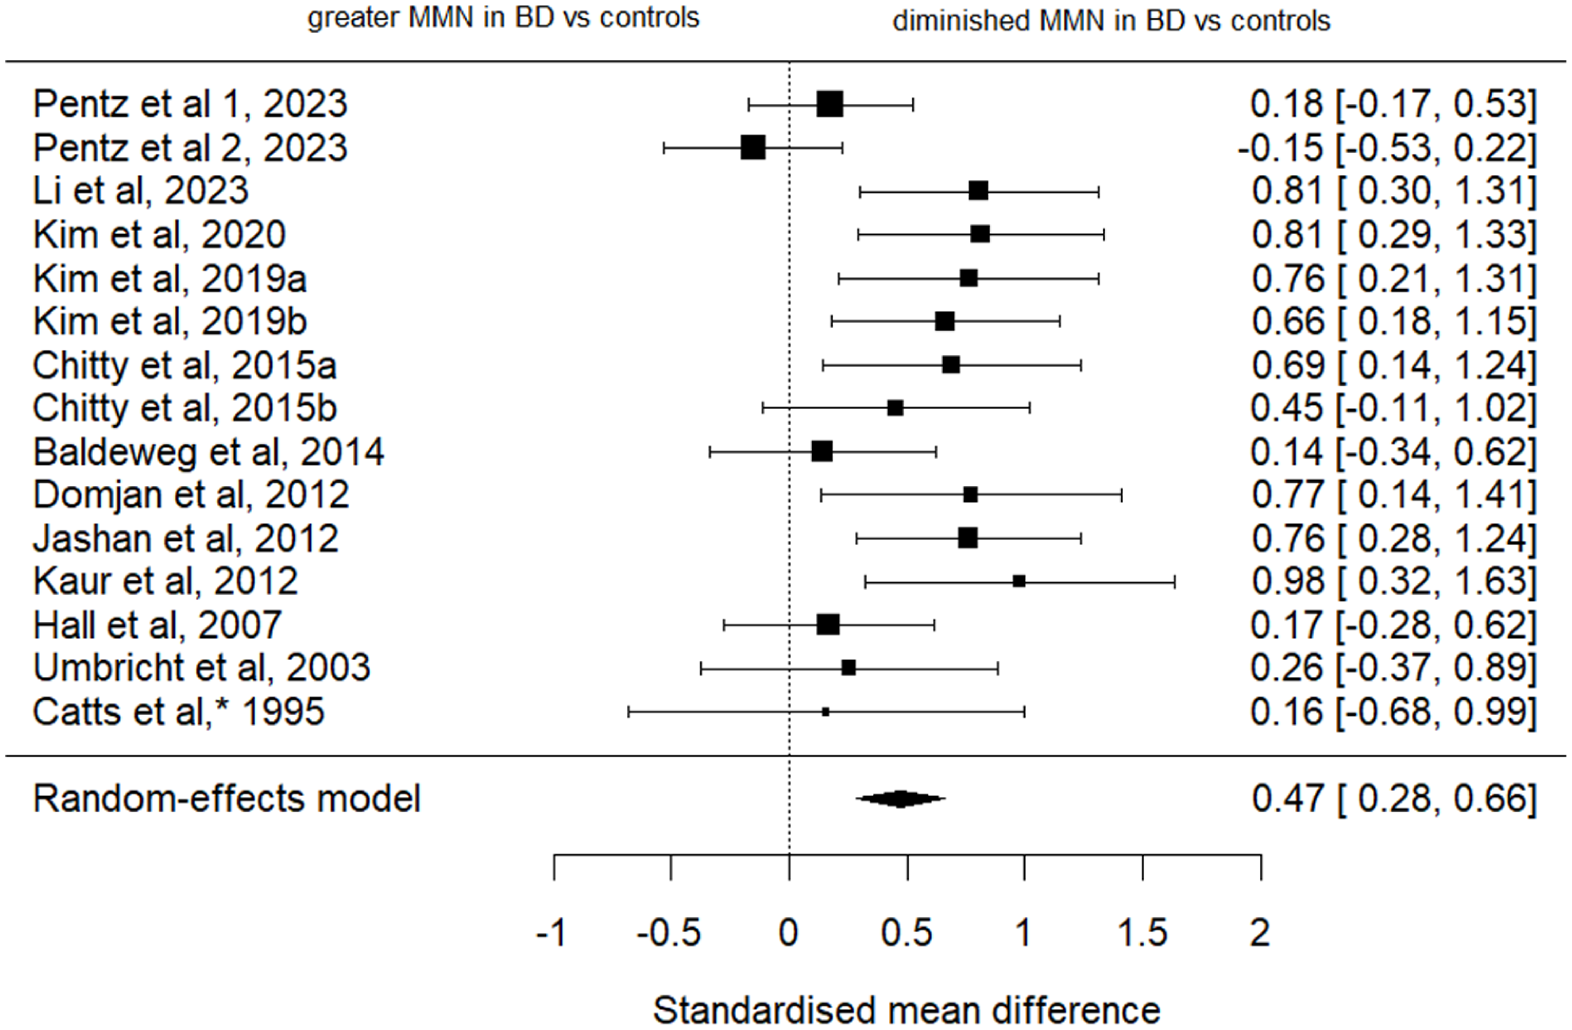
Forest plot showing Hedge’s g random-effect sizes for comparing MMN amplitudes between BD patients and healthy controls.
The results revealed a statistically significant degree of heterogeneity between studies (I² = 49.36%, Cochran Q(14) = 27.69, p = 0.0156). The Egger’s regression test showed no clear evidence of significant funnel plot asymmetry (z = 1.84, p = 0.066). The trim-and-fill method did not detect any missing studies on the left side of the funnel plot (p = 0.500) (Figure 3).
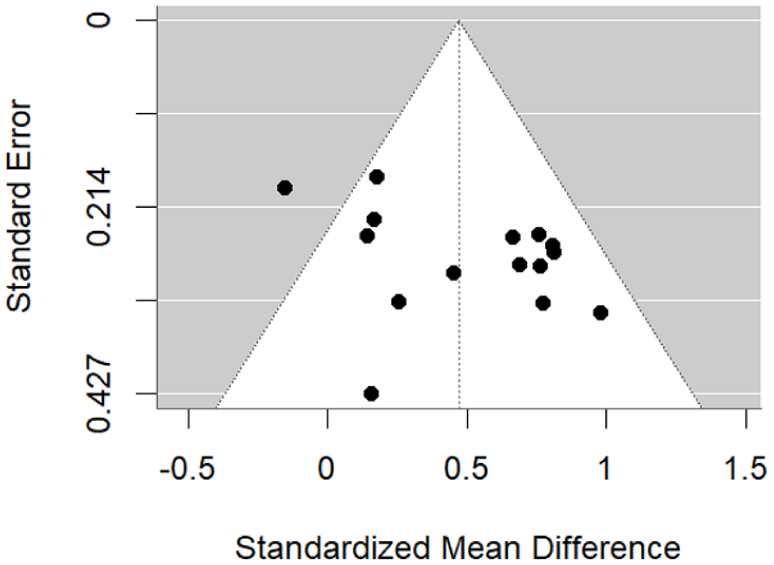
Funnel plot showing assessing publication bias in MMN effect sizes.
Sensitivity analyses were conducted to assess the robustness of the results to the electrode site. When restricting analyses to the Fz electrode (studies n = 9), random-effects meta-analysis estimated an SMD of 0.53 (95% CI [0.31, 0.76], p < 0.0001), showing that the MMN remained significant with a larger effect size. When restricting analyses to mean-window amplitude measures (studies n = 7, datasets n = 8), the estimated SMD was 0.32 (95% CI [0.07, 0.57], p = 0.0127), confirming that the main effect was robust to differences in amplitude quantification.
MMN amplitude effect size by paradigm type
In contrast to traditional oddball paradigms, where a deviant stimulus (deviating either in pitch, duration or both) is presented among a series of standard stimuli, in the roving paradigm, the deviant stimulus becomes the standard stimulus with repetition. This minimises confounds by using identical stimuli, allowing for a cleaner isolation of deviant error signals. 12 studies used oddball paradigms including 347 participants with BD and 766 controls (Catts et al., 1995; Chitty et al., 2015a, 2015b; Domján et al., 2012; Hall et al., 2007; Jahshan et al., 2012; Kaur et al., 2012; Kim et al., 2019a, 2019b, 2020; Li et al., 2023; Umbricht et al., 2003) and 2 used roving paradigms including 90 participants with BD and 345 controls (Baldeweg and Hirsch, 2015; Pentz et al., 2023). Individual random-effects meta-analyses were conducted for the studies using oddball paradigms; however, this was not possible for roving paradigms (n = 2). The effect size for studies using the oddball paradigm indicated a significant group difference in MMN amplitude between BD and control groups (SMD = 0.615, 95% CI [0.456, 0.774], p < 0.001).
MMN amplitude by deviant type
The deviant stimulus differed between studies. Thirteen studies including 372 participants with BD and 519 controls used duration deviants (Catts et al., 1995; Chitty et al., 2015a, 2015b; Hall et al., 2007; Jahshan et al., 2012; Kaur et al., 2012; Kim et al., 2019a; 2019b, 2020; Li et al., 2023), three studies including 61 participants with BD and 101 controls also tested pitch deviants as well as duration (Baldeweg and Hirsch, 2015; Domján et al., 2012; Umbricht et al., 2003), and one study including 65 participants with BD and 296 controls used double deviants (Pentz et al., 2023). The deviant probabilities (in %) ranged from 8% to 20%, with most using 10% deviant probability.
To evaluate the effect of deviant type (frequency vs. duration) on MMN amplitudes, individual random-effects meta-analyses were conducted for the studies using frequency and duration deviants to assess their respective effect sizes. A random-effects meta-analysis for the duration deviant studies (n = 13) revealed a significantly reduced MMN in BD compared with controls (SMD = 0.560, standard error (SE) = 0.081, 95% CI [0.400, 0.719], p < 0.001). By contrast, a meta-analysis of the frequency deviant studies (n = 3) showed no significant difference between groups (SMD = 0.125, SE = 0.166, 95% CI [−0.200, 0.449], p = 0.451). A fixed-effects meta-regression comparing the two deviant types confirmed a significant difference in effect sizes (QM(1) = 5.561, p = 0.018), with the frequency deviant studies showing significantly smaller effect sizes than those using duration deviants (β = 0.435, SE = 0.184, 95% CI [0.073, 0.796], p = 0.018) (Figure 4). Finally, meta-regression indicated that deviant probability did not significantly moderate effect sizes.
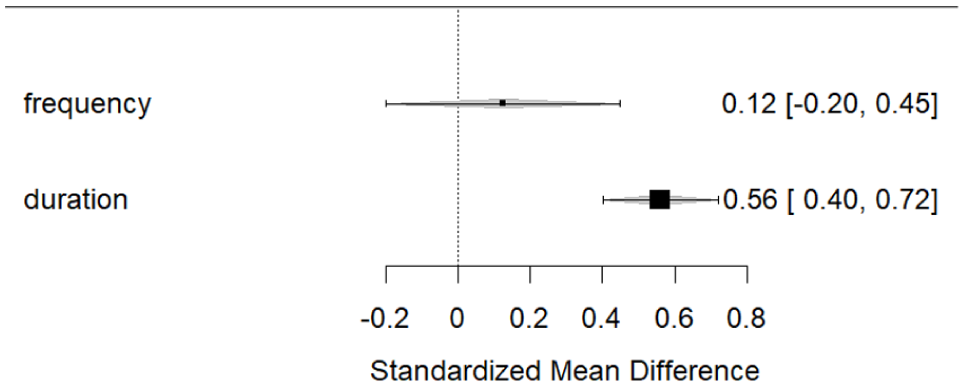
Subgroup analysis of MMN effect sizes by deviant type.
MMN amplitude by bipolar subtype
Most studies combined participants with BD subtypes 1 and 2. Seven studies commented on the proportions of the subtypes (Chitty et al., 2015a, 2015b; Jahshan et al., 2012; Kaur et al., 2012; Kim et al., 2020; Pentz et al., 2023; Umbricht et al., 2003), and four studies did not comment either on the relative proportion of subtypes or the specific subtypes included (Baldeweg and Hirsch, 2015; Catts et al., 1995; Kim et al., 2019a, 2019b). Three studies used BD1 patients only (Domján et al., 2012; Hall et al., 2007; Li et al., 2023), and one used BD2 only, which was the same study that only reported MMN latency values (Andersson et al., 2008). Only one study reported separate MMN amplitudes for the two subgroups (Pentz et al., 2023).
A mixed-effects meta-regression examining the relationship between MMN amplitudes and % of participants with BD1 (n = 11 data points; n = 10 studies) revealed no significant association. Additionally, there was no significant association between MMN effect sizes and % participants on mood stabilisers (n = 9), or % on antipsychotics (n = 7).
Influence of symptoms on MMN amplitude
Symptom severity was most commonly assessed using PANSS positive and negative scores (studies n = 6; datasets n = 7) (Baldeweg and Hirsch, 2015; Domján et al., 2012; Kim et al., 2019a, 2019b; Li et al., 2023; Pentz et al., 2023) and the YMRS (studies n = 8; datasets n = 9) (Chitty et al., 2015a, 2015b; Domján et al., 2012; Jahshan et al., 2012; Kim et al., 2019a, 2019b; Li et al., 2023; Pentz et al., 2023). Of these studies, the following had the clinical rating scales recorded on the same day as the EEG (n = 2) (Pentz et al., 2023; Umbricht et al., 2003), within 2 weeks of the EEG (n = 2) (Chitty et al., 2015a, 2015b), during admission (i.e. recent but unspecified) (n = 1) (Andersson et al., 2008) or did not specify the timing between clinical rating scales and EEG (n = 8) (Baldeweg and Hirsch, 2015; Catts et al., 1995; Domján et al., 2012; Jahshan et al., 2012; Kim et al., 2020, 2019a, 2019b; Li et al., 2023).
Meta-regressions examining the relationship between MMN effect sizes and PANSS-positive (n = 7), PANSS-negative (n = 7) or YMRS (n = 9) scores revealed no significant associations: PANSS positive (β = 0.015, SE = 0.043, z = 0.34, p = 0.733, 95% CI [−0.070, 0.099]); PANSS negative (β = 0.000, SE = 0.103, z = 0.00, p = 0.999, 95% CI [−0.201, 0.201]); and YMRS (β = 0.016, SE = 0.099, z = 0.17, p = 0.869, 95% CI [0.177, 0.209]). Furthermore, meta-regression examining the relationship between MMN amplitude and the proportion of participants with psychotic features (n = 8) revealed no significant association (β = −0.001, SE = 0.005, z = −0.26, p = 0.796, 95% CI [−0.012, 0.009]). This suggests that symptom severity was not a significant moderator of MMN amplitude differences between the BD and control groups.
Analysis of variance
The meta-analysis of variance showed no significant difference in MMN amplitude variability between patients and controls. While there was moderate heterogeneity across studies (I² = 45.1%), the average variance ratio was close to zero (logVR = −0.03). However, drawing firm conclusions regarding differences in variance between groups may be limited by the statistical power of the analysis.
Sensitivity analysis
A sensitivity analysis was conducted to assess whether including the duration deviant types only, without the frequency deviants, influenced the meta-analysis results. When the MMN amplitude values for duration deviants were replaced with the results for frequency deviants, the result remained significant (SMD = 0.43, 95% CI [0.24, 0.62], p < 0.0001), suggesting that the choice of deviant type (duration vs. pitch) did not substantially influence the meta-analytic results.
MMN latencies
To examine any difference in MMN latencies between the BD and control groups, a further meta-analysis was performed. Effect sizes for studies that reported MMN latencies were calculated from the 4 studies that reported them, including 85 participants with BD and 123 controls (Andersson et al., 2008; Domján et al., 2012; Li et al., 2023; Umbricht et al., 2003) (Figure 5). Consistent with the meta-analysis of MMN amplitudes, where studies reported separate MMN latencies for frequency and duration deviants, values for duration deviants only were included. The results indicated that MMN latencies were not significantly different between BD and control groups (SMD = 0.104, 95% CI [−0.360, 0.568], p = 0.662), and this result remained non-significant even when frequency deviants were included in an exploratory analysis.
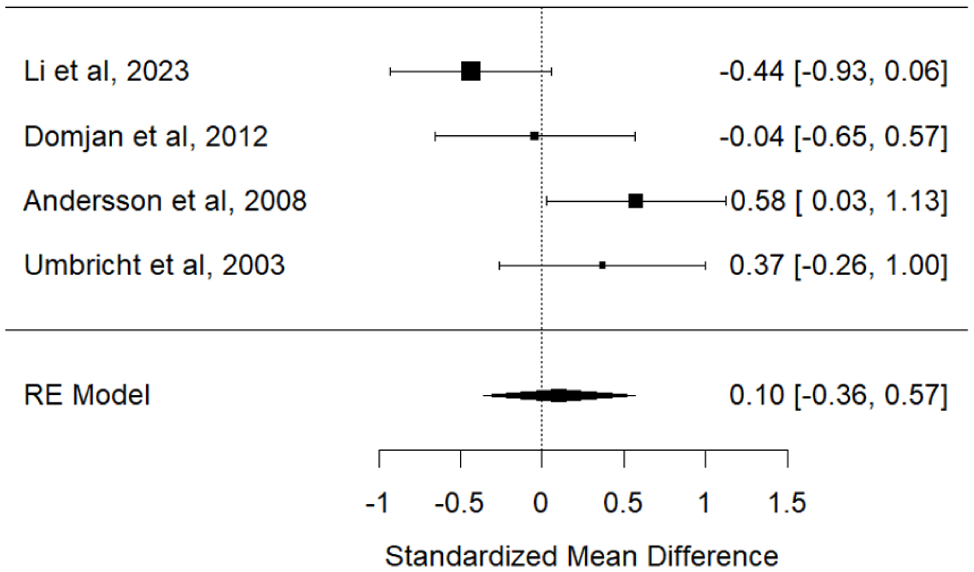
Forest plot of MMN latency.
Discussion
The main finding from this meta-analysis is that the MMN is significantly diminished in individuals with bipolar disorder (BD) compared with healthy controls. The effect size presented here (SMD = 0.47) is lower than the effect sizes observed for schizophrenia in a previous meta-analysis (SMD = 0.99) (Umbricht and Krljes, 2005); nonetheless, this finding implies that MMN deficits are not unique to schizophrenia. Varying degrees of MMN deficits have been observed in conditions including depression (Tseng et al., 2021), ADHD (Cheng et al., 2016), autism (Chen et al., 2020), Parkinson’s psychosis (Vignando et al., 2024), and throughout ageing (Cheng et al., 2013), albeit with smaller effect sizes, as well as in clinical high-risk states, where reduced MMN has been associated with transition to psychosis (Kayser et al., 2014). This may suggest that the MMN deficits in BD could relate to a common genetic or neurodevelopmental risk for psychopathology. Interestingly, a neurodevelopmental phenotype (NDP) of BD was recently identified, characterised by early-onset comorbidities (including ADHD), poorer clinical outcomes and reduced lithium responsiveness (among other factors) (Lefrere et al., 2025). The NDP load correlated significantly with polygenic risk scores for ADHD. Therefore, whether the MMN deficits observed in BD could relate to a neurodevelopmental subtype is an interesting avenue for future study. While this hypothesis is consistent with our finding of no significant relationship between symptom severity (measured by PANSS positive, PANSS negative, and YMRS) and MMN amplitude, it is not consistent with our finding of no significant difference in the variability of MMN effect sizes between BD and controls. Furthermore, we found no significant relationship between the MMN amplitude and the proportion of participants on anti-psychotics or mood-stabilising medication. However, this analysis was confounded by multiple medication use among participants.
Most studies grouped BD1 (typically associated with psychotic symptoms) and BD2 participants together, obscuring interpretation of the relationship between MMN deficits and psychotic symptom severity. Nonetheless, no relationship between psychosis history (measured as the proportion of BD participants who had a lifetime history of psychotic symptoms) and MMN amplitude was found. Our findings are consistent with other studies, which show no relationship between MMN deficits and psychotic symptom severity (Erickson et al., 2017). A previous meta-analysis showed people at high risk of psychosis had MMN deficits prior to psychotic symptom expression, suggesting that it may serve as a predictive marker of conversion to schizophrenia (Erickson et al., 2016). Future studies should examine MMN separately in BD1 and BD2 to clarify the specificity of MMN deficits to psychotic phenotypes and whether MMN can predict disease onset in BD. Given the lack of data, an analysis of MMN changes across illness phases was not possible in this meta-analysis.
MMN amplitude was not significantly moderated by demographic or clinical variables such as age, sex, illness duration, or bipolar subtype. The findings for illness duration are consistent with a previous meta-analysis, where MMN deficits did not linearly relate to illness duration in schizophrenia (Erickson et al., 2016). However, Erickson et al. (2017) did not control for the effect of deviant type, and other evidence suggests that the MMN to frequency deviants may relate to schizophrenia disease progression (Umbricht and Krljes, 2005). Given the limited studies using frequency deviants in our meta-analysis, whether they may predict disease progression in BD remains unexplored.
The biological basis for MMN deficits in BD remains unclear. The predictive coding framework, which proposes that the MMN reflects prediction errors (Friston, 2005) arising from pyramidal neurons in supragranular layers (Garrido et al., 2009), unifies both the adaptation (May et al., 1999) and memory-based models (Schmidt et al., 2013; Winkler, 2007). Dynamic causal modelling has shown that it is a combination of both local adaptation (intrinsic gain) and synaptic plasticity (extrinsic connectivity) that best explains MMN generation. Importantly, both of these processes are modulated by N-methyl-D-aspartate receptor (NMDAR) (Schmidt et al., 2013). Psychopharmacology antagonist studies have shown that the MMN is diminished by NMDAR hypofunction (Javitt et al., 1996; Rosburg and Kreitschmann-Andermahr, 2016), a mechanism central to the pathophysiology of schizophrenia. MMN reduction in schizophrenia has been related to loss of excitability of pyramidal cells in bilateral inferior frontal areas, using biophysical modelling (Adams et al., 2022). While NMDAR hypofunction is not considered a key pathophysiology in BD, MMN deficits in BD may support the involvement of the NMDA system in its pathophysiology (Raggi et al., 2022). Post-mortem studies suggest there may be NMDAR hypofunction in prefrontal, superior temporal cortex, anterior cingulate cortex, and hippocampus of BD individuals (Weiss et al., 2023). It is possible that the weaker MMN deficits observed in BD may reflect a weaker deficit in NMDAR function. Another hypothesis is that increased glutamate transmission in BD (Jun et al., 2014) may lead to downregulation of NMDARs across disease progression (Weiss et al., 2023); however, we found no relationship between duration of illness and MMN deficits in the present study. Alternatively, there may be involvement of non-NMDAR systems, for example, MMN amplitude increases have been observed following serotonergic modulation with escitalopram (Wienberg et al., 2010), suggesting the involvement of other neurotransmitter systems which are related to affective symptoms. Future research which separates BD subtypes, and the influence on the specific classes of medication used (mood stabilisers, antidepressants and antipsychotics), may provide greater insight on the biological basis of the MMN deficits observed in BD.
Subgroup analyses identified significant methodological moderators. Studies using duration deviants reported significantly larger group differences than those using frequency deviants. This is consistent with meta-analyses of schizophrenia (Umbricht and Krljes, 2005), major depressive disorder (Tseng et al., 2021) and ageing (Cheng et al., 2013) which show that duration deviants elicit stronger MMN differences in these populations compared with controls. This may be because group differences arise from both the longer duration and the deviant nature of the stimulus (which are confounded in the oddball paradigm); alternatively, the brain areas sensitive to duration may be more affected by neurodevelopmental risk factors. Furthermore, time discrimination deficits have been observed in BD; however, a recent meta-analysis suggests that these deficits are present for supra-second rather than sub-second discriminations, making an effect on MMN less likely (Escelsior et al., 2025). Sensitivity to deviant type may also depend on illness stage (Todd et al., 2008); however, characterisation of this in the present meta-analysis was not possible, as all studies reporting duration of illness included participants with over 8 years of illness, with the exception of one (Li et al., 2023). As only two studies used roving paradigms (Baldeweg and Hirsch, 2015; Pentz et al., 2023), limited conclusions may be drawn as to the relative utility of these paradigms in BD. Exploration of the relationship between frequency deviants and illness duration, and the use of duration deviants as predictors of disease onset, would be interesting avenues for future study.
This meta-analysis has several limitations. Firstly, no difference was found in MMN latency between BD and control groups, suggesting that MNN latency may be less sensitive to group differences in BD. However, limited conclusions may be drawn as this analysis was limited to n = 4 studies. In addition, many of our exploratory meta-regressions were limited by fewer than 10 studies reporting the moderator variable of interest meaning they are prone to Type II error. Many studies did not report clinical variables of interest, such as symptom ratings, and medication status. Where medication status was reported, participants were often on multiple medications, making interpretation of the effect of a specific medication difficult. Furthermore, clinical ratings were not consistently taken at the time of EEG recording. Examining the difference in MMN during various phases (depressed, euthymic, manic) of the illness would clarify whether there is any relationship between MMN and the specific symptom phases of the illness; however, the data were not available. Furthermore, examining the influence of previous psychotic symptoms was limited by a low number of studies reporting this variable. Given the limited number of studies which reported individual MMN values for BD subgroups, we are unable to clearly interpret the effect of subgroup on MMN deficits. In terms of statistical analysis, for the four studies which reported separate MMN values for deviant type, the values for the duration deviant were reported, to avoid non-independence of effect sizes. Therefore while most included studies used duration deviants, one study used deviants which differed in both duration and frequency. Sensitivity analysis confirmed that this did change the significance of the result. We were unable to examine the effect of paradigm type on MMN values, given the low number of studies using the roving paradigm. Finally, while excluding non-standard paradigms (e.g. emotional syllables) ensures consistency, this may miss affective prediction-error processes relevant to BD. See Table 2 for a summary of key methodological issues identified by this meta-analysis, with suggestions for future studies.
Open issues and future directions for MMN research in BD.
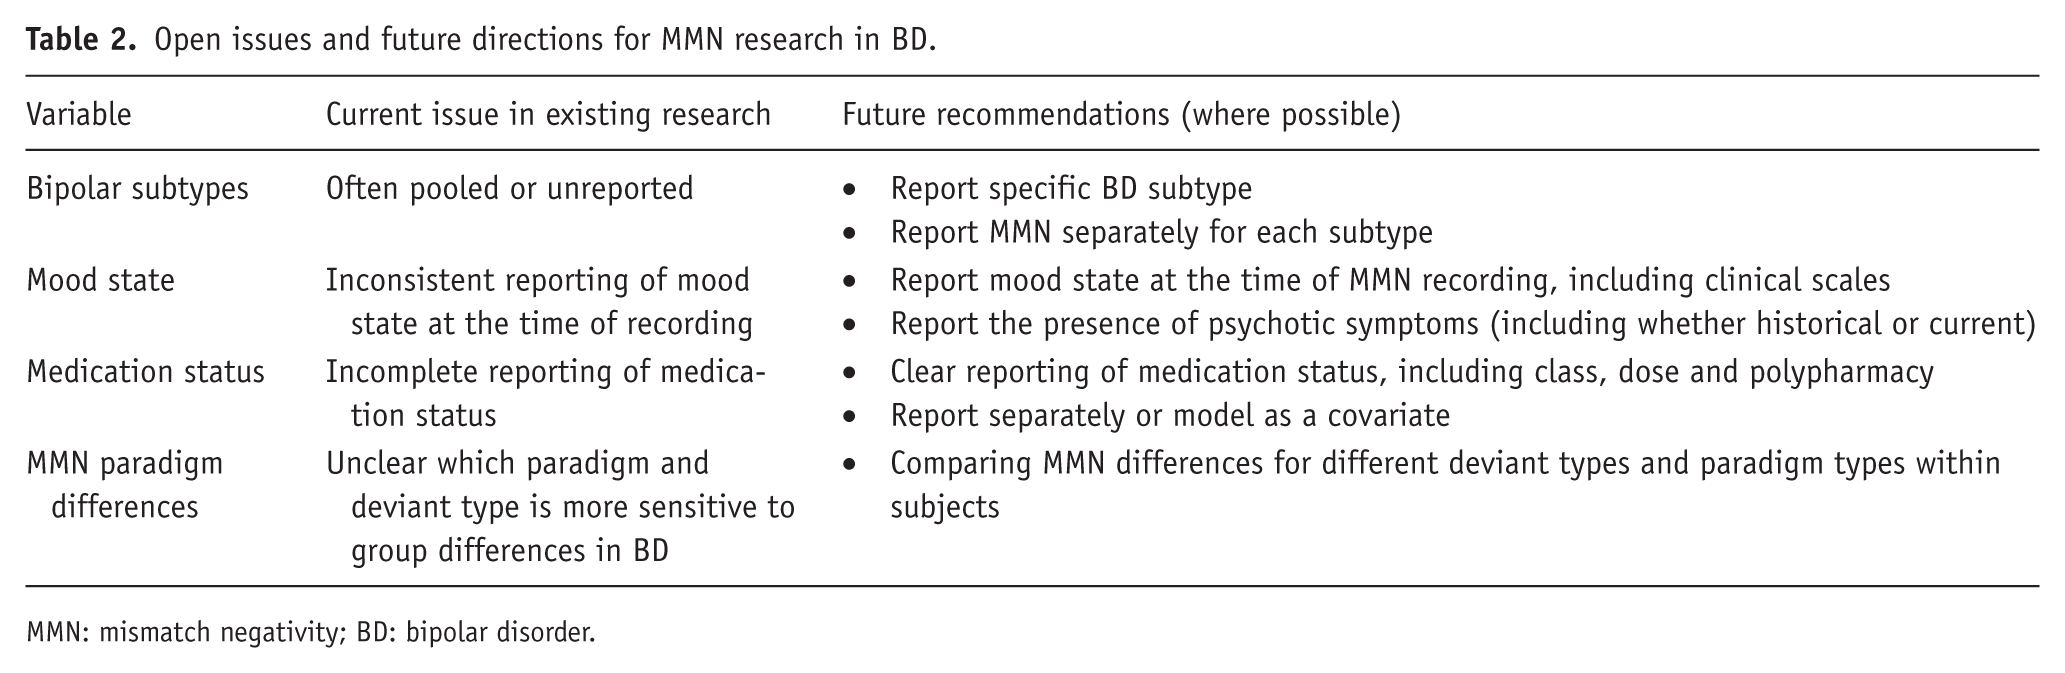
MMN: mismatch negativity; BD: bipolar disorder.
In conclusion, this meta-analysis suggests there are MMN deficits in bipolar disorder. However, the source of this deficit, and whether it relates to BD subgroups, or history of specific symptoms such as psychosis, remains unclear. We recommend that future studies separate BD subtypes, quantify psychosis history and medication status, and carefully consider paradigm and deviant type when designing studies. While the MMN has been suggested as a predictive tool in emerging psychotic disorders, whether this may translate to bipolar disorder requires further study.
Supplemental Material
sj-docx-1-jop-10.1177_02698811261436604 – Supplemental material for Mismatch negativity in patients with bipolar affective disorder: a systematic review and meta-analysis
Supplemental material, sj-docx-1-jop-10.1177_02698811261436604 for Mismatch negativity in patients with bipolar affective disorder: a systematic review and meta-analysis by Alice Caulfield, Rita Moura, Stefan Brugger, Allan H. Young, Mitul A. Mehta, Rick A. Adams and Katherine Beck in Journal of Psychopharmacology
Footnotes
ORCID iDs
Ethical considerations
Ethical approval was not required.
Author contributions
Conceptualisation: A.C., K.B.; Data curation: A.C., R.M.; Formal analysis: A.C.; Writing – original draft: A.C.; Writing – reviewing and editing: R.M., S.B., A.H.Y., M.M., R.A., K.B.; Supervision: S.B., A.H.Y., M.M., K.B.
Funding
The authors disclosed receipt of the following financial support for the research, authorship, and/or publication of this article: A.C. is a Wellcome Trust Doctoral Clinical Research Fellow (223486/Z/21/Z). K.B. has received funding from the Rosetrees Trust and Stoneygate Trust and National Institute for Health and Care Research (NIHR). R.A.A. is a Future Leaders Fellow (MR/W011751/1).
Declaration of conflicting interests
The authors declared the following potential conflicts of interest with respect to the research, authorship, and/or publication of this article:
M.A.M. is:
A consultant for Boehringer-Ingelheim, SoseiHeptares, and Neurocrine and sits on the advisory board for Quolet; has received speaker fees from Takeda; and has received grant funding from the National Institutes of Health Research, Alzheimer’s Research UK, the Wellcome Trust, UK Research and Innovation, Lundbeck, and SoseiHeptares.
A.H.Y. is:
Employed by Imperial College London; Honorary Consultant, South London and Maudsley NHS Foundation Trust (NHS UK)
Editor of Journal of Psychopharmacology and Deputy Editor, BJPsych Open, Paid lectures and advisory boards for the following companies with drugs used in affective and related disorders: Flow Neuroscience, Novartis, Roche, Janssen, Takeda, Noema pharma, Compass, Astrazenaca, Boehringer Ingelheim, Eli Lilly, LivaNova, Lundbeck, Sunovion, Servier, Allegan, Bionomics, Sumitomo Dainippon Pharma, Sage, Neurocentrx, Otsuka
Principal Investigator in the Restore-Life VNS registry study funded by LivaNova.
Principal Investigator on ESKETINTRD3004: “An Open-label, Long-term, Safety and Efficacy Study of Intranasal Esketamine in Treatment-resistant Depression.”
Principal Investigator on “The Effects of Psilocybin on Cognitive Function in Healthy Participants”
Principal Investigator on “The Safety and Efficacy of Psilocybin in Participants with Treatment-Resistant Depression (P-TRD)”
Principal Investigator on “A Double-Blind, Randomised, Parallel-Group Study with Quetiapine Extended Release as Comparator to Evaluate the Efficacy and Safety of Seltorexant 20 mg as Adjunctive Therapy to Antidepressants in Adult and Elderly Patients with Major Depressive Disorder with Insomnia Symptoms Who Have Responded Inadequately to Antidepressant Therapy.” (Janssen)
Principal Investigator on “An Open-label, Long-term, Safety and Efficacy Study of Aticaprant as Adjunctive Therapy in Adult and Elderly Participants with Major Depressive Disorder (MDD).” (Janssen)
Principal Investigator on “A Randomised, Double-blind, Multicentre, Parallel-group, Placebo-controlled Study to Evaluate the Efficacy, Safety, and Tolerability of Aticaprant 10 mg as Adjunctive Therapy in Adult Participants with Major Depressive Disorder (MDD) with Moderate-to-severe Anhedonia and Inadequate Response to Current Antidepressant Therapy.”
Principal Investigator on “A Study of Disease Characteristics and Real-life Standard of Care Effectiveness in Patients with Major Depressive Disorder (MDD) With Anhedonia and Inadequate Response to Current Antidepressant Therapy Including an SSRI or SNR.” (Janssen)
UK Chief Investigator for Compass; COMP006 & COMP007 studies
UK Chief Investigator for Novartis MDD study MIJ821A12201
Grant funding (past and present): NIMH (USA); CIHR (Canada); NARSAD (USA); Stanley Medical Research Institute (USA); MRC (UK); Wellcome Trust (UK); Royal College of Physicians (Edin); BMA (UK); UBC-VGH Foundation (Canada); WEDC (Canada); CCS Depression Research Fund (Canada); MSFHR (Canada); NIHR (UK). Janssen (UK) EU Horizon 2020
No shareholdings in pharmaceutical companies
The other authors declared no potential conflicts of interest with respect to the research, authorship, and/or publication of this article.
Supplemental material
Supplemental material for this article is available online.