
Abstract
Background:
For many patients with major depressive disorder (MDD) adequate treatment remains elusive. Neuroimaging techniques received attention for their potential use in guiding and predicting response, but were rarely investigated in real-world psychiatric settings.
Aims:
To identify structural and functional Magnetic Resonance Imaging (MRI) biomarkers associated with antidepressant response in a real-world clinical sample.
Methods:
We studied 100 MDD inpatients admitted to our psychiatric ward, treated with various antidepressants upon clinical need. Hamilton Depression Rating Scale percentage decrease from admission to discharge was used as a measure of response. All patients underwent 3.0 T MRI scanning. Grey matter (GM) volumes were investigated both in a voxel-based morphometry (VBM), and in a regions of interest (ROI) analysis. In a subsample of patients, functional resting-state connectivity patterns were also explored.
Results:
In the VBM analysis, worse response was associated to lower GM volumes in two clusters, encompassing the left hippocampus and parahippocampal gyrus, and the right superior and middle temporal gyrus. Investigating ROIs, lower bilateral hippocampi and amygdalae volumes predicted worse treatment outcomes. Functional connectivity in the right temporal and parahippocampal gyrus was also associated to response.
Conclusion:
Our results expand existing literature on the relationship between the structure and function of several brain regions and treatment response in MDD. While we are still far from routine use of MRI biomarkers in clinical practice, we confirm a possible role of these techniques in guiding treatment choices and predicting their efficacy.
Introduction
Major depressive disorder (MDD) is one of the most pervasive psychiatric disorders, with a lifetime prevalence of roughly 21% in the United States, 11% in Europe, and around 2%–6.7% in Asia (Hasin et al., 2018). It is a leading cause of disability worldwide (Friedrich, 2017) and may result in an increased risk of other ailments, including diabetes (Rotella and Mannucci, 2013), cardiovascular diseases (Van der Kooy et al., 2007) and Alzheimer’s disease (Green et al., 2003). Depressive disorders were the 13th leading cause of worldwide disability-adjusted life years (DALYs) and accounted for 37.3% of mental disorder DALYs in 2019 (GBD 2019 Mental Disorders Collaborators, 2022). Despite MDD’s high impact on global health, effective treatment for some patients remains elusive. Currently, the first line of treatment is antidepressant drug (AD) therapy, yet around 40% of patients do not respond to their first treatment (Hansen et al., 2008). Moreover, approximately two-thirds of patients do not achieve remission with first-line antidepressants, and a third of these patients fail to remit after multiple treatment options (Saragoussi et al., 2017; Warden et al., 2007). Currently, no predictive biological marker of treatment response is used in clinical practice, and therefore clinicians rely primarily on a trial-and-error approach to find appropriate treatments.
Neuroimaging techniques have shown promising results in identifying brain correlates predictive of treatment response in MDD. Concerning grey matter (GM) volumes, several studies found volumetric reductions, most notably in areas of the limbic system and frontal cortex, associated both with MDD diagnosis and treatment response (Enneking et al., 2020; Kang and Cho, 2020; Klok et al., 2019).
Lower hippocampal volumes are a consistent finding in MDD imaging (Campbell et al., 2004; Schmaal et al., 2016). In recent years, they have also emerged as one of the few robust structural predictors of poor antidepressant response (Enneking et al., 2020), with several studies, both specifically focused on the hippocampus or without a priori regions of interest (ROI) defined, reporting its association with treatment outcome in MDD patients (MacQueen et al., 2008; Nogovitsyn et al., 2020; Sämann et al., 2013). Other studies, however, did not find such an association (Bartlett et al., 2018; Phillips et al., 2015).
Closely related to the hippocampus, both anatomically and functionally, amygdala volumes have also been investigated regarding treatment response in depression. While larger bilateral amygdala volumes have been found to predict Electroconvulsive therapy (ECT) treatment response (Levy et al., 2019), results in studies investigating drug treatments have been more inconsistent (Enneking et al., 2020).
Another brain region consistently found to have lower volumes or cortical thickness in MDD patients compared to controls is the anterior cingulate cortex (Grimm et al., 2015; Schmaal et al., 2017; Wise et al., 2017); however, its relation to treatment response is unclear, with some authors reporting the association between lower thickness or volumes in this region and worse antidepressant response (Chen et al., 2007; Phillips et al., 2015), while others failing to find any effect (Fu et al., 2015).
Furthermore, several other brain regions in which reduced GM volumes appear to be associated with worse treatment response have been identified, including the dorsolateral prefrontal cortex, middle and inferior frontal gyri, orbitofrontal cortex, insula, fusiform and lingual gyri (Enneking et al., 2020). As suggested by a recent review, generally, lower GM volumes appear to be linked to worse treatment outcomes (Kang and Cho, 2020). On the other hand, a few studies have associated lower baseline GM volumes with better treatment response, particularly in right temporal regions (Liu and Gao, 2010; Sämann et al., 2013).
Together with structural neuroimaging, functional MRI has also been extensively used to investigate the association between resting state functional connectivity (rs-FC) and treatment response in MDD patients (Gerlach et al., 2022). The anterior cingulate cortex (ACC) is again among the most investigated brain regions: lower rs-FC between ACC, ventromedial prefrontal cortex and posterior cingulate cortex has been associated with better treatment response (Dunlop et al., 2017; Goldstein-Piekarski et al., 2018), as well as higher connectivity with right dorsolateral prefrontal cortex (Straub et al., 2017). The amygdala is another region intensively studied, with increased rs-FC with the opercular cortex and right middle frontal gyrus and decreased connectivity with bilateral orbitofrontal and posterior cingulate cortex found to be associated with better response (Cullen et al., 2016; Klimes-Dougan et al., 2018). Higher rs-FC between the insula, the prefrontal cortex, and the parahippocampal gyrus and lower between the insula and the opercular cortex has been associated with symptom remission (van der Wijk et al., 2022), and a study focused specifically on the hippocampi found higher rs-FC between the left hippocampus and left inferior frontal gyrus and precuneus in early responders (Xiao et al., 2021). In whole-brain connectivity analyses, baseline rs-FC between the default mode network (DMN) and the orbitofrontal cortex was negatively correlated with clinical improvement (Fu et al., 2015), while in another study, baseline rs-FC within the DMN and with the central executive network predicted treatment response (Chin Fatt et al., 2020). Meanwhile, functional connectivity in the salience network has been associated with clinical response to transcranial magnetic stimulation (TMS) in two studies (Ge et al., 2017; Iwabuchi et al., 2019). However, classical mass univariate statistical analyses suffer from the curse of dimensionality (i.e. the number of voxels is significantly higher compared to sample size), introducing significant biases in inferential statistics from high-dimensional data. These limitations can be addressed by functional connectivity multivariate pattern analyses (fc-MVPA), which captures spatially distributed activation patterns underlying behavioural outcomes and mental states, promoting the identification of new biomarkers for mood disorders (Zeng et al., 2012) and treatment response (Takamiya et al., 2021; Wang et al., 2019).
The majority of existing literature on brain correlates of antidepressant response focuses on the effect of drugs acting on monoaminergic systems. However, in recent years, studies investigating brain correlates of treatments with different mechanisms of action such as ketamine are beginning to emerge. Interestingly, they seem to again identify the hippocampus as a key region in affecting response, albeit with somewhat conflicting results: indeed if on the one hand Ketamine was found to be more effective in patients with relatively smaller left hippocampus (Abdallah et al., 2015), at the same time ketamine treatment was associated with increases in hippocampal volumes (Höflich et al., 2021) and mean diffusivity (Kopelman et al., 2023).
Current studies investigating structural and functional correlates of antidepressant treatment response have often been performed on small samples, without a multimodal approach, and focusing on a priori-determined ROIs.
Furthermore, studies employing a real-world approach are sparse, with many authors investigating the effect of a single drug treatment at a fixed dose. While this approach has some undoubted benefits, it nevertheless is often distant from the actual clinical management of depressed patients. Naturalistic studies on the other hand, despite being susceptible to the effect of confounding factors, may provide information more relatable to the real-world clinical picture.
Therefore, in the present study, our objective was to investigate cortical and sub-cortical GM regional volumes associated with drug treatment response in a large sample of MDD inpatients in a naturalistic clinical setting. We employed a whole-brain approach – with only a subsequent ROI-based analysis – with the aim of reducing the potential source of bias determined from the a priori choice of ROIs. The choice of ROIs was based on brain regions previously reported to affect MDD treatment response (Enneking et al., 2020). Furthermore, in a subsample of patients with available resting state functional MRI (rs-fMRI) data, we investigated the association between whole-brain rs-FC patterns and antidepressant response.
Methods
Participants
We studied 100 inpatients (F = 66; M = 34) with a diagnosis of MDD (DSM IV-TR criteria), consecutively admitted for a Major Depressive Episode (Table 1) to the Mood Disorder Unit at San Raffaele Hospital in Milan. Patients were referred for hospital treatment of a depressive episode by their general practitioners or psychiatrists in charge, and admitted after an interview with a staff psychiatrist. A significant proportion of patients was already receiving some form of drug treatment at the time of admission (Table 1). The discharge from the hospital occurred when their psychopathological conditions allowed for the continuation of treatment at home. Severity of depressive symptomatology was assessed via the 21-item Hamilton depression rating scale (HDRS), both at admission and discharge, by a trained psychiatrist (Hamilton, 1960).
Clinical and demographic characteristic of the sample.
All patients underwent a 3 T MRI scan within the first week upon admission. For 43 patients resting-state fMRI images were also acquired.
Exclusion criteria were age below 18 or above 70, additional diagnoses on axis I, mental retardation on axis II, pregnancy, major medical and neurological disorders, history of drug or alcohol abuse or dependency, and additional therapies besides drug treatment received during the hospital stay.
As commonly seen in MDD a relatively large proportion of our sample (21%) had a previous positive history of suicide attempt; however, after reviewing the attempts details no case of methods involving clear brain oxygen deprivation was identified.
Treatment was administered by the psychiatrist in charge of the patient upon clinical need. Patients were prescribed at least one antidepressant drug: according to our standard treatment protocols, selective serotonin reuptake inhibitors (SSRIs) were preferentially administered; drugs acting on serotonin and norepinephrine (serotonin-norepinephrine reuptake inhibitors, SNRIs) and tricyclic antidepressants were administered to patients who had not responded to SSRIs in their previous clinical history (Middleton et al., 2005). Add-on treatments for depression (bupropion, mirtazapine, low dosage aripiprazole or amisulpride, lithium) (Taylor et al., 2021), benzodiazepines and other hypnotic drugs were prescribed upon clinical need (Table 1 and Supplemental Table 1).
Drug treatment upon discharge was recorded for each patient; antidepressant dosages were converted into the equivalent dose of imipramine (Bollini et al., 1999).
After a complete description of the study was given to the participants, written informed consent was obtained. All the research activities were approved by the local ethical committee.
MRI data acquisition and preprocessing
T1 and T2*-weighted images were acquired on two 3.0 T scanners: 46 patients underwent a 3 T MRI scan in a Gyroscan Intera scanner, Philips, The Netherlands employing an eight channels SENSE head coil (T1-weighted MPRAGE sequences: TR 25.00 ms, TE 4.6 ms, field of view (FOV) = 230 mm, matrix = 256 × 256, in-plane resolution 0.9 × 0.9 mm, yielding 220 transversal slices with a thickness of 0.8 mm); 54 patients were acquired in a 3T Ingenia CX scanner, Philips, The Netherlands using a 32-channel sensitivity encoding SENSE head coil (T1-weighted MPRAGE sequence: TR 8.00 ms, TE 3.7 ms, FOV = 256 mm, matrix = 256 × 256, in-plane resolution 1 × 1 mm, yielding 182 transversal slices with a thickness of 1 mm).
For voxel-based morphometry (VBM) and ROI-based measures, images were processed by using the Computational Anatomy Toolbox (CAT12) preprocessing pipeline (Gaser et al., 2022) for statistical parametric mapping 12 (SPM12) (https://www.fil.ion.ucl.ac.uk/spm/) in Matlab R2016b, which also allows for the extraction of ROIs tissue volumes. This included segmentation into GM, white matter, and cerebrospinal fluid, bias regularization, non-linear modulation, and normalization to Montreal Neurological institute and Hospital (MNI) space using DARTEL to a 1.5 mm isotropic MNI template. GM images were smoothed with an 8 mm full width at half maximum Gaussian filter. Measures of total intracranial volume (TIV) were obtained.
Specific ROIs previously reported to influence treatment response in MDD were then selected (bilateral hippocampi, amygdalae and anterior cingulate cortex); their volumes were estimated according to the Neuromorphometrics Atlas and converted into percentage of TIV with the formula: (ROI Volume × 100)/TIV.
Regarding resting-state functional data, fMRI images included 200 sequential T2*-weighted volumes (interleaved ascending transverse slices covering whole brain, tilted 30° downward with respect to bicommissural line to reduce susceptibility artefacts in orbitofrontal region), acquired using an echo planar imaging pulse sequence (Repetition time (TR) = 2000 ms, echo time (TE) = 30 ms, flip angle = 85°, FOV = 192 mm, number of slices = 38, slice thickness = 3.7 mm, matrix size = 64 × 62 reconstructed up to 96 × 96 pixels). Six dummy scans before fMRI acquisition allowed obtaining longitudinal magnetization equilibrium. Total time of acquisition was 6 min and 56 s. T2*-weighted images were preprocessed using CONN toolbox (www.nitrc.org/projects/conn), running within SPM12. Preprocessing was performed according to a standard pipeline, which included: (i) realignment to a reference image in order to minimize variance due to head movements and unwarping; (ii) slice timing correction to ease temporal misalignment between slices; (iii) detection of potential outlier scans (subject motion above 0.9 mm and 0.02 rad or spikes in global signal intensity above five SD) by means of Artifact Detection Tool (ART, www.nitrc.org/projects/artifact_detect) – a threshold of 20% scans flagged as outliers was set to determine subject exclusion; (iv) normalization to a standard MNI space and segmentation of the brain into GM, white matter (WM) and cerebrospinal fluid (CSF) [tissues; (v) spatial smoothing with 8 mm full-width at half-maximum isotropic Gaussian kernel to improve the signal-to-noise ratio; (vi) removal of confounding effects via an anatomical component-based noise correction procedure (aCompCor), which involves WM, CSF, physiological noise source reduction (e.g. six standard motion parameters and ART-based ‘scrubbed’ signal artefacts) with relative derivatives, which were considered as covariates in first-level analyses; (vii) application of linear detrending for linear drift artefacts and high-frequency noise removal.
Statistical analysis
The percentage of HDRS decrease from hospital admission to discharge was calculated for each patient with the formula: ((HDRS T0 − HDRS T1) × 100)/HDRS T0.
We first investigated GM structures associated with change in depressive symptoms performing a VBM analysis. VBM is one of the most commonly applied techniques in neuroimaging studies (May and Gaser, 2006), allowing for a voxel-wise analysis of structural MRI data; furthermore it also allows for volumetric estimation of ROIs, yielding comparable accuracy when compared with Freesurfer or manual segmentation (Grimm et al., 2015).
VBM statistics were carried out within the general linear model framework, as implemented in SPM12: with no a priori ROI, percentage of HDRS decrease was entered as a variable of interest, and age, sex, baseline HDRS score, duration of hospitalization and antidepressant dose equivalents as nuisance covariates. Furthermore, to account for the two MRI scanners used, a ‘scanner’ covariate was added to all our analysis. After checking for design orthogonality, we applied global scaling transformation on intracranial volume (i.e. overall grand mean scaling) in accordance with CAT12 manual (http://www.neuro.uni-jena.de/cat12/CAT12-Manual.pdf). Absolute threshold masking was set at 0.01.
Provided that both smaller or larger GM volumes have been linked to treatment non-response (Enneking et al., 2020), the effect of percentage of HDRS decrease on GM volumes was initially tested in a two-sided F-contrast, with a Family Wise Error corrected threshold of significance (pFWE) < 0.05 at cluster level. Two post hoc one-sided T-contrast were then performed to test the positive or negative correlation of treatment response with brain volumes.
For the ROI values, considering the a priori expected interaction of categorical and continuous independent factors, we implemented a generalized linear model (GLZM) with a homogeneity of slope regression design and an identity link function (McCullagh and Nelder, 1989), entering the percentage of HDRS decrease as the dependent variable and normalized ROI volumes as independent variables; the same nuisance covariates used for the VBM analysis were entered into the model (age, sex, scan, admission HDRS score, duration of hospitalization and antidepressant dose equivalents). Parameter estimates were obtained with least squares maximum likelihood procedures. The significance of the effects was calculated with the likelihood ratio statistic (Douaud et al., 2021). False discovery rate (FDR) correction was applied via the Benjamini–Hochberg procedure (Benjamini and Hochberg, 1995). All the statistical analyses were performed with a commercially available software package (StatSoft Statistica 12, Tulsa, OK, USA).
Finally, fc-MVPA was implemented to explore the whole-brain rs-FC patterns associated with treatment response. Unlike commonly used multivariate pattern recognition approaches, such as machine learning classifiers, that extract information about the condition of interest from multivariate patterns (i.e. backward models), fc-MVPA is a forward model since it derives the shape of functional connectivity patterns specifically associated with the condition (Haufe et al., 2014). For each voxel, fc-MVPA estimates the functional connectivity maps between this voxel and the rest of the brain. Principal component analysis is then performed on subject’s connectivity maps to derive the low-dimensional representations that best capture the voxel-specific variability in functional connectivity patterns across individuals. A multivariate hypothesis testing is then performed on the lower-dimensional scores to assess differences between subjects in functional connectivity patterns. This procedure is repeated for each voxel in the brain to determine which brain regions show whole-brain between-subjects differences in functional connectivity patterns (Nieto-Castanon, 2022).
First-level fc-MVPA was performed using 64 dimensions. fc-MVPA-derived maps were then entered in the second-level analyses to examine the effect of percentage of HDRS decrease, including age, sex, scan, baseline HDRS score, duration of hospitalization and antidepressant dose equivalents as nuisance covariates. The resulting regions of significance represent clusters of voxels with similar between-subject variance in their spatial connectivity patterns in relation to the reduction of depressive symptomatology after treatment. Considering sample size, three components were kept for each voxel. Analyses were thresholded at peak level (p < 0.001, uncorrected; cluster level: p < 0.05 FWE-corrected). Since fc-MVPA is an omnibus test, post hoc seed-based connectivity analyses were performed considering the identified fc-MVPA clusters as seeds to explore how their functional connectivity with the rest of the brain changes according to the percentage of HDRS decrease.
To account for the non-linear relation between age and brain structure, all analyses were repeated adding age squared as a nuisance covariate. Furthermore, we performed an additional analysis on a subsample of patients with an age cut-off of 60 (n = 85). Additional analyses were also performed adding number of previous depressive episodes and history of treatment resistant depression (TRD) as nuisance covariates (see Supplemental Results).
Results
Clinical and demographic characteristics of the sample are summarized in Table 1. While we identified no differences between the whole sample and the fMRI subsample, when directly comparing patients with functional sequences with those with only structural sequences available, the latter exhibited higher baseline HDRS scores and a slightly lower time elapsed from hospital admission to MRI acquisition (Supplemental Table 3). Thirty-nine patients had a positive history for TRD, defined as failure to respond to a minimum of two treatments with adequate dosing and duration (Sforzini et al., 2022). Eighty-nine patients were already receiving AD drug treatment at the time of depressive relapse and admission; on the other hand, 11 patients were prescribed AD for the first time upon admission. Sixty-nine patients achieved episode remission upon discharge (HDRS score ⩽7), while 31 did not. The decrease in depressive symptoms was negatively correlated to the duration of hospitalization (r = −0.36, p < 0.001) and to the amount of prescribed antidepressants (r = −0.26, p = 0.008), possibly reflecting difficulty to treat.
Regional GM volumes associated with the decrease in the severity of depressive psychopathology. In the VBM analysis, the two-sided contrast identified two statistically significant clusters: the first encompassed the right superior and middle temporal gyrus and the temporal pole (cluster level pFWE < 0.001, k = 2097, F = 27.51); the second cluster comprised the left hippocampus and parahippocampal gyrus, left superior temporal gyrus and temporal pole (cluster level pFWE = 0.001, k = 1779, F = 19.76).
Post hoc one-tailed t tests analyses identified no cluster of negative correlation between percent HDRS decrease and brain volumes; while it confirmed a positive correlation analysis in the two clusters identified in the F-contrast (Cluster 1: right superior, middle and inferior temporal gyrus and temporal pole, cluster level pFWE < 0.001, k = 3503, T = 5.24; Cluster 2: left hippocampus and parahippocampal gyrus, left superior temporal gyrus and temporal pole, cluster level pFWE < 0.001, k = 2942, T = 4.44) (Table 2, Figure 1).
Grey matter volumes positively associated with treatment response.
Top: cluster identified in the VBM analysis; Bottom: results of the ROI analysis.
LR χ2: likelihood-ratio test; Estimate: raw regression coefficients estimates.
Brain regions identified in the VBM analysis where HDRS percentage decrease positively associated with regional GM volumes: (a) axial and (b) coronal.
These effects were confirmed when studying the relationship between GM volumes in ROIs and changes of HDRS scores with a multiple regression approach in the context of the GLZM. Worse AD treatment response, indicated by a lower percentage of HDRS decrease, was predicted by lower baseline volumes of bilateral hippocampi (Right: LR χ2 = 11.70, q = 0.002; Left: LR χ2 = 12.15, q = 0.002) and amygdalae (Right: LR χ2 = 6.51, q = 0.016; Left: LR χ2 = 9.08, q = 0.005). No effect was observed for ACC (Table 2).
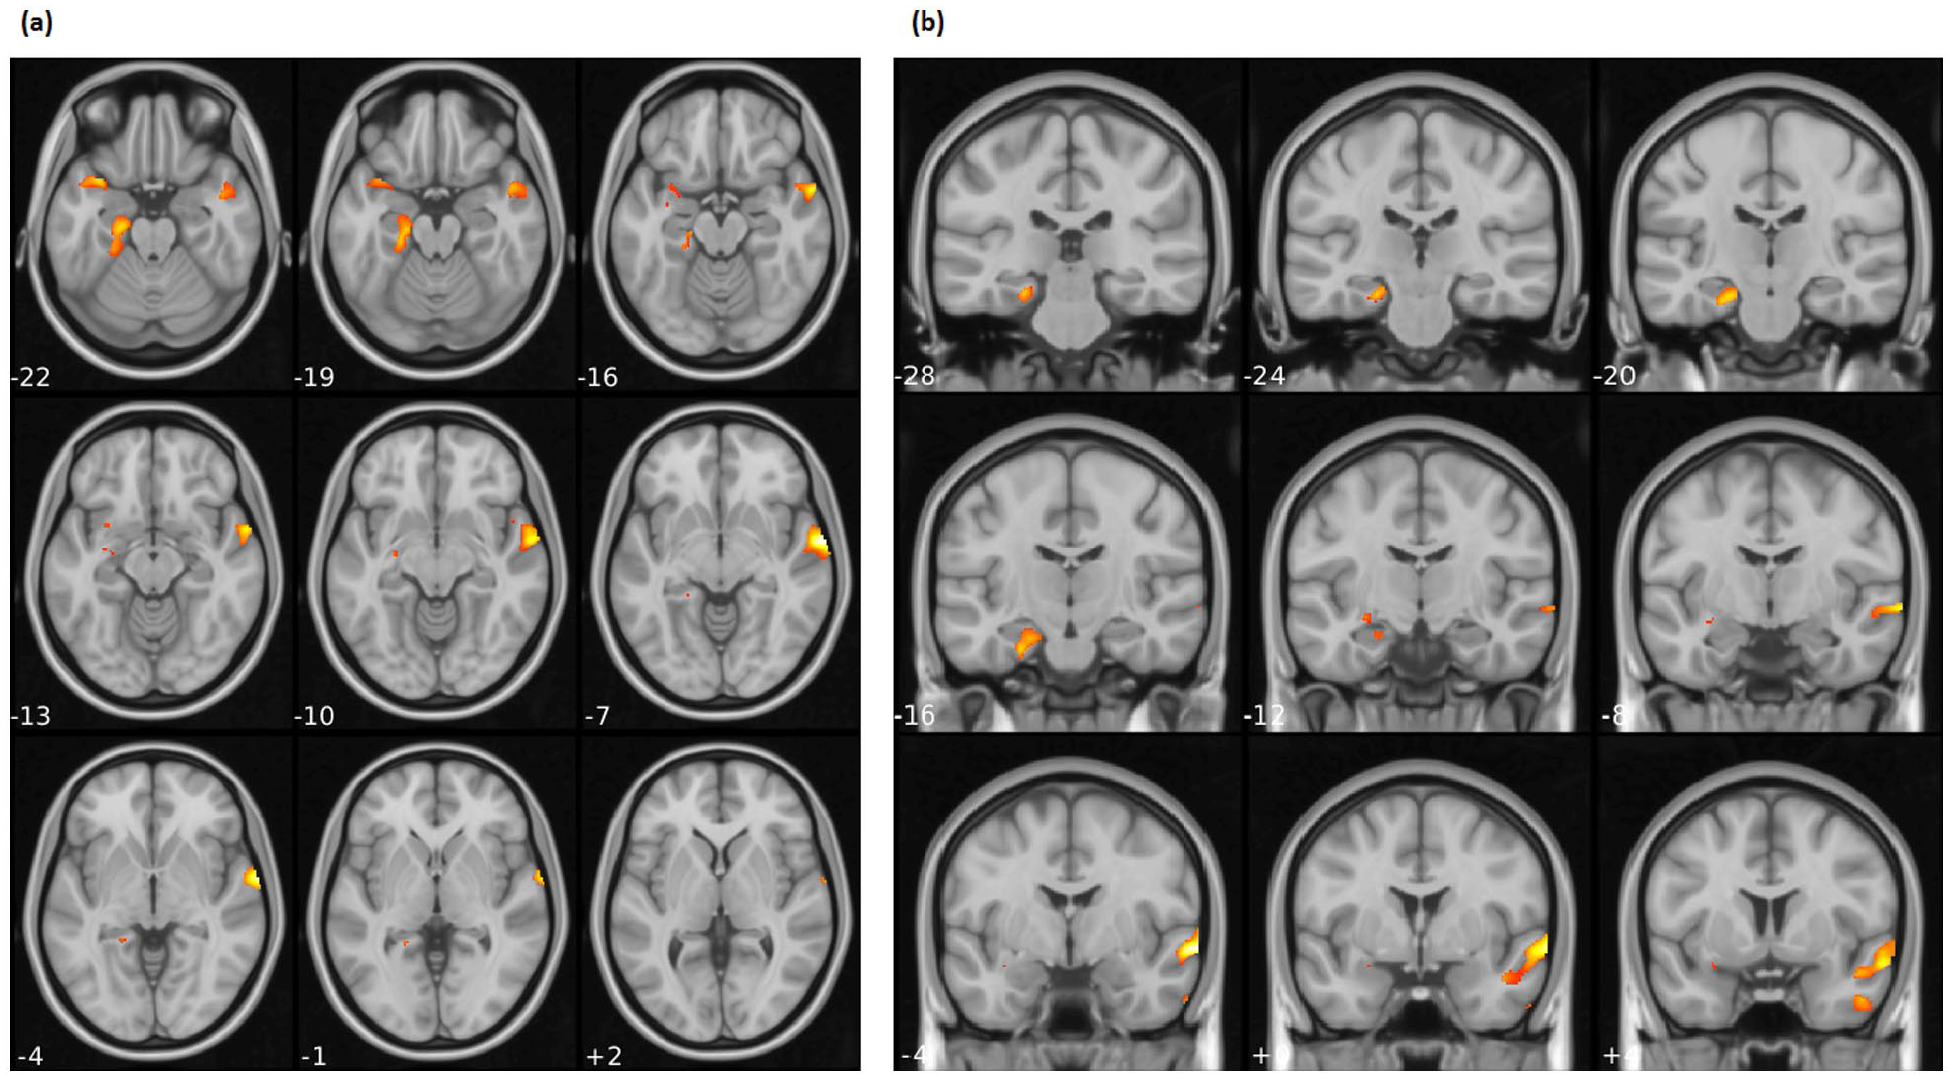
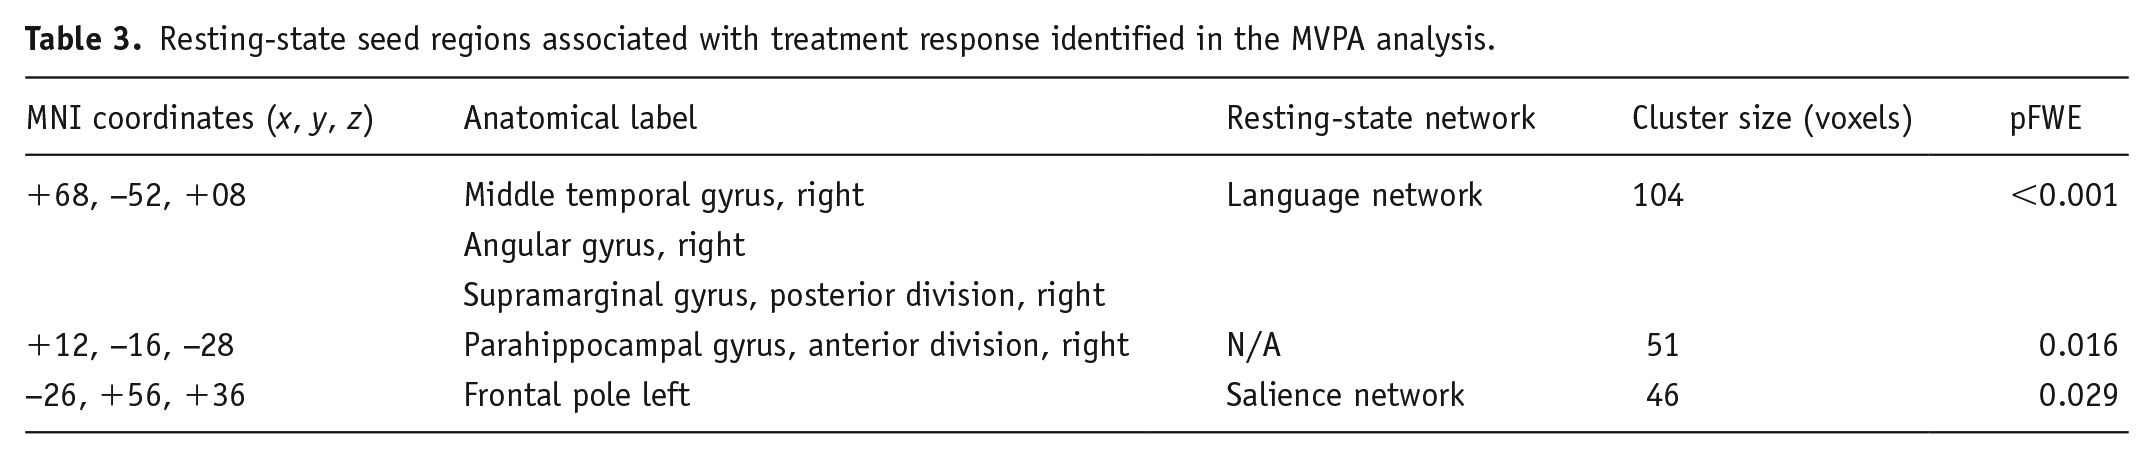
Resting-state functional connectivity also associated with percentage of HDRS decrease. Specifically, fc-MVPA analysis identified three clusters where changes in HDRS scores were significantly associated with rs-FC, which were localized in the right middle temporal gyrus (pFWE < 0.001), the right parahippocampal gyrus (pFWE = 0.016) and the left frontal pole (pFWE = 0.029) (see Figure 2 and Table 3). Post hoc seed-based analyses showed that HDRS decreases were negatively associated with rs-FC between the right middle temporal gyrus and regions located in the salience and sensorimotor networks, whereas the opposite pattern was observed for four clusters in the DMN. Considering the right parahippocampal gyrus as seed, the percentage of HDRS decrease negatively associated with connectivity to the DMN, while positively influenced connectivity with the dorsal attention and visual networks. A similar pattern was observed for the left frontal pole, where changes in the HDRS scores negatively affected the connectivity with a cluster in the DMN and positively associated with connectivity to clusters in the dorsal attention, cerebellar and sensorimotor networks (for detailed effects, see Figure 2 and Supplemental Table 2).
Association between Hamilton depression rating scale percentage decrease and resting-state functional connectivity from fc-MVPA seeds to target clusters: (a) seeds identified in the multivariate pattern connectivity analysis and (b) results of the post hoc seed-based connectivity analysis. 1: middle temporal gyrus, R; 2: parahippocampal gyrus, R; 3: frontal pole, L.
Resting-state seed regions associated with treatment response identified in the MVPA analysis.
Supplementary analyses were conducted to account for (1) the non-linear relation between brain volumes and age (entering age squared as a nuisance covariate and performing a second analysis on a subsample of patients with an age cut-off of 60), (2) the recurrence of depression (entering the number of previous depressive episodes as a nuisance covariate) and (3) a previous history of TRD (entering history of TRD as a nuisance covariate). Results largely overlapped those of the main analyses with the exception of the VBM analysis in the subsample, in which the left hippocampus exhibited only a trend towards significance (p = 0.051), and the rs-fMRI analysis with history of TRD as an additional covariate, in which the left parahippocampal cluster was no longer significant (see Supplemental Result).
Discussion
The main finding of the present study is that regional brain GM volumes at hospital admission associate with response to antidepressant treatment in patients with MDD. In particular, larger hippocampal volumes were found to be associated with better antidepressant response. This effect was first identified for the left hippocampus and parahippocampal cortex in the whole-brain VBM analysis, and confirmed in the ROI analysis, with lower volumes of both hippocampi predicting worse treatment response.
A predictive effect of hippocampal GM volumes on antidepressant response is in accordance with several previous studies performed on smaller samples (MacQueen et al., 2008), using MRI scans with lower magnetic field strength (Sämann et al., 2013) or not employing a voxel-wise approach (Nogovitsyn et al., 2020).
Lower hippocampal volumes are a common finding in patients suffering from MDD (Schmaal et al., 2016) and have also been correlated with the duration of untreated depressive episodes (Sheline et al., 2003). Two recent meta-analyses specifically identified lower volumes of the left hippocampus as a structural characteristic of MDD (Gray et al., 2020; Wise et al., 2017).
Two main hypotheses have been put forward to explain reduced hippocampal volumes in MDD: the neuroplasticity hypothesis connects volume reduction to morphological changes in hippocampal neurons, while the neurogenesis hypothesis postulates that reduced formation of new neurons in the dentate gyrus is responsible for volumetric reductions. Elevated glucocorticoid levels in response to chronic stress are thought to play a role in both postulations (Boku et al., 2018).
A widely held view today is that antidepressant drug treatment may exert its effect, at least partially, by increasing hippocampal neuroplasticity and possibly neurogenesis, thus opposing or even reversing the effects of stress on the brain. The ability of multiple classes of AD treatments and ECT to increase hippocampal neurogenesis has been repeatedly demonstrated and has been hypothesized to be their common mechanism of action (Malberg et al., 2021). Furthermore, preclinical studies demonstrated that impaired hippocampal neurogenesis – obtained via X-irradiation of the mouse brain – cancelled the beneficial effects of antidepressants on depressive-like behaviours (Santarelli et al., 2003). We can therefore speculate that impaired hippocampal neuroplasticity/neurogenesis homeostatic mechanisms in our patients, possibly revealed by lower hippocampal volumes upon brain MRI, could be responsible for the blunted antidepressant treatment response.
Our VBM analysis also identified a second cluster, comprising the right superior and middle temporal gyri, in which greater volumes were associated with better response. This result contradicts two previous studies that found lower volumes in these brain regions associated with better antidepressant treatment response (Liu and Gao, 2010; Sämann et al., 2013). However, a recent meta-analysis stressed the need to investigate the relation between right temporal areas and response in depression, provided that only these two studies reported significant associations, that the direction of the effect is opposite to what is usually found and expected, and that no analogous result has been identified for studies investigating structural correlates or treatment response to ECT or cognitive behavioral therapy (CBD) (Enneking et al., 2020). Following the publication of the meta-analysis, a new VBM study identified lower volumes of the right superior temporal gyrus in non-responders MDD patients (Meng et al., 2020); therefore, our result appears to be in line with this latter study, associating volumetric reductions in right temporal areas to worse treatment response.
Lower GM volumes in bilateral temporal regions appear to be a consistent finding in patients with MDD (Gray et al., 2020; Wise et al., 2017) and have also been reported in patients with treatment-resistant depression (Ma et al., 2012; Serra-Blasco et al., 2013). Lower volumes of the right superior temporal gyrus have also been repeatedly associated with a history of suicide attempts in adolescents and have been proposed as a marker of suicidality in this age group (McLellan et al., 2018; Peng et al., 2014). Interestingly, albeit this association being still controversial, suicidal ideation and behaviour have been reported to occasionally worsen after antidepressant treatment in adolescents and young adults (Brent, 2016).
The superior and middle temporal gyri and the temporal pole, while classically thought to be implicated in sensory information processing, are also important for emotional processing and social cognition (Takahashi et al., 2010). Volumetric reductions in these areas could therefore contribute to the impaired emotional and memory processing in depression, and also have an impact on symptomatology resolution after treatment.
In our ROI analysis, bilateral amygdala volumes were found to predict depressive symptom reductions. The amygdala is one of the primary sites for emotion regulation (Hamilton et al., 2008) yet despite being anatomically and functionally close to the hippocampus, previous results on amygdale volumes and treatment response in depression are much less consistent. The amygdalae have been shown to have lower volumes in MDD patients compared to healthy controls (HC) and to increase after successful drug or ECT treatment (Gryglewski et al., 2019; Tang et al., 2007; Tendolkar et al., 2013). Larger pre-treatment amygdala volumes have also been shown to predict better ECT treatment response (Levy et al., 2019; Ten Doesschate et al., 2014). Yet, at the same time, reports of larger amygdala volumes in treatment-resistant patients compared to treatment-responsive individuals and healthy controls (Sandu et al., 2017) have been published, while other studies found no effect of amygdala volumes on treatment response (Fu et al., 2015). Interestingly, a meta-analysis reported increased amygdale volumes in medicated depressed patients and decreased volumes in un-medicated ones when compared to healthy controls, prompting the authors to hypothesize an antidepressant-mediated increase of neurotrophic factors and neurogenesis with protective activity against stress-related neurotoxicity (Hamilton et al., 2008).
Finally, both in the VBM and in the ROI analysis, we found no effect for ACC volumes on treatment response. Reduced GM volumes of the ACC are an established structural correlate in MDD patients (Wise et al., 2017). At the same time, their relationship with treatment response is much less clear, with studies reporting lower volumes associated with lower rates of response (Chen et al., 2007; Phillips et al., 2015; Sämann et al., 2013), while others fail to find such an association, as we did (Bartlett et al., 2018; Fu et al., 2015; Jung et al., 2014).
Findings from VBM and ROI analyses were also paralleled by analogous results from fc-MVPA, providing preliminary insights on a possible association between structural and functional correlates of treatment response. Responsiveness to treatment increased the rs-FC between the middle temporal gyrus and regions located in the DMN, whereas the inverse pattern was observed for the salience and sensorimotor networks. Although previous studies on treatment response found that lower within-network DMN connectivity was associated with better treatment outcomes (Dichter et al., 2015), other studies in late-life depression reported increased DMN connectivity in lateral and posterior regions, including the middle temporal gyrus, and decreased DMN connectivity in frontal areas following Venlafaxine and escitalopram treatment (Karim et al., 2017; Kilpatrick et al., 2022). These findings suggest that antidepressant medications induce a ‘rebalance’ of DMN connectivity by increasing the functional connectivity in the posterior portions of the DMN while decreasing the frontal ones (Dichter et al., 2015; Karim et al., 2017).
Treatment response also influenced functional connectivity in the frontal pole, which is commonly thought to play a key role in self-reflection, long-term goals, past or future events or hypothetical scenarios (Addis et al., 2007). In treatment-resistant MDD patients, the frontal pole has been shown to be functionally hyperconnected with the DMN and disconnected with regions located in the salience networks (Fettes et al., 2018), and reduction of frontal pole neural activity has been proposed as an index of success of neuromodulation techniques (Downar and Daskalakis, 2013) and cognitive-behavioural therapy (Katayama et al., 2022). Interestingly, in treatment-resistant depressive patients, the frontal pole is functionally hyperconnected with the DMN and disconnected with regions located in the salience networks (Fettes et al., 2018). Our results are in line with these findings, suggesting that lower baseline functional connectivity between the frontal pole and the DMN might promote successful treatment response.
Finally, we also found that rs-FC of the right parahippocampal gyrus was modulated by response to treatment. Lower activation and smaller GM volume in this region have been previously linked to impairments in contextual associations and negative thinking in depression, possibly representing a candidate neural correlate of rumination in MDD (Harel et al., 2016). Considering the relationship with response to antidepressant treatments, a recent meta-analysis of fMRI studies highlighted the role of hippocampal structures in predicting treatment outcomes in MDD (Li et al., 2022). Specifically, increased short-range functional connectivity strength in the right parahippocampal gyrus was observed after 8 weeks of escitalopram treatment, suggesting that antidepressant treatment normalizes the diminished parahippocampal rs-FC observed in MDD patients at the baseline (An et al., 2017; Wang et al., 2015). Our results further support this evidence, underlining the role of the parahippocampal gyrus as a target for antidepressant treatments.
Supplementary analyses were conducted to account for the non-linear relation between age and brain volumes, recurrence and previous history of TRD; they largely confirmed our results, with the exception of the VBM analysis performed on a younger subsample, where left hippocampal volumes had only a trend towards significance; this might suggest that hippocampal volumes have a stronger effect on treatment response with increased age. However, conducting the ROI analysis in the subsample, lower bilateral hippocampal volumes were still found to affect treatment efficacy.
Concerning resistant depression, as to be expected in real-world clinical settings, patients presented various levels of resistance to previous treatments. Our study focused on brain correlates associated with response to the current depressive episode, but we acknowledge that a previous history of resistance might have a strong impact in this regard. A positive history of TRD didn’t appear to significantly influence the association between brain structure and response to the current episode; however, the addition of the TRD covariate to the rs-fMRI analysis rendered the influence of the parahippocampal cluster on response no longer significant. Future studies with larger rs-fMRI samples could properly address this issue, investigating functional connectivity patterns in TRD and non-TRD patients.
This study has several limitations. The recruitment in a single centre and the absence of a control group limit the generalizability of our findings: in particular, we cannot infer how the response correlates we identified would compare to brain structure and function of healthy volunteers. Furthermore, given the naturalistic design of our study, we couldn’t implement methods commonly used in RCTs to reduce possible sources of bias, such as randomization, blinding and the presence of a placebo group.
Subjects were administered a wide variety of drug treatments after admission: we tried to control for the effect of antidepressant doses using imipramine equivalents, but we couldn’t control for the whole complexity of prescribed drug treatments, nor we could account for the effect of drugs prescribed before hospital admission. As commonly seen in MDD, a relatively large proportion of our sample (21%) had a previous positive history of suicide attempt, which could be affected of affect brain structure (Campos et al., 2021); however, after reviewing the suicide attempts details no case of methods involving clear brain oxygen deprivation was identified.
Depressive symptomatology wasn’t assessed at fixed intervals but at admission and discharge, possibly entering a source of bias in our results. However, the degree of change in depressive symptoms was inversely correlated to duration of hospitalization and dose of antidepressant prescribed, suggesting a link with resistance of each patient to prescribed pharmacotherapies. Resting-states fMRI sequences were available only for a subset of patients. Future studies including larger cohorts and multicentre consortia are needed to provide more reliable and realistic functional markers of treatment response also useful in clinical practice.
In our study we observed relatively high rates of clinical improvements. This must be seen in light of several elements: patients that received physical therapies (electroconvulsive therapy or transcranial magnetic stimulation), by definition resistant to drug treatments, were excluded from the analysis; furthermore, given the real-world nature of our study, no limitations were set on possible drug treatments administered and time of hospital stay, and most patients were discharged only after a significant clinical improvement. Our results appear in any case to be in line with previously reported remission rates in MDD patients of 65%–70% after multiple treatments (Warden et al., 2007). Furthermore, albeit the majority of patients (69%) reached episode remission, it is worth noting that the employed remission criteria (HDRS scores ⩽7) is not synonymous with the absence of symptoms, and several studies stress the presence of residual symptoms in remitted MDD patients (Israel, 2010).
Finally, the investigation was performed in a real-world setting: this approach has some undoubtable drawbacks, as it increases the heterogeneity of the sample, by definition lacks a control group and the possibility to randomize patients, rendering harder to establish a clear connection between the various treatments administered and the patients’ response. At the same time, compared to studies employing a single drug treatment with a fixed schedule, our study may provide information better connected to a realistic clinical setting and possibly closer to a translation into clinical practice.
Our study suggests that baseline structure and function of several limbic regions (hippocampus, parahippocampal gyrus and amygdala) affect patterns of response to drug treatment in MDD patients. Such regions have previously been found to be involved in MDD pathogenesis and antidepressant efficacy, and here we confirmed this association in a naturalistic setting with a multimodal neuroimaging approach. Furthermore, we identified a similar convergence of structural and functional data on regions located in the right temporal cortex, whose association with MDD treatment response is much less clear. Our results indicate that baseline volumetric reductions and patterns of resting-state functional connectivity of such regions also influence drug treatment efficacy in MDD patients.
While we are still far from routine use of MRI biomarkers of treatment response in clinical practice, more studies are providing promising results for their applicability. Larger multicentric studies are needed to confirm these MRI correlates of treatment response and evaluate their possible role in informing and guiding real-world therapeutic choices.
Supplemental Material
sj-docx-1-jop-10.1177_02698811231190859 – Supplemental material for Hippocampal and parahippocampal volume and function predict antidepressant response in patients with major depression: A multimodal neuroimaging study
Supplemental material, sj-docx-1-jop-10.1177_02698811231190859 for Hippocampal and parahippocampal volume and function predict antidepressant response in patients with major depression: A multimodal neuroimaging study by Marco Paolini, Yasmin Harrington, Federica Colombo, Valentina Bettonagli, Sara Poletti, Matteo Carminati, Cristina Colombo, Francesco Benedetti and Raffaella Zanardi in Journal of Psychopharmacology
Supplemental Material
sj-docx-2-jop-10.1177_02698811231190859 – Supplemental material for Hippocampal and parahippocampal volume and function predict antidepressant response in patients with major depression: A multimodal neuroimaging study
Supplemental material, sj-docx-2-jop-10.1177_02698811231190859 for Hippocampal and parahippocampal volume and function predict antidepressant response in patients with major depression: A multimodal neuroimaging study by Marco Paolini, Yasmin Harrington, Federica Colombo, Valentina Bettonagli, Sara Poletti, Matteo Carminati, Cristina Colombo, Francesco Benedetti and Raffaella Zanardi in Journal of Psychopharmacology
Supplemental Material
sj-docx-3-jop-10.1177_02698811231190859 – Supplemental material for Hippocampal and parahippocampal volume and function predict antidepressant response in patients with major depression: A multimodal neuroimaging study
Supplemental material, sj-docx-3-jop-10.1177_02698811231190859 for Hippocampal and parahippocampal volume and function predict antidepressant response in patients with major depression: A multimodal neuroimaging study by Marco Paolini, Yasmin Harrington, Federica Colombo, Valentina Bettonagli, Sara Poletti, Matteo Carminati, Cristina Colombo, Francesco Benedetti and Raffaella Zanardi in Journal of Psychopharmacology
Supplemental Material
sj-docx-4-jop-10.1177_02698811231190859 – Supplemental material for Hippocampal and parahippocampal volume and function predict antidepressant response in patients with major depression: A multimodal neuroimaging study
Supplemental material, sj-docx-4-jop-10.1177_02698811231190859 for Hippocampal and parahippocampal volume and function predict antidepressant response in patients with major depression: A multimodal neuroimaging study by Marco Paolini, Yasmin Harrington, Federica Colombo, Valentina Bettonagli, Sara Poletti, Matteo Carminati, Cristina Colombo, Francesco Benedetti and Raffaella Zanardi in Journal of Psychopharmacology
Footnotes
Acknowledgements
Not applicable.
Declaration of conflicting interests
The author(s) declared no potential conflicts of interest with respect to the research, authorship, and/or publication of this article.
Funding
The author(s) disclosed receipt of the following financial support for the research, authorship, and/or publication of this article: MP salary: Italian Ministry of University, XXXVI PhD cycle. FC salary: Italian Ministry of University, XXXVII PhD cycle. YH salary: Italian Ministry of University, XXXVII PhD cycle, FSE REACT-EU 2021 PON projects, Action IV.5. This work was supported by the European Union H2020 EU.3.1.1 grant 754740 MOODSTRATIFICATION, the Italian Ministry of Health, grant RF-2018-12367249 and the Italian Ministry of University and Scientific Research, grant A_201779W93T.
Data availability
Data available upon request.
Supplemental material
Supplemental material for this article is available online.
References
Supplementary Material
Please find the following supplemental material available below.
For Open Access articles published under a Creative Commons License, all supplemental material carries the same license as the article it is associated with.
For non-Open Access articles published, all supplemental material carries a non-exclusive license, and permission requests for re-use of supplemental material or any part of supplemental material shall be sent directly to the copyright owner as specified in the copyright notice associated with the article.