
Abstract
Background:
Experimental studies have investigated the effects of physical, psychological and pharmacological stressors (that induce state anxiety) on alcohol outcomes. However, no study has investigated the effects of state anxiety on alcohol outcomes, and the moderating role of drinking to cope (DTC) motives, using the 7.5% carbon dioxide (CO2) challenge.
Aims:
We aimed to investigate the relationships between state anxiety and alcohol-related outcomes (primarily alcohol choice). We also explored whether DTC motives moderated these relationships.
Methods:
We conducted two experiments using the 7.5% CO2 challenge (Studies 1 and 2) and an observational study (Study 3) (ns = 42, 60 and 219, respectively), to triangulate findings.
Results:
In Study 1, experimentally induced state anxiety increased alcohol choice (p < .001, ηp2 = .29). This finding was replicated in Study 2, but the effect was weaker (p = .076, ηp2 = .06). Furthermore, DTC moderated the effect (p = .013, ηp2 = .11). However, in Study 3 there was no clear evidence of an association between naturally occurring state anxiety and alcohol choice (b = 0.05, p = .655), or a moderating role of DTC (b = 0.01, p = .852).
Conclusions:
Experimentally induced, but not naturally occurring, state anxiety increases alcohol choice, although state anxiety levels were lower in the non-manipulated sample.
Keywords
Introduction
The self-medication hypothesis suggests that individuals with anxiety consume alcohol to cope with their symptoms (Khantzian, 1985, 1990, 1997), because they learn that alcohol can have anxiolytic and stress-reducing effects (Sayette, 1999; Sher and Levenson, 1982). According to this hypothesis, anxiety leads to alcohol use via negative reinforcement (Kushner et al., 2000). Some observational studies support the self-medication hypothesis, with evidence suggestive of a positive association between anxiety and subsequent alcohol use disorder (Dyer et al., 2019a). This has negative health implications. Drinking to cope (DTC) increases the risk of heavier alcohol consumption and alcohol problems (Kuntsche et al., 2005), which are major contributors to the global burden of disease (Rehm, 2011).
Several experimental studies have investigated the effects of physical, psychological and pharmacological stressors that induce state anxiety on alcohol outcomes (Thomas et al., 2012). Psychological stressors include the Trier Social Stress Test (TSST) that involves an interview and a public mental arithmetic task (Magrys and Olmstead, 2015), and guided imagery tasks where participants imagine a recent personal stressful situation (Fox et al., 2007). The TSST increases alcohol consumption in social drinkers (Magrys and Olmstead, 2015), and in combination with an alcohol cue reactivity procedure, it increases alcohol craving in detoxified alcohol-dependent individuals with comorbid post-traumatic stress disorder (Kwako et al., 2015). Guided imagery tasks have been found to increase alcohol craving (Fox et al., 2007) and intravenous alcohol self-administration in non-dependent binge drinkers (Ramchandani et al., 2018). In addition, negative mood induction procedures (Hardy and Hogarth, 2017) and noise stress (Shuai et al., 2020) increase alcohol choice (preference to enlarge alcohol versus food images). A recent meta-analysis of laboratory studies found higher alcohol use and alcohol craving following a negative affect manipulation than a control manipulation (Bresin et al., 2018). However, as the authors acknowledge, the methods of negative affect induction used in the reviewed studies likely target several different emotions (Bresin et al., 2018). Therefore, the physiological and emotional aspects of state anxiety cannot be isolated.
Furthermore, there is evidence that anxiety-induction effects are greater among individuals reporting high (versus low) DTC motives. For example, negative mood induction procedures increase alcohol seeking responses (Hogarth and Hardy, 2018b), alcohol choice (Hogarth et al., 2018) and the reinforcing value of alcohol (Rousseau et al., 2011) among individuals who report high compared to low levels of DTC. Some observational studies support the moderating role of DTC on the relationship between anxiety and alcohol use (Grant et al., 2009). However, we found no clear evidence that DTC moderates associations between generalised anxiety disorder (GAD) and alcohol use in a large cohort study of adolescent drinkers (Dyer et al., 2019b). DTC may instead moderate the relationship between state anxiety and alcohol outcomes. Exploring interactions between state and trait anxiety would also be informative, as the relationship between state anxiety and alcohol outcomes may depend on one’s disposition.
We conducted three studies to investigate the relationship between state anxiety and alcohol-related outcomes. Study 1 (experimental) investigated the effect of state anxiety on alcohol choice and alcohol cognitive bias using the 7.5% carbon dioxide (CO2) challenge, a reliable and safe human experimental model of anxiety (Bailey et al., 2005). The 7.5% CO2 inhalation increases self-reported state anxiety, as well as autonomic physiological and psychological symptoms of GAD (Bailey et al., 2011; Garner, 2015), including increased heart rate (HR), blood pressure (BP), and hypervigilance to threat (Garner et al., 2012). Previous studies have used higher CO2 concentrations to investigate the reverse causal relationship (i.e. the effects of alcohol on anxiety). For example, Cosci and colleagues found moderate doses of alcohol decreased panic symptoms in response to a 35% CO2 challenge in patients with panic disorder (2005) and healthy volunteers (2004). To the best of our knowledge, no study has investigated the effects of state anxiety on alcohol-related outcomes using the 7.5% CO2 challenge. We also explored associations of (a) coping-related drinking measures and (b) trait anxiety measures with magnitude of difference in alcohol choice and alcohol cognitive bias produced by CO2 inhalation.
Study 2 (experimental) aimed to replicate and extend Study 1. We investigated the effects of state anxiety on alcohol choice, alcohol craving, and alcohol approach tendencies. In addition, we explored whether these effects differed by DTC status. Study 3 (observational) examined whether the experimental effects in Study 1 could be replicated in an observational study of naturally occurring state anxiety. We tested the association between state anxiety and alcohol craving as a secondary outcome. We also explored whether (a) trait anxiety and DTC motives are associated with alcohol choice, craving and use, (b) state anxiety and DTC motives interactively predict alcohol choice and craving, (c) state anxiety and trait anxiety interactively predict alcohol choice and craving, and (d) trait anxiety and DTC motives interactively predict alcohol choice, craving and use.
We hypothesised that state anxiety would be positively related to alcohol choice (Studies 1, 2 and 3), cognitive biases towards alcohol cues (Study 1), approach tendencies to alcohol cues (Study 2), and alcohol craving (Studies 2 and 3). Secondly, we hypothesised that DTC would moderate the relationships between state anxiety and alcohol choice, alcohol craving (Studies 2 and 3) and approach tendencies to alcohol cues (Study 2).
Study 1
Method
Design
Study 1 was a laboratory experiment with a repeated measures design. There was a within-subjects factor of gas (medical air, 7.5% CO2), and an additional within-subjects factor of cue (alcohol, neutral) for the cognitive bias task. Gas and task order were counterbalanced to reduce carryover and order effects. The protocol was preregistered on the Open Science Framework (https://osf.io/7k4gw/), and ethics approval was obtained from the Faculty of Science Human Research Ethics Committee at the University of Bristol (28041635744).
Participants
We recruited 42 participants from the University of Bristol and local population. Participants were eligible if they were aged 18–50 years, in good physical and psychiatric health, consumed alcohol at least weekly, and consumed wine (for complete eligibility criteria, please see the protocol: https://osf.io/7k4gw/). Sample size was determined from a study that compared alcohol craving in response to stress-related (M = 3.5, SD = 5.4) and neutral (M = 0.3, SD = 1.3) imagery (equivalent to dz = 0.66 assuming a correlation of 0.5) (Fox et al., 2007). Cohen’s dz is the standardised mean difference effect size for within-subjects designs (Lakens, 2013). We used a more conservative effect size estimate of dz = 0.45 as we had a non-dependent sample, which required 42 participants to detect with 80% power at an alpha level of 5%.
Measures and materials
Gas mixtures
The gas mixture for the CO2 condition was 7.5% CO2/21% oxygen/71.5% nitrogen and the medical air condition was 21% O2 (BOC Ltd., UK). Gases were administered single-blind for safety reasons, using an oro-nasal mask (Hans Rudolph Inc., Shawnee, KS, USA).
Questionnaires
We measured state and trait anxiety using the Spielberger State-Trait Anxiety Inventory (STAI-S and STAI-T respectively) (Spielberger et al., 1983), positive and negative affect using the Positive and Negative Affect Schedule (PANAS) (Watson et al., 1988), and DTC using the Drinking Motives Questionnaire (DMQ) (Cooper, 1994). We also included the Eysenck Personality Questionnaire–Revised (EPQ-R) (Eysenck and Eysenck, 1991), Anxiety Sensitivity Index (ASI) (Reiss et al., 1986), Alcohol Expectancies Questionnaire (AEQ) (Brown et al., 1987), and Reasons for Drinking Questionnaire (RFDQ) (Zywiak et al., 1996).
Behavioural tasks
We measured percentage alcohol choice using the Concurrent Pictorial Choice Measure (CPCM) (Hardy and Hogarth, 2017). Instructions were: ‘In this task, you can view different pictures by choosing the LEFT or RIGHT thumbnail to enlarge’. Each trial presented a wine and food image (UK meals). After 2000 ms, ‘←or→’ appeared, and pressing the corresponding arrow key enlarged the selected image and removed the unselected image. The image remained on screen for 2000 ms, before an inter-trial interval of 1–2 s. Each of the 48 trials randomly selected from 12 wine and 12 food images, and the left–right position of food and wine images was also randomised (maximum of four trials in either position).
The validity of the CPCM as a sensitive measure of drug motivation is demonstrated by the finding that the proportion of drug choices reliably correlates with dependence severity in multiple drug user groups (Hardy et al., 2018). Drug choice can be increased by the presentation of drug cues (Hardy et al., 2017), decreased by drug devaluation (Hogarth and Chase, 2011), decreased by imposing costs on the drug choice (Hogarth and Hardy, 2018a), and increased by negative mood induction (Hogarth, 2020), and this latter effect can be attenuated by brief mindfulness therapy (Shuai et al., 2020).
A modified pictorial Stroop task measured cognitive bias towards alcohol cues. Participants identified the colour of the border (blue, green, red or yellow) surrounding a wine or neutral (non-alcoholic drink) image using the keyboard. There were 16 practice trials followed by two experimental blocks of 96 trials and 8 buffer trials each. Each block contained either wine or neutral images, and block order was randomised between participants. Tasks were created and run using E-Prime. We restricted recruitment to wine drinkers and restricted the tasks to wine stimuli (no other alcoholic drinks). This ensured that any effects were not weakened by participants seeing images of drinks that they do not regularly consume.
Procedure
Participants attended a 2.5-h test session following a telephone screening to assess basic eligibility. Participants provided written informed consent. We objectively assessed body mass index, recent alcohol consumption (AlcoDigital 3000 breathalyser) and smoking (Pico Smokerlyser), pregnancy and recent drug use (urine screen), and BP and HR (OMRON M6 blood pressure monitor). Psychiatric health (MINI-International Neuropsychiatric Interview) (Sheehan et al., 1998) and all other criteria were assessed by self-report. Participants completed baseline questionnaires (STAI-S, STAI-T, PANAS and ASI), and baseline BP and HR were recorded. Participants inhaled the gas (air or CO2) for 1 minute, then completed both computer tasks while continuing to inhale the gas. Inhalations lasted a maximum of 20 minutes. Immediately after each inhalation, BP and HR were measured, and participants completed the STAI-S and PANAS (based on the strongest effects felt during the inhalation). There was a 30-minute washout period between inhalations to reduce the possibility of carryover effects. Participants completed the EPQ-R, AEQ, DMQ and RFDQ, and were debriefed and reimbursed £20. Participants were phoned 24 h later to assess whether any adverse events had occurred.
Data analysis
Analyses were conducted using SPSS Statistics (IBM Corp, Armonk, NY, USA). We performed paired samples t-tests to check the internal validity of the state anxiety manipulation, by comparing subjective and physiological responses after CO2 versus air inhalations. Analyses were planned on alcohol craving, but due to researcher error craving data were not recorded. We conducted a paired samples t-test to investigate the effect of state anxiety on percentage alcohol choice, and a repeated measures analysis of variance (ANOVA) to investigate the effect of state anxiety on alcohol cognitive bias. Total errors and mean reaction times (RTs; correct responses only) for each cue were the dependent variables. Finally, using bivariate correlations, we explored associations of coping-related drinking cognitions and trait anxiety measures with the magnitude of difference in Stroop errors, Stroop RTs, and alcohol choice produced by the CO2.
Results
Study data and analysis code for the three studies are available from the University of Bristol’s Research Data Repository (https://data.bris.ac.uk/data/dataset/3f5vdlaicmwcm24vveqgg8cin6), DOI: 10.5523/bris.3f5vdlaicmwcm24vveqgg8cin6.
Participant characteristics
Participants (n = 42, 38% male) were aged between 19 and 35 years (M = 23.21, SD = 3.34). Trait anxiety and anxiety sensitivity scores ranged from 22 to 54 (M = 34.07, SD = 8.02) and 3 to 27 (M = 15.07, SD = 5.96), respectively. EPQ-R scores ranged from 5 to 32 (M = 15.40, SD = 5.22) for extraversion, 1 to 21 (M = 8.88, SD = 5.04) for neuroticism, 1 to 15 (M = 7.24, SD = 3.50) for psychoticism, and 0 to 16 for the lie scale (M = 8.19, SD = 3.68). RFDQ negative affect scores ranged from 0 to 50 (M = 16.33, SD = 14.00), AEQ-tension reduction scores ranged from 14 to 36 (M = 26.52, SD = 5.44), and DMQ-coping scores ranged from 5 to 20 (M = 10.29, SD = 3.86).
Manipulation check
State anxiety, negative affect, BP and HR were higher, and positive affect was lower, after the CO2 inhalation versus the air inhalation, confirming that our experimental manipulation was successful (Table 1).
Differences in state anxiety, positive and negative affect, and cardiovascular measures, following the CO2 and air inhalations.
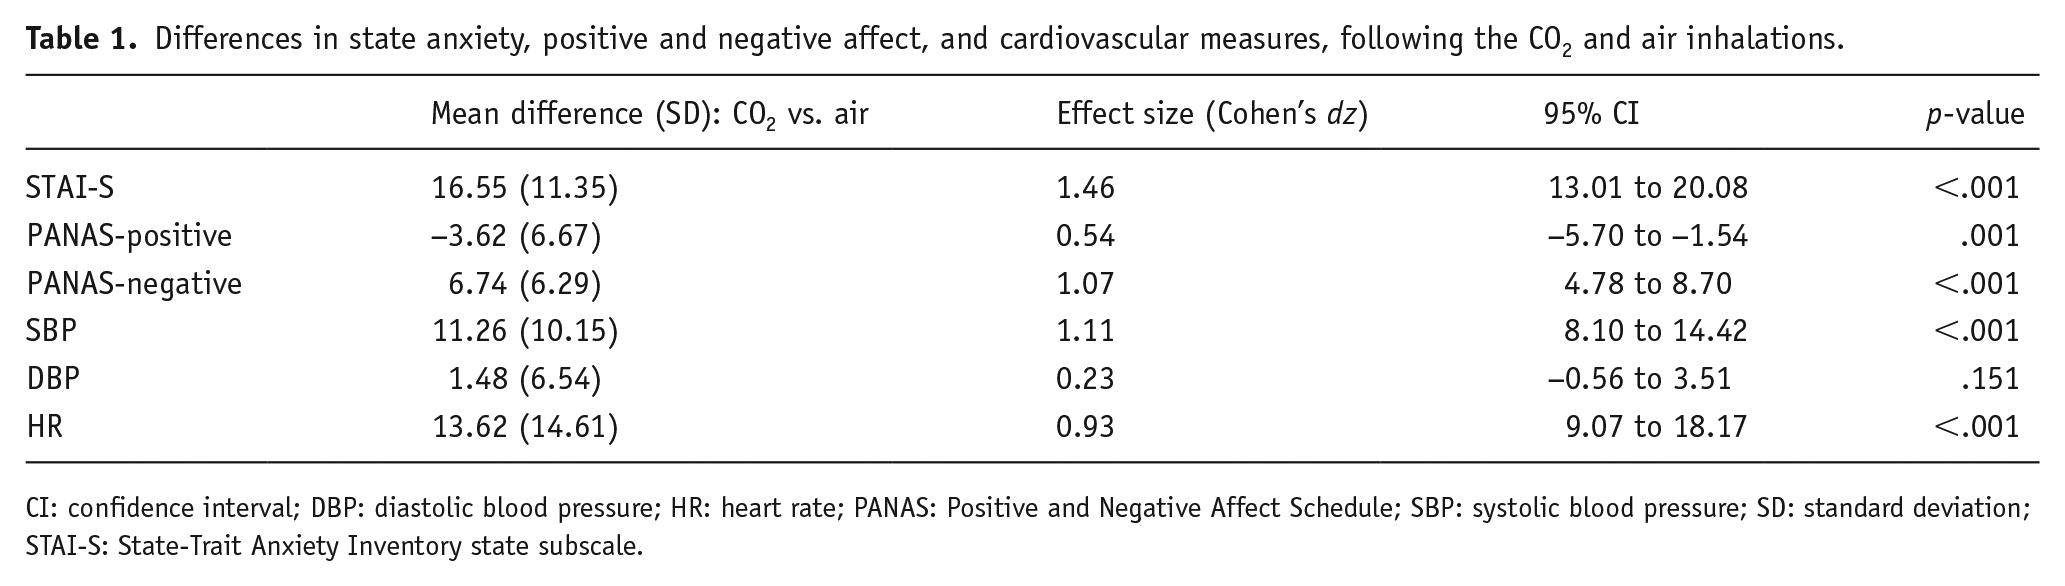
CI: confidence interval; DBP: diastolic blood pressure; HR: heart rate; PANAS: Positive and Negative Affect Schedule; SBP: systolic blood pressure; SD: standard deviation; STAI-S: State-Trait Anxiety Inventory state subscale.
Main analyses
Alcohol choice: Alcohol choice was higher in the CO2 (M = 42.96, SD = 24.79) than the air condition (M = 33.28, SD = 21.75) (t = 4.09, df = 41, p <.001, 95% CI 4.89 to 14.45, ηp2 = .29). Stroop errors: There was no clear evidence of a main effect of gas (F(1, 41) = .50, p = .484, ηp2 = .01) or cue type (F(1, 41) = 2.76, p = .104, ηp2 = .06) on Stroop errors. There was no clear evidence of a gas × cue type interaction on Stroop errors (F (1, 41) = 1.31, p = .256, ηp2 = .03). Stroop RTs: There was a main effect of gas (F(1, 41) = 11.47, p = .002, ηp2 = .22) indicating faster Stroop RTs in the air (M = 711.70, SE = 17.65) than the CO2 condition (M = 749.95, SE = 19.12). However, there was no clear evidence of a main effect of cue type (F(1, 41) = .02, p = .886, ηp2 = .001), or a gas × cue type interaction (F(1, 41) = 1.24, p = .27, ηp2 = .03) on Stroop RTs.
Exploratory analyses
None of the coping-related drinking cognitions or trait anxiety measures correlated with magnitude of difference in Stroop errors, Stroop RTs, or alcohol choice produced by the CO2 (Table 2).
Bivariate correlations examining associations of coping-related drinking and anxiety measures with alcohol-related outcomes.
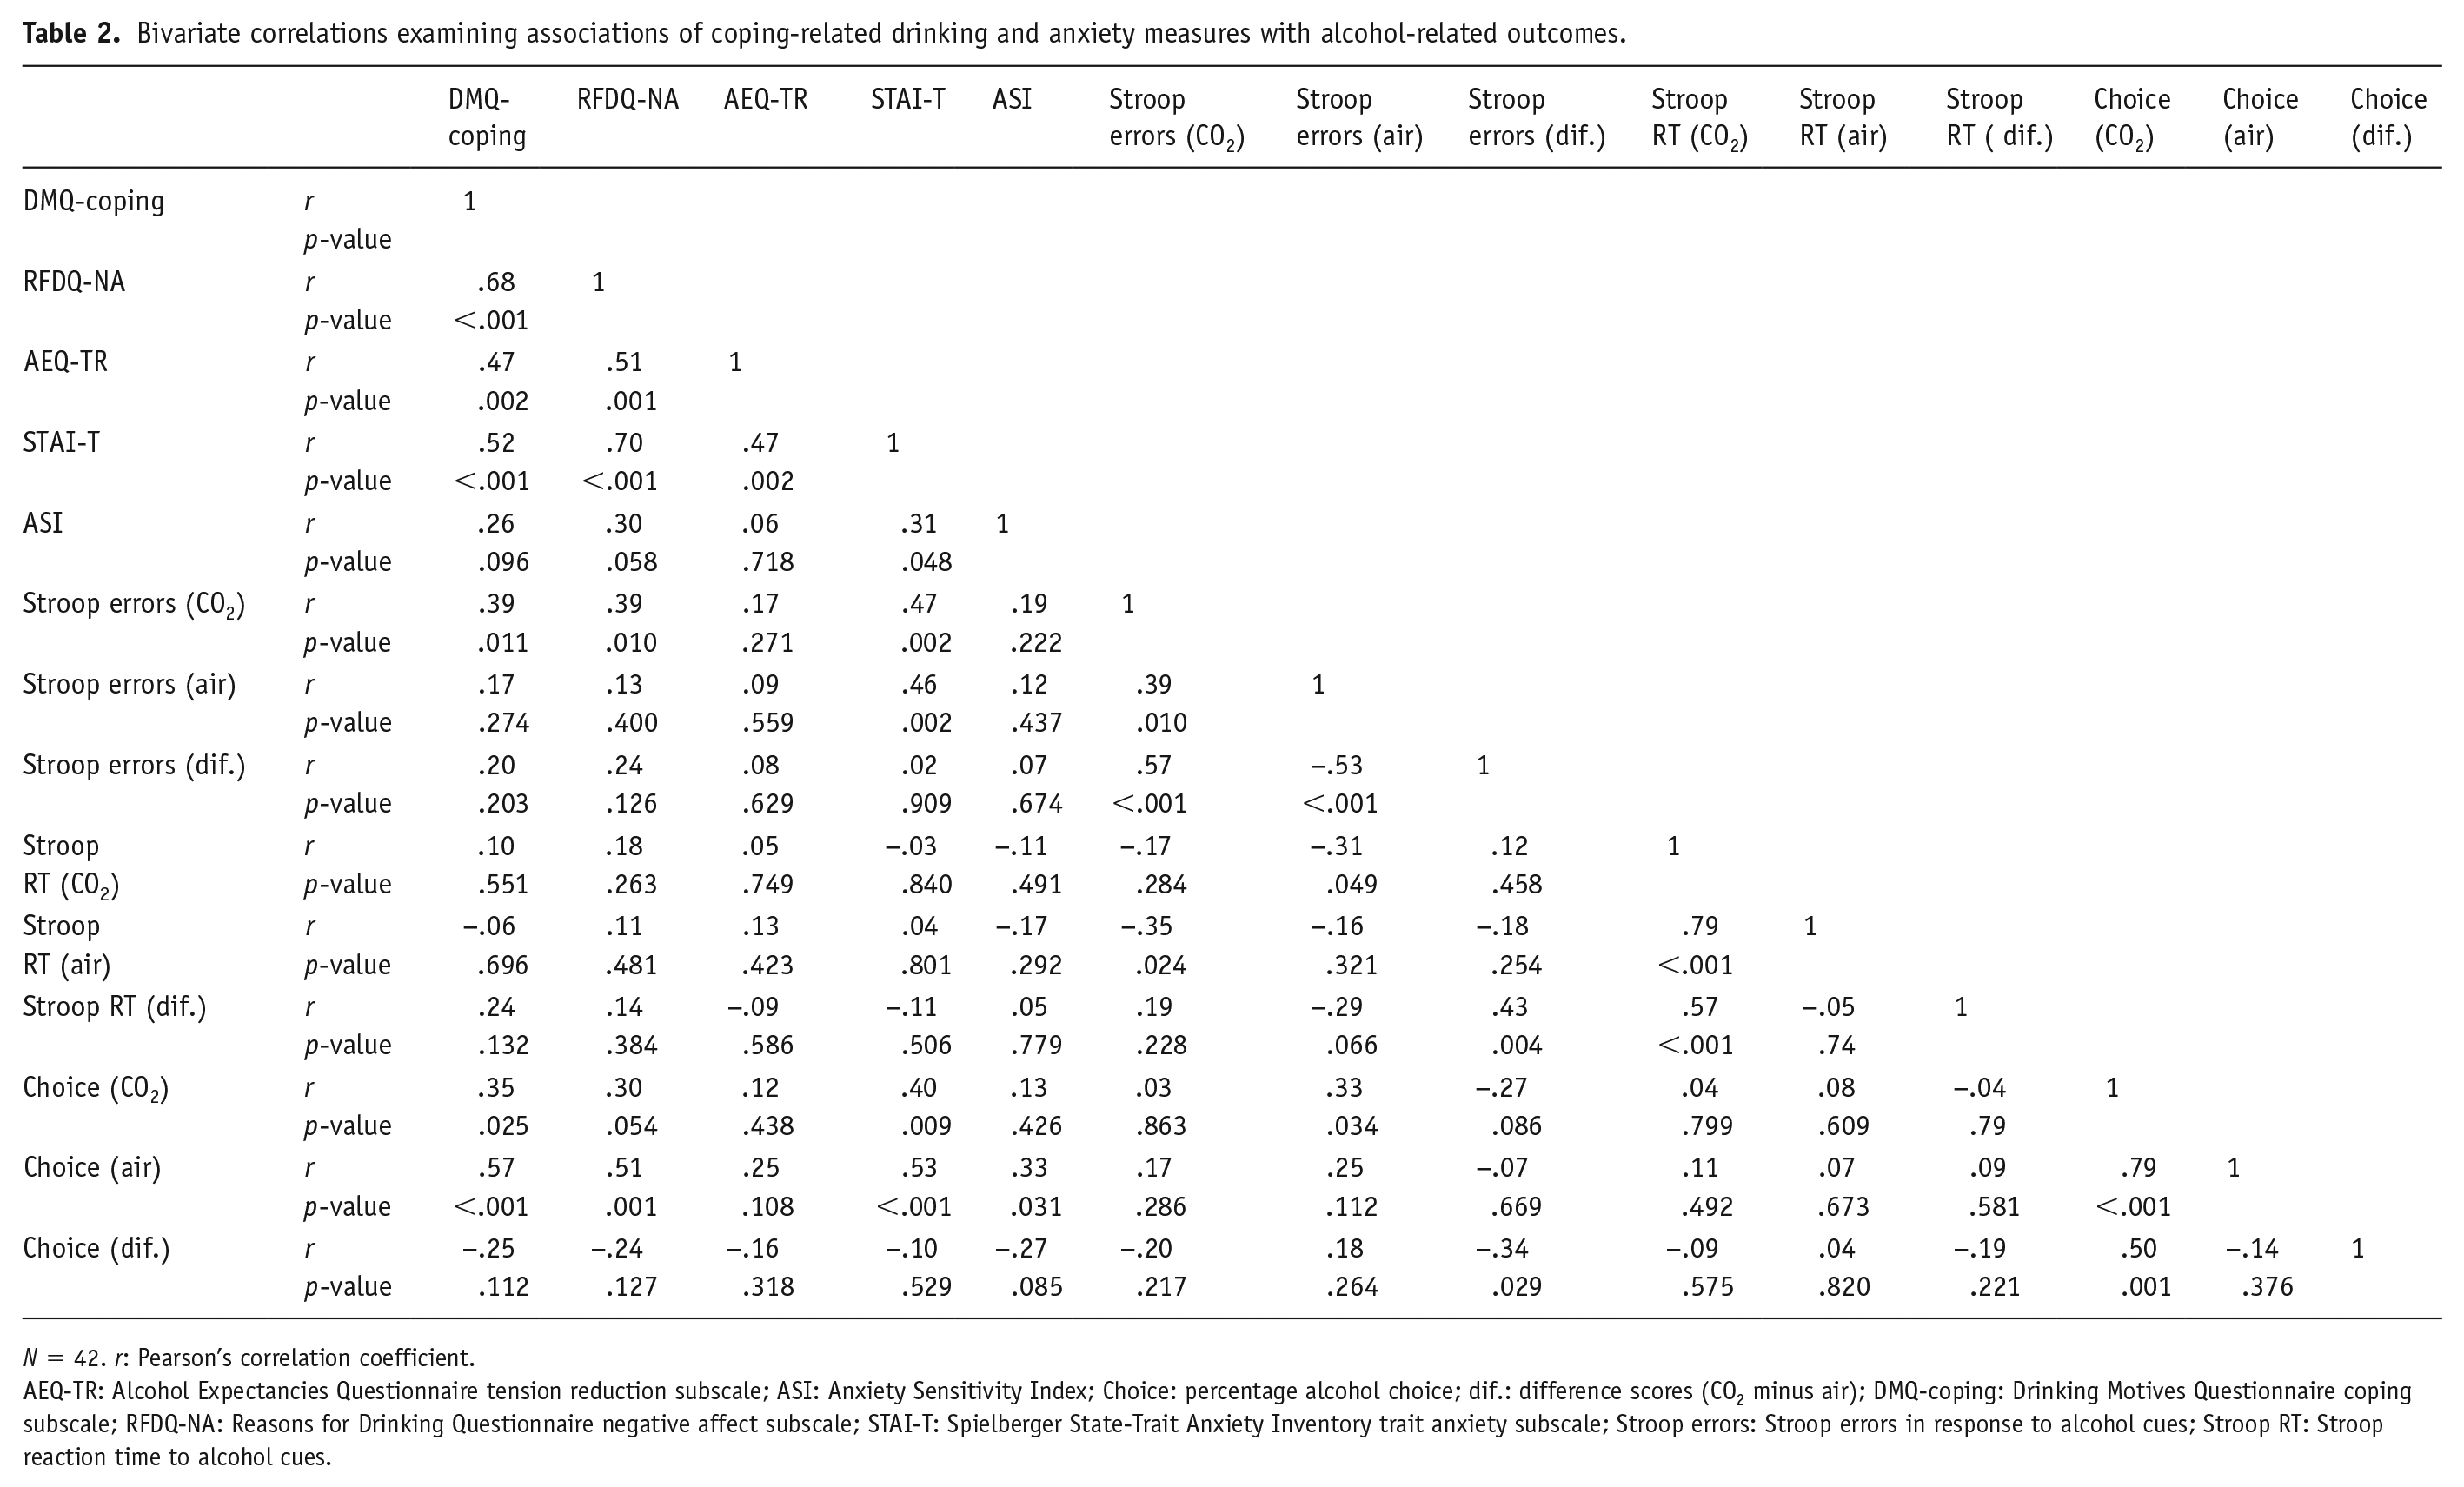
N = 42. r: Pearson’s correlation coefficient.
AEQ-TR: Alcohol Expectancies Questionnaire tension reduction subscale; ASI: Anxiety Sensitivity Index; Choice: percentage alcohol choice; dif.: difference scores (CO2 minus air); DMQ-coping: Drinking Motives Questionnaire coping subscale; RFDQ-NA: Reasons for Drinking Questionnaire negative affect subscale; STAI-T: Spielberger State-Trait Anxiety Inventory trait anxiety subscale; Stroop errors: Stroop errors in response to alcohol cues; Stroop RT: Stroop reaction time to alcohol cues.
Study 2
Method
Design
Study 2 aimed to replicate and extend Study 1. It was a laboratory experiment with a mixed model design. There was a within-subjects factor of gas (medical air, 7.5% CO2), a between-subjects factor of DTC (low, high), and an additional within-subjects factor of image (alcohol, neutral) for the approach-avoidance task (AAT) analyses. The Stroop was replaced by the AAT because we found no clear evidence for an effect in Study 1, and previous research suggests alcohol drinkers display approach biases to alcohol cues on joystick-operated AATs (Wiers et al., 2010). Gas and task order were counterbalanced. The protocol was preregistered (https://osf.io/4ebpm/), and ethics approval was obtained from the School of Psychological Science Research Ethics Committee at the University of Bristol (25051752981).
Participants
Study 2 had the following additional inclusion criteria to Study 1: consumed wine and/or beer, no dietary requirements, and low or high DTC (for complete eligibility criteria, please see the protocol: https://osf.io/4ebpm/). In Study 2, we extended recruitment to beer drinkers and made two versions of the tasks with wine and beer stimuli, which enabled us to recruit from a wider pool of participants. Sample size was determined using Study 1 data, which compared alcohol choice during CO2 inhalation (M = 43%, SD = 25) and air inhalation (M = 33%, SD = 22). Correlation between conditions was .79, which is equivalent to dz = .65. Again, we used a more conservative effect size estimate of dz = .43, which required 60 participants to detect with 90% power at an alpha level of 5%.
Measures and materials
Gas mixtures
See Study 1.
Questionnaire measures
Again, we included the STAI-S and STAI-T (Spielberger et al., 1983), PANAS (Watson et al., 1988), and EPQ-R (Eysenck and Eysenck, 1991). New measures included the Alcohol Urge Questionnaire (AUQ) (Bohn et al., 1995), the Modified Drinking Motives Questionnaire–Revised (MDMQ-R) (Grant et al., 2007), and the novel Drinking Motives Checklist (DMC) (Hogarth personal communications) to measure alcohol craving, DTC with anxiety, and DTC with various negative experiences, respectively.
Behavioural tasks
We measured percentage alcohol choice using the CPCM (Hardy and Hogarth, 2017) (see Study 1). Alcohol approach-avoidance was measured using the AAT. The AAT had six practice trials, followed by two experimental blocks (48 trials in total). Each block presented 12 alcohol and 12 neutral (non-alcoholic drinks) images and there were 24 approach and 24 avoidance trials. Image presentation was randomised. On each trial, a fixation cross appeared for 500 ms, before being replaced by an image. After 500–750 ms, either a solid or dashed border cue appeared indicating direction of joystick movement. Pull movements and push movements caused larger and smaller versions of the images to appear, and faster RTs to pull or push trials were indicative of an approach or avoidance tendency, respectively. Two task versions were created for Study 2 (beer/lager and wine versions), which were created and run using E-Prime.
Procedure
Study 2 followed a similar procedure to Study 1, with some exceptions: 1) participants were first required to complete a Qualtrics screening questionnaire (MDMQ-R), which determined DTC group, 2) participants completed the AUQ at baseline and after each inhalation, and 3) the DMC replaced the AEQ and RFDQ. Participants who scored 4–8 on the four MDMQ-R anxiety-coping items were allocated to the low DTC group (Likert scale responses of ‘1’ or ‘2’), and participants who scored 12–20 were allocated to the high DTC group (Likert scale responses of ‘3’, ‘4’ or ‘5’).
Data analysis
Analyses were conducted using IBM SPSS Statistics. We conducted 2 × 2 mixed model ANOVAs for alcohol choice and alcohol craving data, and a 2 × 2 × 2 mixed ANOVA for AAT data. We calculated AAT bias scores separately for alcohol and neutral stimuli, by subtracting median pull RTs from push RTs as medians are less sensitive to outliers (Wiers et al., 2010). Errors were removed. Negative AAT scores reflect a greater avoidance tendency and positive AAT scores reflect a greater approach tendency. Where there was evidence of an interaction, we conducted post hoc simple effects analyses (t-tests).
We conducted a subgroup analysis restricted to wine drinkers and wine stimuli, to match Study 1. As an exploratory analysis, we correlated subscales of the DMC with the magnitude of difference in alcohol choice produced by the CO2, and multiple regression was used to determine whether any of the subscales acted as an independent predictor. There were insufficient participant numbers to compare alcohol choice among individuals with high DTC and high social motives to those who drink for either or neither reason.
Results
Participant characteristics
We aimed to recruit 60 participants, but only 55 had complete outcome data due to withdrawals, meaning we had 87% power to detect our target effect size of dz = .43. Participants (n = 60, 47% male) were aged between 18 and 34 years (M = 21.50, SD = 3.17). Trait anxiety scores ranged from 22 to 51 (M = 33.85, SD = 6.50). DTC scores ranged from 4 to 8 (M = 6.45, SD = 1.23) for the low DTC group and 12 to 19 (M = 14.17, SD = 2.02) for the high DTC group. EPQ-R scores ranged from 17 to 30 (M = 23.28, SD = 3.41) for extraversion, 27 to 46 (M = 36.83, SD = 4.92) for neuroticism, 6 to 26 (M = 18.38, SD = 4.09) for psychoticism, and 0 to 11 (M = 5.43, SD = 2.76) for the lie scale.
Manipulation check
State anxiety, negative affect, BP and HR were higher, and positive affect was lower, following the CO2 inhalation compared to the air inhalation, which confirmed the internal validity of the anxiety manipulation (Table 3).
Differences in state anxiety, positive and negative affect, and cardiovascular measures, following the CO2 and air inhalations.
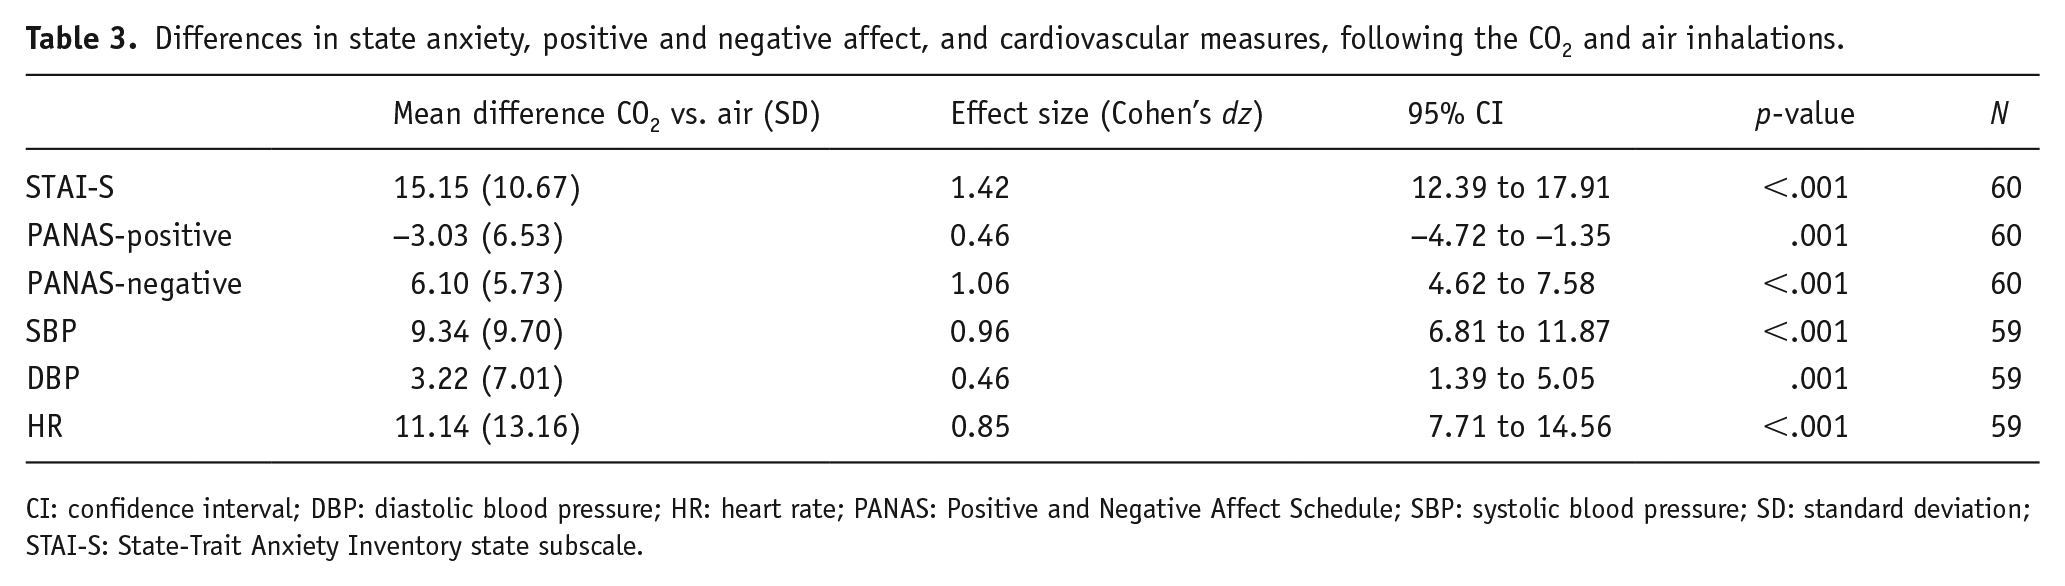
CI: confidence interval; DBP: diastolic blood pressure; HR: heart rate; PANAS: Positive and Negative Affect Schedule; SBP: systolic blood pressure; SD: standard deviation; STAI-S: State-Trait Anxiety Inventory state subscale.
Main analyses
Alcohol choice
There was weak evidence of a main effect of gas (F(1, 55) = 3.27, p = .076, ηp2 = .06) on alcohol choice. Alcohol choice was higher in the CO2 (M = 48.01, SE = 3.05) than the air (M = 44.50, SE = 2.76) condition. There was evidence of a main effect of DTC (F(1, 55) = 6.37, p = .015, ηp2 = .10). Alcohol choice was higher in the high (M = 53.16, SE = 3.97) than the low (M = 39.34, SE = 3.77) DTC group. There was also evidence of a gas × DTC interaction (F(1, 55) = 6.54, p = .013, ηp2 = .11). In the air condition, there was weak evidence that alcohol choice was higher in the high than the low DTC group (48.85 vs. 39.78, p = .093). In the CO2 condition, there was strong evidence that alcohol choice was higher in the high than the low DTC group (57.41 vs. 38.61, p = .003). In the low DTC group, there was no clear evidence of a difference in alcohol choice in the air condition and the CO2 condition (40.07 vs. 38.61, p = .586). In the high DTC group, there was strong evidence of higher alcohol choice in the CO2 condition than the air condition (57.41 vs. 48.92, p = .006) (Figure 1). All figures display the means in each condition, error bars show the standard errors of the mean, and individual data points are also plotted to show the distribution.
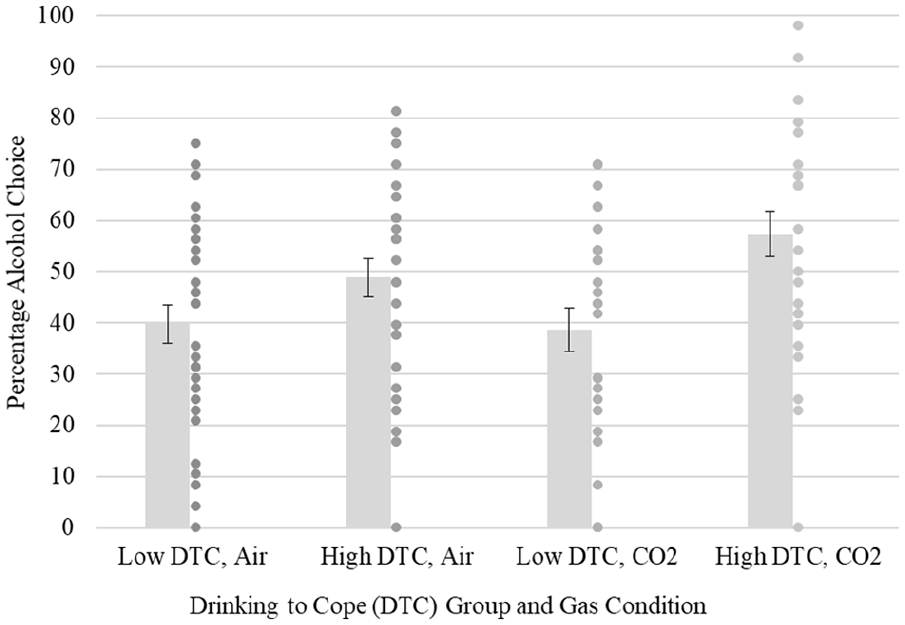
Interaction between gas and drinking to cope on alcohol choice.
Alcohol craving
There was no clear evidence of a main effect of gas (F(1, 58) = 2.54, p = .116, ηp2 = .04), DTC (F(1, 58) = 0.79, p = .379, ηp2 = .01), or a gas × DTC interaction (F(1, 58) = .97, p = .330, ηp2 = .016) on alcohol craving (Figure 2).
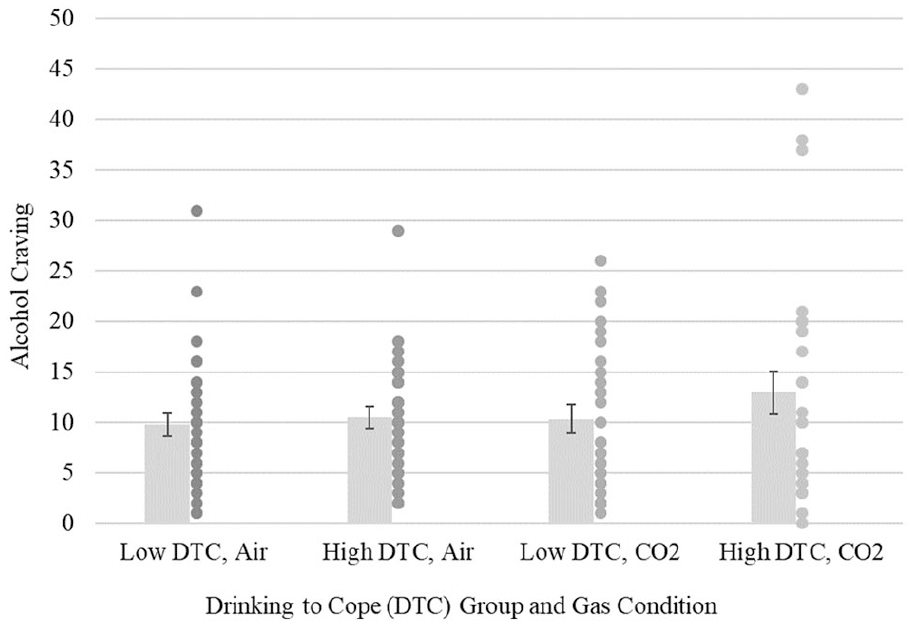
Interaction between gas and drinking to cope on alcohol craving.
AAT bias scores
The was no clear evidence of a main effect of gas (F(1, 54) = .88, p = .352, ηp2 = .02) or DTC (F(1,54) = .007, p = .931, ηp2 < .001) on AAT bias scores. There was weak evidence of a main effect of image type (F(1, 54) = 3.56, p = .065, ηp2 = .06). AAT scores were higher in response to alcohol (M = 37.71, SE = 9.03) than neutral (M = 25.72, SE = 8.34) images. There was evidence of a gas × image interaction (F(1, 54) = 4.88, p = .031, ηp2 = .08) (Figure 3). In the CO2 condition, there was no clear evidence that AAT scores differed in response to alcohol and neutral images (33.39 vs. 39.01, p = .488). In the air condition, there was some evidence that AAT scores were higher in response to alcohol than neutral images (39.95 vs. 13.41, p = .027). For alcohol images, there was no clear evidence of a difference in AAT scores in the air and the CO2 condition (41.94 vs. 33.39, p = .517). For neutral images, there was some evidence that AAT scores were higher in the CO2 than the air condition (39.01 vs. 12.62, p = .037). There was no clear evidence of a gas × DTC interaction (F(1, 54) = .49, p = .489, ηp2 = .01), an image × DTC interaction (F(1, 54) = .37, p = .543, ηp2 = .01), or a gas × image × DTC interaction (F(1,54) = 2.68, p = .107, ηp2 = .05).
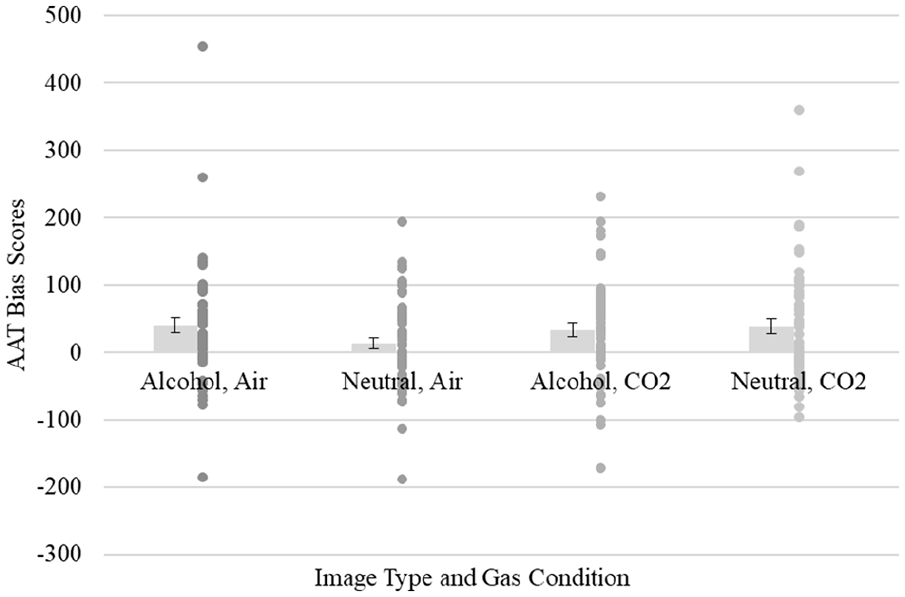
Interaction between gas and image type on AAT bias scores.
Exploratory analyses
When restricting analyses to wine drinkers (N = 25) and wine stimuli to resemble Study 1, there was no clear evidence of a main effect of gas (F(1,23) = 0.002, p = .964, ηp2 = <.001), or DTC (F(1, 23) = 1.39, p = .251, ηp2 = .06), or a gas × DTC interaction (F(1, 23) = 2.89, p = .103, ηp2 = .11) on alcohol choice. These analyses were underpowered due to the restricted sample, which most likely explains the null effects. The anxiety, stress, and isolation subscales of the DMC and total DMC scores positively correlated with magnitude of difference in alcohol choice produced by CO2 inhalation (Table 4). However, no subscale was an independent predictor when adjusting for the other subscales (ps > .1).
Bivariate correlations examining associations of subscales of the Drinking Motives Checklist (DMC) and the magnitude of the difference in alcohol choice produced by CO2 inhalation.
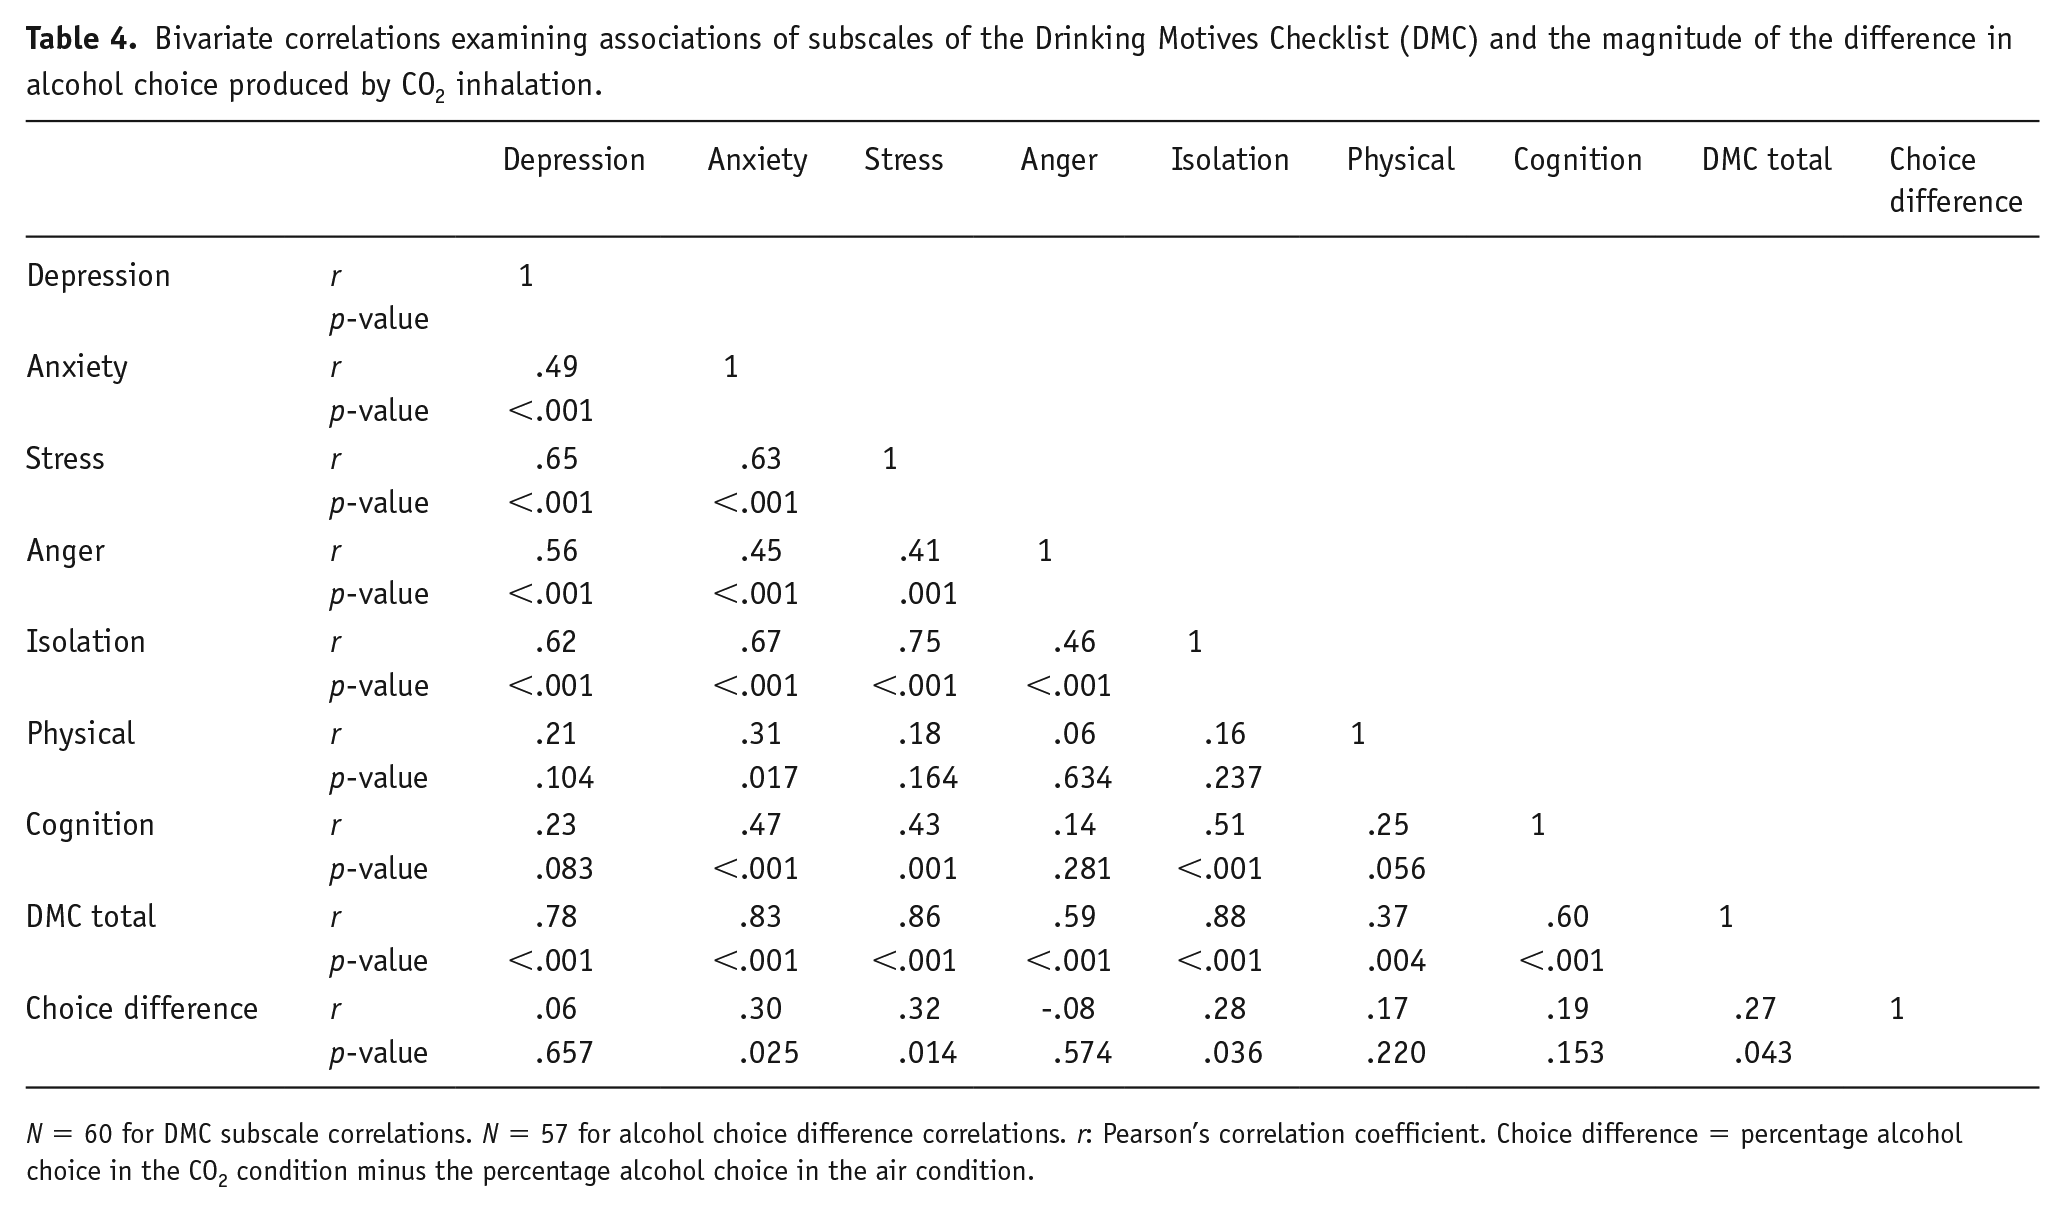
N = 60 for DMC subscale correlations. N = 57 for alcohol choice difference correlations. r: Pearson’s correlation coefficient. Choice difference = percentage alcohol choice in the CO2 condition minus the percentage alcohol choice in the air condition.
Study 3
Method
Design
Study 3 was an online cross-sectional study. The protocol was preregistered (https://osf.io/hve98/), and ethics approval was obtained from the School of Psychological Science Research Ethics Committee at the University of Bristol (12071870461).
Participants
Sample size was determined using Study 1 data. Self-reported state anxiety was positively associated with alcohol choice during CO2 inhalation (r = .33). Because Study 1 was a discovery study, we reduced the effect size by a third (r = .22), which required 219 participants to detect with 90% power at an alpha level of 5%. Participant recruitment and screening were managed via Prolific (https://www.prolific.ac/). Participants were eligible if they met the following criteria: aged 18 years or over, UK national, fluent in English, alcohol drinker, and no dietary requirements.
Measures
Exposure questionnaires
We measured state anxiety and trait anxiety using the STAI-S and STAI-T (Spielberger et al., 1983). Binary state and trait anxiety variables (upper quartile split) were created for the stratified analyses. Scores of 20–41 and 42–73 on the STAI-S denoted low and high state anxiety, respectively. Scores of 20–55 and 56–79 on the STAI-T denoted low and high trait anxiety, respectively. We assessed DTC using the coping-anxiety subscale of the MDMQ-R (Grant et al., 2007). We also derived a binary DTC variable (upper quartile split), for the stratified analyses. Scores of 4–11 and 12–20 denoted low and high DTC, respectively. We created a four-level categorical variable combining DTC and social motives for drinking, for use in a sensitivity analysis.
Outcome questionnaires
We measured alcohol craving using the AUQ (Bohn et al., 1995), and frequent drinking, frequent bingeing, hazardous drinking, and harmful drinking using the Alcohol Use Disorders Identification Test (AUDIT) (Babor et al., 2001). Drinking alcohol ‘2 to 4 times a month’ or ‘monthly or less’ denoted infrequent drinking. Drinking alcohol ‘2 to 3 times a week’ or ‘4 or more times a week’ denoted frequent drinking. Individuals who consumed ⩾6 units on one occasion ‘monthly’, ‘less than monthly’ or ‘never’ were coded as infrequent binge drinkers, and those who consume ⩾6 units ‘weekly’ or ‘daily or almost daily’ were coded as frequent binge drinkers. Scores ⩾8 on AUDIT were classified as hazardous drinkers, and scores ⩾16 indicated harmful drinking.
Potential confounders
The following confounders were assessed via self-report: sociodemographic (age, gender, education, income), mental health (family history of anxiety or depression, and alcohol use disorders, personal history of externalising and internalising disorders, emotional eating, and experience of abuse), and substance use (tobacco use, and cannabis use). Confounders were selected based on their associations with anxiety and alcohol use in the literature.
Alcohol choice
We created the CPCM (Hardy and Hogarth, 2017) using Gorilla (https://gorilla.sc/). The task matched the version described in Study 1 except there were 54 choice trials, and each trial randomly sampled from 27 alcohol images (beer/cider, spirits, and wine to cover preferences) and 27 food images, and each image was presented twice.
Procedure
The study was conducted online and lasted 30 minutes. Participants accessed the study through Prolific and data were collected and stored on Gorilla. Participants provided informed consent electronically on the first webpage. The task and questionnaires followed in the same order for all participants. After submitting their data and being debriefed, participants were redirected to Prolific, where they were reimbursed £2.50.
Main analyses
Analyses were conducted in Stata. We used linear regressions to investigate associations of state anxiety with alcohol choice and alcohol craving. We compared unadjusted results to results incrementally adjusted for sociodemographic, mental health and substance use confounders. To match Study 1, we also performed a subgroup analysis restricted to wine drinkers and wine stimuli data. Both unstandardised (‘b’) and standardised (‘beta’) coefficients are presented in Tables 5, 7 and 9.
Linear regressions examining associations of state anxiety, trait anxiety, and drinking to cope (DTC) motives, with alcohol choice and alcohol craving.
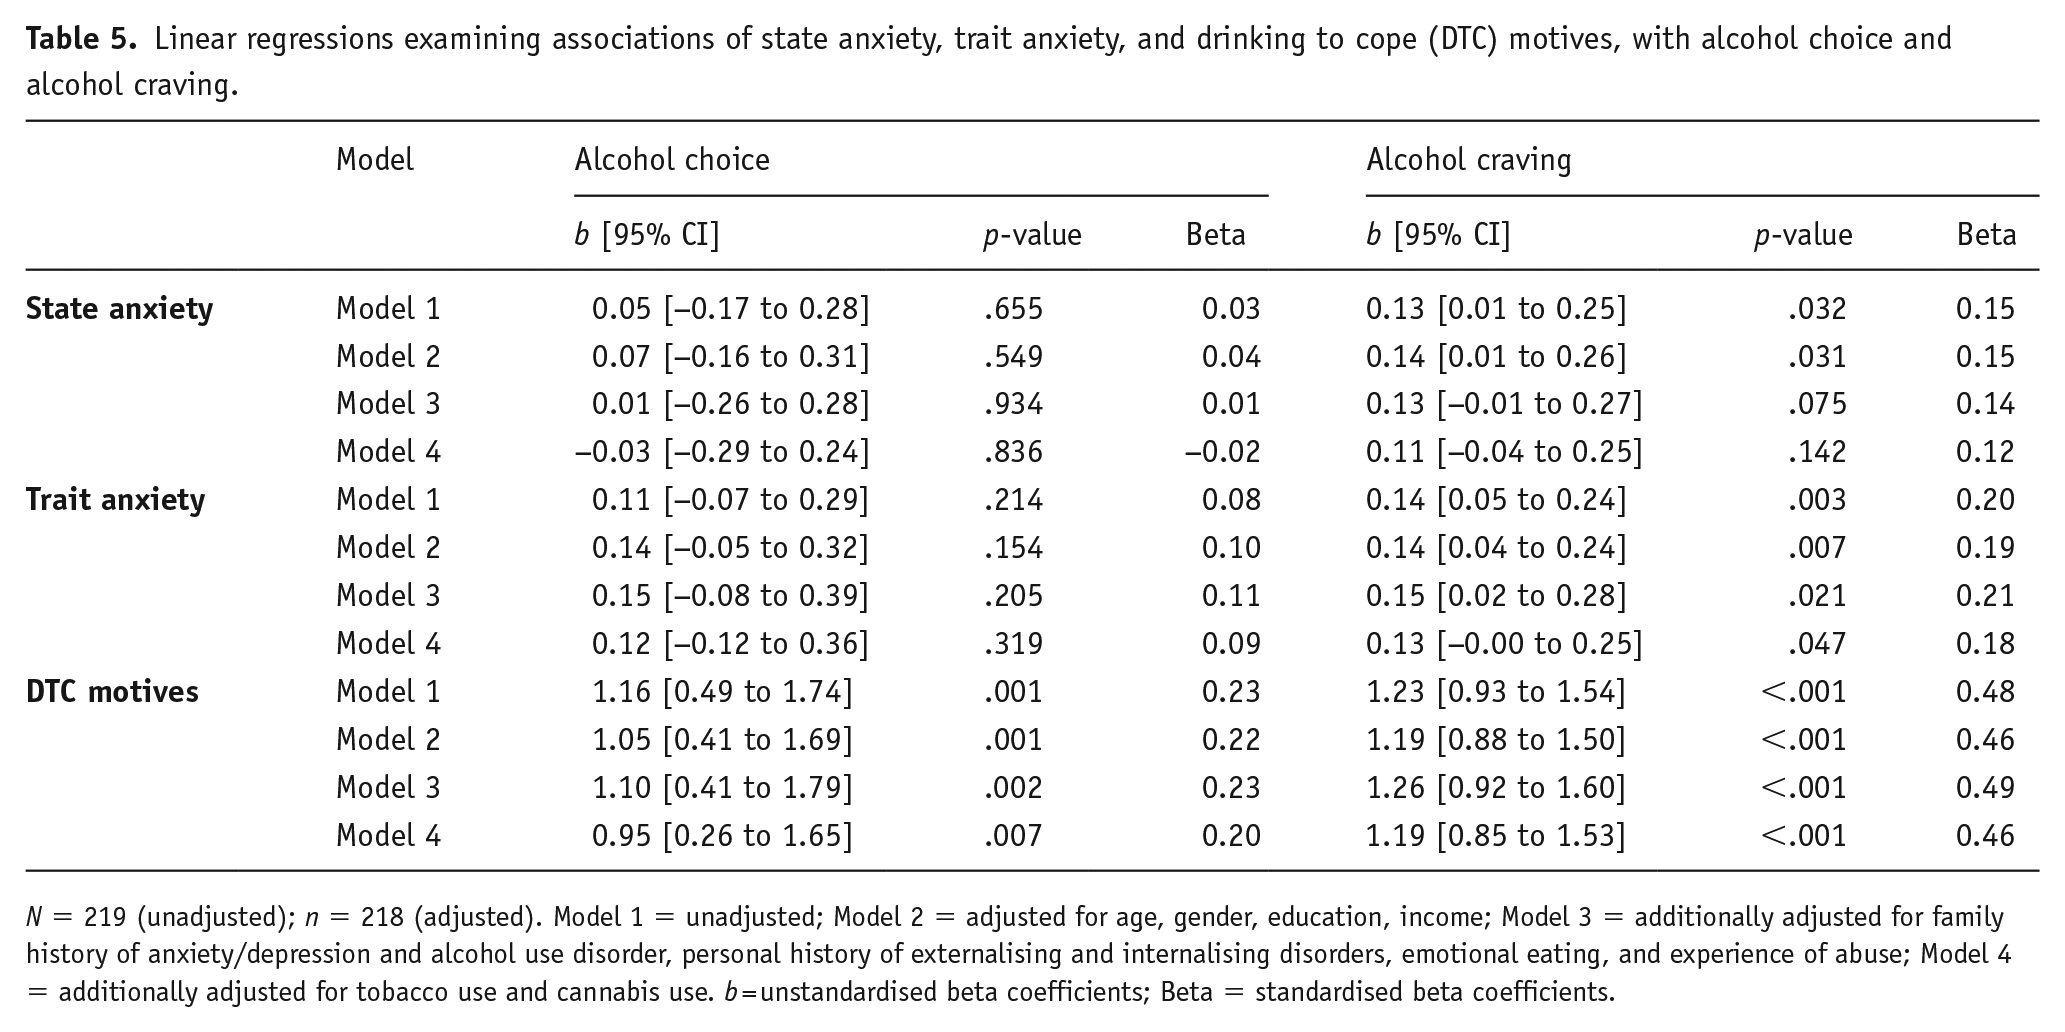
N = 219 (unadjusted); n = 218 (adjusted). Model 1 = unadjusted; Model 2 = adjusted for age, gender, education, income; Model 3 = additionally adjusted for family history of anxiety/depression and alcohol use disorder, personal history of externalising and internalising disorders, emotional eating, and experience of abuse; Model 4 = additionally adjusted for tobacco use and cannabis use. b = unstandardised beta coefficients; Beta = standardised beta coefficients.
Exploratory analyses
We explored associations of trait anxiety and DTC motives (continuous measures) with alcohol choice, alcohol craving and alcohol use, using linear and logistic regressions. Interaction tests and stratified analyses were used to explore moderating influences. As a sensitivity analysis, individuals with high levels of DTC and high levels of social motives for drinking were compared to those who drink for either or neither reason.
Results
Participant characteristics
Participants (n = 219, 45% male) were aged between 18 and 66 years (M = 35.73, SD = 11.91). One participant was excluded from all models that included gender as they responded ‘other/prefer not to say’. STAI-S anxiety scores and STAI-T anxiety scores ranged from 20 to 73 (M = 35.60, SD = 11.23) and 20 to 79 (M = 44.43, SD = 14.06), respectively. Percentage alcohol choice ranged from 0 to 98% (M = 34.72, SD = 18.89). AUQ scores ranged from 8 to 56 (M = 17.39, SD = 10.13). DTC scores ranged from 4 to 20 (M = 9.22, SD = 3.92). Alcohol use outcome frequencies (derived from AUDIT) were frequent drinking 46%, frequent bingeing 20%, hazardous drinking 52% and harmful drinking 11%.
Main analyses
There was no clear evidence of an association between state anxiety and alcohol choice in the main analysis (Table 5) or the subgroup analysis restricted to wine drinkers and wine stimuli (unadjusted b = 0.04, 95% CI −0.27 to 0.34, p =.816). There was weak evidence of a positive association between state anxiety and alcohol craving, which was attenuated when adjusting for confounders.
Exploratory analyses
There was evidence of a positive association between trait anxiety and alcohol craving (Table 5). There was no clear evidence of an association between trait anxiety and alcohol choice (Table 5), frequent drinking or frequent bingeing (Table 6). Trait anxiety was associated with more hazardous and harmful drinking, but evidence was attenuated for hazardous drinking in the fully adjusted model, and effect sizes were small (Table 6). DTC was positively associated with all alcohol-related outcomes (Tables 5 and 6).
Logistic regressions examining associations of trait anxiety and drinking to cope (DTC) motives, with alcohol use.

N = 219 (unadjusted); n = 218 (adjusted). Model 1 = unadjusted; Model 2 = adjusted for age, gender, education, income; Model 3 = additionally adjusted for family history of anxiety/depression and alcohol use disorder, personal history of externalising and internalising disorders, emotional eating, and experience of abuse; Model 4 = additionally adjusted for tobacco use and cannabis use.
There was no clear evidence of an interaction between state anxiety and DTC on alcohol choice or alcohol craving (Table 7). Stratified analyses revealed evidence of a positive association of DTC with alcohol choice and alcohol craving among individuals with high and low state anxiety. There was no clear evidence of an interaction between state anxiety and trait anxiety on alcohol choice or alcohol craving. There was no clear evidence of an interaction between trait anxiety and DTC on alcohol choice or alcohol craving. Stratified analyses showed weak evidence of a positive association between trait anxiety with alcohol choice and alcohol craving among individuals with high, but not low, DTC. Stratified analyses also revealed evidence of a positive association between DTC and alcohol choice and alcohol craving among individuals with high and low trait anxiety. There was no clear evidence of an interaction between trait anxiety and DTC on the alcohol use outcomes, except hazardous drinking but the point estimate was very small (Table 8).
Linear regressions examining the interactions between state anxiety (SA), trait anxiety (TA), and drinking to cope (DTC) motives, on alcohol choice and alcohol craving.
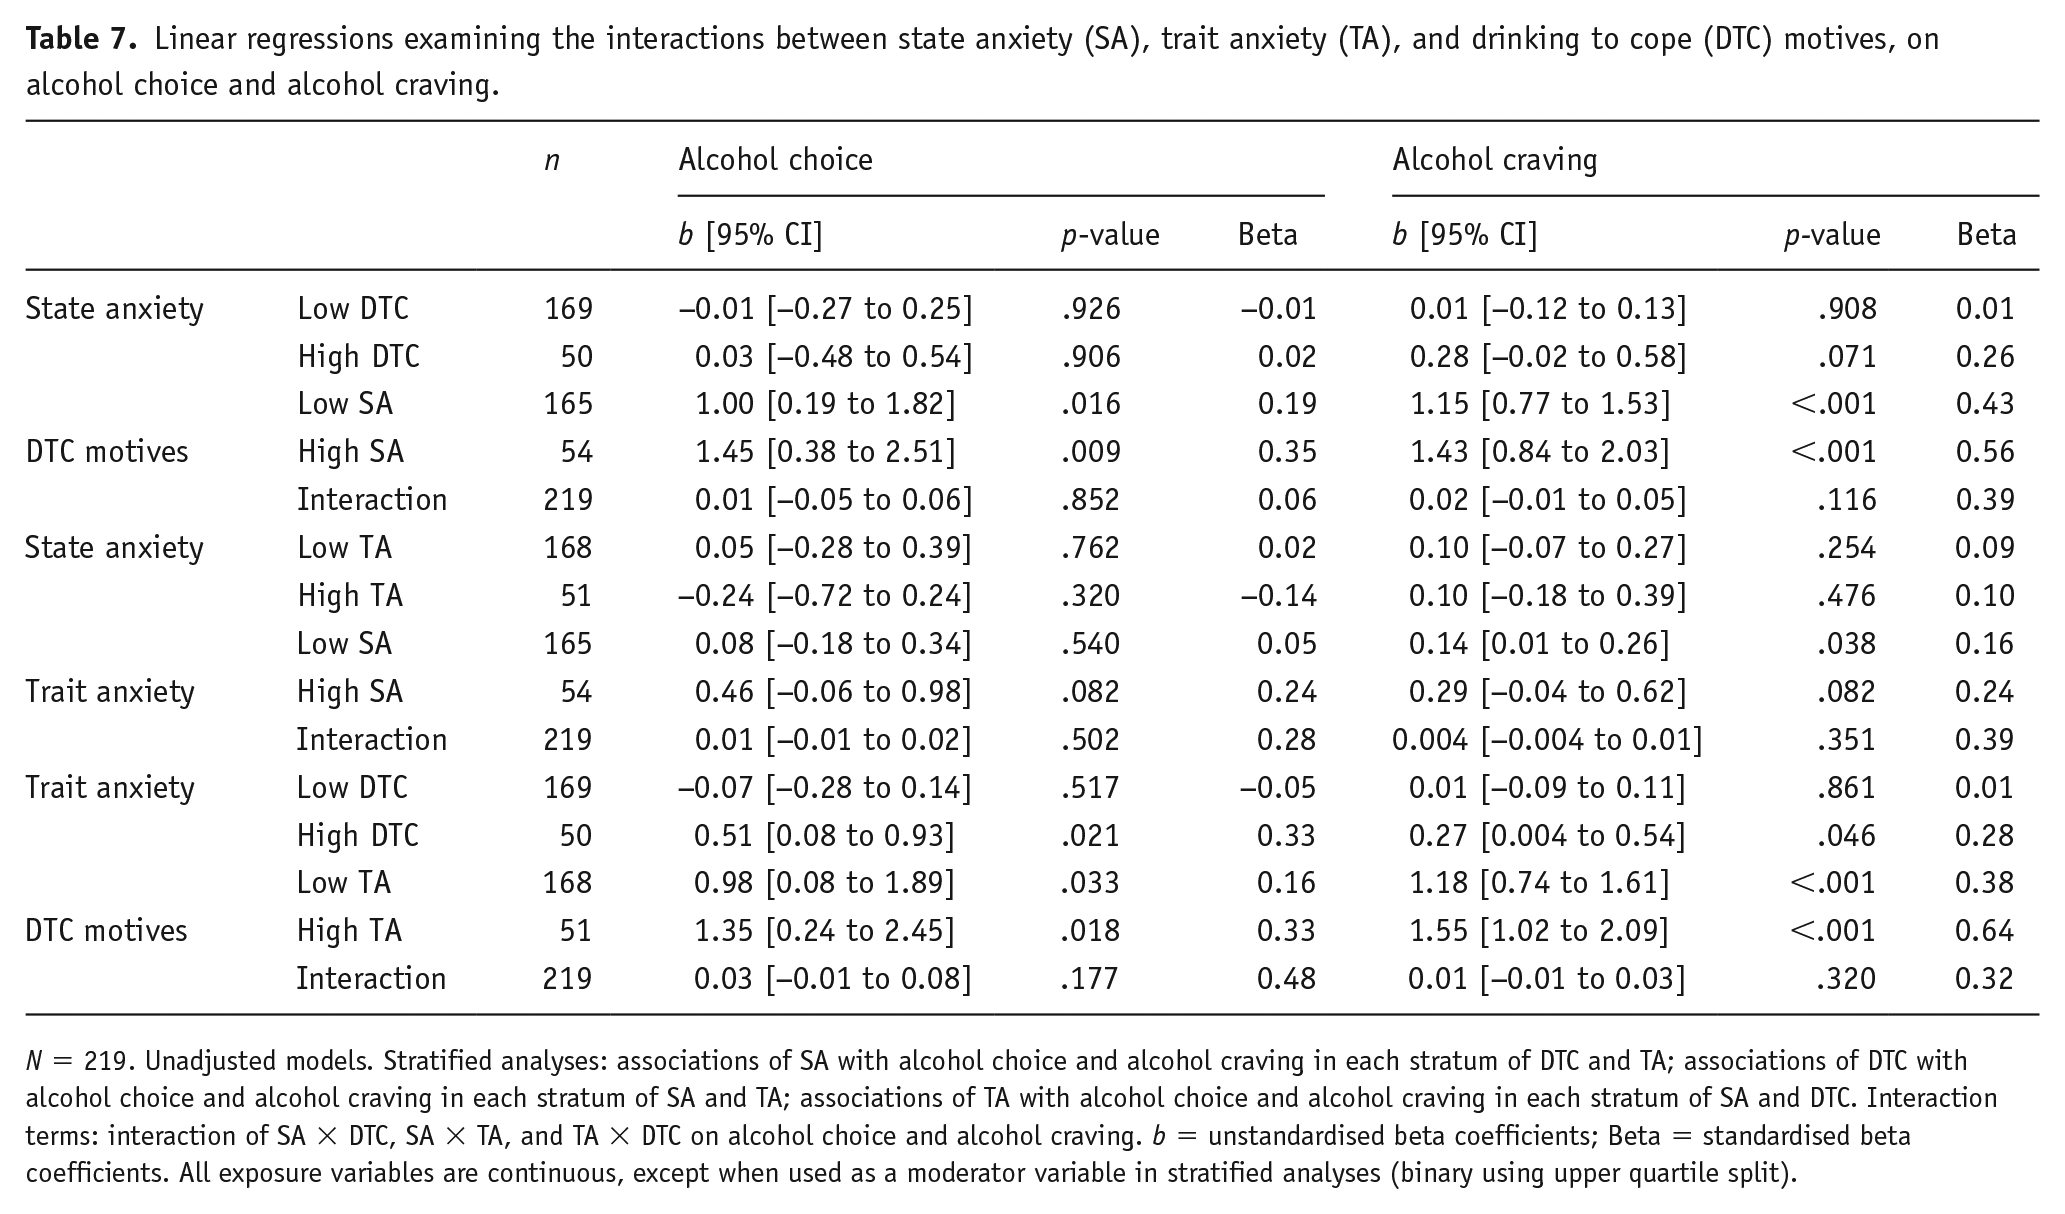
N = 219. Unadjusted models. Stratified analyses: associations of SA with alcohol choice and alcohol craving in each stratum of DTC and TA; associations of DTC with alcohol choice and alcohol craving in each stratum of SA and TA; associations of TA with alcohol choice and alcohol craving in each stratum of SA and DTC. Interaction terms: interaction of SA × DTC, SA × TA, and TA × DTC on alcohol choice and alcohol craving. b = unstandardised beta coefficients; Beta = standardised beta coefficients. All exposure variables are continuous, except when used as a moderator variable in stratified analyses (binary using upper quartile split).
Logistic regressions examining the interactions between trait anxiety (TA) and drinking to cope (DTC) motives, on alcohol use.
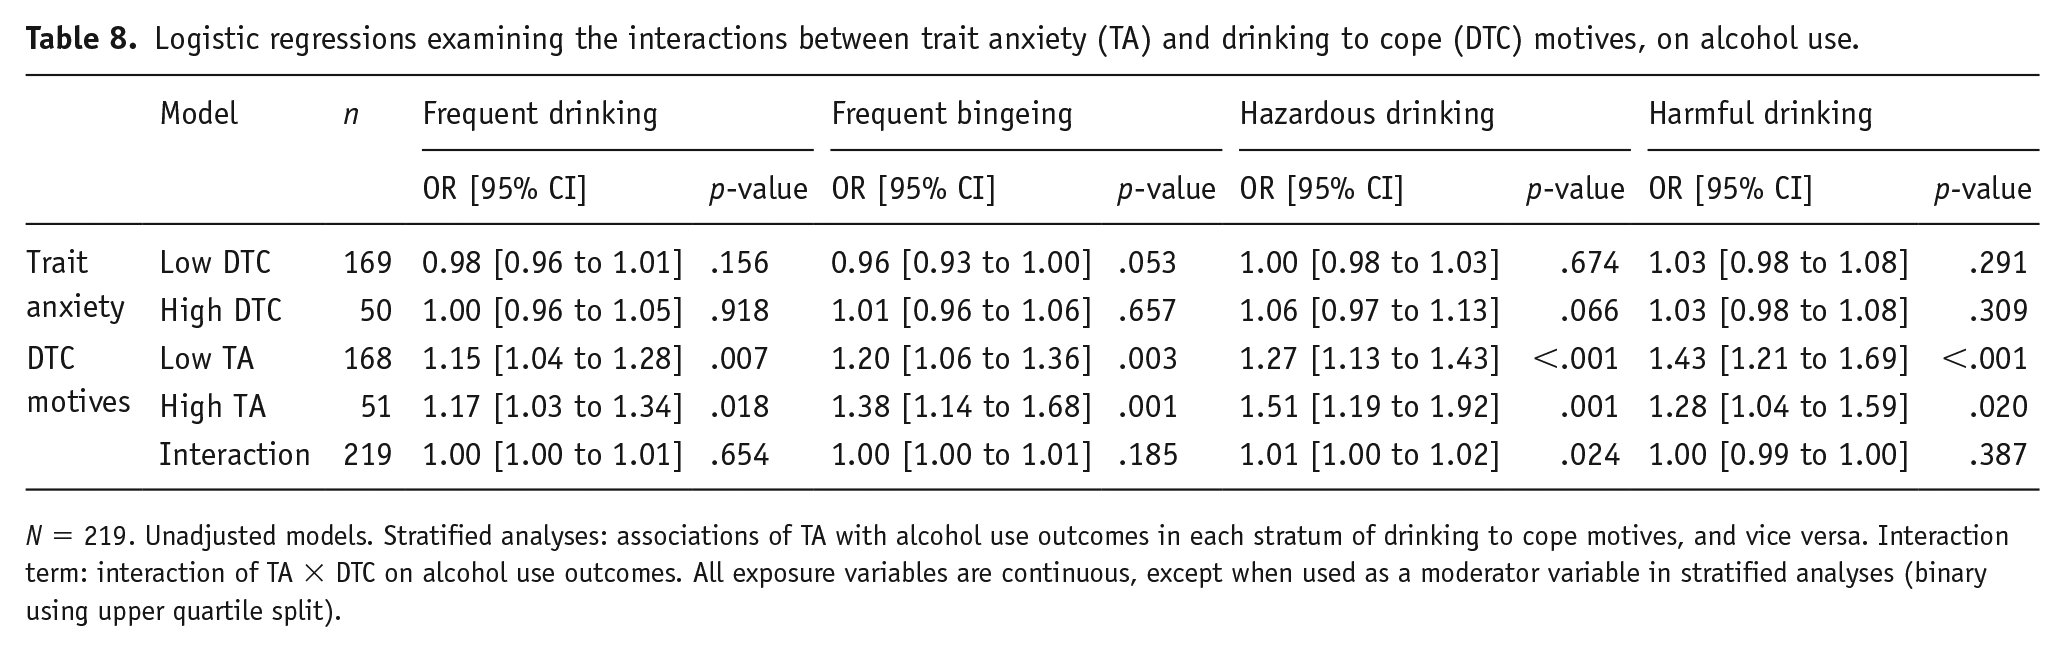
N = 219. Unadjusted models. Stratified analyses: associations of TA with alcohol use outcomes in each stratum of drinking to cope motives, and vice versa. Interaction term: interaction of TA × DTC on alcohol use outcomes. All exposure variables are continuous, except when used as a moderator variable in stratified analyses (binary using upper quartile split).
Sensitivity analyses
Compared to individuals with low DTC and low social motives, alcohol choice was higher among individuals with high DTC and high social motives, than those who just have high social motives, and those who just have high DTC. Associations with alcohol craving were similar among individuals in different subgroups (Table 9).
Linear regressions examining associations of a combined measure of drinking to cope (DTC) motives and social motives with alcohol choice and alcohol craving.
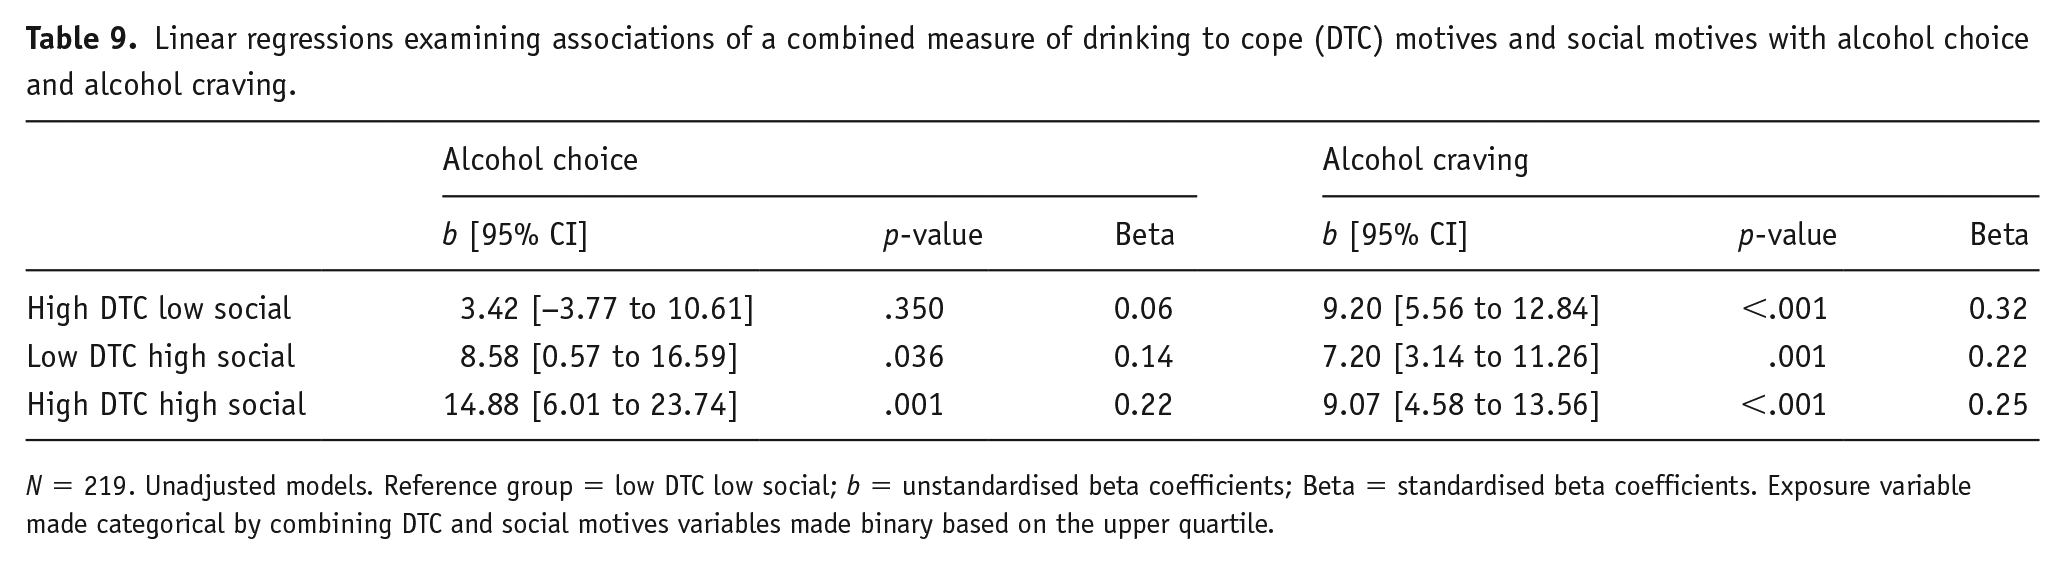
N = 219. Unadjusted models. Reference group = low DTC low social; b = unstandardised beta coefficients; Beta = standardised beta coefficients. Exposure variable made categorical by combining DTC and social motives variables made binary based on the upper quartile.
Finally, we conducted post hoc analyses of the internal reliability of the computer tasks used across all three studies (Table 10). Internal consistency estimates of reliability were calculated using the split half method (data split by odd and even trials). We present Pearson correlation coefficients (r) and Spearman–Brown corrections (ρ; corrected for a full-length test). As shown in Table 10, the CPCM had good internal reliability across all three studies. The Stroop task also had good internal reliability, but the AAT was unreliable.
Internal consistency reliability coefficients (split-half) for each task.
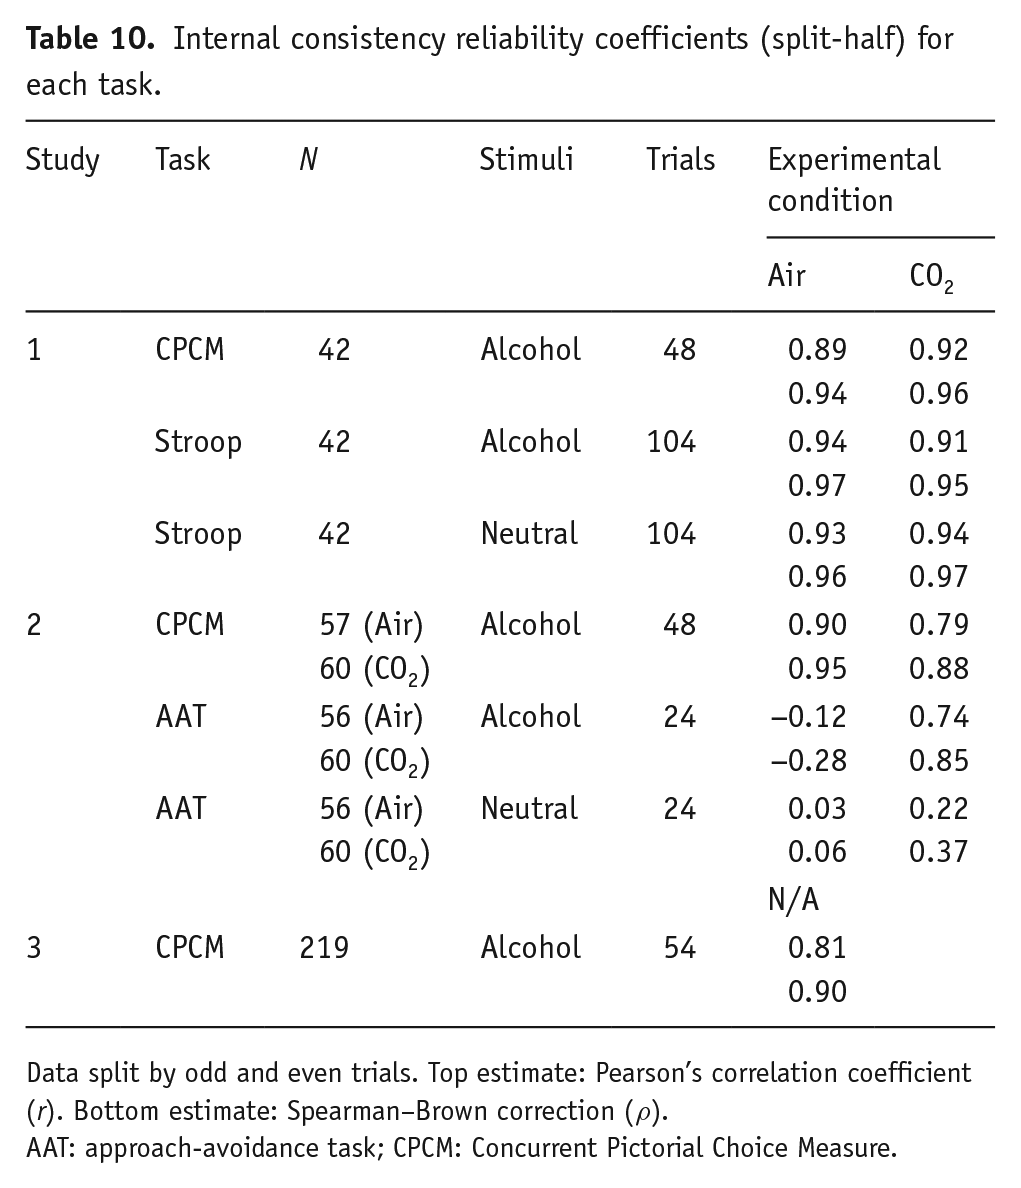
Data split by odd and even trials. Top estimate: Pearson’s correlation coefficient (r). Bottom estimate: Spearman–Brown correction (ρ).
AAT: approach-avoidance task; CPCM: Concurrent Pictorial Choice Measure.
Discussion
In Study 1, experimentally induced state anxiety using the 7.5% CO2 challenge led to higher alcohol choice, supporting our hypothesis. However, there was no clear evidence of a differential effect of state anxiety on cognitive bias towards alcohol (versus neutral) cues. Coping-related drinking cognitions and trait anxiety measures did not correlate with magnitude of difference in Stroop errors, Stroop RTs or alcohol choice produced by the CO2 inhalation.
In Study 2, state anxiety increased alcohol choice, although evidence was weaker than in Study 1. Furthermore, there was evidence of an interaction between state anxiety and DTC; alcohol choice was higher among participants reporting high (than low) DTC, particularly in the CO2 condition. There was no clear evidence of an effect of state anxiety on alcohol craving. Although there was evidence of an interaction between state anxiety and image type on AAT bias scores, this was not in the direction predicted. Finally, the anxiety, stress, and isolation subscales of the DMC and DMC total scores positively correlated with magnitude of difference in alcohol choice produced by CO2 inhalation. However, none of the subscales were independent predictors.
In Study 3, there was no clear evidence of an association between naturally occurring state anxiety and alcohol choice, contrary to our hypothesis. Although state anxiety was associated with higher alcohol craving, associations were attenuated when adjusting for substance use confounders. Trait anxiety was positively associated with alcohol craving and harmful drinking, and DTC was positively associated with all alcohol outcomes, in the fully adjusted models. There was no clear evidence of a state anxiety × DTC interaction, a trait anxiety × DTC interaction, or a state anxiety × DTC interaction on alcohol choice and alcohol craving.
By triangulating results from observational and experimental studies that have different sources of potential bias (Lawlor et al., 2016), we aimed to strengthen the inference we were able to draw from our data. This is the first study to investigate the effects of state anxiety on alcohol-related outcomes, and the moderating role of DTC, using the 7.5% CO2 model. We have therefore built on previous experimental studies that have used alternative methods of manipulating anxious states. There was some evidence of an effect of state anxiety on alcohol choice, and an interaction between state anxiety and DTC on alcohol choice, supporting previous studies (Hardy and Hogarth, 2017; Hogarth and Hardy, 2018b; Hogarth et al., 2018; Shuai et al., 2020). These findings have potential health implications, given that alcohol choice is positively correlated with alcohol dependence severity (Hardy et al., 2018). However, there was no clear evidence of an effect of state anxiety on alcohol craving, failing to support other stress-induction experiments (Fox et al., 2007; Kwako et al., 2015). By examining associations of state anxiety with alcohol-related outcomes, Study 3 also builds on previous observational research that has focused on measures of trait anxiety or anxiety disorders. For example, Hardy et al. (2018) found a positive association between generalised anxiety symptoms and alcohol choice in treatment-enrolled drinkers, however we found no clear evidence of an association between state anxiety and alcohol choice. DTC predicted all alcohol outcomes in the observational study, and alcohol choice in the experimental study. DTC may therefore be a more reliable target for intervention than anxiety – a claim supported by other researchers (Anker et al., 2017).
The alcohol choice results in Study 1 were not replicated in Study 3. The lack of clear evidence in Study 3 may have been due to the low levels of state anxiety among participants completing an online survey (M = 35.47, SD = 11.10), compared to levels of state anxiety during the CO2 inhalation (M = 50.74, SD = 11.79). Alternatively, there may be no true association between state anxiety and alcohol choice; the experimental effect may have been a false positive, perhaps because the artificial induction of state anxiety in a laboratory setting may have lacked ecological validity. The alcohol craving findings were also not consistent between Studies 2 and 3. There may be a timing effect, where the urge to drink alcohol does not occur immediately after an aversive experimental procedure. We also had stricter exclusion criteria in Study 2 for safety reasons (low risk drinkers only) compared to Study 3 (any alcohol drinker). Excluding high risk drinkers may have screened out people who are likely to exhibit alcohol craving.
There were disparate alcohol choice and alcohol craving findings in Study 2, which could be explained by the nature of both measures. Direct measures (e.g. questionnaires) explicitly ask respondents about their drinking behaviour, and involve controlled deliberate responses. Indirect measures (e.g. computer tasks), on the other hand, can capture faster, more automatic cognitive processes (Klein et al., 2011). With neutral instructions, the CPCM may reflect a more subconscious, automatic motivation for alcohol, compared to the AUQ, which explicitly asks participants how much they crave an alcoholic drink in that moment.
The inconsistent alcohol choice and AAT findings in Study 2 are most likely due to the unreliability of the AAT. They may also be due to differences in the neutral stimuli (food versus non-alcoholic drinks). Therefore, the effect of state anxiety on alcohol choice may instead be attributable to thirst, or decreased appetite for food, rather than motivation for alcohol specifically. However, there were very weak correlations between alcohol choice and thirst (rs = .10) and hunger (rs = −.13) in Study 3 where we collected that data. A future study could include three types of image (alcoholic drink, non-alcoholic drink, food) to tease apart preferences.
Using a computer task to measure alcohol choice, instead of giving participants the option to consume real alcoholic drinks, reduces the ecological validity of the experiments. However, a disadvantage of consumption tasks is that any effect of anxiety on alcohol motivation is likely to be masked (washed out) by alcohol consumption, making it harder to detect this effect. Furthermore, real alcohol consumption tasks or taste tests would not have been suitable for our study with a within-participant design, and a single laboratory session. Having two laboratory sessions whilst retaining the within-participant design would overcome the problems of intoxication. We would be interested in exploring this option in a future study.
There were further limitations. First, food images may not represent neutral stimuli given that some individuals emotionally eat to cope with stress and anxiety (Thayer, 2001). Although others have found no effect of stress on food craving (Stojek et al., 2015). Second, participants may have selected alcohol images if the food images did not reflect their preferences. Likewise, participants may not be responsive at all to pictures of alcoholic drinks if they prefer specific brands (Field and Christiansen, 2012). Third, the studies were not powered for the exploratory analyses, which should be borne in mind when interpreting the interaction results. Fourth, in Study 2 we recruited participants based on high and low DTC scores (and excluded middle scorers), instead of dichotomising a continuous DTC measure after data collection, with the aim of producing a cleaner measure and enhancing our ability to detect effects. However, critics of this ‘extreme groups approach’ (selecting cases based on extreme scores) argue that this approach may inflate effect sizes, and higher power and reliability can be achieved by using data from the full range of the independent variable (Preacher, 2015; Preacher et al., 2005; Royston et al., 2006). It would therefore be worth replicating these findings in an unselected sample, ideally across a broad range of DTC scores. Finally, although online studies have several strengths relative to laboratory studies, such as speed, lower costs, and access to a more representative sample, participants may respond with less diligence and honesty due to the absence of a researcher, which may impact internal validity (Woods et al., 2015). However, we excluded data from participants who failed our attention check question, to improve data quality.
Experimentally induced state anxiety using the 7.5% CO2 challenge increased alcohol choice (i.e. preference) in social drinkers, and these effects were greater among individuals who reported DTC, supporting previous studies (Hardy and Hogarth, 2017; Hogarth et al., 2018). However, these findings were not replicated in our observational study of naturally occurring state anxiety. There was no clear evidence of an effect of experimentally induced state anxiety on cognitive bias to alcohol cues, alcohol craving, or approach tendencies towards alcohol stimuli. Our primary findings on alcohol choice have potential health implications. Interventions that aim to reduce anxious states, particularly among individuals who are prone to drinking alcohol to cope with negative affect, may reduce preferences for alcohol.
Footnotes
Acknowledgements
We would like to thank Andy Eastwood for sharing his AAT that we modified for Study 2, and the following students who contributed to experimental data collection: Louisa Mason, Mathias Johnsen, Daisy Macioccu, Alisha Mehta, Emily Jowett, and Isabel Mitchelson.
Author contributions
AA, MM and LH designed Study 1. MD, AA, LH, JH, MH and MM designed Study 2 and Study 3. LH created the original Concurrent Pictorial Choice Measure. AB programmed the tasks in Study 1. MD modified a previously programmed task for Study 2. SS programmed the task in Study 3. MD collected the Study 3 data and some of the Study 2 data. MD analysed all study data. MD wrote the manuscript, with contributions and revisions from all authors. All authors approved the final version of the manuscript for submission.
Declaration of conflicting interests
The authors declared no potential conflicts of interest with respect to the research, authorship, and/or publication of this article.
Funding
The authors disclosed receipt of the following financial support for the research, authorship, and/or publication of this article: This work was supported by the MRC Addiction Research Clinical Training Programme (MARC), the Medical Research Council Integrative Epidemiology Unit (MRC IEU) at the University of Bristol (MC_UU_00011/7), and the NIHR Biomedical Research Centre at University Hospitals Bristol NHS Foundation Trust and the University of Bristol. The views expressed in this publication are those of the authors and not necessarily those of the NHS, the National Institute for Health Research or the Department of Health and Social Care.