
Abstract
Background:
Caffeine is one of the most widely consumed psychostimulants, and it impacts sleep and circadian physiology.
Aim:
Caffeine is generally used chronically on a daily basis. Therefore, in the current study, we investigated the chronic effect of caffeine on sleep in mice.
Methods:
We recorded the electroencephalogram and electromyogram on a control day, on the first day of caffeine consumption (acute), and following two weeks of continuous caffeine consumption (chronic). In the latter condition, a period of six-hour sleep deprivation was conducted during the light period. Control mice, which received normal drinking water, were also recorded and sleep deprived.
Results:
We found that caffeine induced differential effects following acute and chronic consumption. Over 24 h, waking increased following acute caffeine whereas no changes were found in the chronic condition. The daily amplitude of sleep–wake states increased in both acute and chronic conditions, with the highest amplitude in the chronic condition, showing an increase in sleep during the light and an increase in waking during the dark. Furthermore, electroencephalogram slow-wave-activity in non-rapid eye-movement sleep was increased, compared with both control conditions, during the first half of the light period in the chronic condition. It was particularly challenging to keep the animals awake during the sleep deprivation period under chronic caffeine.
Conclusions:
Together the data suggest an increased sleep pressure under chronic caffeine. In contrast to the traditional conception on the impact on sleep, chronic caffeine intake seems to increase the daily sleep–wake cycle amplitude and increase sleep pressure in mice.
Introduction
Caffeine is a psychoactive stimulant that is commonly used worldwide. It mainly acts as a nonselective adenosine receptor antagonist, disrupting sleep and increasing alertness in mammals (Einöther and Giesbrecht, 2013; Fredholm et al., 1999; Lazarus et al., 2017). At doses generally consumed by humans, caffeine produces its arousing effect by partial nonselective blockade of adenosine 1 and adenosine 2A receptors (Clark and Landolt, 2017; Lazarus et al., 2017; Roehrs and Roth, 2008).
Sleep is considered to be regulated by two main processes (Borbély et al., 2016; Daan et al., 1984). The timing of sleep is regulated by the circadian pacemaker, which in mammals is located in the suprachiasmatic nucleus (SCN) of the hypothalamus (Meijer and Rietveld, 1989). The depth of sleep is homeostatically regulated, with increasing sleep propensity during waking and dissipation of sleep pressure during sleep. Prolonged waking is compensated by deeper and sometimes longer sleep. In mammals, the homeostatic sleep process is reflected in electroencephalogram (EEG) slow-wave activity (SWA; EEG power density below 5 Hz) during non-rapid eye-movement (NREM) sleep (Borbély et al., 2016; Daan et al., 1984; Deboer, 2015), with higher SWA representing deeper sleep or higher homeostatic sleep pressure.
Adenosine release in the brain shows a positive correlation with the previous amount of waking (Kalinchuk et al., 2011; Porrka-Heiskanen et al., 1997), and adenosine administration induces deep NREM sleep with high amplitude slow-waves (Bennington et al., 1985; Schwierin et al., 1996). Adenosine is therefore one of the substances thought to be involved in sleep homeostatic regulation (Landolt, 2008). Acute application of caffeine is known to reduce or disturb sleep in a dose dependent manner (Hindmarch et al., 2000; Karacan et al., 1976; Rosenthal et al., 1991; Yanik et al., 1987) and it reduces EEG SWA in subsequent NREM sleep in humans and rodents (Carrier et al., 2009; Drapeau et al., 2006; Landolt et al., 1995a, 1995b, 2004, Schwierin et al., 1996). Recently it was suggested that both acute and chronic caffeine lengthen the circadian period (Ding et al., 1998; Narishige et al., 2014; Oike et al., 2011; Van Diepen et al., 2014) and acute caffeine treatment delays dim light melatonin onset in humans (Burke et al., 2015). Therefore, caffeine not only influences sleep homeostatic mechanisms, but probably also the circadian clock.
In most animal studies the effects of caffeine on adenosine-related sleep regulatory mechanisms are investigated by acute administration of caffeine through intraperitoneal (i.p.) injections (Deboer et al., 2013; Jha et al., 2017; Schwierin et al., 1996; Van Diepen et al., 2014; Vivanco et al., 2013). Considering that in real life caffeine is used chronically as a stimulant, it is remarkable that sleep polysomnographic studies investigating the effect of chronic caffeine use are rare. Sleep in cats normalised under chronic caffeine, after an initial increase in waking, but deeper stages of sleep remained below baseline levels (Sinton and Petitjean, 1989). One study in humans showed that acute caffeine consumption increased sleep latency and decreased sleep, however, these effects faded out after one week of chronic caffeine consumption (Bonnet and Arand, 1992). Epidemiological studies support the idea that increased caffeine use is associated with shorter or more disturbed sleep (reviewed by Clark and Landolt, 2017; Roehrs and Roth, 2008). Nevertheless, long-term EEG recordings under chronic caffeine consumption are lacking, being difficult to perform in humans.
To better approach the normal caffeine consumption pattern in humans and investigate the impact of chronic caffeine consumption on sleep, we subjected mice to caffeine in the drinking water for two weeks. Sleep and the sleep EEG were recorded under control conditions, with normal drinking water, during the first day in which the mice received caffeine in the drinking water, and following two weeks of chronic treatment with caffeinated drinking water. In addition, in the chronic condition the mice were sleep deprived for six hours and recovery sleep was analysed. We found that chronic caffeine intake increases the daily light–dark amplitude of the sleep–wake rhythm and deepens sleep during the rest phase.
Materials and methods
Animals
Twelve-week-old male C57BL/6JOlaHsd mice (Harlan, Horst, The Netherlands) were used in this study. All mice were housed under controlled conditions (12 h:12 h light:dark cycle, lights on at 10:00) with food and water ad libitum in a temperature-controlled room (23–24°C). All animal experiments were approved by the Animal Experimental Ethical Committee of the Leiden University Medical Center (LUMC) and were carried out in accordance with the EU directive 2010/63/EU on the protection of animals for scientific purposes.
At the age of 12 weeks, animals were operated under deep anaesthesia and EEG and electromyogram (EMG) electrodes were implanted as described previously (Deboer et al., 2007; Deboer et al., 2013; Panagiotou et al., 2017). One EEG electrode was placed over the right hemisphere (2 mm lateral to midline of the skull, 2 mm posterior to bregma) above the somatosensory cortex, while the other was placed above the cerebellum (at midline, 2 mm caudal to lambda). The EMG electrodes were placed on the neck muscle (left and right of midline). The wire branches of the electrodes were set in a plastic pedestal (Plastics One, Roanoke, Virginia, USA) which was fixed to the skull with dental cement. The mice were allowed to recover for at least seven days. After the surgery the animals remained single-housed until the end of the experiment.
Drug preparation
Caffeine (LUMC Pharmacy) was dissolved in the drinking water at a concentration of 0.8 mg/mL (0.08%). This concentration was found to have significant effects on the circadian rhythm (Oike et al., 2011; Van Diepen et al., 2014), and is equivalent to the caffeine concentration in ordinary drip coffee. The animals drank approximately 6 mL water per day, both in the caffeinated condition as in the control condition. Before the start of the experiment the mean weight of the animals was 29.6 (±0.7 standard error of the mean (SEM)) g. Shortly before the animals were taken off the caffeinated water the average weight was 30.1 (±0.4) g. We do not have any indication that the animals drank or ate different amounts during the period the water was caffeinated.
EEG recordings
The EEG and EMG were recorded with a portable recording system (PS 1 System, Institute of Pharmacology and Toxicology, Zurich, Switzerland) as previously described (Deboer et al., 2007; Deboer et al., 2013; Panagiotou et al., 2017). Before each recording, a calibration signal was recorded on the EEG and EMG channels. Both signals were amplified (~2000 times), conditioned by analogue filters and sampled at 512 Hz. The signal was filtered through a digital finite impulse response filter and stored with a resolution of 128 Hz. EEG power spectra were computed for four-second epochs. For the recordings, the animals were placed in the experimental chambers and connected through a flexible cable and a counterbalanced swivel with the recording system. Conditions in the experimental chamber were similar to the home cage. The animals were allowed to adjust to the experimental conditions for at least a week.
In seven animals a control day was recorded, starting at dark onset. At the start of the second dark period the water bottles were replaced by bottles with caffeinated drinking water (acute caffeine). After two weeks on the caffeinated drinking water, recordings were resumed (chronic caffeine baseline and sleep deprivation), starting at lights on. At the start of the second day, six hours of sleep deprivation were conducted by gentle handling, which is a mild intervention in order to induce elevated sleep pressure conditions (Huber et al., 2000; Deboer et al., 2013; Panagiotou et al., 2017). During that period, every time the animals appeared drowsy or the EEG exhibited slow-waves, the animals were mildly disturbed by noise, movement of the bedding, or introducing fresh food or nesting material into the cage. EEG and EMG were recorded continuously during sleep deprivation and the following 18 h to investigate the effects of the sleep deprivation on subsequent sleep and waking. A second set of mice (n=11, controls=2), which were kept on normal drinking water, were recorded under similar conditions and were sleep-deprived in the same way as controls. It should be noted that, although the sleep-deprivation protocol was conducted in a similar way, it was more challenging in the chronic caffeine-treated mice. With a similar number of mice, only one experimenter was needed for the control sleep deprivation, whereas two were occupied with the sleep-deprivation experiment in the chronic caffeine condition, albeit with a less successful outcome.
Behavioural activity
After finalising the EEG and EMG recordings, mice on chronic caffeine were transferred to cages containing passive infrared (PIR) motion detectors (Hugrosens Instruments, Löfflingen, Germany). The PIR detectors were connected to a ClockLab data collection system (Actimetrics, Illinois, USA). The number of PIR counts was measured and stored on a computer in one-minute bins. The mice remained for another two weeks on caffeinated drinking water and were subsequently transferred to normal drinking water for another two weeks. Activity strength was analysed with F-periodograms as previously described (Jenni et al., 2006; Stenvers et al., 2016).
Data analysis and statistics
Three sleep–wake states (waking, NREM sleep, and REM sleep) were scored offline in four-second epochs by visual inspection of the EEG and EMG signals, as well as EEG power density in the slow-wave range, as described previously (Deboer et al., 2007; Deboer et al., 2013; Huber et al., 2000; Panagiotou et al., 2017). Epochs with artefacts were excluded from the subsequent analysis of power spectra, but sleep–wake states could always be determined. Light, dark and 24-hour mean values of sleep–wake states, as well as two-hour values of sleep–wake states and EEG SWA in NREM sleep were analysed. Sleep–wake state episodes were determined with an algorithm as described previously (Deboer et al., 1994; Huber et al., 2000).
To test the effect of caffeine, one-way (factor ‘treatment’) and two-way repeated measures analysis-of-variance (rANOVAs) (factors ‘treatment’, ‘light–dark’ or factors ‘treatment’, ‘EEG-frequency’ or factors ‘treatment’, ‘time of day’) were performed followed by Bonferroni corrected or Tukey’s Honest Significant Differences (Tukey’s HSD) paired or unpaired t-tests where appropriate. In the case of statistical analysis including the second control group, in which different animals were used or regarding the EEG SWA analysis due to missing values, a repeated measures experimental design was not used; instead ordinary two- or three-way (factors ‘treatment’בtime of day’ or factors ‘treatment’, ‘day’, ‘time of day’) were performed.
Results
Rest-activity behaviour
The influence of caffeine on rest-activity rhythms was investigated by counting PIR activity in one-minute intervals over a period of approximately three weeks (Figure 1). During the first part of the recordings, the animals were provided with caffeinated drinking water, while in the second part with normal drinking water. Under chronic caffeine, the animals showed a slight delay in activity onset and an increase in activity in the first half of the dark period (two-way rANOVA factors ‘treatment’ p<0.001; ‘treatment’בtime of day’ p<0.001). No significant differences were found in total activity counts over 24 h or in the strength of the rhythm (p>0.1).
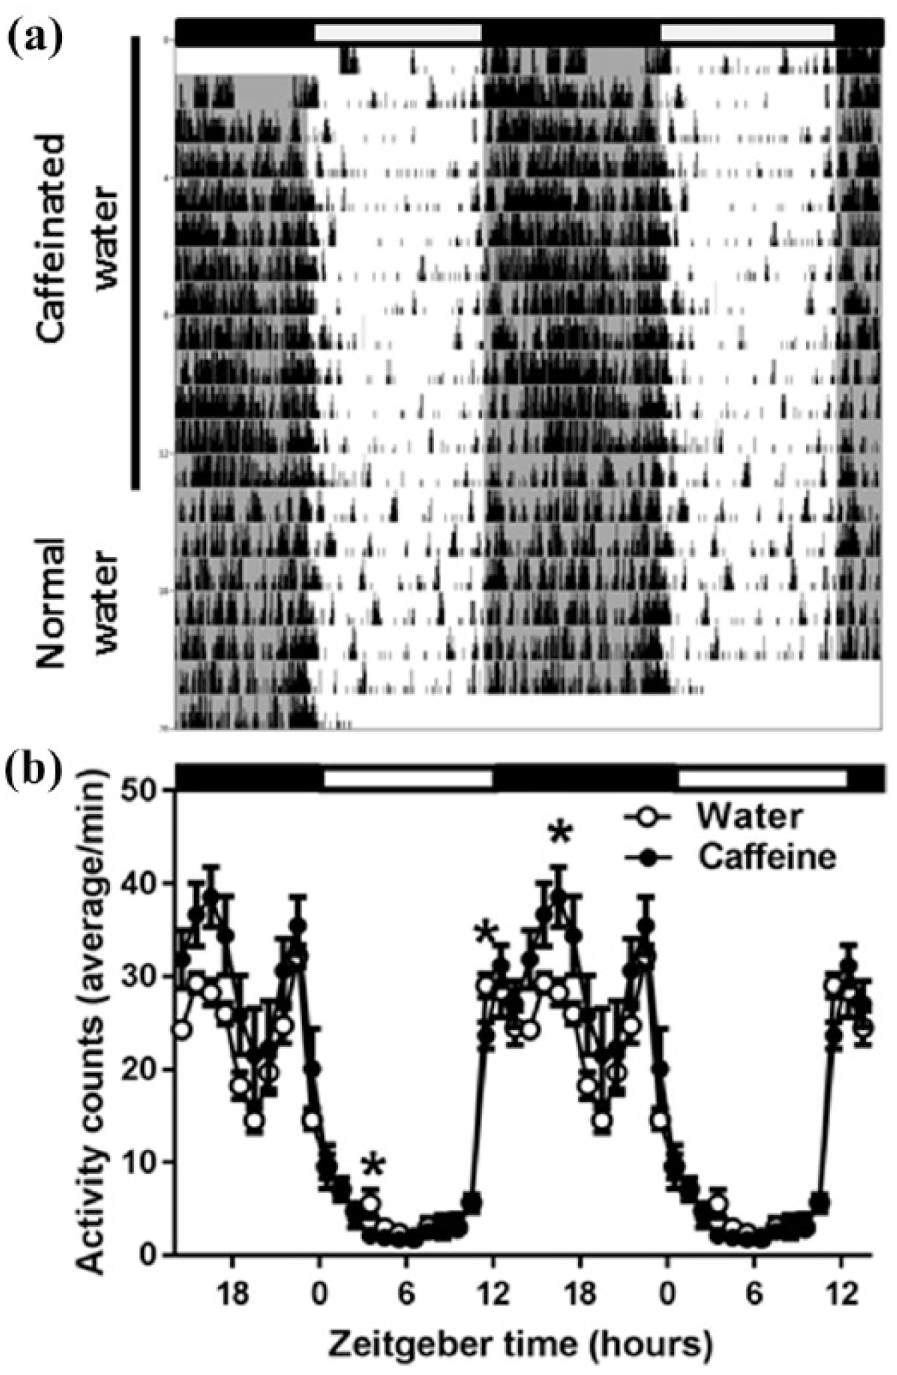
(a) A representative example of locomotor activity (passive infrared (PIR) recording) of the activity of a mouse. During the first 13 days the mouse drank exclusively caffeinated water (indicated by the black bar on the left). Subsequently, the bottle was replaced with normal drinking water. Black and white bars at the top indicate the light–dark cycle. (b) Average time course of locomotor activity over the last 10 days of chronic caffeine treatment and the first 10 days after return to normal water (n=7). Curves connect one-hour values (mean±standard error of the mean (SEM)) of locomotor activity recorded with a passive infrared sensor. The black and white bars indicate the light–dark cycle. Asterisks indicate significant differences between the two conditions (p<0.05 paired t-test, after significant two-way analysis of variance (ANOVA), factors ‘treatment’בtime of day’)
Sleep–wake states
Acute caffeine
Caffeine had pronounced effects on the distribution of sleep and waking over the day (Figures 2 and 3, 12-hour values in Figure 2: two-way rANOVA, interaction factors ‘treatment’בlight–dark’, waking: p<0.0001 and ‘treatment’ p=0.0053, ‘light–dark’ p<0.0001, NREM sleep: p<0.0001 and ‘treatment’ p=0.0024, ‘light–dark’ p<0.0001, REM sleep: p=0.26. Two-hour values in Figure 3: two-way rANOVA, factor ‘treatment’ for waking: p<0.0001, NREM sleep p<0.0001, REM sleep (not significant (n.s.)). Under acute caffeine, waking increased in the dark period, whereas it was not altered in the light period (Figures 2(a) and 3). NREM sleep mirrored this pattern with a decrease in the dark period and no change in the light period. Over 24 h the amount of waking was increased and NREM sleep decreased, reflecting the changes found in the dark period (Figure 2(a), one-way rANOVA, factor ‘treatment’, waking: p=0.0113, NREM sleep: p=0.0076, REM sleep: p=0.47). The changes in the dark period resulted in an overall increase in the difference between the light and dark period in the amount of waking and NREM sleep (Figure 2(b), One-way rANOVA, factor ‘treatment’, waking: p=0.0002, NREM sleep: p<0.0001). For the acute caffeine condition, NREM sleep episode duration and REM sleep episode frequency decreased in the dark period, showing a reduced NREM sleep episode consolidation (Table 1).
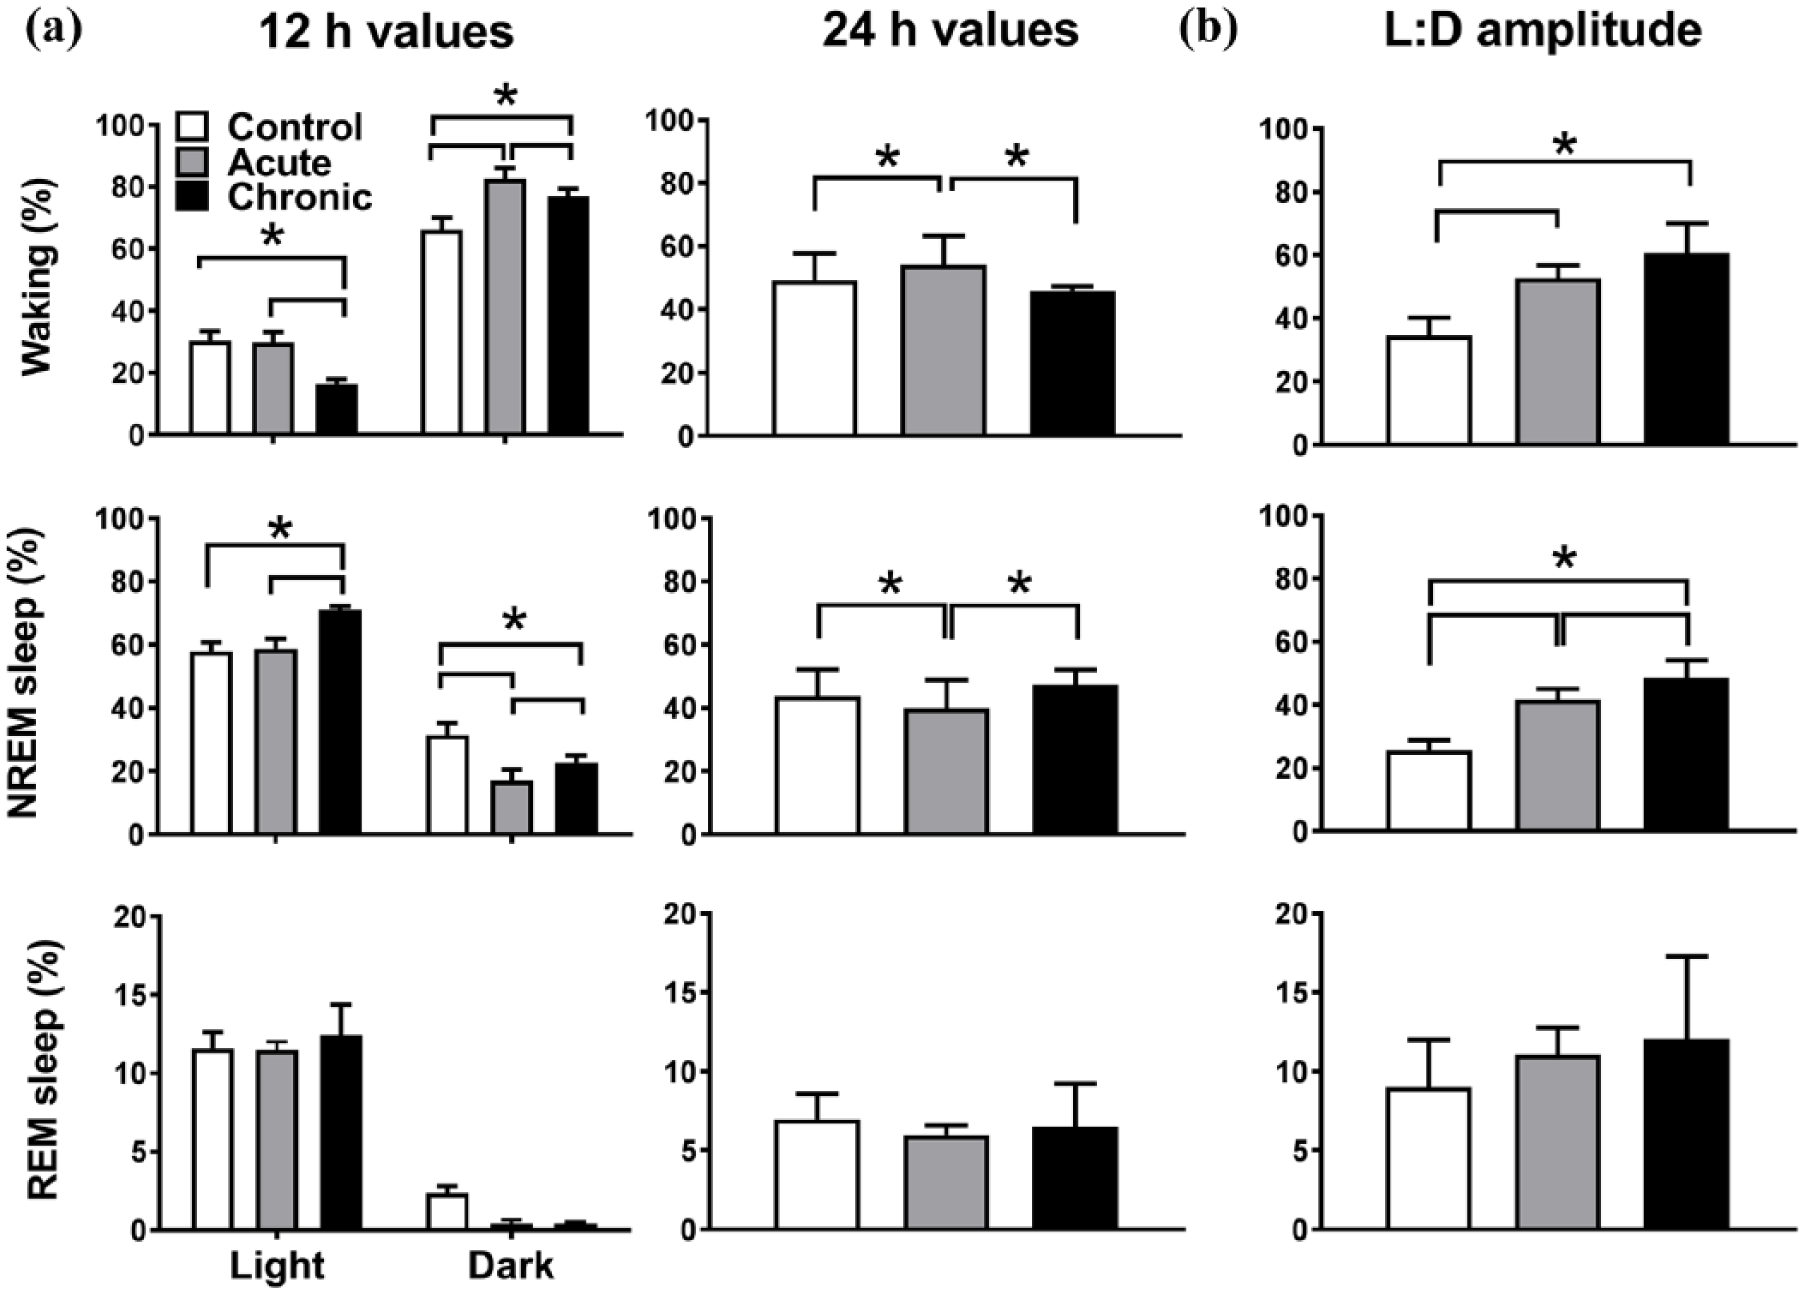
(a) Dark, light and 24-hour values of sleep–wake states (n=7). Note that the light and dark data for the chronic caffeine condition are plotted in reverse order of recording to match the order of recording of the control and acute condition. Asterisks indicate significant differences between conditions (post-hoc Tukey’s multiple comparisons test after significant two-way repeated analysis of variance (r-ANOVA), factors ‘treatment’בlight–dark’ or one-way r-ANOVA factor ‘treatment’ (24-hour values). (b) Light–dark amplitude of sleep–wake states. Asterisks indicate significant differences between conditions (p<0.05, post-hoc Tukey’s multiple comparisons test after significant one-way r-ANOVA factor ‘treatment’). NREM: non-rapid eye movement; REM: rapid eye movement.
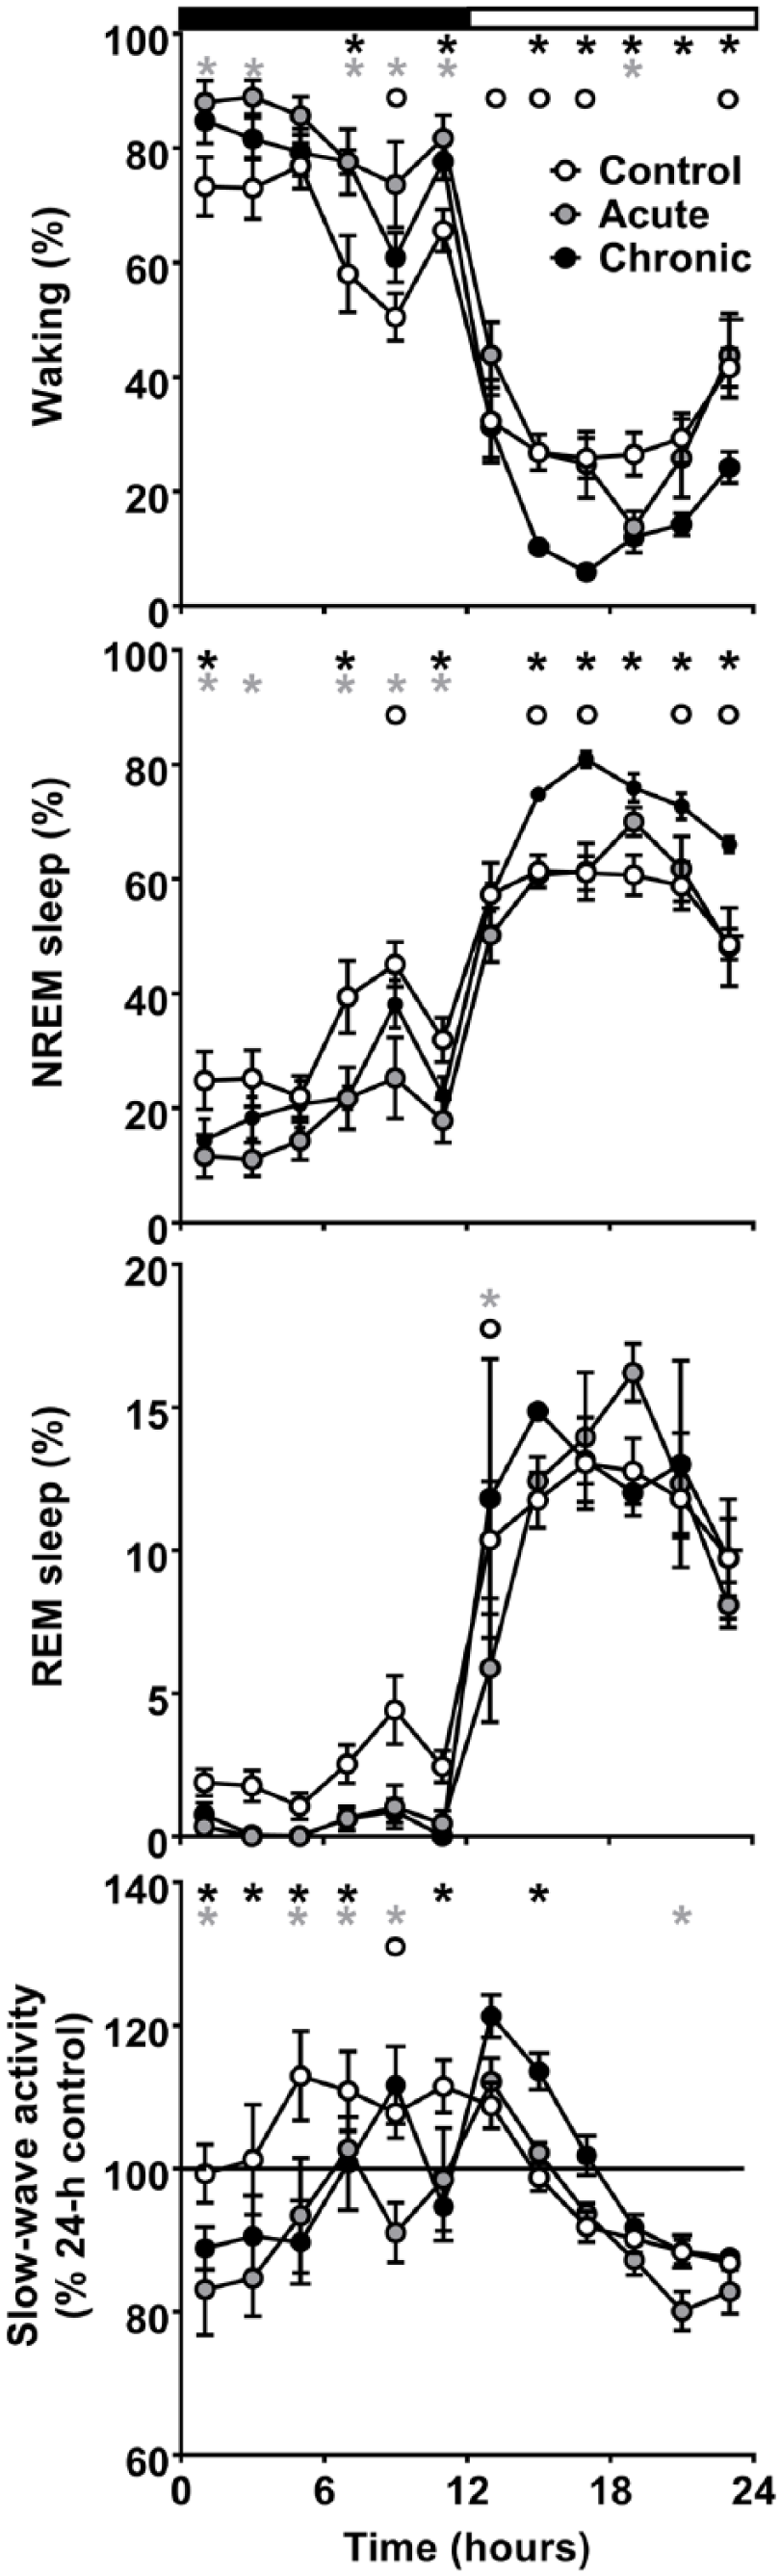
Time course of waking, non-rapid eye movement (NREM) sleep, rapid eye movement (REM) sleep, and electroencephalogram (EEG) slow-wave-activity (SWA) in NREM sleep for the 24-hour baseline day in the control condition and during the acute and chronic caffeine conditions (n=7). Note that the light and dark data for the chronic caffeine condition are plotted in reverse order of recording to match the order of recording of the control and acute condition. Curves connect two-hour values (mean±standard error of the mean (SEM)). The black and white bars indicate the light–dark cycle. Asterisks indicate significant differences between acute (grey) or chronic (black) caffeine condition compared with control. The circles indicate significant difference between the acute and chronic caffeine condition (p<0.05, Bonferroni multiple comparisons test after significant two-way ANOVA, factors ‘treatment’ or ‘treatment’בtime of day’).
Average 12-hour values of sleep–wake state episode frequency/h and duration (min).
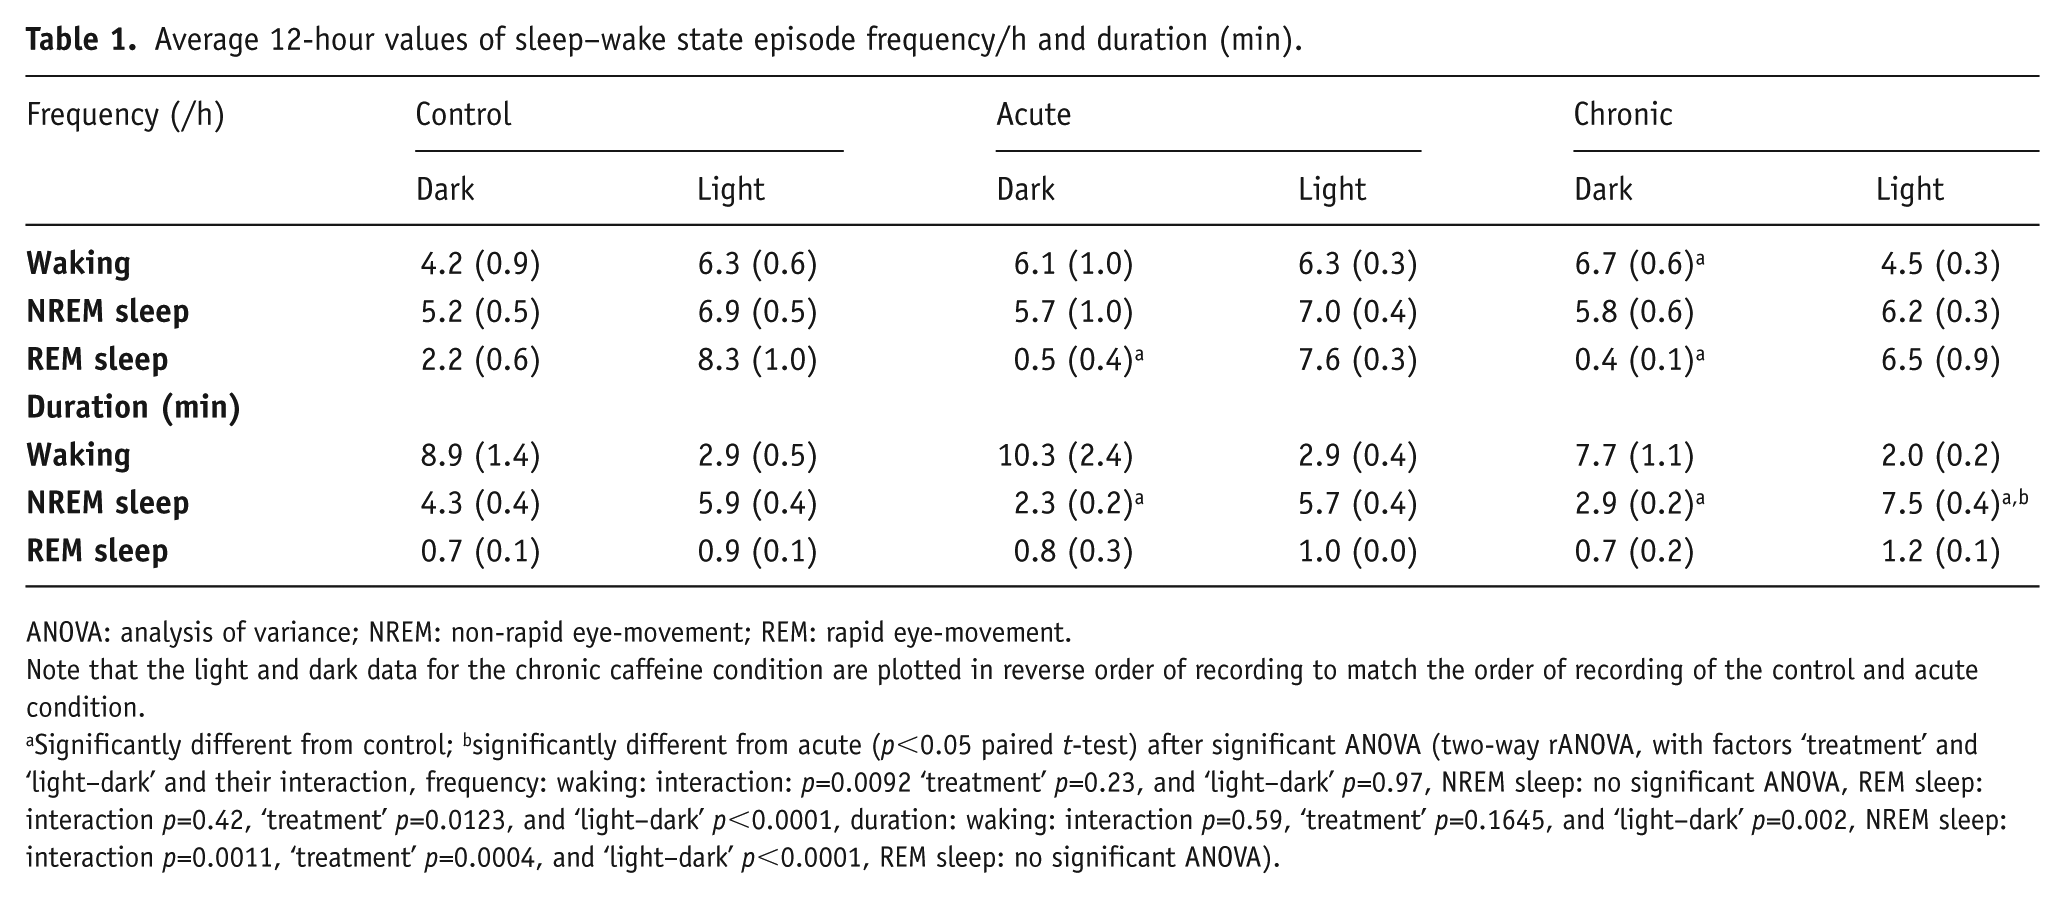
ANOVA: analysis of variance; NREM: non-rapid eye-movement; REM: rapid eye-movement.
Note that the light and dark data for the chronic caffeine condition are plotted in reverse order of recording to match the order of recording of the control and acute condition.
Significantly different from control; bsignificantly different from acute (p<0.05 paired t-test) after significant ANOVA (two-way rANOVA, with factors ‘treatment’ and ‘light–dark’ and their interaction, frequency: waking: interaction: p=0.0092 ‘treatment’ p=0.23, and ‘light–dark’ p=0.97, NREM sleep: no significant ANOVA, REM sleep: interaction p=0.42, ‘treatment’ p=0.0123, and ‘light–dark’ p<0.0001, duration: waking: interaction p=0.59, ‘treatment’ p=0.1645, and ‘light–dark’ p=0.002, NREM sleep: interaction p=0.0011, ‘treatment’ p=0.0004, and ‘light–dark’ p<0.0001, REM sleep: no significant ANOVA).
Chronic caffeine
Following two weeks of caffeine intake, the distribution of sleep was altered (Figures 2 and 3). Compared with the acute condition, waking during the dark period was decreased and the amount of NREM sleep was increased. However, increased waking and decreased NREM sleep in the dark period prevailed compared with control levels (Figures 2(a) and 3). Notably, during the light period the opposite effect was found. Interestingly, the 24-hour values of waking, NREM sleep and REM sleep returned to control levels and the amount of waking and NREM sleep differed significantly from the acute caffeine condition (Figure 2(a)). This resulted in a further increase in the daily amplitude of NREM sleep (Figure 2(b)).
Chronic caffeine consumption shortened NREM sleep episodes and reduced transitions into REM sleep in the dark period, similar to the acute caffeine condition (Table 1). This was accompanied by an increase in the number of waking episodes. However, in the light period, there was an opposite effect with an increase in the duration of NREM sleep episodes. The effects found in the dark period were very similar to those found in the acute condition but, in addition, chronic caffeine seemed to increase NREM sleep episode consolidation in the light period.
EEG power density
To investigate whether caffeine had an influence on brain functioning and alertness we investigated the EEG power density spectra of the mice during the different sleep–wake states (Figure 4) (two-way rANOVA, interaction factors ‘treatment’בEEG-frequency’, Waking: p<0.0001, NREM sleep: p<0.0001, REM sleep: p=0.0001). The acute effects of caffeine were moderate with a small decrease in power density found around 3 Hz and small increases around 7 and 9 Hz in the NREM sleep EEG. A similar decrease was found around 3-4 Hz in REM sleep. In the waking EEG, power density around 10 Hz was increased. The effects of chronic caffeine consumption were more pronounced, showing a significant decrease in power density below 8 Hz and an increase in the theta range (9–10 Hz) in the waking EEG, and a clear decrease in activity between 3 and 20 Hz in NREM sleep. In REM sleep, decreases were found in the slow-wave range (0.5–5 Hz), between 7–13 Hz, and around 17 Hz.
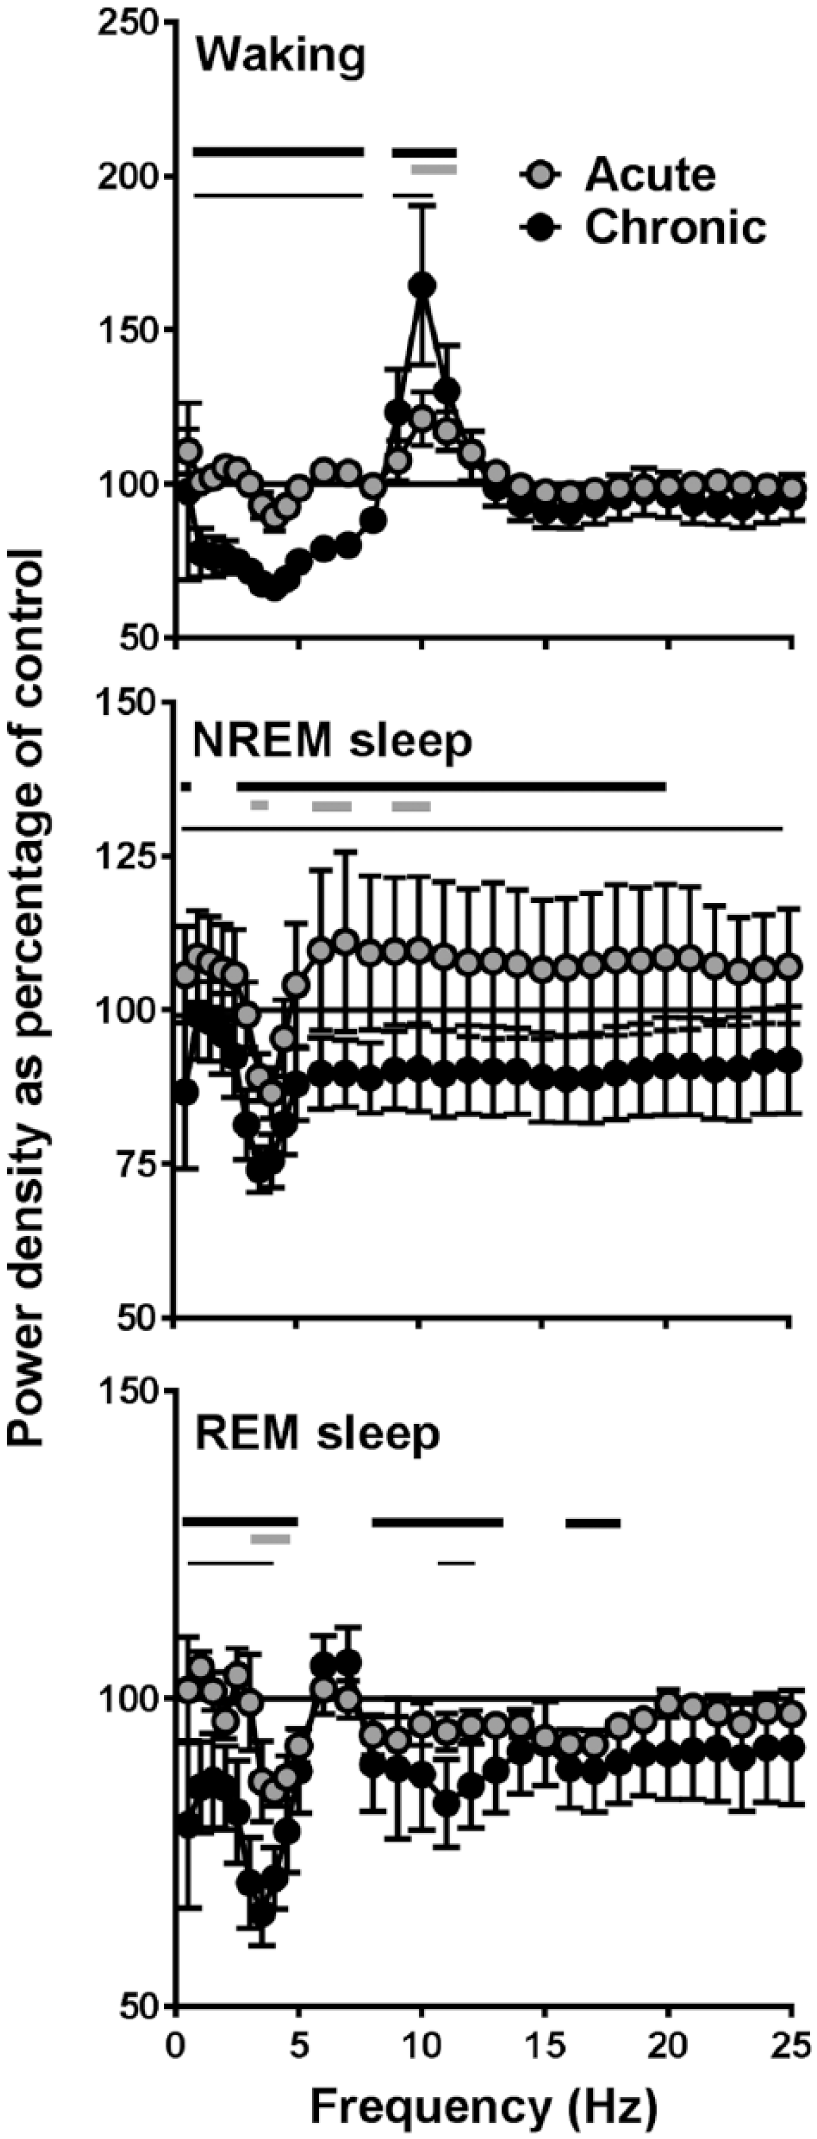
Electroencephalogram (EEG) power density in waking, non-rapid eye movement (NREM) sleep and rapid eye movement (REM) sleep. Between 0.25 and 5.0 Hz, values were calculated in 0.5-Hz bins and between 5.25 and 25.0 Hz in 1-Hz bins (n=7). Values are plotted at the upper limit of each bin. Curves connect 24-hour mean values of relative power density for the acute and chronic caffeine condition relative to the control condition (=100%). Thick lines above the curves indicate frequencies where the chronic caffeine (black) and acute caffeine (grey) conditions differ from control. Differences between the acute and chronic condition are indicated by thin black lines (p<0.05, Tukey’s multiple comparisons tests after significant two-way repeated analysis of variance (r-ANOVA), factors ‘treatment’בEEG-frequency’).
NREM sleep slow-wave activity
The redistribution of sleep and wakefulness, with less sleep during the dark period and more sleep during the light period, could affect sleep homeostasis. We, therefore, analysed the time course of EEG SWA during NREM sleep in the three conditions (Figure 3). In the control condition, SWA showed its well-known gradual decrease in the course of the light period and increase during the dark period (two-way ANOVA, interaction factors ‘treatment’בtime of day’ p=0.0002 and ‘treatment’, ‘time of day’ p<0.0001). In the acute caffeine condition, SWA levels were lower during several two-hour intervals in the dark period, but they did not differ from control levels during the light period. In the chronic caffeine condition, SWA levels were also lower during the dark period, but in contrast to the acute condition, they were significantly increased above control levels during the light period. This suggests that the animals had a higher sleep pressure and slept more deeply during the first part of the light period.
Effects of sleep deprivation
To test this further, a sleep deprivation was conducted during the first part of the light period, the time where the largest difference was found in SWA between the two groups. These data were compared with an additional group of animals that were provided with normal drinking water. The amount and time course of sleep and waking across the baseline day of this group did not differ from the data obtained from control day of the group subsequently drinking caffeinated water (data not shown).
The comparison of the baseline data between the chronic caffeine group and the second control group confirmed the changes found after application of chronic caffeine described above (three-way ANOVA, with factors ‘treatment’, ‘time of day’, ‘day’ and their interactions, waking: ‘time of day’ and ‘day’: p<0.0001, interaction ‘treatment’בtime of day’ p<0.0001, NREM sleep: ‘time of day’ and ‘day’ p<0.0001, and interaction ‘treatment’בtime of day’ p<0.0001, REM sleep: ‘treatment’, ‘time of day’ and ‘day’ p<0.0001, and interaction ‘treatment’×’time of day’ p<0.0001, SWA: ‘treatment’ p<0.0001, ‘time of day’ p=0.018, and interaction ‘treatment’בday’ p=0.008). During the light period, waking was decreased and NREM sleep was increased in the chronic caffeine condition Figure 5). In the dark period, the opposite was found, together with a decrease in REM sleep. In the chronic caffeine condition, SWA was above control levels during the first six hours of the light phase and lower than control levels during the first six hours of the dark phase.
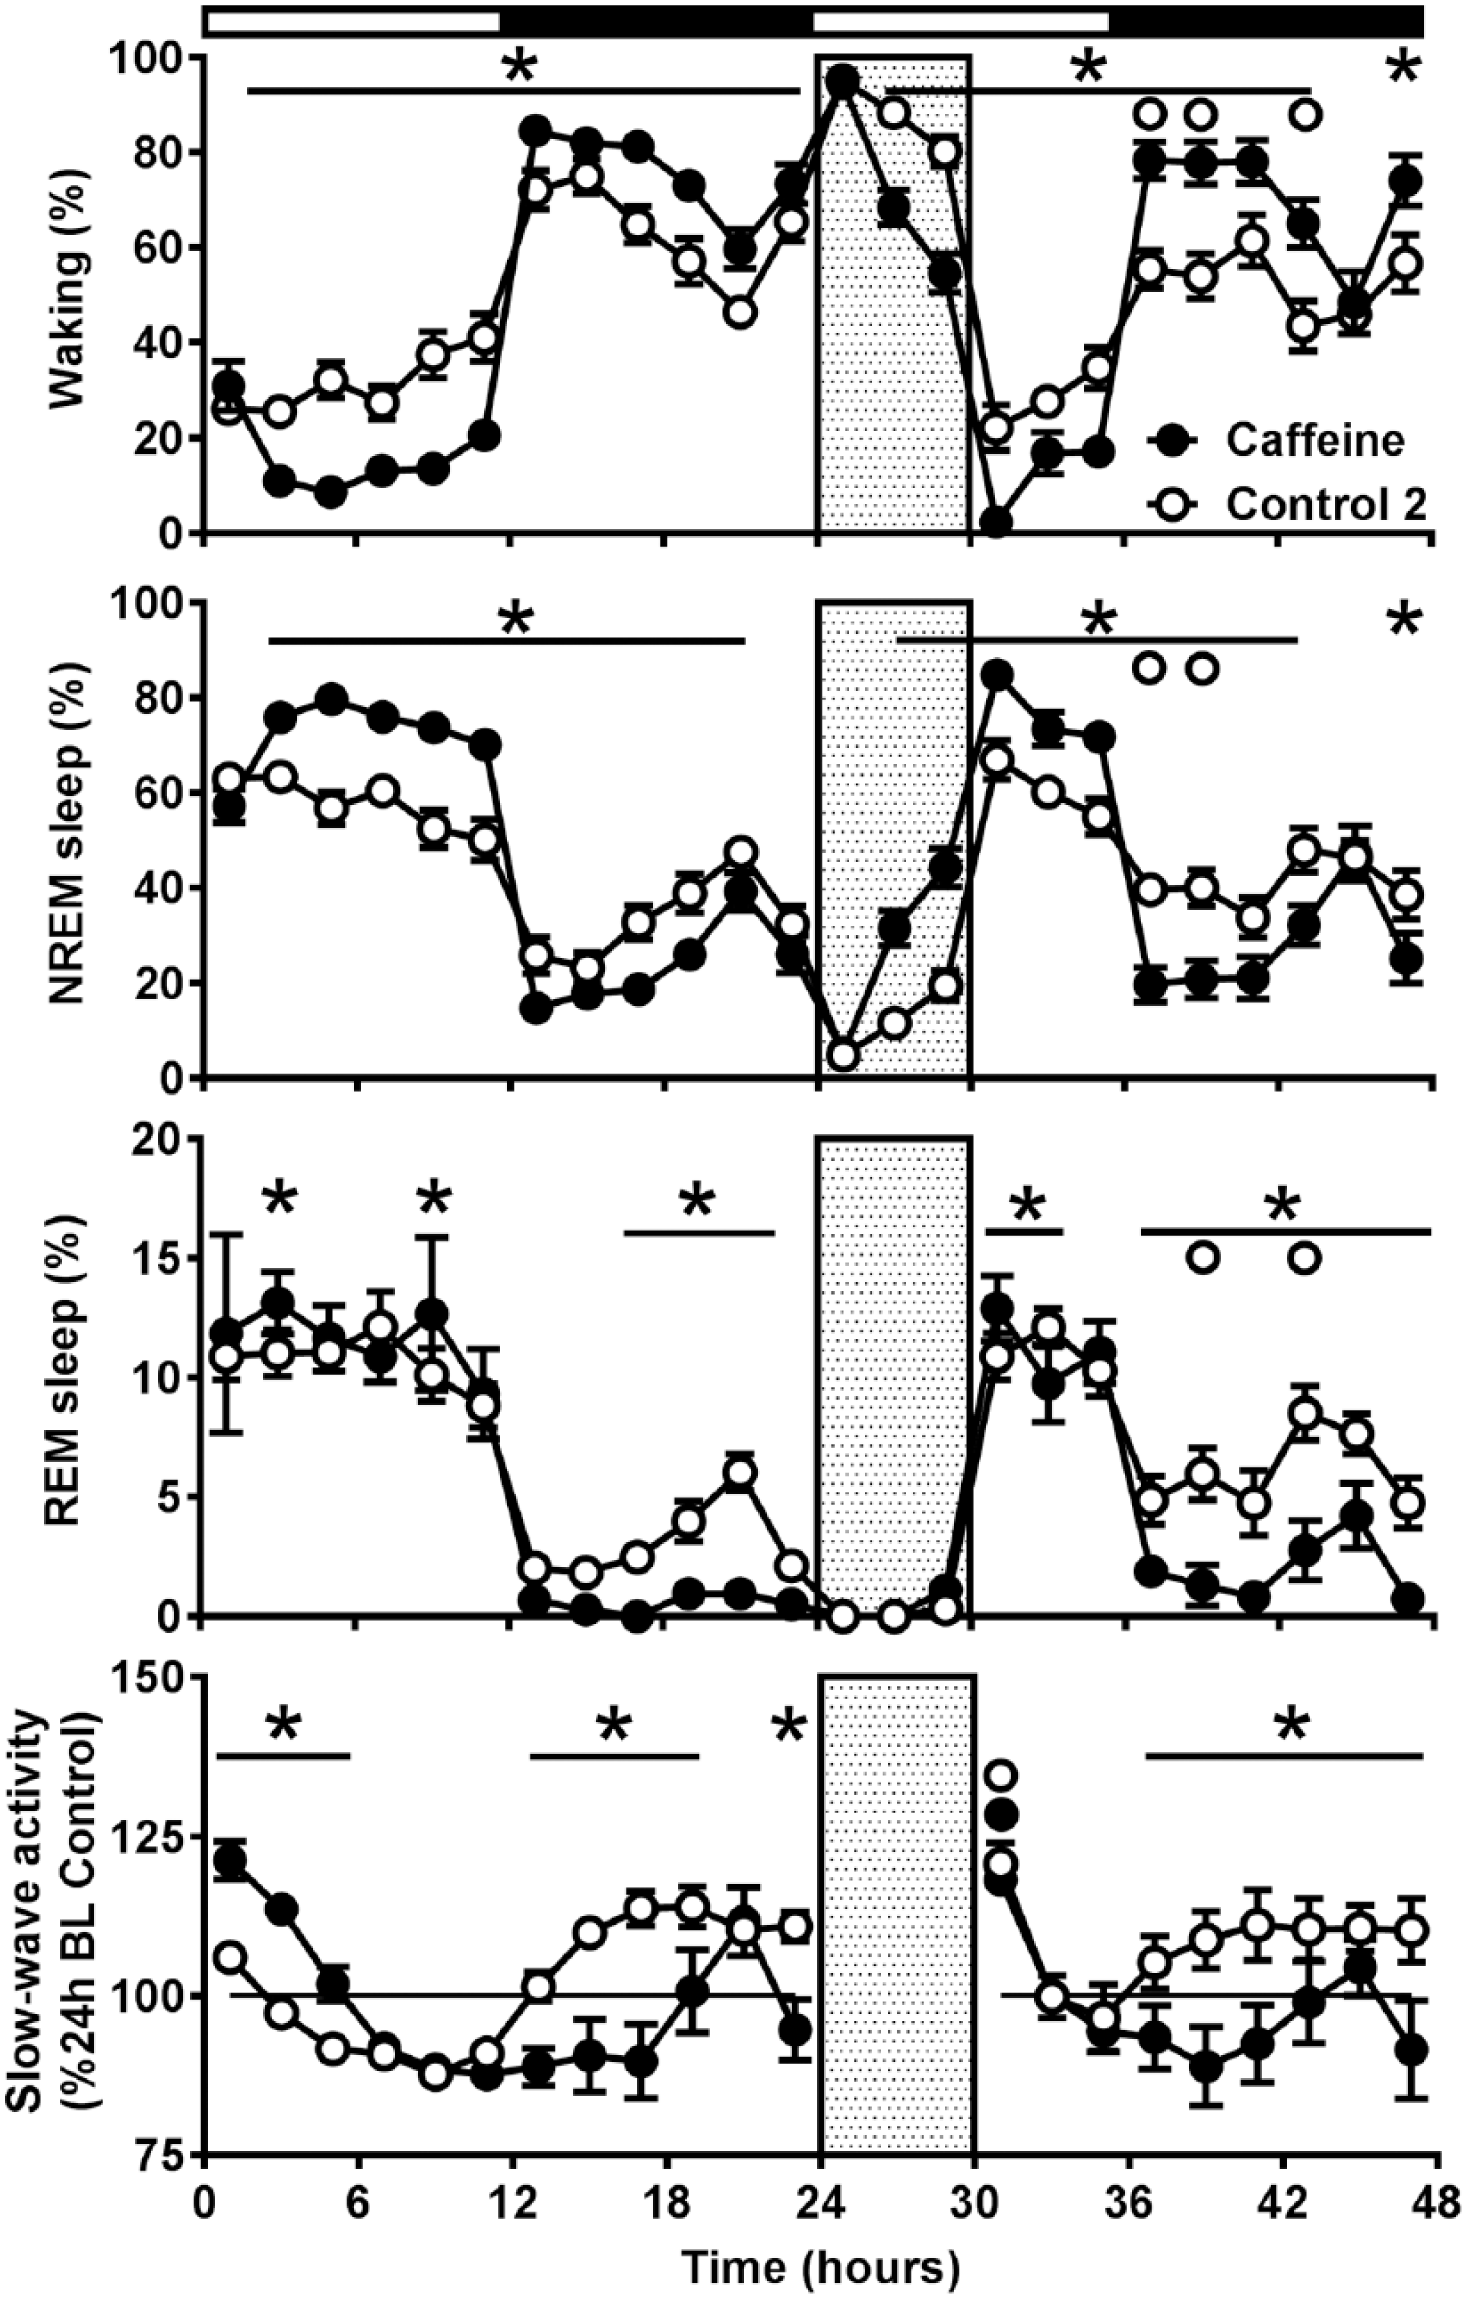
Time course of sleep–wake states and electroencephalogram (EEG) slow-wave-activity (SWA) in non-rapid eye movement (NREM) sleep, for 24 h baseline, six-hour sleep deprivation (SD, hatched area) and 18 h recovery for the second control group (n=11) and the chronic caffeine group (n=7). Curves connect two-hour values (mean±standard error of the mean (SEM)) of waking, NREM sleep, rapid eye movement (REM) sleep and EEG SWA. The black and white bars indicate the light–dark cycle. Asterisks and asterisks with lines indicate significant differences between the two groups. Significant effects of SD are indicated by open (control) and closed (chronic caffeine) circles (p<0.05, Bonferroni multiple comparisons test after three-way analysis of variance (ANOVA), factors ‘treatment’בtime of day’בday’ with significant interactions ‘treatment’בtime of day’ for waking, NREM and REM sleep and ‘treatment’בday’ for EEG SWA).
In the course of the sleep deprivation it was noted that, compared with the second control group, it was very difficult to keep the animals on chronic caffeine awake. In the initial two hours the amount of waking did not differ between the two groups. However, the level of waking in the chronic caffeine group dropped significantly below the level of the control group in the remaining four hours. The amount of REM sleep was equally low in both groups during sleep deprivation (~0%). In addition, in both groups SWA in NREM sleep was increased above baseline in the first two hours after sleep deprivation.
Discussion
Caffeine is widely used as a stimulant in order to increase waking and alertness. Validating the common conjecture that caffeine promotes arousal, the present study shows that acute intake of caffeine increases waking during the active phase. In accordance with previous studies, sleep was found to be less deep during the following rest phase, however, without consequences for the amount of sleep. Remarkably, chronic caffeine consumption changed this picture dramatically, with increased and deeper sleep during the main sleep period.
Acute effects
After replacing the normal drinking water with caffeinated water, the amount of waking in the dark period immediately increased, at the expense of NREM sleep of which the episodes were shorter. Although the total amount of REM sleep was not significantly affected, the number of REM sleep episodes was reduced. The data indicate that, during the dark (active) phase, NREM sleep consolidation was reduced and the animals switched more often to waking. In contrast, during the following light phase, caffeine did not induce any alterations in the amount of the different sleep–wake states. Caffeine is known to increase waking and decrease sleep when administered acutely (Bonnet and Arand 1992; Carrier et al., 2009; Deboer et al., 2013; Drapeau et al., 2006; Hindmarch et al., 2000; Karacan et al., 1976; Landolt et al., 1995a, 1995b, 2004; Rosenthal et al., 1991; Schwierin et al., 1996; Sinton and Petitjean, 1989; Yanik et al., 1987), and this is also our main finding in the acute condition.
The acute effects of caffeine on the waking EEG were not very pronounced and were limited to frequency bins in the theta range, indicating increased activity, exploratory behaviour and alertness (Fisher et al., 2016; Huber et al., 1999; Vyazovskiy and Tobler, 2005; Vyazovskiy et al., 2006). In both the NREM and REM sleep spectra, differences were evident in a few bins in the slow-wave range and in the theta range in NREM sleep. Subsequent analysis of the time course of SWA in NREM sleep showed a clear effect of acute caffeine, particularly in the dark period, in which SWA was reduced significantly. Also, at the end of the light period, SWA was lower compared with the control condition. These data are in line with previous EEG SWA changes after acute application of caffeine in rodents via i.p. injection (Jha et al., 2017; Schwierin et al., 1996) and humans via oral application (Carrier et al., 2009; Drapeau et al., 2006; Landolt et al., 1995a, 1995b, 2004).
Chronic effects
In the chronic condition, similar effects to those in the acute caffeine condition were found during the dark period, with increased waking and decreased NREM and REM sleep. However, during the light period additional changes were found. Compared with control and acute caffeine, waking was decreased and NREM sleep was increased in the light period. This was mainly caused by a significant increase in NREM sleep episode duration, indicating that NREM sleep consolidation in the light period was increased, in comparison with both the acute and control conditions. This is a remarkable finding, considering that caffeine is generally known to decrease NREM sleep consolidation and disturb sleep (Clark and Landolt, 2017; Roehrs and Roth, 2008). As a consequence, the 24-hour amplitude of the daily modulation of sleep and waking was further increased in the chronic condition. The rest-activity data obtained in the weeks after the sleep recording (Figure 1), where caffeinated water was replaced by normal water in the second week, suggest that the animals return to normal behavioural activity and sleep after caffeine withdrawal. After return to normal drinking water animals are less active during the dark and more active during the light period, compared with the period when caffeinated water was consumed.
The EEG power density spectra also showed alterations after chronic caffeine treatment. During waking, the activity in the slow-wave range was markedly reduced and theta activity was enhanced. This is in accordance with the spectral changes seen in mice when provided with a running wheel (Fisher et al., 2016; Vyazovskiy et al., 2006), suggesting that during waking in the chronic caffeine condition, the animals were more active. A similar decrease in the slow-wave range was found in the REM sleep spectrum consistent with a decrease found in an earlier study after acute caffeine consumption in humans (Landolt et al., 1995b).
In accordance, the changes in the daily distribution of sleep–wake states also showed a strong similarity to the changes occurring in animals with access to a running wheel, with increased sleep during the day and increased waking during the night, (Vyazovskiy et al., 2006). This is consistent with the finding that chronic caffeine, like wheel access (Van Diepen 2015), increases the amplitude of the circadian clock. Recently it was shown that caffeine not only modulates sleep homeostatic mechanisms, but also influences circadian clock function (Burke et al., 2015; Oike et al., 2011, Van Diepen et al., 2014). It has been shown that caffeine can increase circadian amplitude in vitro (Narishige et al., 2014) and that the influence of light on the SCN is increased (Van Diepen et al., 2014), which in turn may also lead to an increased circadian amplitude. An increase in the amplitude of the circadian clock may therefore underlie the increase in the 24-hour amplitude of the rest-activity and sleep–wake behaviour, and this can explain the increase in SWA and sleep pressure at the beginning of the light period. According to sleep homeostatic theory, increased waking in the active period will give a steeper increase in sleep pressure (Borbély et al., 2016; Daan et al., 1984). The opposite will occur in the rest period. When sleep is increased, a steeper decrease in sleep pressure will occur, and this is what was observed in the data.
During NREM sleep, chronic caffeine induced a significant decrease in frequencies between 3–20 Hz. Similar to the acute condition, NREM sleep SWA was attenuated for a large part of the dark period compared with control activity. In contrast, during the first part of the light period SWA was enhanced above control levels, and reached similar levels to those of control only shortly before dark onset. The increased SWA at the beginning of the light period suggests that sleep pressure was increased compared with control pressure. This notion is supported by the finding that NREM sleep duration was also increased during this period. To investigate whether sleep pressure was indeed increased during this part of the light period, a six-hour sleep deprivation was performed. Notably, keeping the animals awake was challenging during chronic caffeine intake, compared with the control condition. This is striking since it has been shown in several studies that animals acutely treated with caffeine will stay awake for several hours (Deboer et al., 2013; Schwierin et al., 1996; Yanik et al., 1987) and are very easy to keep awake in sleep deprivation protocols (Schwierin et al., 1996) and this is the experience of several of the authors of the current study. The results of the sleep deprivation experiment confirm our notion that in the chronic caffeine condition sleep pressure is increased in the first half of the light period, compared with control pressure.
The normalization of 24-h waking in the chronic condition could be caused by a reduction of sensitivity or an increase in tolerance to caffeine which was previously observed in humans (Bonnet and Arand, 1992), cats (Sinton and Petitjean, 1989) and rodents (Bhorkar et al., 2014; Dall’igna et al., 2003; Dubroque et al., 2014). However, the extent of tolerance development in humans is still controversial and not clearly established (Roehrs and Roth, 2008). The increase at the beginning of the light period in sleep and SWA in the chronic condition suggests that the sleep and slow-wave suppressing effect of caffeine is attenuated compared with the acute condition, supporting the notion that these animals are less sensitive to caffeine, or that caffeine is cleared from the system faster after they stop caffeine intake at the end of the dark period. The latter would result in larger differences in caffeine availability in the system over the day, with less caffeine available in the light period and more in the dark. Also changes in adenosine levels or adenosine receptors could contribute to this; it has been shown that chronic administration of caffeine increases the number of adenosine receptors in the rat and mouse (Boulenger et al., 1983; Nehlig et al., 1992). In addition, adenosine levels were shown to be increased in rats under chronic caffeine conditions (Conlay et al., 1997). When consumption of caffeinated water is reduced, at the onset of the rest phase of the mice, all these factors may enable the physiological expression of the increase in adenosine in the system, resulting in increased sleep and SWA at the start of the light period.
The question remains as to how the data can be translated to humans. Sleep regulatory mechanisms and circadian clock functioning are similar between mice and humans (Borbély et al., 2016; Meijer and Rietveld, 1989; Saper et al., 2005). However, humans are monophasic sleepers and active in the day, whereas mice are polyphasic and night-active. The timing of caffeine consumption relative to the rest-activity behaviour and the main sleep period is similar between humans and the mice in our experiment. Therefore, similar effects may occur in humans. On the other hand, humans have the possibility of changing to an alternative beverage when adverse effects of caffeine on behaviour or sleep occur, as opposed to the mice in our study, and this may reduce the effect of chronic caffeine consumption in those individuals.
The results in our mice show that habitual caffeine consumption has effects on sleep and sleep regulation, contrasting the effects of acute consumption of caffeine. These findings are important for the interpretation and prediction of the effects of caffeine consumption on sleep and alertness in the general population and may be useful for the therapeutic enhancement of circadian amplitude and improving sleep–wake cycles.
Footnotes
Declaration of conflict of interests
The author(s) declared no potential conflicts of interest with respect to the research, authorship, and/or publication of this article.
Funding
The author(s) disclosed receipt of the following financial support for the research, authorship, and/or publication of this article: This research was supported by the Dutch Technology Foundation (STW), provided to TD.