
Abstract
Background:
Recognising dying is a key clinical skill for doctors, yet there is little training.
Aim:
To assess the effectiveness of an online training resource designed to enhance medical students’ ability to recognise dying.
Design:
Online multicentre double-blind randomised controlled trial (NCT03360812). The training resource for the intervention group was developed from a group of expert palliative care doctors’ weightings of various signs/symptoms to recognise dying. The control group received no training.
Setting/participants:
Participants were senior UK medical students. They reviewed 92 patient summaries and provided a probability of death within 72 hours (0% certain survival – 100% certain death) pre, post, and 2 weeks after the training. Primary outcome: (1) Mean Absolute Difference (MAD) score between participants’ and the experts’ scores, immediately post intervention. Secondary outcomes: (2) weight attributed to each factor, (3) learning effect and (4) level of expertise (Cochran–Weiss–Shanteau (CWS)).
Results:
Out of 168 participants, 135 completed the trial (80%); 66 received the intervention (49%). After using the training resource, the intervention group had better agreement with the experts in their survival estimates (δMAD = −3.43, 95% CI −0.11 to −0.34, p = <0.001) and weighting of clinical factors. There was no learning effect of the MAD scores at the 2-week time point (δMAD = 1.50, 95% CI −0.87 to 3.86, p = 0.21). At the 2-week time point, the intervention group was statistically more expert in their decision-making versus controls (intervention CWS = 146.04 (SD 140.21), control CWS = 110.75 (SD 104.05); p = 0.01).
Conclusion:
The online training resource proved effective in altering the decision-making of medical students to agree more with expert decision-making.
Recognising dying is a core clinical skill.
There is inconsistent training in the United Kingdom and both medical students and doctors report feeling unsure and ill prepared when working with a dying patient and their family.
Our study suggests that the online training resource can alter what information medical students review, to make decisions more like that of the experts.
This online training resource could be used to facilitate learning in this complex area, and provide a complementary education approach to clinical training.
Introduction
Predicting survival is a key clinical skill for doctors.1,2 Accurate recognition of dying in acute hospitals can enable timely discharge to a preferred place of death, reduce unnecessary interventions and enable the dying person to spend time with their loved ones. 3
The General Medical Council (GMC) 4 oversees medical training in the United Kingdom. It recommends that all medical schools teach students about palliative care and caring for patients who are dying as part of their curriculum. There is little to no specific training in the clinical skill of prognostication embedded in medical school curricula.5–7 Undergraduate palliative care training has been implemented inconsistently across the United Kingdom1,8–11 with newly qualified doctors still reporting feeling unsure and ill prepared when caring for a dying person. 12 A key recommendation from the ‘More Care, less pathway’ 5 report was for NHS England and Health Education England to collaborate and to promote ‘evidence-based education and competency training for professionals working with people at the end of their lives . . .to ensure competency [in the diagnosis of dying]’. 5
In a previous study, we identified a group of expert palliative care doctors and asked them to review a set of hypothetical patient summaries, or ‘vignettes’. From these experts’ responses, we developed an online training resource to provide education in the skill of recognising dying. 13 This resource was very simple, non-interactive, containing mainly text and diagrams. Similar online training resources have been shown to improve clinical skills of health care professionals in other subject areas.14–16 The aim of this trial was to determine whether this newly developed training resource can help to improve the way that medical students recognise dying patients by bringing their decision-making process into closer alignment with palliative care experts.
Primary objective
To measure whether probabilities of death estimated by medical students who receive training in identifying dying patients are nearer to expert estimates than those who have not received training.
Secondary objectives
To determine if the medical students become more consistent and discriminatory in their prognostic decision-making.
To examine if, after receiving training, medical students weight the information presented in the vignettes more similarly to the experts.
To determine if the training effect is maintained after 2 weeks, when the training resource has been withdrawn.
Methods
This trial follows the CONSORT 2010 guidance. 17 The checklist can be found in Supplementary File 1. The study protocol 18 was registered prospectively on the ClinicalTrials.gov registry (identifier: NCT03360812) on 4 December 2017. This trial received ethical approval from the UCL Research Ethics Committee (8675/002) on 19 January 2018.
Trial design
An online multicentre double-blind randomised controlled trial using a 1:1 allocation ratio.
Patient and public involvement
Two medical students in their fourth year of medical school reviewed all study documents and piloted the website. Their comments on both the content and usability of the website were incorporated into the final study documents.
Participants
Penultimate or final year medical students from five UK medical schools were contacted. Students were approached either as part of a palliative care lecture, workshop or by email.
Intervention
The intervention group received the online training resource (see Supplementary File 2). The content of the resource described how a group of expert specialist palliative care doctors prioritised the various pieces of prognostic information. 13 Participants randomised to the control group received no training materials and were encouraged to continue on to the second set of vignettes.
Procedure
The participant timeline can be seen in Supplementary File 3. After providing electronic consent, participants were asked to provide demographic information about themselves and any experience with palliative care at baseline (t = 0). They were asked to provide their university email address so the study team could validate their attendance at the medical school and send out invitations for the follow-up assessment, gift vouchers and reminders if necessary. Students could also use their email address to log out and return to the trial website.
Participants were asked to complete the pre intervention (t = 1) and post intervention (t = 2) assessments. Both assessments could be completed immediately after baseline (t = 0). Pre intervention (t = 1), participants reviewed 40 patient vignettes, and provided a probability of death within 72 hours (0% certain survival – 100% certain death). Within these 40 vignettes, 10 were repeats, included in order to assess the participants’ level of expertise (see ‘Secondary outcomes’ for more detail). Post intervention (t = 2), participants reviewed 26 further vignettes (including six repeats). The participants in the intervention arm were able to re-access the training resource while providing a probability of death during (t = 2). At the 2-week follow-up (t = 3) participants repeated the (t = 2) task but without access to the training tool. Each participant had 4 weeks to complete this final (t = 3) assessment.
Participants were offered £30 online gift vouchers (£10 at t = 2, £20 at t = 3). At the end of the trial, they were able to download a certificate of completion.
Vignette development
The vignettes were generated using IBM SPSS. 19 An example vignette is shown in Figure 1. Items reported in the vignette are displayed in Table 1.
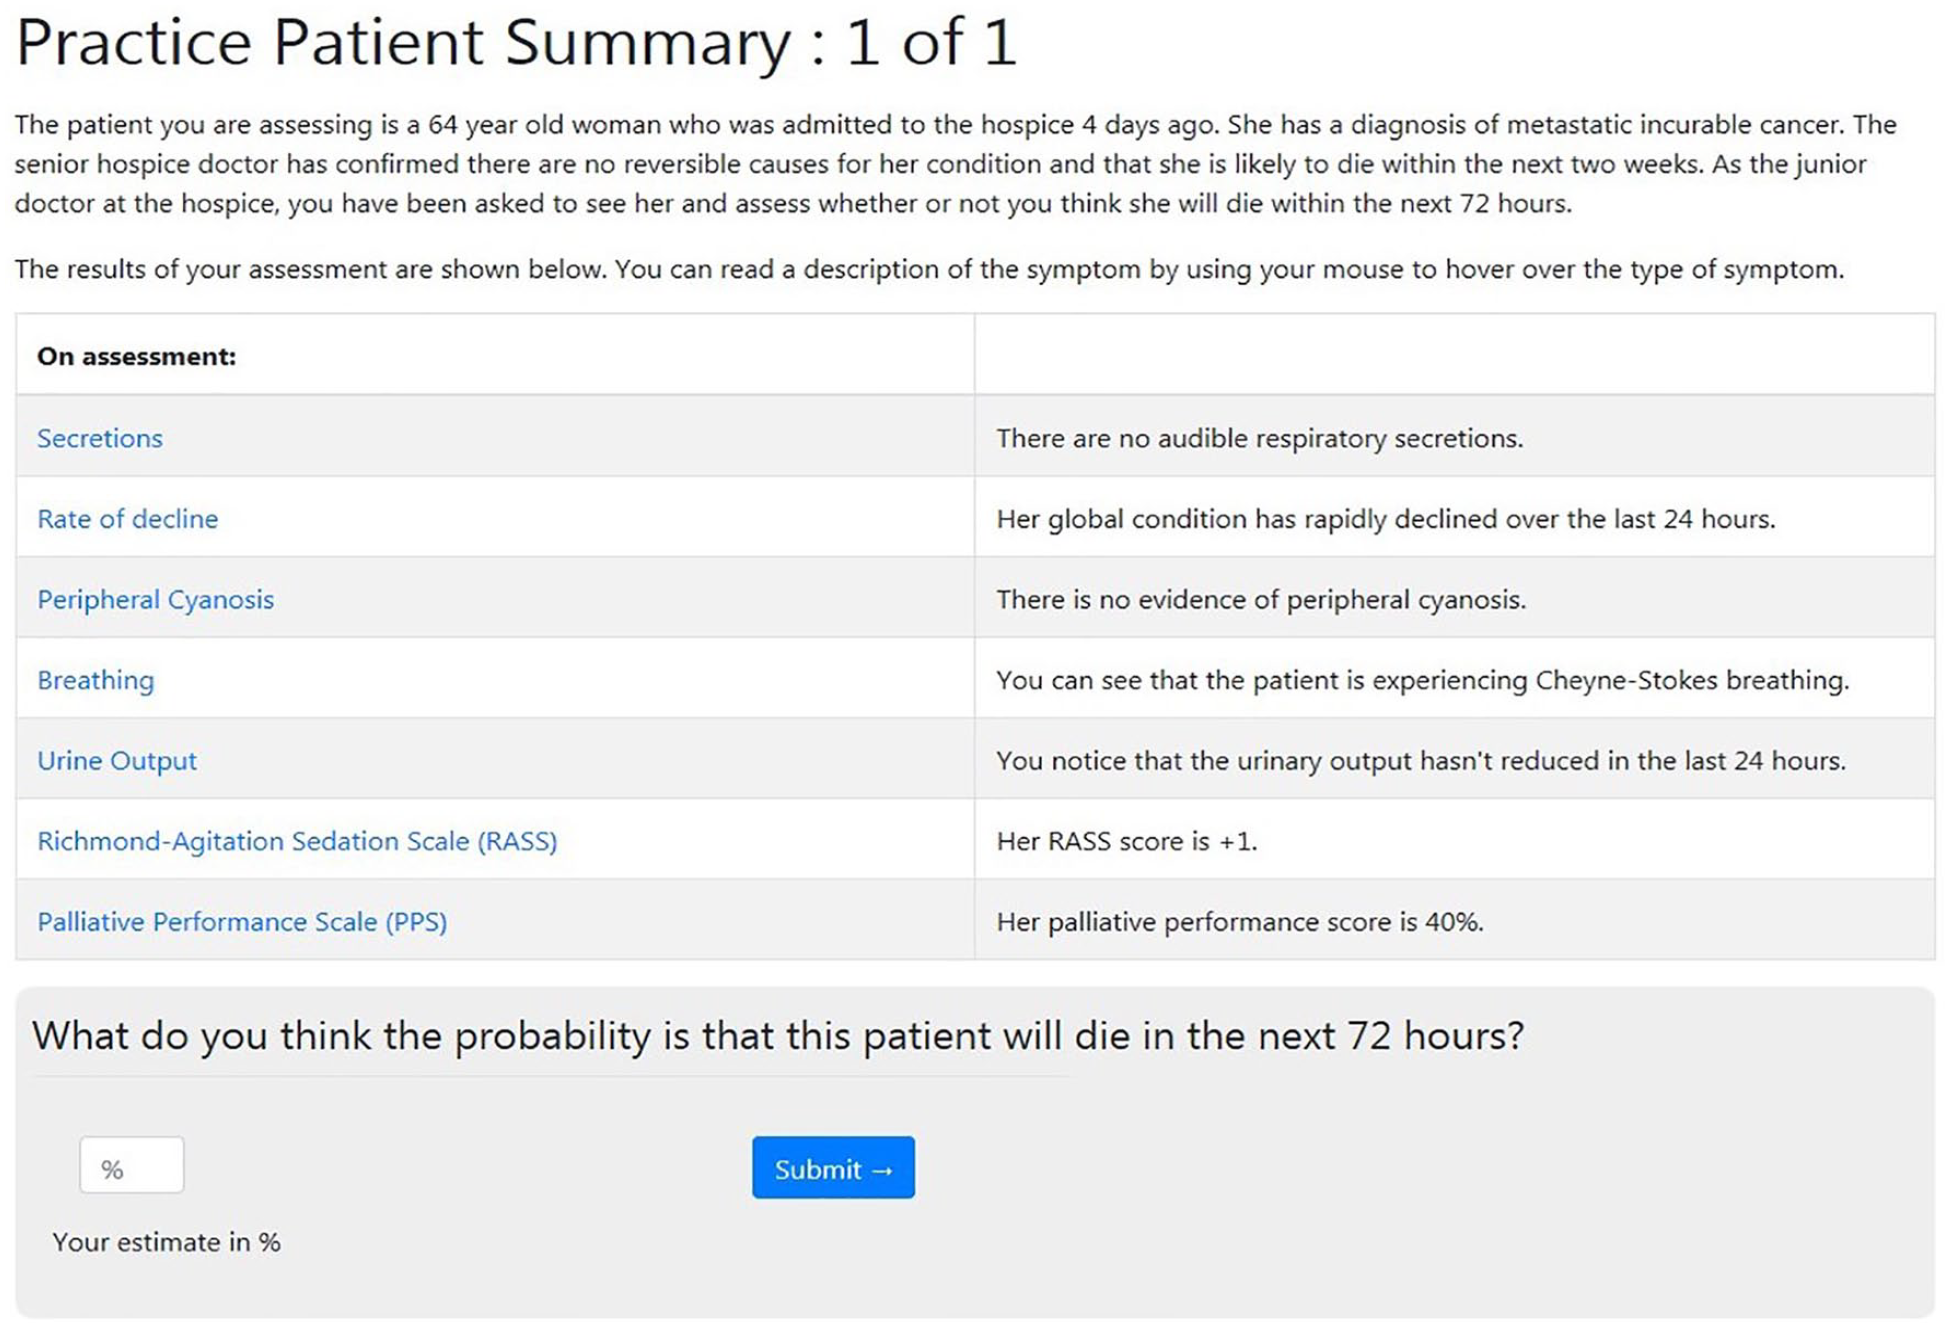
Sample patient summary.
Data presented in the vignettes.
Outcomes
Primary outcome
The continuous percentage estimate (0%–100%) provided in response to, ‘What do you think the probability is that this patient will die in the next 72 hours?’ for each vignette in the second set (t = 2).
Secondary outcomes
The percentage estimates from (t = 3) were used to determine if there was any maintenance effect of the training intervention.
Individual cue (the pieces of information presented in the vignettes) weightings were compared against the experts’ cue use. This was measured at all three time points.
Participants’ level of expertise was assessed with the Cochran–Weiss–Shanteau (CWS) index 20 of expertise using the repeat vignettes (t = 1, t = 2 and t = 3).
Sample size
Assuming a common standard deviation, 80% power and using a two sample t-test at the 5% significance level, a sample size of 128 (64 per arm) was needed to detect a medium effect size (Cohen’s d = 0.5) between the intervention and the control group. We anticipated a dropout rate of approximately 30% based on previous work 13 so we estimated that a sample size of 183 participants would be required to obtain 128 complete cases.
Randomisation
A computer-generated blocked randomisation list (with a block size of 10) was created by a member of the team not involved in recruitment or analysis (CT). Participants were able to self-enrol on to the trial at any convenient time and the website database automatically allocated the participant to one of the groups using the randomisation sequence.
Blinding
The participants and most of the researchers (L.O., N.W., F.R., H.G., P.S., P.H. and S.Y.) were blind to allocation.
During recruitment, only three researchers (C.T., L.O. and N.W.) had access to the online database and were able to see which group each participant had been assigned to; coded as either 1 or 0 (the allocation of these codes were unknown to L.O. and N.W.). This access allowed the researchers to assess if the randomisation process was successfully balancing participants between groups and to end recruitment when the required sample size was achieved. Only once recruitment had ended, the database had been checked and locked, and the analysis had been completed and discussed, was the allocation revealed. Participants were blind to allocation. The information sheets for the trial informed participants that they would receive training in one of two formats. Those randomised to the control group were not informed that this was not the intervention group. This low level of deception was deemed necessary in order to reduce the risk of attrition in the control group. This deception and the use of gift vouchers were approved by the ethics committee.
Adverse event recording
This was a very low-risk online educational intervention. No adverse effects were recorded.
Statistical methods
A detailed statistical analysis plan is available to view on ClinicalTrials.org (NCT03360812). To prevent ordering effects, the vignettes were presented in a random order for each participant. The order in which the cues were presented was also randomised, but held consistent for each participant to reduce the burden of participation. The analysis was performed by the trial statistician (F.R.) and the analysis of the primary outcome was repeated by an independent statistician. A per-protocol analysis was conducted for this proof of principle study.
Primary outcome analysis
For each participant, to estimate the degree of agreement between the participants’ predictions about the probability of dying and the experts’ reference values at each time point, the Mean Absolute Difference 21 (MAD) was calculated as

where
The greater the MAD, the larger the degree of difference between the novices (the medical students) and the experts (the specialist palliative care doctors).
To measure the impact of the online training resource on the level of agreement, the main analysis is based on a regression model for the MAD at (t = 2) by intervention arm. The model for the agreement adjusting for baseline MAD, is given by

where
The parameter of interest in order to evaluate the efficacy of the intervention is δMAD. This is the difference in MAD between the intervention and control group.
Secondary outcome analysis
The maintenance effects were assessed similarly to the primary outcome, with the MAD at (t = 3) as the dependent variable, adjusting for baseline MAD.
To assess the individual ‘judgement policy’, a linear mixed model for each participant was fitted, using the estimated probability of dying as the dependent variable and the values of the different cues as independent covariates. The experts’ and participants’ standardised coefficients were compared in a descriptive fashion, as well as the maintenance effect of the judgement policy at (t = 3).
The level of expertise was measured using the CWS score. 20 The CWS score is calculated as the ratio of discrimination and inconsistency. The discrimination refers to the individual participant’s differential assessment of the various vignettes. The inconsistency refers to the individual participant’s assessment of the same vignette over time. The higher the CWS score, the less inconsistent and more discriminating the student. t-tests were completed to explore if the scores of the intervention and control group at each time point were statistically different.
As the study was powered for the primary outcome measure, all analyses of secondary endpoints, including hypothesis tests, must be considered exploratory, rather than providing firm conclusions.
Results
The website was open to recruitment from 5 April 2018 until the minimum sample size of 64 complete cases per study arm was achieved. The website was closed to new participants from 30 June 2018 and was shut completely once the last participant completed the 2-week follow-up (12 August 2018).
Baseline data
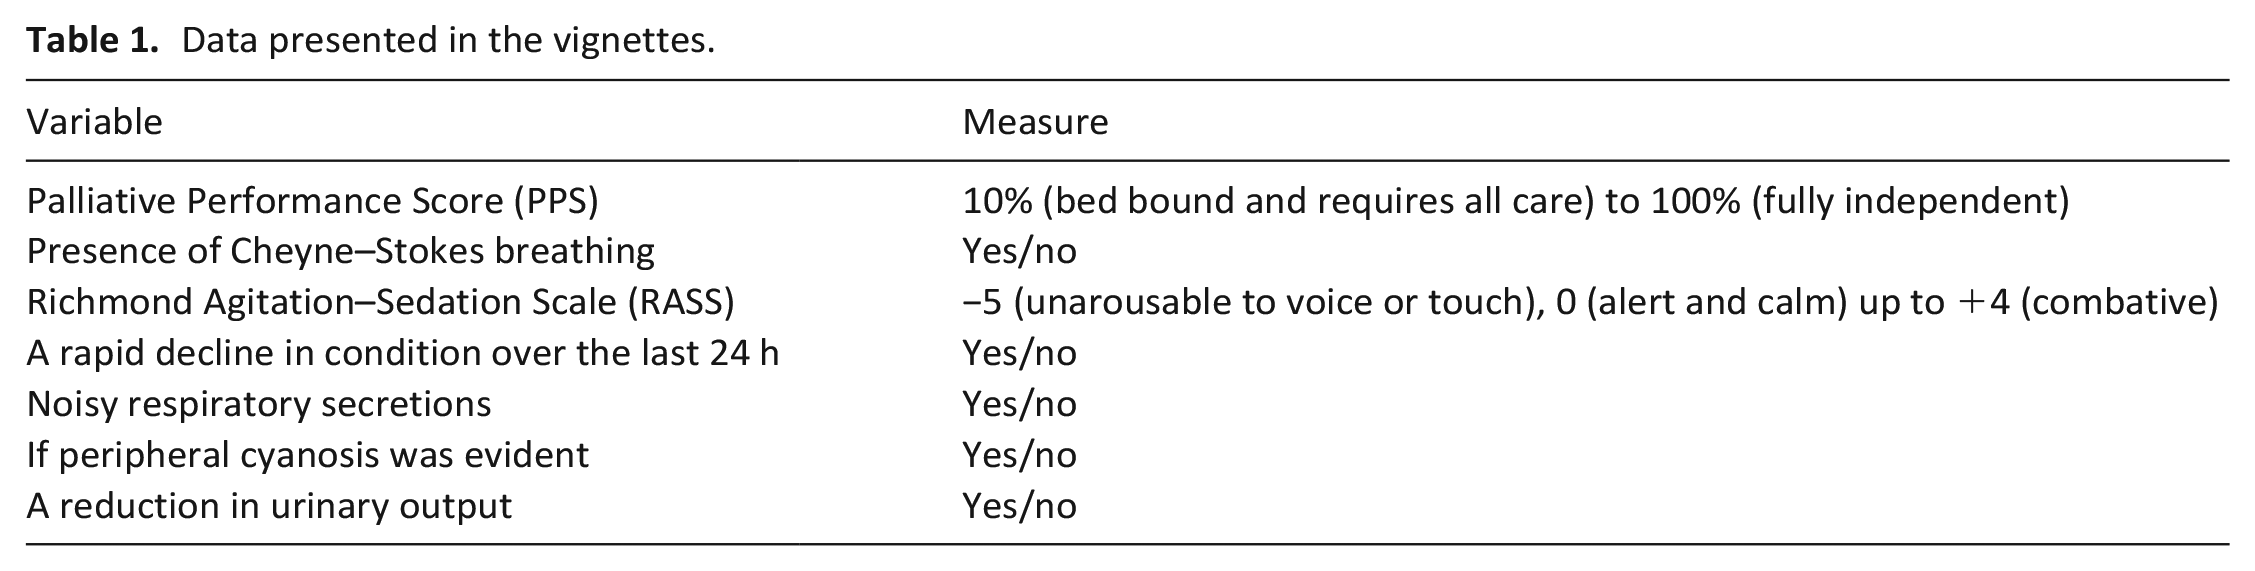
Out of the 168 participants who accepted the invitation to participate, 165 were randomised to one of the study arms; 82 in the intervention group and 83 in the control group. Figure 2 shows the number and reasons for exclusion at each time point of the trial.
CONSORT flow diagram.
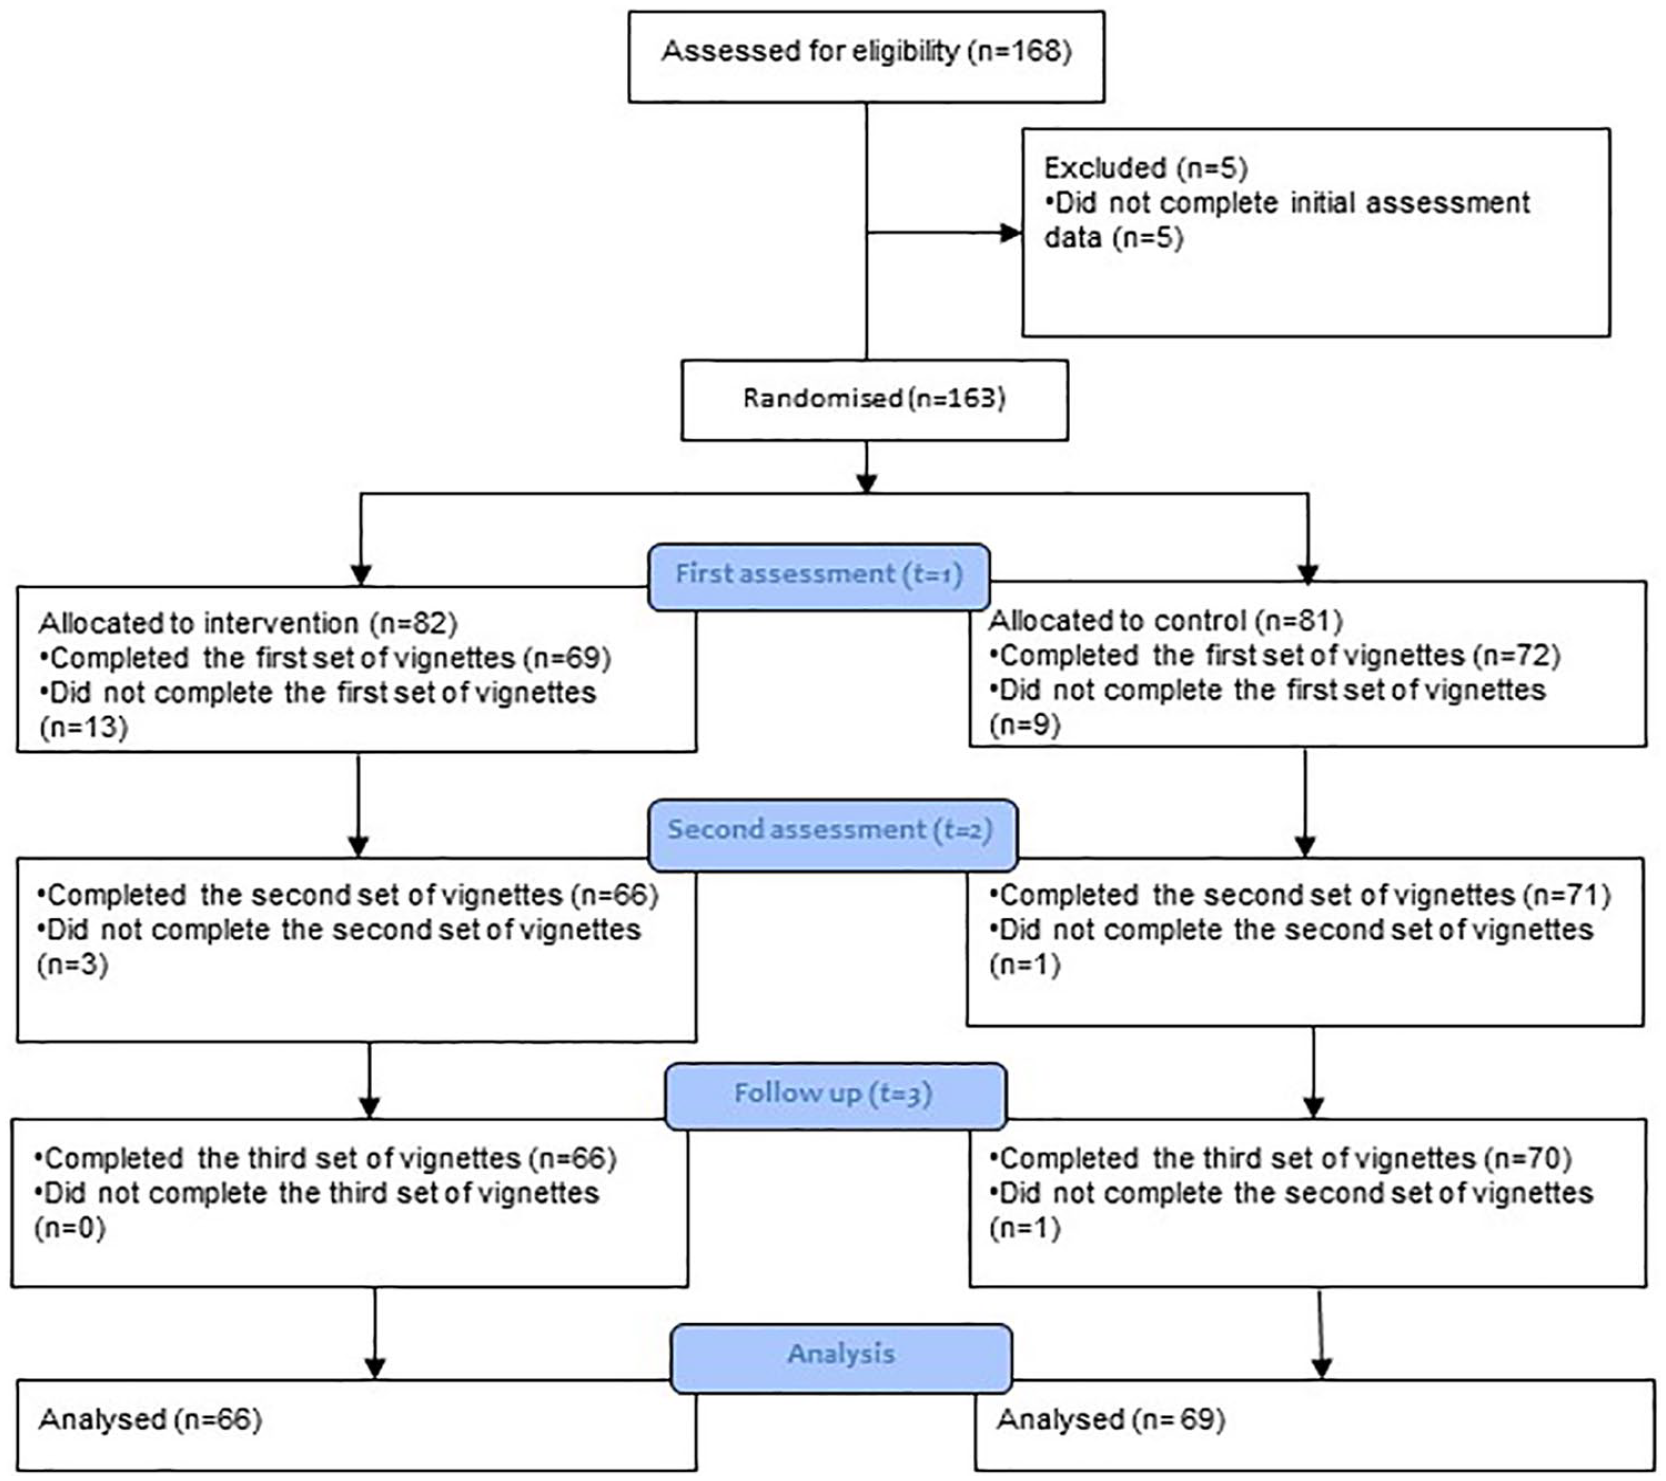
There were 135 participants included in the analysis (80% completion rate); 66 in the intervention arm, 69 in the control arm. Table 2 presents the baseline demographics of all participants who completed the trial. From visual inspection, there was no evident disproportion between the two groups.
Baseline demographics of the participants who completed the trial.
IQR: interquartile range; UCLH: University College Hospital.
Intervention
The participants in the intervention group spent a median time of 2.65 min (IQR 1.90; 3.90) reviewing the training resource after (t = 1). During (t = 2), 41 participants (63%) in the intervention group accessed the training material once more. A total of 17 participants (26%) accessed the training material twice more, and 7 (11%) accessed the material more than twice, with the most being five more times.
Primary outcome
Table 3 describes the MAD scores; by group and by time point. As the table shows, the participants who received the intervention displayed more agreement with the experts than the control group at (t = 2).
Mean Absolute Difference scores.
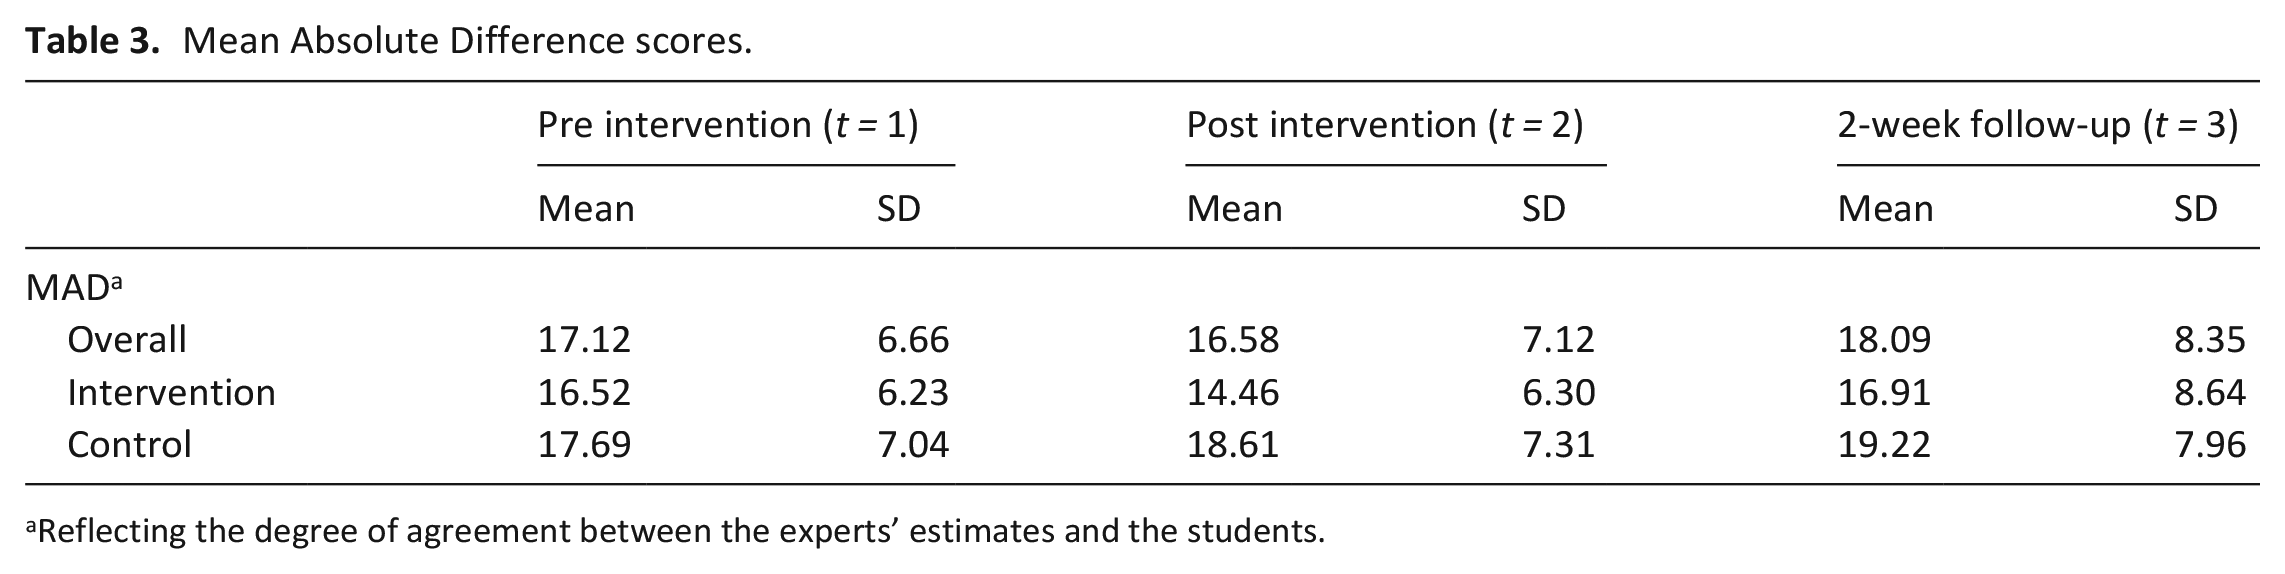
Reflecting the degree of agreement between the experts’ estimates and the students.
Figure 3 shows the results of the main analysis. The mean of the MAD in the intervention group was significantly less than in the control group, post intervention (δMAD = −3.43, 95% CI −0.11 to −0.34, p = <0.001).
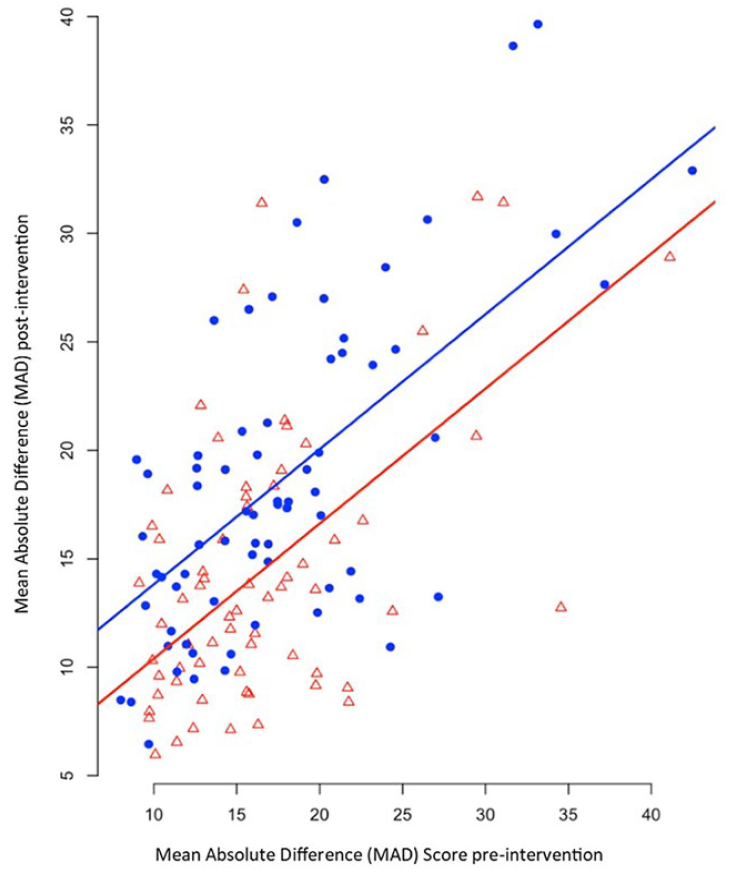
Scatterplot of MADs at time 1 and 2, by assignment group (red for intervention, blue for control). The two lines represent the fitted values given by model for primary analysis.
Secondary analyses
Level of expertise
The CWS score was calculated at the three time points of the trial (t = 1, t = 2 and t = 3). Table 4 describes the results for each group. The vignettes viewed at (t = 1) and (t = 2)/(t = 3) were different and therefore results can only be compared within the final two time points with higher indices scores representing higher expertise levels. At (t = 1), the mean CWS scores were similar (intervention = 153.67 (SD 64.33), control = 168.22 (SD 101.27), p = 0.32). The intervention and control groups did not differ with regard to CWS score at t = 2 (p = 0.10), but the intervention group was significantly more expert in their decision-making (higher CWS scores) versus controls at t = 3 (p = 0.01).
Level of expertise by group and time point.
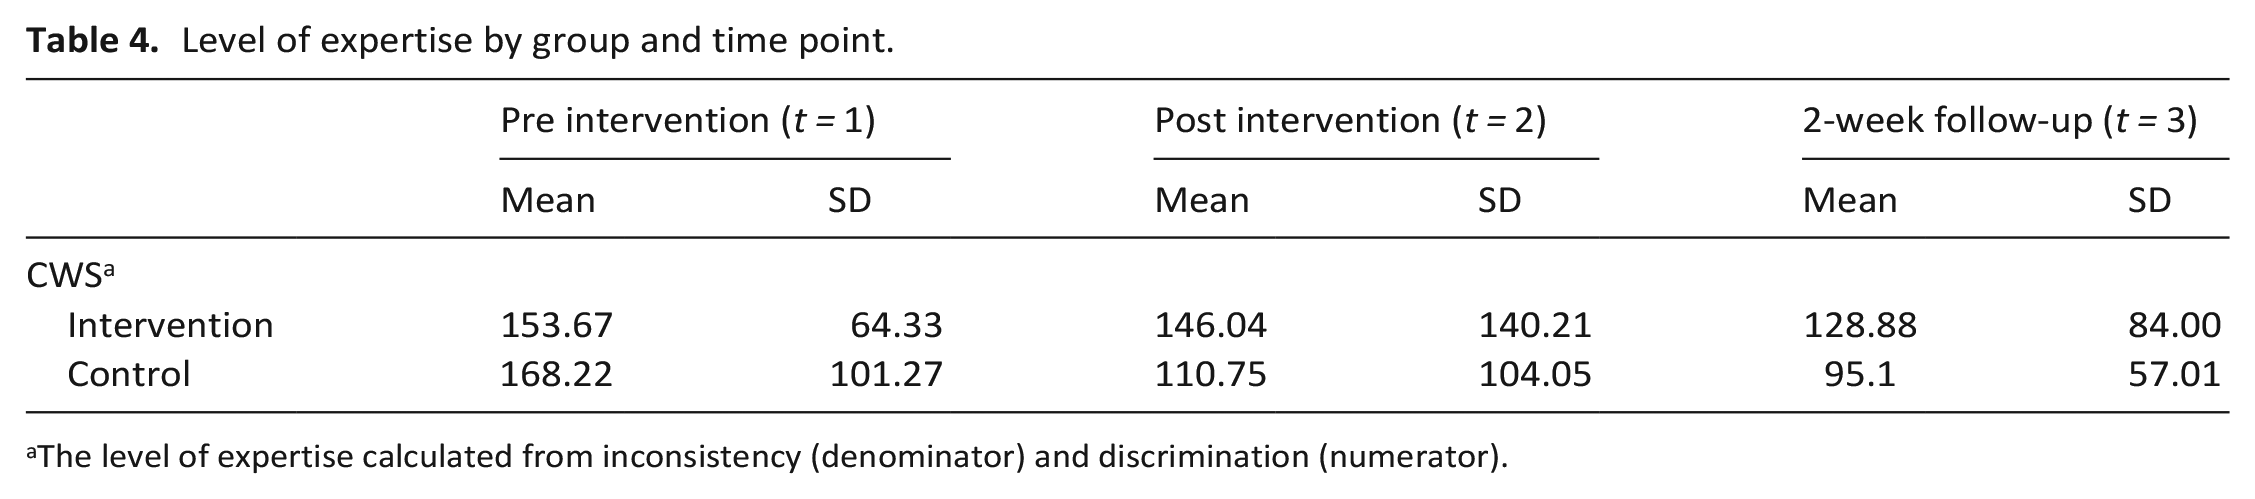
The level of expertise calculated from inconsistency (denominator) and discrimination (numerator).
Cue weighting and judgement policies
Table 5 presents the cue weightings of the seven cues presented in the vignettes. The first two columns present how the experts in our previous study weighted the information. The standardised coefficients (due to the inclusion of both dichotomous and ordinal data) indicate how influential each factor was in the model; Palliative Performance Score (PPS) was the most influential in the experts’ decision-making. The same analysis was completed using the data from the intervention and control arms at (t = 1) and (t = 2). Students in the intervention arm adjusted how they weighted the information to become more similar to the experts at (t = 2); focusing on the same four factors that the experts did. The results suggest that the students who received the training overemphasised the weighting of the factors presented. The analysis of the cue weightings at (t = 3) repeated the trend from the (t = 2) analysis for the top four cues.
The judgement policies of the experts and medical students in the two study arms.
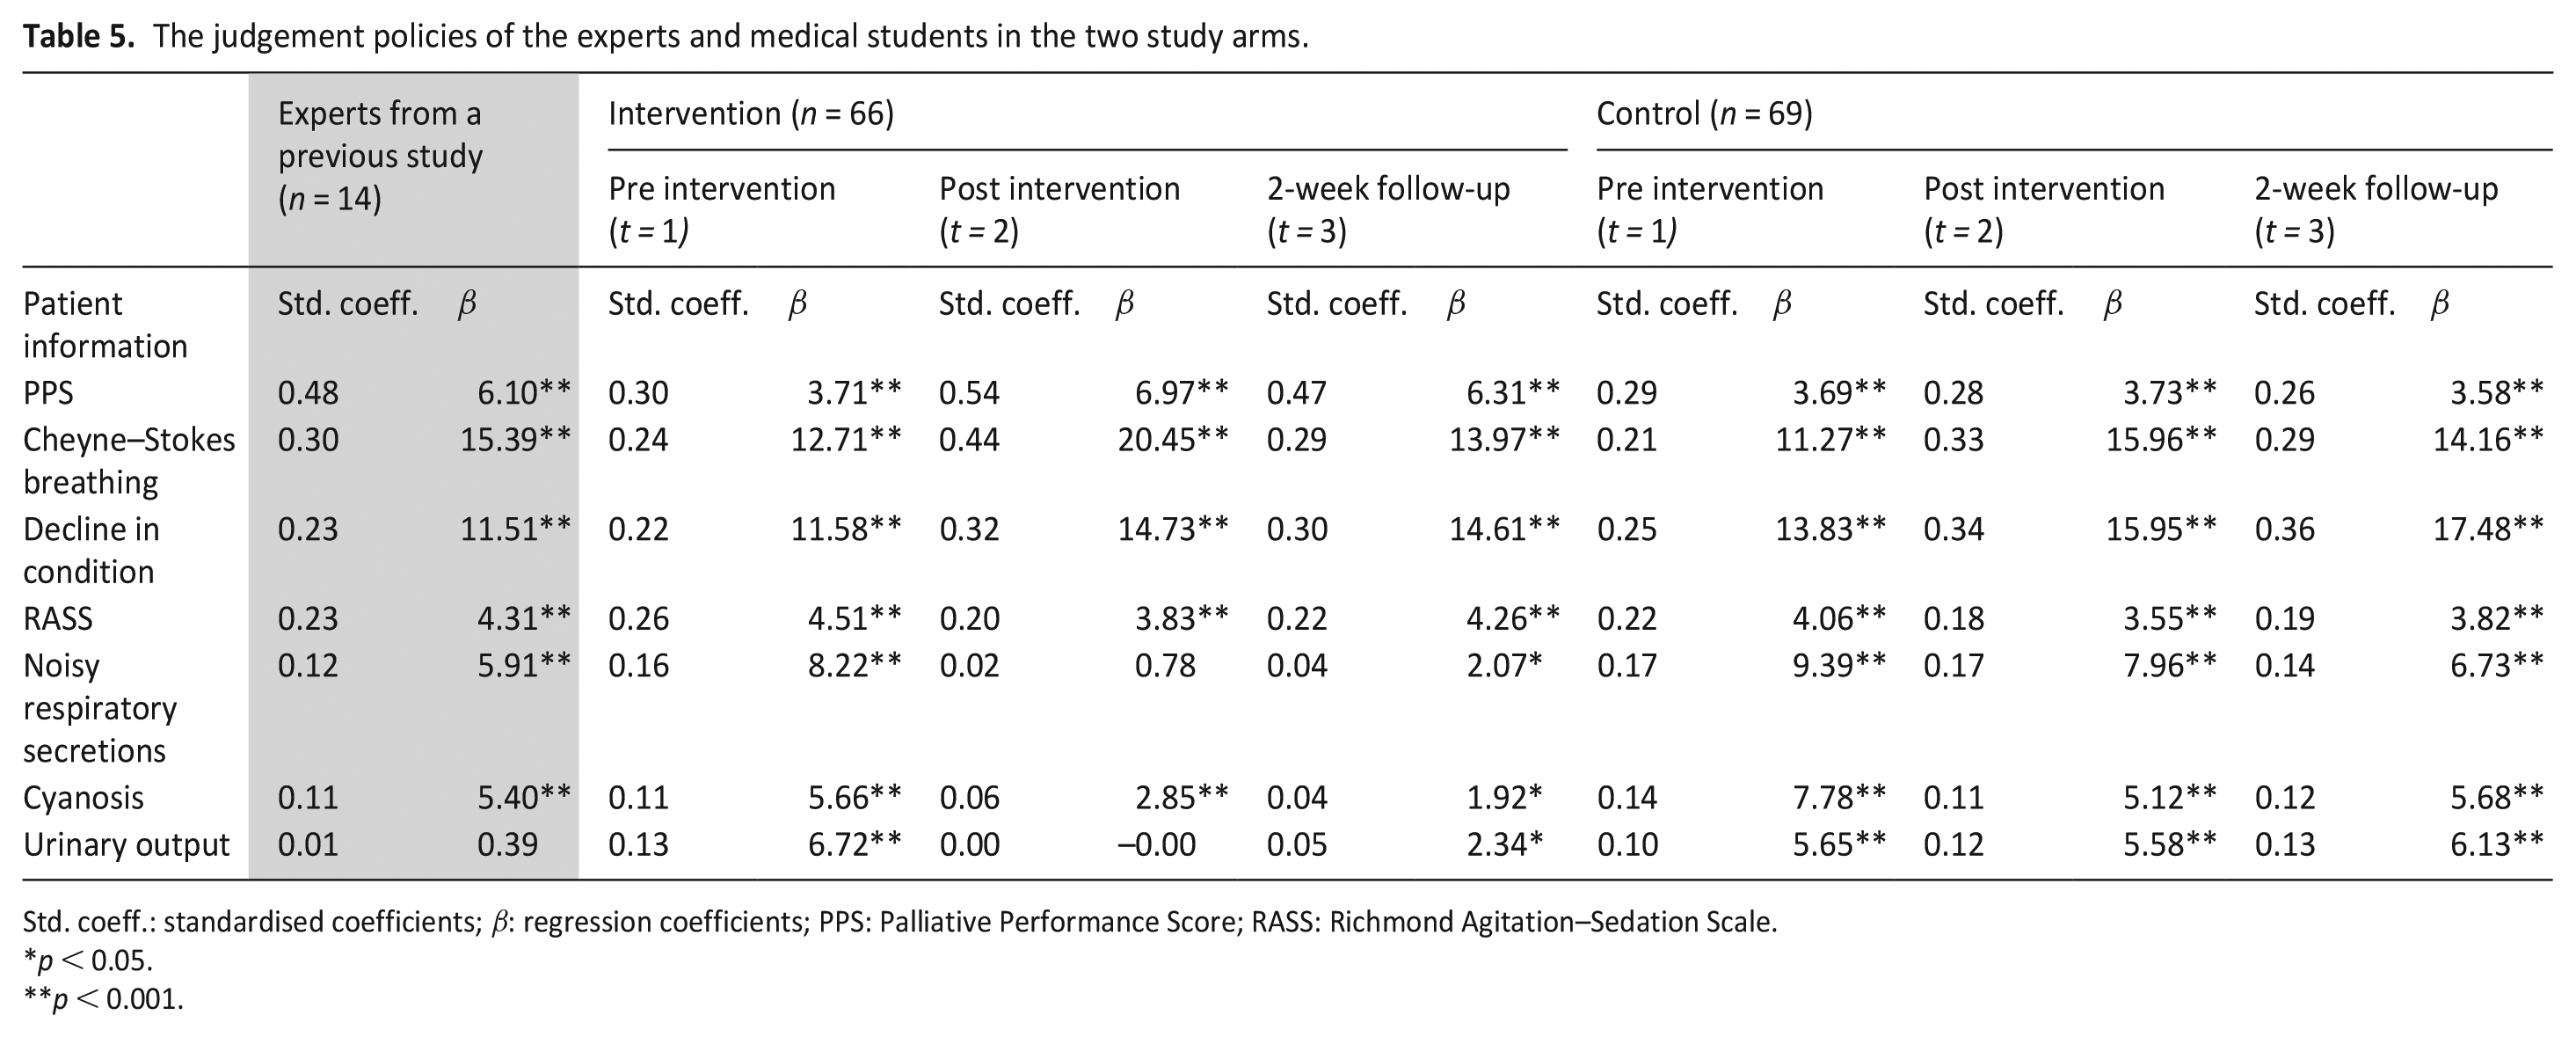
Std. coeff.: standardised coefficients; β: regression coefficients; PPS: Palliative Performance Score; RASS: Richmond Agitation–Sedation Scale.
p < 0.05.
p < 0.001.
MAD at the 2-week follow-up
Table 3 summarises MADs by group at (t = 3). Whilst there is a similar trend to the primary analysis, there is no evidence of a learning effect on the MAD scores from the intervention (
Discussion
Main findings
The main finding is that medical students can be taught to recognise dying in a similar manner to expert palliative care doctors through the use of an online training resource; in that they are more discriminating and discerning in their use of prognostic factors. The results provide evidence that the medical students who received the intervention became more expert in their decision-making at the 2-week follow-up assessment. ‘More expert’, in this context, means that they were less inconsistent in their responses and better able to discriminate between vignettes than their peers. However, it should be noted that consistency alone is not acceptable as a measure of expertise, as novices can be consistently wrong. 22
The results of the trial suggest that post intervention, students overemphasised the weighting of the factors presented in the training resource and underemphasised other factors. A potential explanation for this is that students were only learning to ‘game’ the assessment, similarly to the process of learning how to maximise scores on multiple choice exams. If this was the case, it would support the possibility that students were gaining only superficial learning using the tool post intervention, applying the rules, rather than internalising the training and gaining a deep understanding of the content. 23 Further research is needed to understand how to improve the training and refine students’ decision-making.
The trial found that improvements in the primary outcome were not maintained after 2 weeks. This is a finding that is often found in other extended learning studies. 24 A potential explanation for this is that the participants did not have access to the training tool at this final time point. In addition, post intervention, participants did not frequently access the training material. Previous research has highlighted that retention could be improved by emphasising the clinical relevance of the training 25 or providing feedback. 26 The results may have been different if the incentive offered as part of this trial had been based on performance rather than completion.
Strengths and weaknesses/limitations of the study
This is the first online training resource specifically designed to help medical students recognise dying patients. The design of the trial was robust and adhered to randomised controlled trial principles including blinding and the inclusion of a follow-up to assess the maintenance effect.
As this was an online trial, there were limitations to the ecological and face validity that should be considered before applying our results to the clinical setting. The vignettes were artificial and very simple in format. In real life, patients will routinely present with more signs and symptoms, which are often more complex. However, experts are known to use less information to make more accurate predictions. 27
Due to the design of the study, there is potential for contamination of the blinding. While participants were not informed what group they were assigned, and they were asked to complete the trial independently, there is the potential that participants completed the trial in groups and therefore participants assigned to the control group might have been aware of, or accessed, the training. Despite the low-level deception, those in the control arm were likely aware that they were designated to that group, however as this was never stated, it is possible that they will have considered the practice in making decisions on the vignettes themselves as the training.
As the vignettes were hypothetical, there was no way to determine whether the students’ estimates actually became more accurate, just that they became more like the experts’. However, the experts in this study were specialist palliative care doctors who had previously been the most accurate at recognising dying, compared to their peers, on a prognostic test using real vignettes. 13
What this paper adds?
There is currently inconsistent training available for medical students to improve their ability to recognise dying patients. This online training resource offers the opportunity for medical students to practice making decisions on predicting dying in preparation for their clinical training.
The GMC has recently requested all medical schools to report the frequency with which students receive training placements in hospices or palliative care settings. These placements can be extremely difficult and challenging to find due to limited resources. 28 The online environment, while unable to replace direct clinical contact, could be used to facilitate learning in this complex area, and provide a complementary education approach to clinical training.
Further research is needed on the content of the training, improvements in deeper learning, and reliability of the training resource.
Supplemental Material
pmj_supp_mat – Supplemental material for Online training improves medical students’ ability to recognise when a person is dying: The ORaClES randomised controlled trial
Supplemental material, pmj_supp_mat for Online training improves medical students’ ability to recognise when a person is dying: The ORaClES randomised controlled trial by Nicola White, Linda JM Oostendorp, Christopher Tomlinson, Sarah Yardley, Federico Ricciardi, Hülya Gökalp, Ollie Minton, Jason W Boland, Ben Clark, Priscilla Harries and Patrick Stone in Palliative Medicine
Footnotes
Acknowledgements
The authors would like to thank the medical schools and the medical students who participated in the trial. The authors would like to thank Olivia Baker for reviewing the trial recruitment documents and providing valuable feedback, and Sean O’Donnell who reviewed the documents in addition to helping recruitment. The authors would like to thank Victoria Vickerstaff for repeating the analysis of the primary outcome.
Authorship
P.H. and P.S. conceived the idea for the trial. N.W. produced an initial draft of the protocol which all authors subsequently contributed to and L.O., N.W. and P.S. formed the working group that refined the trial protocol and set up the trial. All other members of the Trial Management Group (P.H., S.Y., C.T., F.R. and H.G.) provided input in the protocol design and trial logistics. N.W., P.H., L.O. and P.S. were involved with developing the intervention. O.M., B.C., J.B. and S.Y. approved the protocol and obtained local site approval. C.T. developed and maintained the trial website and the randomisation process. L.O. and N.W. were responsible for recruitment and data monitoring. All authors provided input for the recruitment strategies. F.R. devised the statistical analysis plan with input from H.G., and completed the data management and analyses. N.W. produced the first draft of the paper. S.Y. provided medical educational expertise. All authors refined the paper and approved the final version for submission. L.O. is the trial manager, P.S. is the guarantor of the trial.
Data management and sharing
The link to the anonymous experts’ judgement policy data can be accessed via figshare at: 10.6084/m9.figshare.7732265. The link to the anonymous baseline and primary data can be accessed via figshare at: 10.6084/m9.figshare.7732244.
Declaration of conflicts of interest
The author(s) declared the following potential conflicts of interest with respect to the research, authorship and/or publication of this article: All authors have completed the ICMJE uniform disclosure form at ![]() and declare no support from any organisation for the submitted work; C.T. has received research payment from UCL to complete the online platform and database, no other relationships or activities that could appear to have influenced the submitted work.
and declare no support from any organisation for the submitted work; C.T. has received research payment from UCL to complete the online platform and database, no other relationships or activities that could appear to have influenced the submitted work.
Funding
The author(s) disclosed receipt of the following financial support for the research, authorship, and/or publication of this article: Marie Curie I-CAN-CARE Program grant (MCCC-FPO-16-U). Professor Stone is supported by the Marie Curie Chair’s grant (MCCC-509537). N.W., L.O., P.S., F.R. and S.Y. are partly supported by the UCLH NIHR Biomedical Research Centre. The funder had no role in trial design, data collection and analysis, decision to publish or preparation of the manuscript.
Supplemental material
Supplemental material for this article is available online.
References
Supplementary Material
Please find the following supplemental material available below.
For Open Access articles published under a Creative Commons License, all supplemental material carries the same license as the article it is associated with.
For non-Open Access articles published, all supplemental material carries a non-exclusive license, and permission requests for re-use of supplemental material or any part of supplemental material shall be sent directly to the copyright owner as specified in the copyright notice associated with the article.