
Abstract
Research in rehabilitation has grown from a rare phenomenon to a mature science and clinical trials are now common. The purpose of this study is to estimate the extent to which questions posed and methods applied in clinical trials published in Clinical Rehabilitation have evolved over three decades with respect to accepted standards of scientific rigour. Studies were identified by journal, database, and hand searching for the years 1986 to 2016.
A total of 390 articles whose titles suggested a clinical trial of an intervention, with or without randomization to form groups, were reviewed. Questions often still focused on methods to be used (57%) rather than what knowledge was to be gained. Less than half (43%) of the studies delineated between primary and secondary outcomes; multiple outcomes were common; and sample sizes were relatively small (mean 83, range 5 to 3312). Blinding of assessors was common (72%); blinding of study subjects was rare (19%). In less than one-third of studies was intention-to-treat analysis done correctly; power was reported in 43%. There is evidence of publication bias as 83% of studies reported either a between-group or a within-group effect. Over time, there was an increase in the use of parameter estimation rather than hypothesis testing and there was evidence that methodological rigour improved.
Rehabilitation trialists are answering important questions about their interventions. Outcomes need to be more patient-centred and a measurement framework needs to be explicit. More advanced statistical methods are needed as interventions are complex. Suggestions for moving forward over the next decades are given.
Introduction
Research in rehabilitation has grown from a rare phenomenon to a mature science since 1986, or so we think. Clinical Rehabilitation publishes many randomized trials; 1 a review of published trials since its inception offers an opportunity to trace recent evolution of trials in rehabilitation.
Clinical trials answer questions about deliberate interventions, often innovations in treatment, and the results are meant to inform clinical practice. When parallel groups are formed by randomization, the results provide the strongest evidence for the benefits or risks of a treatment. 2 Not all trials are randomized as other forms of allocation can be used to reduce bias in assigning people to groups (alternate, odd and even days, as examples), although the randomized controlled trial (RCT) is the strongest method.
Randomized trials
Comparative controlled trials are relatively modern concoctions although they have ancient roots. Historically, the value of a controlled trial has been known since Biblical times.
3
Daniel (1:1–13, King James Version (KJV)) carried out perhaps the first nutrition trial, when he requested that he and three other fellow prisoners be allowed to eat ‘pulse’ (likely a legume-based diet) and water, for a period of 10 days, and not the ‘kings meat’ and wine that the other prisoners were eating: And at the end of ten days their countenances appeared fairer and fatter in flesh than all the children which did eat the portion of the king’s meat. (Daniel 1:15, KJV)
This trial even had a three-year follow-up with an estimated effect size: Now at the end of the days that the king had said he should bring them in, then the prince of the eunuchs brought them in before Nebuchadnezzar. (Daniel 1:18, KJV) And in all matters of wisdom and understanding, that the king enquired of them, he found them ten times better than all the magicians and astrologers that were in all his realm. (Daniel 1:20, KJV)
Apart from Daniel’s nutrition trial, the first reported clinical trial is often credited to James Lind in 1747. Concerned about the ravages of scurvy in British sailors, he tested the efficacy of six different treatments. 4 The sample consisted of 12 sailors at sea selected to be as similar as possible; all ill with what would become known as scurvy. In addition to a standard diet, which was described in detail, six groups of two men each were given cyder, elixir vitriol, vinegar, sea-water, two oranges and one lemon, and an ‘electary’ recommended by the ship surgeon. To quote Lind, ‘the most sudden and visible good effects were perceived from the use of oranges and lemons; one of those who had taken them, being at the end of six days fit for duty … Next to the oranges, I thought the cyder had the best effects’. The results published in 1753, were only put into practice in 1795, a year after his death and 40 years after publication. The routine use of lemon juice for sailors virtually wiped out scurvy at sea.
Sir Austin Bradford Hill is considered to be the father of the modern RCT and the earliest published medical trial was designed to test the efficacy of streptomycin for the treatment of tuberculosis. 5 The results, published in 1948 in the British Medical Journal (BMJ) showed that, of the 55 patients randomized to drug, 28 (51%) showed ‘marked improvement’ in comparison with four of 52 randomized to bed rest (8%).
In an address to the Department of Preventive Medicine, Harvard Medical School and published in the New England Journal of Medicine (NEJM) in 1952,
6
Hill spoke of an antagonism between the clinician and the researcher: The medical man charged with responsibility for the patient was contemptuous of the statistician’s fundamental approach through the group; and the statistician took a jaundiced view of the conclusions light-heartedly drawn by the practitioner from a handful of cases without allowance for the play of chance.
He also suggested that the ‘statistically guided therapeutic trial’ is one way of discharging the third responsibility of a medical profession, advancement of knowledge, with cure and prevention being the other two responsibilities as named by McCance. 7
The magic of randomization was described by Hill in this address. 6 It ensures that once the decision is made that the person is the ‘right type’ for the trial, personal preferences do not go into the construction of the treatment groups removing all biases from the allocation. Randomization has a number of other advantages. The probability of being assigned to one or other of the groups is known in advance and is not influenced by the characteristics of the sample, at the outset of the trial, avoiding biased selection into one treatment group. Confounding variables, known and unknown, are randomized along with the participant, ensuring the groups are balanced on important prognostic variables at the outset of the trial. It also controls for measurement bias even when imperfect measures are used as members of all groups have the same imperfect measurement.
Despite these protections, bias can still creep into a trial if, over time, people are allowed to leave the trial, abandon the assigned treatment, change groups, or otherwise alter the investigator’s plan. These protocol violations may reintroduce selection and confounding bias if being in one group increases the likelihood of remaining in or leaving the study, and special methods need to be deployed to minimize their effects. 2
Randomized rehabilitation trials
It is difficult to ascertain which was the first clinical trial testing a rehabilitation-type intervention, however, a 1966 article published in the BMJ 8 indicated that the British Association of Physical Medicine intended to carry out a series of multicentred trials of physical treatments. The first of these trials was a study testing five treatment regimens for neck disorders. A total of 466 patients were allocated, in a ‘predetermined random fashion’ to these treatments with all persons also receiving aspirin; treatments were given three times a week for four weeks. The majority of persons recovered from their neck injury by four weeks and there were no significant differences across groups on outcome. The authors reported the path of people through the trial and 12% were not assessed at four weeks, but it is not clear how the missing subjects were dealt with during the analysis. At six months, they reported that 173 (38%) of the original 466 participants did not return the follow-up questionnaire, so the authors did not draw any conclusions about the long-term impact of the interventions.
However, in the discussion, they did mention that the physiotherapy was effective: ‘There can be no doubt that patients have less pain if their posture is correct, and many of them benefit from discussing questions of posture with a physiotherapist’. (page 257). 8 This statement is not backed up by any specific analyses, but the data presented can be used to create a 2 × 2 table, grouping together all the treatment groups that had posture instruction from the physiotherapist (Groups 1 to 3) and those that did not (Groups 4 to 5) (Table 1). The average patients’ response on pain in the physiotherapy posture groups was 77% compared with 62% in the non-physiotherapy group. The chi-square statistic associated with is outcome differences is 10.5; p-value is 0.0012.
Summary of the results of an early trial on physical treatments for neck pain published in the BMJ in 1966. 8
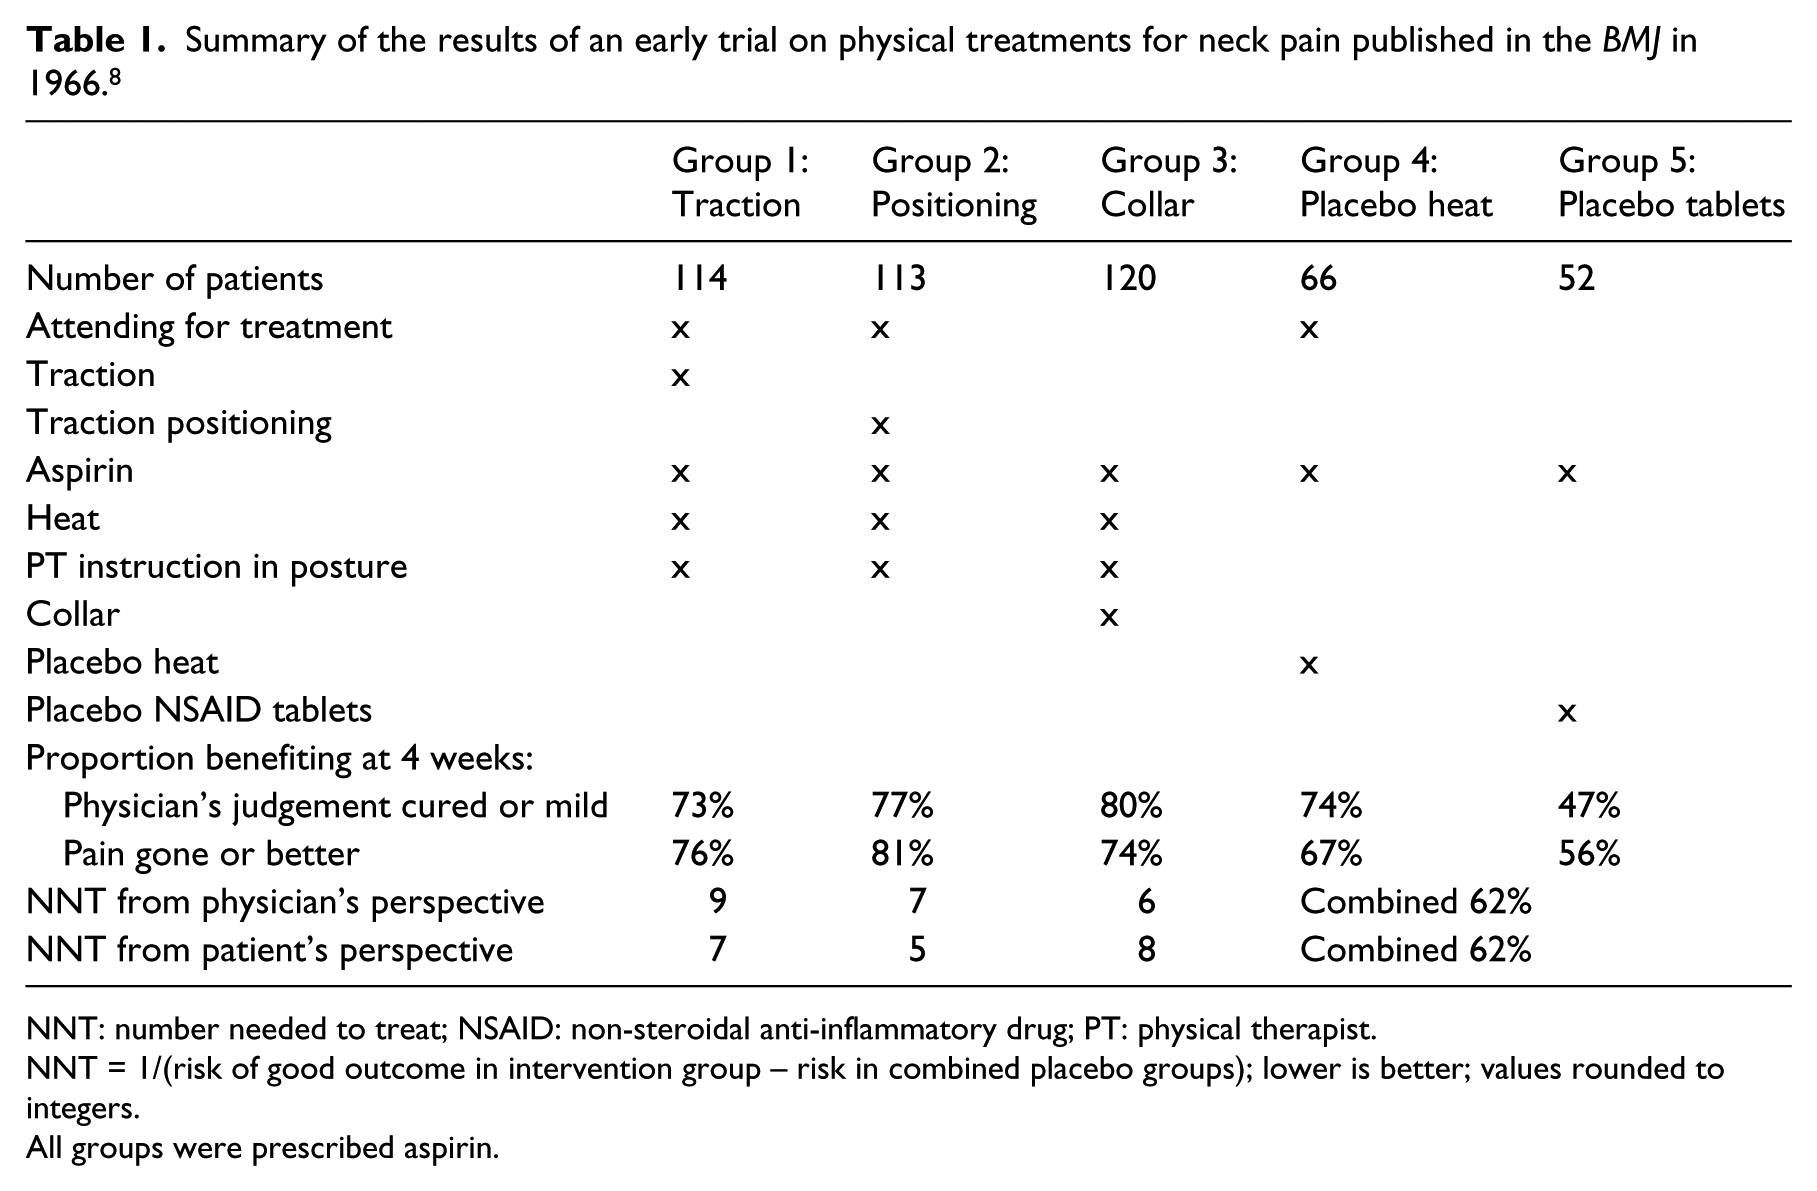
NNT: number needed to treat; NSAID: non-steroidal anti-inflammatory drug; PT: physical therapist.
NNT = 1/(risk of good outcome in intervention group – risk in combined placebo groups); lower is better; values rounded to integers.
All groups were prescribed aspirin.
Also shown in Table 1 is a parameter called number needed to treat (NNT), which is used to indicate the clinical impact of a treatment and provide a way of linking this to the costs of treatment. 9 It shows that between five and nine people would have to be treated by one of these interventions for one person to benefit. Values 10 or less are considered ‘good enough’, 10 and of course, the lower the better.
Guidelines for trials
Over the decades from the early trials to now, a number of reporting standards have been produced to improve the conduct, analysis, and reporting of RCTs. These are summarized in chronological order in Table 2. The original Consolidated Standards of Reporting Trials (CONSORT) appeared in 2001, 11 revised in 2010, and subsequent extensions were developed for different types of trials. One CONSORT extension was developed specifically for trials of non-pharmaceutical interventions, such as rehabilitation, and another for trials with a patient-reported outcome (PRO), 9 such as symptoms, disease impact, health-related quality of life, or quality of life. One CONSORT extension was developed specifically for trials of non-pharmaceutical interventions and another for trials with a PRO, such as symptoms, disease impact, health-related quality of life, or quality of life. 12
Chronology of reporting guidelines for clinical trials from the EQUATOR Network. 4
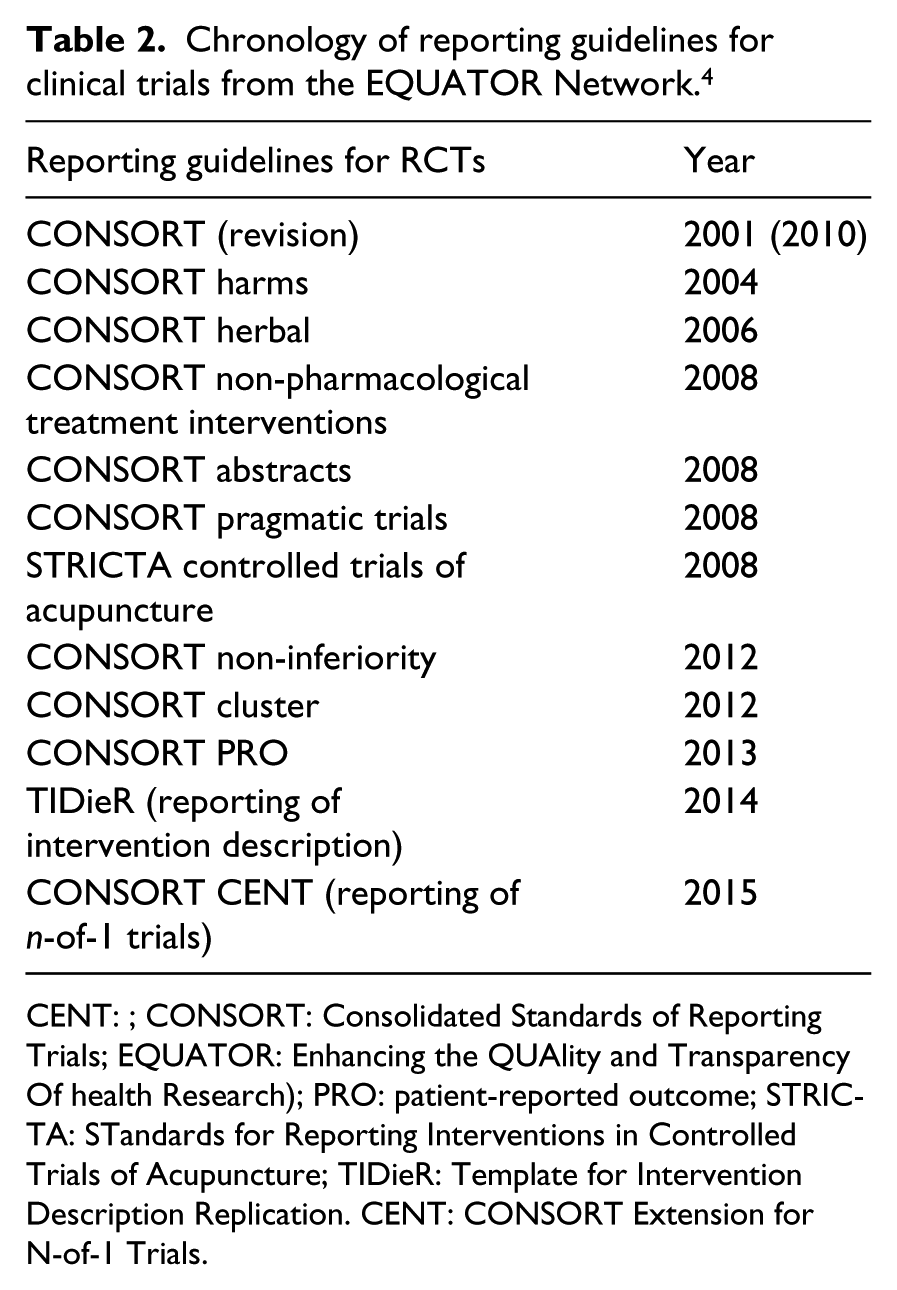
CENT: ; CONSORT: Consolidated Standards of Reporting Trials; EQUATOR: Enhancing the QUAlity and Transparency Of health Research); PRO: patient-reported outcome; STRICTA: STandards for Reporting Interventions in Controlled Trials of Acupuncture; TIDieR: Template for Intervention Description Replication. CENT: CONSORT Extension for N-of-1 Trials.
Guidelines on most aspects of trial design and reporting continue to be updated and new ones published, and the EQUATOR website is a good resource. 13 These include guidelines on reporting the content of interventions; the TiDIER guideline, 14 which is particularly relevant to rehabilitation research as most interventions are poorly described.
With this background, the purpose of this study is to estimate the extent to which the questions posed and the methods applied in clinical trials published in Clinical Rehabilitation have evolved, over almost three decades, with respect to accepted standards of scientific rigour and in concordance with reporting guidelines. Because Clinical Rehabilitation has been publishing rehabilitation trials for 30 years, it will give an impression of how the rehabilitation RCT has evolved over this time.
Methods
Study identification
The journal Clinical Rehabilitation was searched by the staff at the journal and by the research team to identify publications, between 1986 to 2016, whose title suggested a clinical trial had been undertaken. This was supplemented by a search of the PubMed database using the search terms including the name of the journal and keywords ‘randomized’ or ‘trial’ from January 1987 to March 2015. Hand searching was done to identify the earliest studies and the latest studies to complete the list. All publications reporting on studies of deliberate interventions 2 were included, with or without randomization to form study groups, and permitting both confirmatory and pilot studies.
All references identified were assembled in Reference Manager software and, after removing duplicates and abstracts only, the articles were assigned alphabetically to 23 reviewers who read the full text and determined final eligibility.
Studies were excluded if: (i) an experimental design was used aimed at uncovering mechanisms, rather than to contribute evidence to guide practice; (ii) no attempt was made to create study groups such as with a pre–post design, or because an observational study design was used; and (iii) the intervention was solely pharmacological or surgical with no other rehabilitation intervention used in combination or as a control. These criteria could not be confirmed without review of the full text and so these exclusions were applied after the articles were reviewed.
This article excludes pilot studies, as the review of pilot studies is the topic of another article. They were identified by hand during the review process of all studies, using the following keywords in the title and abstract: pilot, feasibility, preliminary, exploratory, proof-of-concept.
The reviewers were rehabilitation researchers with specific training and expertise in research methods and statistics through course work taught by the senior author (NM) with subsequent research experience.
Data abstraction
A comprehensive data abstraction form was developed for this review based on the criteria from the CONSORT group, 11 from a published checklist of key trial elements, 2 and from an article on the elements of a ‘good’ research question. 15 An initial draft of the form was reviewed by senior members of the research team (NM, CM) for relevance and clarity of the included items. Additionally, novel items were incorporated where deemed necessary. An additional space for comments was provided. A web-based form was created and an electronic link was sent to each participating reviewer through email.
The terminology around health outcomes, measurement, research methods, and statistical analyses is specific and precise but not consistently used in the literature. It is beyond the scope of this review to define every term used and the reader is encouraged to consult the Dictionary of Quality of Life and Health Outcomes Measurement 9 for the definitions used if required.
While not explicitly used in the review process reported here, nine of the 11 items rating methodological quality from the PEDRO (Physiotherapy Evidence Database) scoring system 16 could be rated from existing elements.
Statistical analysis
A total of 55 data elements were analysed to characterize methodological rigour. To consider change over time, year of publication was grouped into six eras: <1995, 1995–1999, 2000–2004, 2005–2009, 2010–2013, 2014–2016. As the number of trials published in Clinical Rehabilitation increased dramatically over time, the latter two eras were constructed to avoid substantially greater samples sizes that would affect the estimates of the effect of era. When survival analysis was used, the number of evaluation time points was set to the unit of analysis (days). The effect of era was tested using a chi-square test when the element tested was categorical and linear regression was used when the data element was continuous.
Results
Figure 1 shows the construction of the pool of studies for this review. A total of 390 trials were identified with the earliest published in 1988; 191 pilot studies were also identified, which will be summarized in a subsequent article. Figure 2 shows the increase in the number of studies over time. Only nine studies were published before 1995, and only 26 prior to 2000. After 2000, the number of trials per era was 63, 107, 136, and 58, respectively.
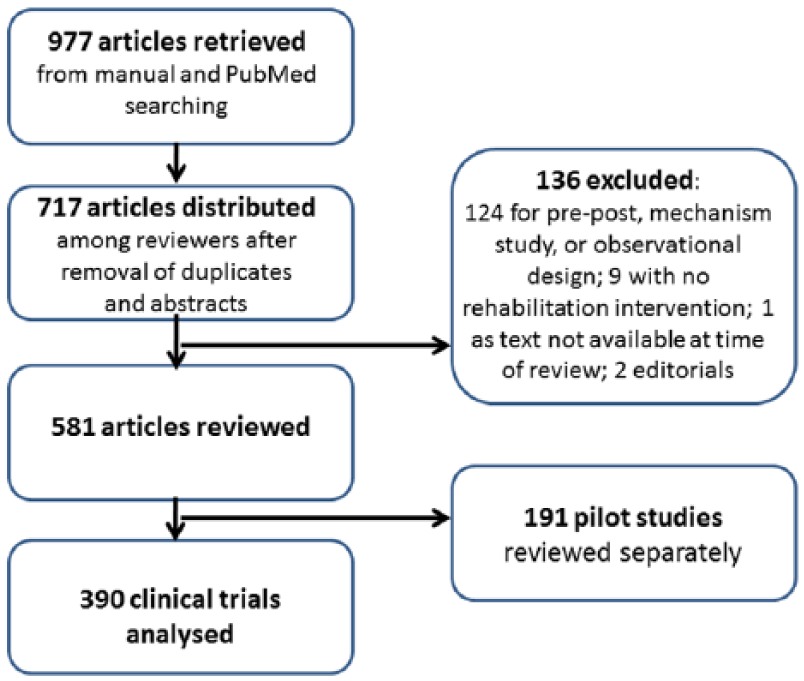
Selection of studies for review.
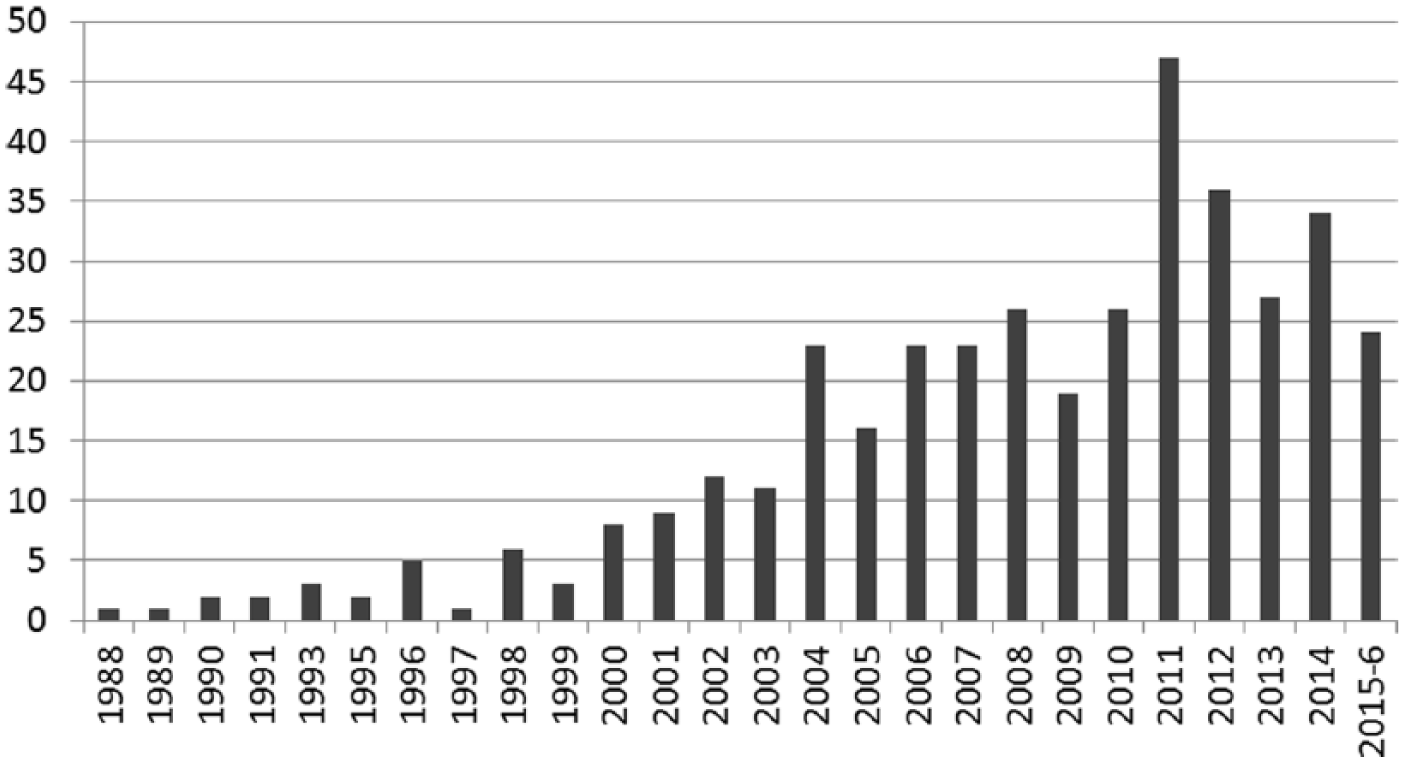
Number of trials published per year in Clinical Rehabilitation.
Tables 3 to 8 present the results over all 390 trials, characterizing the intervention approach (Table 3), quality of the research question (Table 4), quality of the methods (Table 5), types of outcomes (Table 6), sample size (Table 7), and quality of the statistical methods and presentation of results (Table 8). A final Table (9) shows those data elements that differed across era.
Characteristics of the 390 intervention studies.
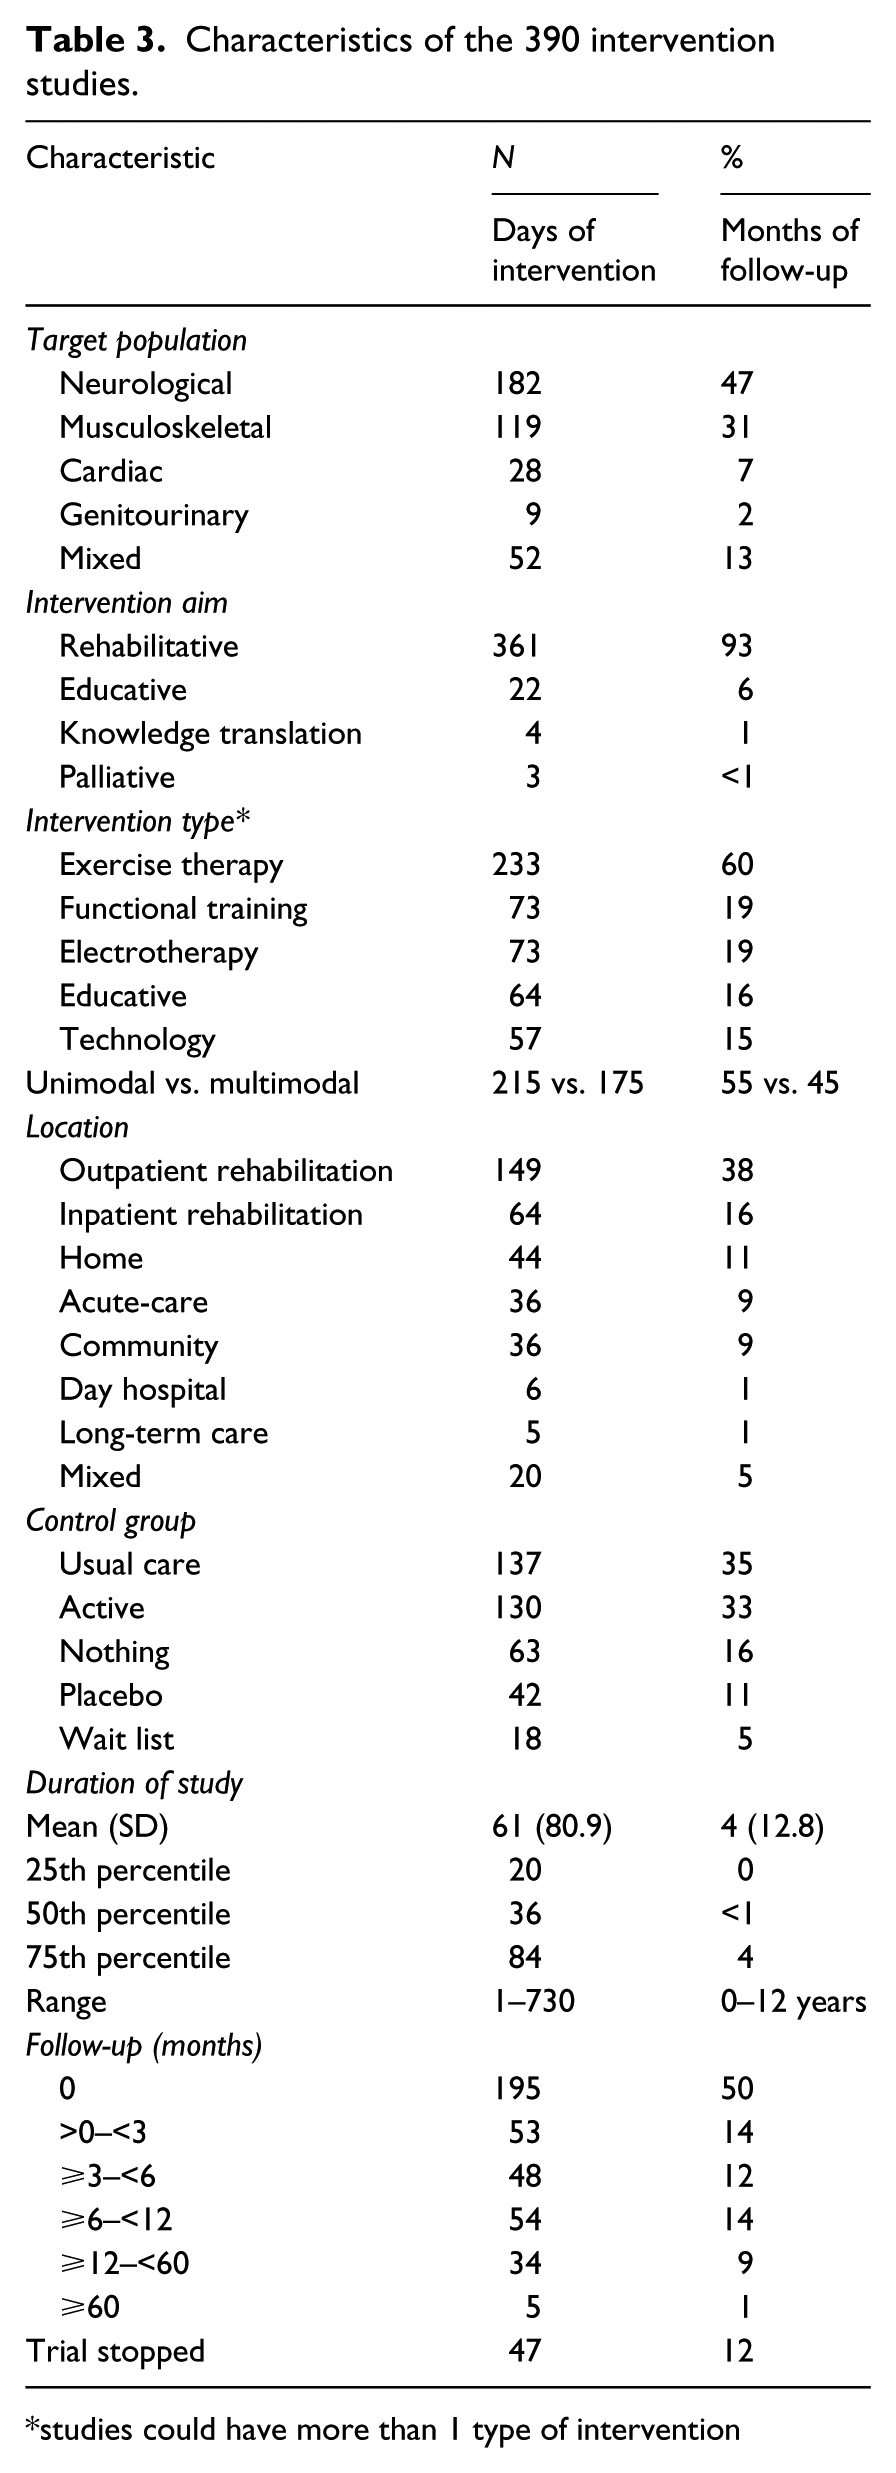
studies could have more than 1 type of intervention
Quality of the research question.
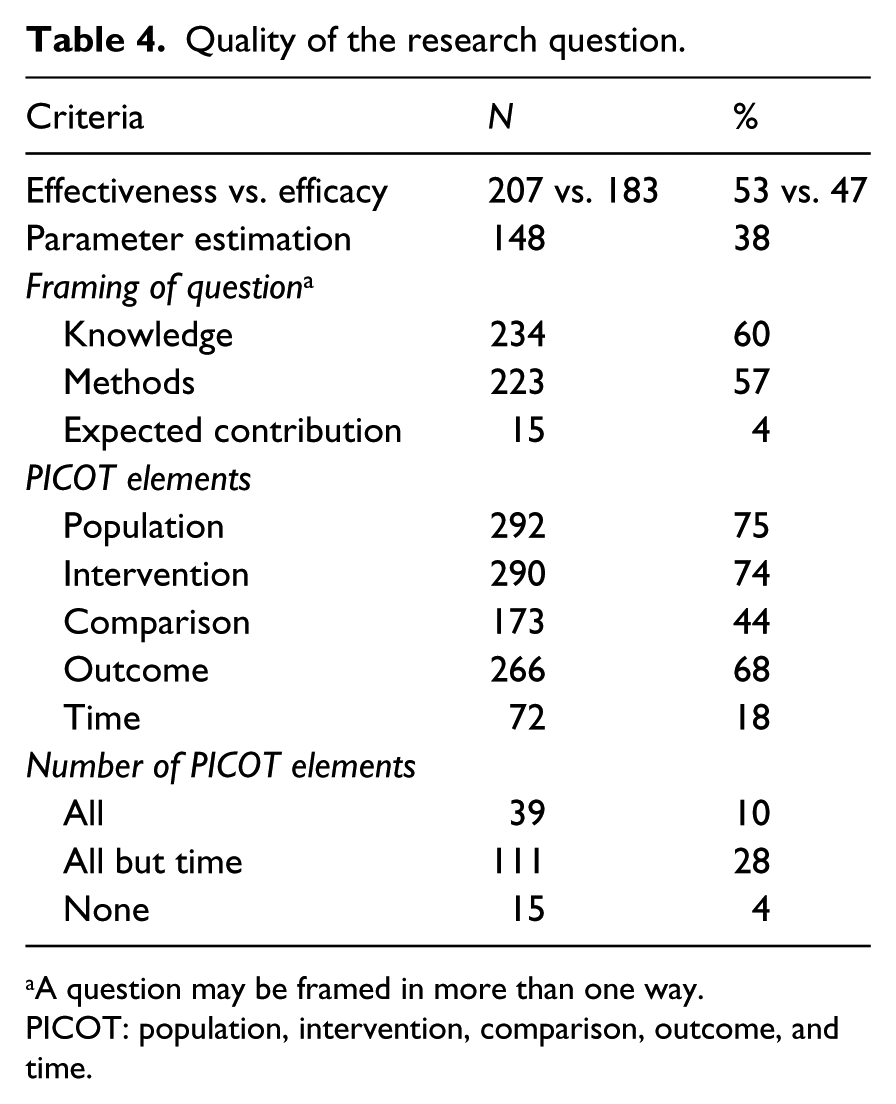
A question may be framed in more than one way.
PICOT: population, intervention, comparison, outcome, and time.
Measurement approach for primary and secondary outcomes.
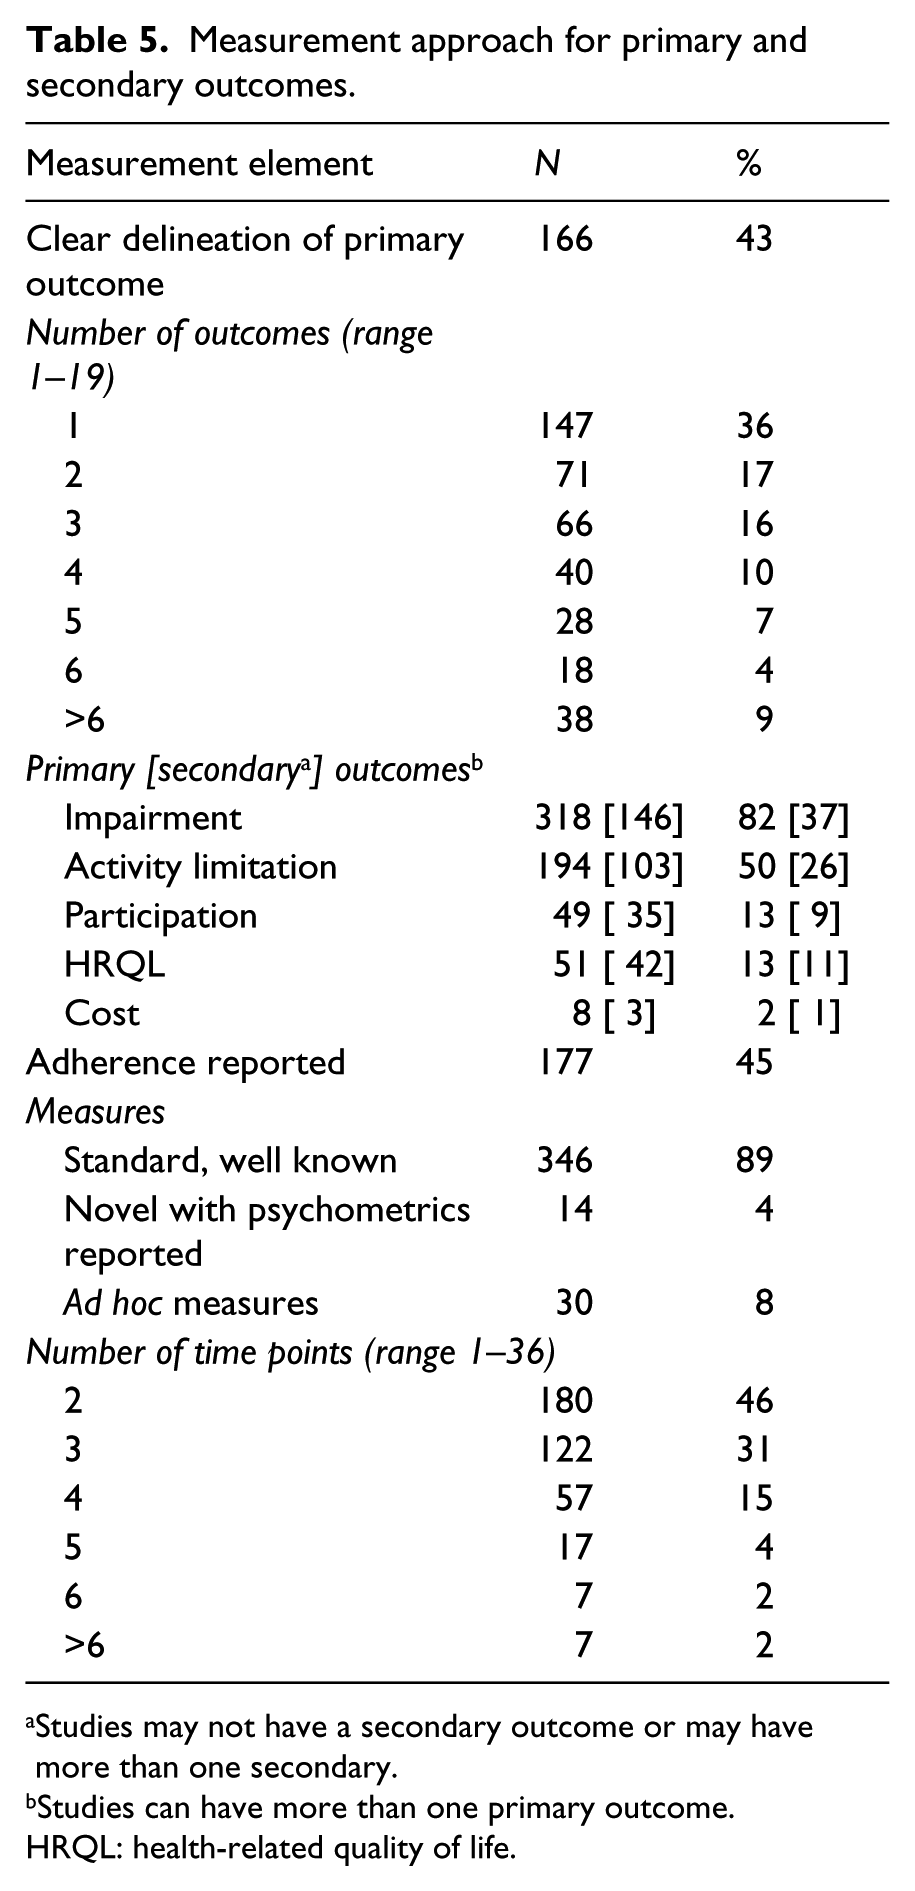
Studies may not have a secondary outcome or may have more than one secondary.
Studies can have more than one primary outcome.
HRQL: health-related quality of life.
Methodological quality of the trials according to selected criteria.
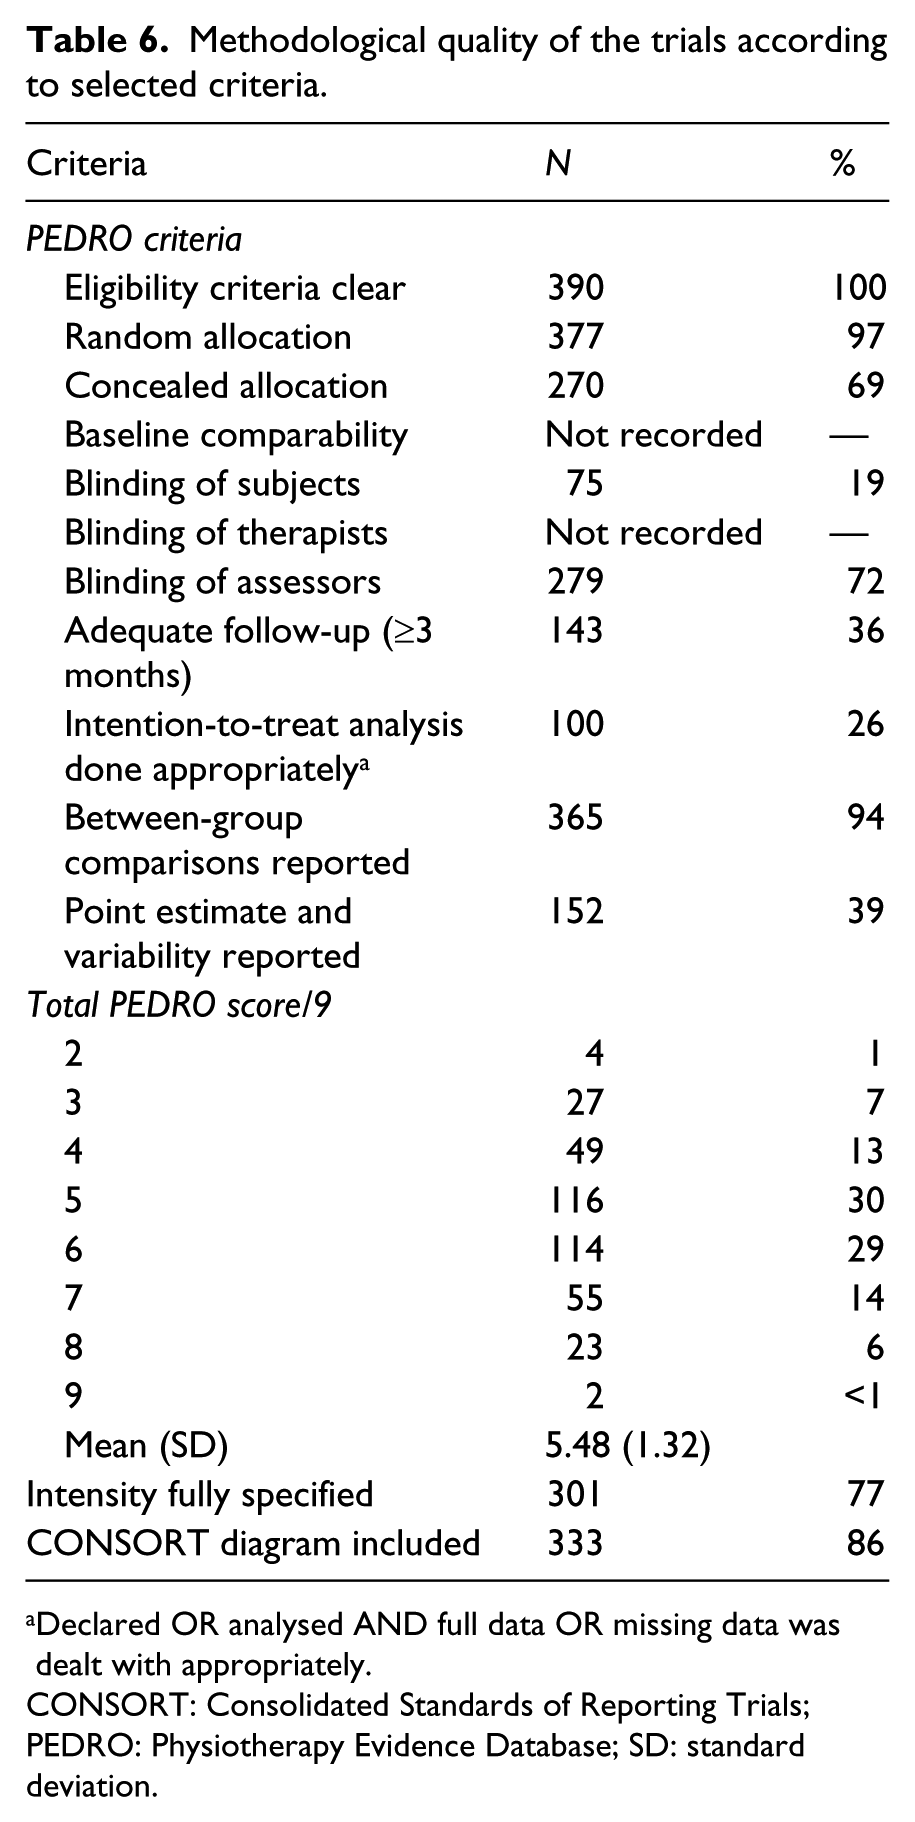
Declared OR analysed AND full data OR missing data was dealt with appropriately.
CONSORT: Consolidated Standards of Reporting Trials; PEDRO: Physiotherapy Evidence Database; SD: standard deviation.
Distribution of sample size and proportion dropping out by intervention’s end.
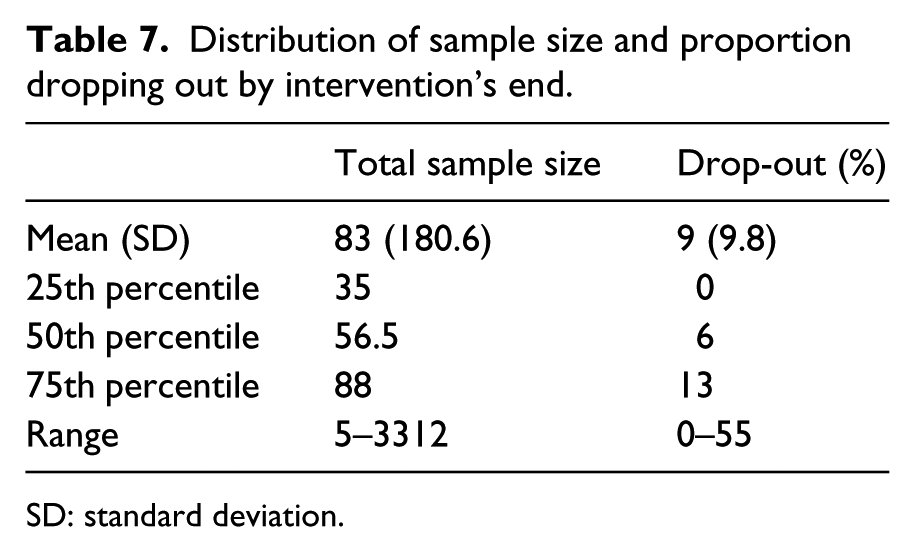
SD: standard deviation.
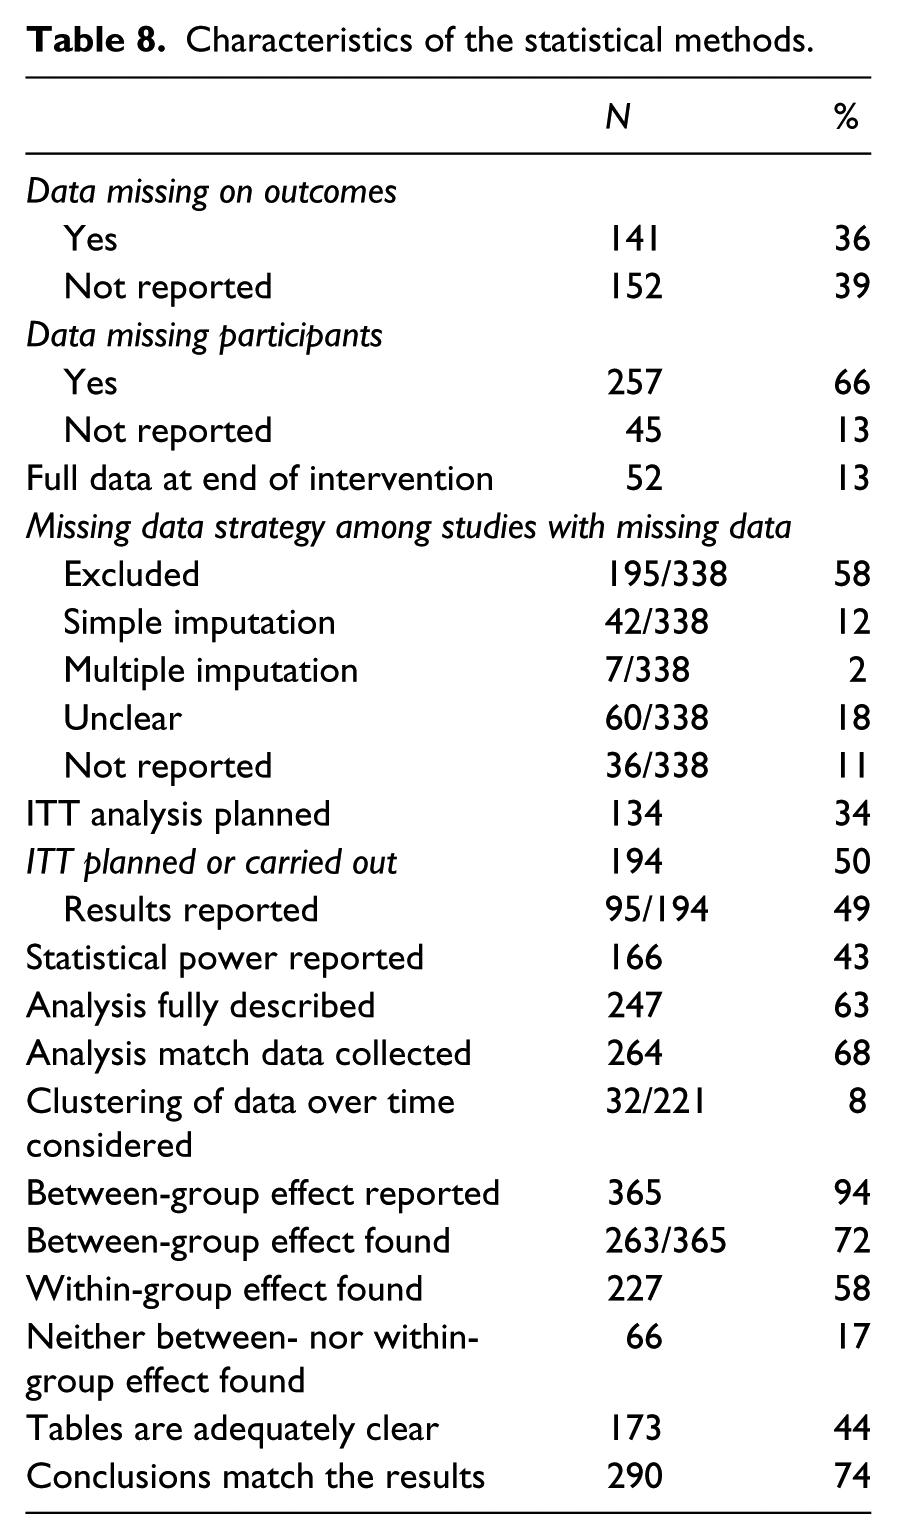
Characteristics of the statistical methods.
Characteristics of trials that changed over era.
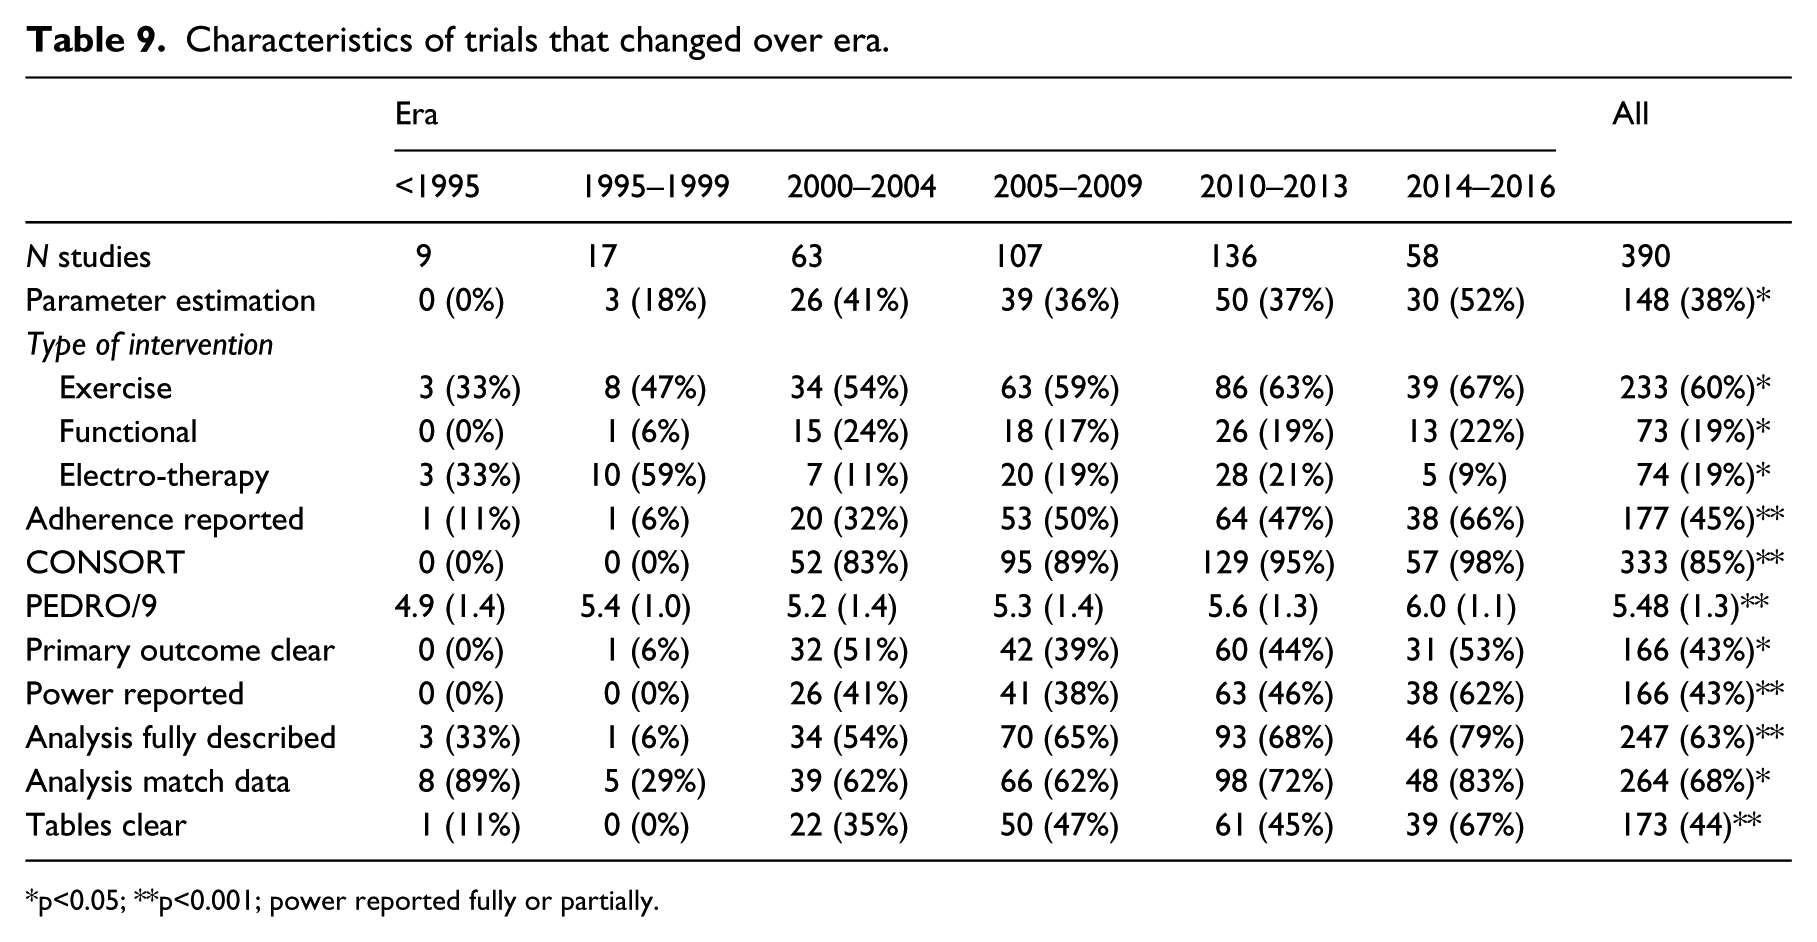
p<0.05; **p<0.001; power reported fully or partially.
Table 3 presents the characteristics of the interventions tested. The target populations were mainly neurological or musculoskeletal. The most common type of intervention tested was therapeutic exercise (60%); functional training, electrotherapy, education, and technologies were tested with frequency ranging from 19% to 15% of trials. Other types of interventions were less common (4% to 7% of trials): cognitive therapy, behavioural interventions, self-management, assistive devices, and pharmacological therapies and manual therapy. Interventions were tested alone, unimodal, in 55% of the studies, and in combination, multimodal, in 45%. The control groups were most often usual care or an active treatment (35% and 33%, respectively).
The average duration of the interventions was 61 days with a wide variation (SD 89.9; range 1 to 730 days). The average duration of follow-up was four months, with almost 50% of trials having no follow-up after the end of treatment; the longest follow-up was 12 years. Four trials were classified as clustered randomized trials,17–20 a type of trial where units are randomized rather than patients.
The frequency with which elements of ‘good’ research questions 15 were used are presented in Table 4. Questions about effectiveness or efficacy were equally common, but studies with questions about parameters estimates vs. testing hypotheses were less frequent (38%). Research questions were framed according to the knowledge the investigators wish to gain from the study in 60% of the studies; 57% still focused on the methods to be used and a small percentage expressed the question as to how the results might be used (expected contribution). Questions to provide evidence are worded using the PICOT format for population, intervention, comparison, outcome, and time. 15 Only 10% used all the PICOT elements and 28% used all but time (PICO). The least included PICOT elements were time and the comparison group.
Table 5 presents information on the primary and secondary outcomes. There was a clear delineation between primary and secondary outcomes in less than half of the studies (43%). The modal number of outcomes was one (36%), the range was one to 19 outcomes. Impairment level outcomes were the most common for both primary (82%) and secondary (37%) outcomes. The next most frequent outcome was at the activity level; 50% for primary outcomes and 26% for secondary. Other level outcomes were much rarer: Health-related quality of life (HQRL) measures were included as any outcome in a total of 24% of trials. Adherence, a process-oriented outcome, was reported in almost half of the studies (45%). The number of time points ranged from 2 to 36 (survival analysis), with a modal value of 2 (pre–post), although 3 was also common (31%).
Table 6 presents the frequency with which selected indicators of methodological rigour were met. While the PEDRO 4 checklist was not implicitly used, nine of the 11 criteria could be constructed from the data elements abstracted. Apart from randomization, two other criteria were always or almost always met; eligibility criteria and reporting of a between-group comparison. Blinding of assessors was common (72%) but not universal; blinding of study subjects was rare (19%). The other criterion that was rarely met related to using correctly the intention-to-treat approach for the analysis. While 194 studies indicated the use of intention-to-treat, only 100 either had full data or included a strategy for handling missing data, which is a requirement, otherwise not all subjects allocated can be included in the analysis. The modal number of items satisfied was five to six of nine. Two studies achieved all nine of the PEDRO criteria enumerated.21,22
Table 7 summarizes the samples sizes and drop-outs across studies. The average sample size was 83 people with a wide variation ranging from five to 3312. The proportion of drop-outs or people with data otherwise missing postintervention averaged 9% with a range from 0% to 55%.
The characteristics of the statistical methods are presented in Table 8. The status of missing data was often not reported. There were only 51 studies (13%) with no missing data. Of the 338 studies with some missing data, how the missing data was handled was sometimes unclear (18%) or not reported (11%). Most often missing data were excluded from the analysis (58%) and studies rarely used reasonable approaches to deal with missing data, such as simple imputation or modelling (12%) or multiple imputation (2%). Intention-to-treat analysis was planned or carried out in 194 studies, but these results were rarely reported (95/194; 49%). Investigators often reported that the results were similar to the per protocol analysis, so did not report the intention-to-treat results; sometimes only the wording ‘intention-to-treat’ was used and the analysis was not carried through to the data presentation. Power was reported in less than half of studies, 43%. The planned analyses were fully described in 63% of studies, but the analysis matched the data collected in only 68% of studies. Some examples are: analysing event data like falls as measured data and comparing means, rather than as a count and comparing proportions; and comparing groups on outcomes at each time point rather than allowing time to be a factor.
It was rare for multiple time points to be dealt with optimally by considering the clustering of the data over time (8%). The between-group data was presented in 94% of studies and in 72% of these studies there was a significant difference on at least one primary outcome. Lack of either a between-group or within-group effect was rare (only 17% of studies). The presentation of the data in tables was adequately clear in 44%. The conclusions sometimes did not match the results (36%).
Table 9 lists 10 methodological features that changed over the nearly 30 years of trial research. There was an increase in the use of parameter estimation rather than hypothesis testing questions, such that in the last era 52% of studies were of this type. More studies tested therapeutic exercise and functional training, but fewer tested electrotherapy modalities. The PEDRO score increased significantly, but only by a little more than 1 point in 9 over 30 years.
Discussion
Conducting trials is a relatively recent phenomenon in rehabilitation science and its component professions such as Physical and Occupational Therapy. In a 1994 commentary 23 by Professor Sharon Wood-Dauphinee, a former Director of the School of Physical and Occupational Therapy at McGill, a research mentor to many Canadian Physical Therapists, and a trialist herself, she noted that, among the 504 abstracts to be presented at that year’s Canadian Physiotherapy Association meeting, only 3% were trials (4% if pilot trials were included). Wood-Dauphinee went on to identify why, despite trials providing the highest level of evidence, there were so few. Among the reasons was a lack of Physical Therapists trained in trial methodology, realization that widely used outcome measures were inadequate for estimating change over time, and lack of resources as trials were very expensive and required a multidisciplinary team. Twenty years later, we are in a much better situation as evidenced by the growth in the number of trials reported in Clinical Rehabilitation over the decades (see Figure 2) and an improvement in reporting standards, such as use of the CONSORT diagram that was 97% by the last era (see Tables 5 and 9).
What do the results found here suggest for the next 30 years?
Get the question right
The first step to a well thought out trial is a well thought out question. This requires that the research is clear as to what knowledge they wish to gain from the study. Only 60% of research questions where clear about this and many questions were framed in terms of the methods the investigator wished to deploy. The knowledge to be gained from a trial is evidence to guide practice. The investigator needs to be specific as to what evidence is needed: For what population (P); for what intervention (I); in comparison (C) to what, nothing, usual care, placebo, or an active intervention; on what outcomes (O); and when (time, T). 15
In evidence-based research, this formulation has been termed PICOT and the rehabilitation community has not yet adopted this format. Table 4 shows that only 10% of studies identified all elements; 28% identified PICO, without time. Framing the research question (objective) as knowledge and using the PICOT format is not just semantics. It ensures that the investigator has all of the important features of a trial declared a priori so the results presented are those originally sought and could not be considered as arising from post hoc analyses.
Here is an example of a clear research question from a study by Higgins et al.:
24
The objective of the study was to evaluate the efficacy of task-oriented training in enhancing arm function post stroke. The hypothesis tested was that people who received a six-week programme of arm training would improve their arm function to a greater extent than people who received a walking intervention.
Hopefully, it will not take 30 years for rehabilitation researchers to adopt PICOT.
The outcomes must be clear: Putting the ‘O’ in PICOT
Most rehabilitation interventions are complex in that they are multimodal and often tailored to the needs of the patient. Situating the outcomes within a framework ensures that all relevant outcomes and the linkages between them are identified. We are fortunate in rehabilitation to have the biopsychosocial model from the World Health Organization’s International Classification of Functioning, Disability and Health (ICF) 25 to guide domains of measurement and ICF core sets for many of the target health conditions. 26 For outcomes beyond function and disability, the Wilson–Cleary model of health-related quality of life shows a model linking in the more distal outcomes including quality of life. 27
We are still focused on impairment-level outcomes, including those measured from the patient’s perspective. Termed PROs, approximately one-third of trials had pain, depression, and/or fatigue as an outcome. Health-related quality of life outcomes are still relatively rare. In many instances impairment-level outcomes are the most relevant as they reflect what the interventions are targeting, but understanding how these proximal outcomes act would ensure the appropriate inclusion of other outcomes, either as providing supporting evidence or emphasizing clinical relevance.
There was not always a clear delineation between primary and secondary outcomes (43%) and 30% of studies had four or more outcomes (see Table 6). Rather than labelling outcomes as primary or secondary, an alternate labelling would be to identify the role each variable plays in the causal pathway from intervention to outcome. Fairclough suggests that classifying outcomes as confirmatory, explanatory, or exploratory is more helpful and reduces the need to adjust for multiple outcomes when there is only one confirmatory outcome. 28 Multiple confirmatory outcomes will still require splitting the p-value among them. Explanatory outcomes are those that help to explain how the outcome was or was not achieved. Many of these are physiological in nature or at the impairment level. Exploratory outcomes are those that are of interest beyond the confirmatory outcome and may relate to outcomes that arise as a result of other outcomes, sometimes termed downstream outcomes.
In order to plan an appropriate outcome strategy, it is essential to understand fully how the intervention acts to change outcomes. The authors of this article recognize three types of intervention effects: Target, domino, fan (Figure 3). A targeted intervention impacts one and only one outcome or outcome type, most often at the impairment level, and is usually a single modality including a specific exercise, assistive devices, orthotics, drugs, and nutritional supplements.29–33 An intervention that has a domino effect impacts on a proximal outcome that in turn causes effects in other outcomes, as when a line of dominos fall when the first is tipped over; interventions targeting symptoms or one activity such as walking are examples.34,35 A fan intervention simultaneously impacts on many different outcomes; this is a feature of many multimodal interventions.36–38 When the intervention effects are thought of using these analogies, it is easier to design a measurement approach that optimizes the evidence presented and also indicates a specific analytical approach.
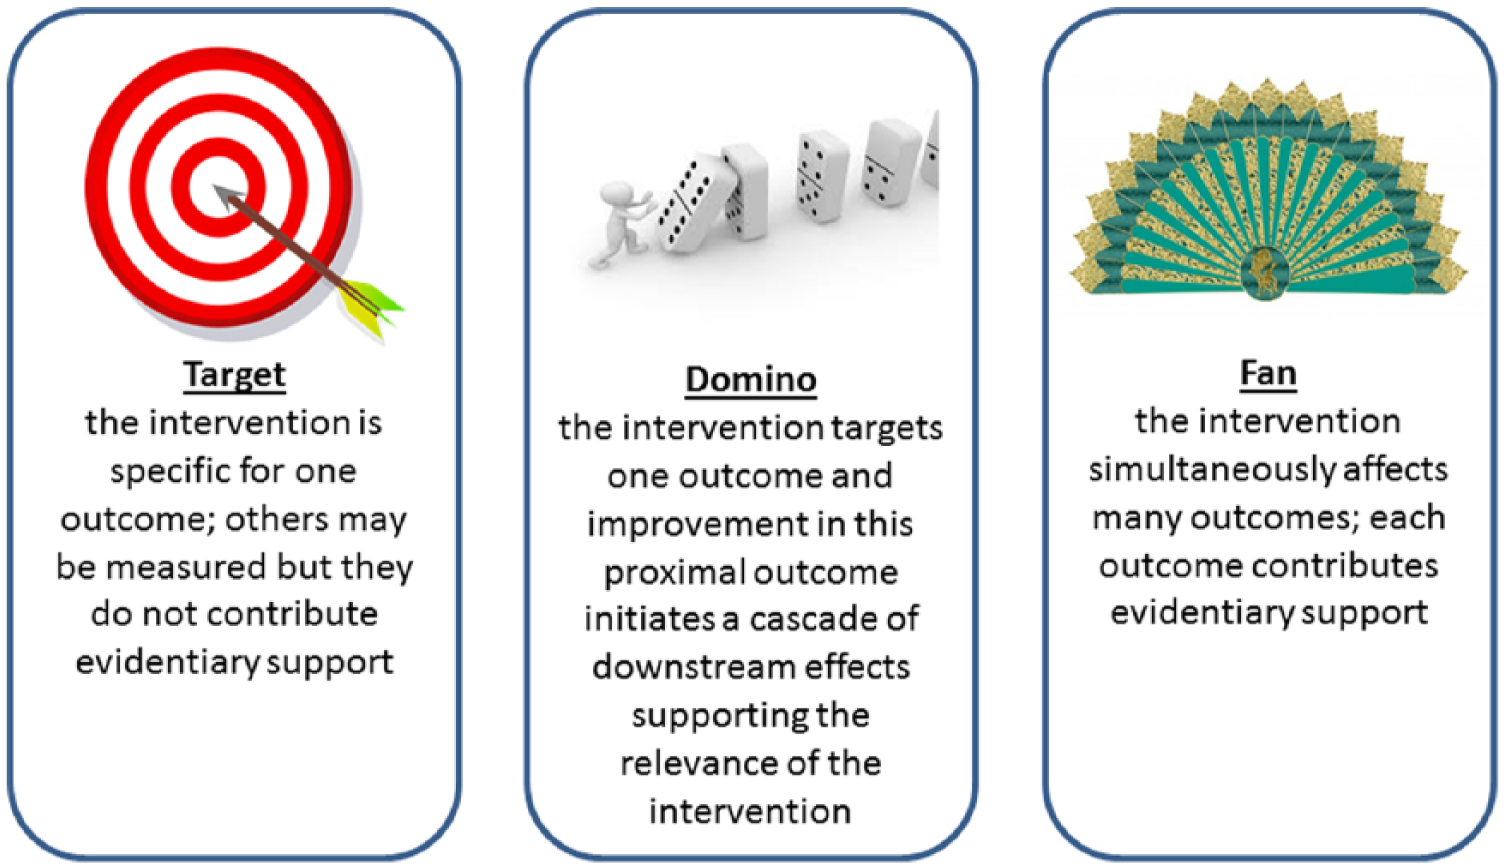
Three types of interventions.
As the effects of rehabilitation interventions are not easily summarized by a single outcome and evolution over time is important, this is an area of development that will need to be explored in future. Multiple outcomes can arise from having multiple measures of effect, from having multiple time points for measurement, or both. There are statistical methods that optimize the information available from multiple outcomes and consider the clustering of observations within persons arising from multiple time points, but use of these methods require additional statistical input and education. Several articles illustrate these methods.39–41
Improve the trial methodology
Although five of the nine criteria of the PEDRO methodological quality checklist that could be evaluated were very often achieved, four criteria were less than optimal (Table 5). Half of the studies had no follow-up and only 36% had follow-up of three months or more. Half of the studies identified taking an intention-to-treat approach (Table 8), but in only 26% of studies was there information on how the missing data on participants was incorporated into the analysis. 42
For example, although drop-outs from these trials are modest (mean proportion 9%; see Table 7), few trials (13%) had full data to analyse at the end of the intervention (Table 8). This complicates the analysis as missing data needs to be accounted for to avoid bias. 39
This is not unique to rehabilitation trials; a study of trials in eight leading orthopaedic journals found only 35% adhered to the strict definition of intention-to-treat. 43 The treatment of missing data needs a deep understanding of reasons of why data are missing, and statistical approaches44–46 that are often beyond the statistical methods training received by rehabilitation researchers. Several studies illustrate methods for missing data.40,47
Blinding of assessors was common (72%) but not universal. However, blinding of study subjects was rare (19%). This in itself does not introduce a serious bias unless the outcomes are those that can be influenced by the study subject, such as self-report outcomes and PROs. Of 315 studies with no blinding of patients, a majority used a PRO such as pain, depression, fatigue, or health-related quality of life or a self-report measure of participation. Other studies may have used a self-report measure of activity limitations. When these outcomes are used in studies without subject blinding, bias can arise as an unblinded subject could under report negative outcomes and over report positive outcomes to please the investigative team. A 2004 systematic review of the impact of blinding, 48 found that it was either impossible or difficult to blind subjects to rehabilitation type interventions in almost 80% of trials, but the impact of this lack of blinding was moderate to important in 25% of rehabilitation trials. It was very rare to report the success of blinding. One exception is the study by Salbach et al., 47 where unblinding of evaluators occurred in 40% of participants but this unblinding did not influence the results as the outcome was the 6-minute walk test, a performance measure. The definition of unblinding was that the evaluators knew or guessed correctly.
The key challenges for rehabilitation trialists are to deal statistically with missing data and being more diligent in ensuring blinding for subjects when they are the sole reporters of the outcome.
Be specific about the intervention
Not surprising, the trials covered in this review were mainly targeting neurological and musculoskeletal populations, testing a variety of interventions, alone (55%) or as a multimodal intervention (see Table 3). The duration of the interventions was short (see Table 4): 50% were offered for five weeks or less, which may be of relevance for the treatment of acute injuries but unlikely long enough for chronic conditions. A concern is that the intervention duration is planned for the benefit of the researchers and/or is dictated by funding arrangement, rather than driven by evidence. Another area of concern is the lack of follow-up or its short duration. The duration of follow-up will depend on whether the intervention is designed to be delivered and then discontinued (electrotherapy, manual therapy), in which case a shorter duration is relevant, or designed to endure through fostering behaviour change, in which case a longer follow-up is relevant. Clearly, the duration of follow-up will depend on the typical course of the condition and life-expectancy.
The TIDieR guidelines 14 are designed specifically to improve the clarity of the information pre-sented on the interventions and hopefully use will become as common as CONSORT. Another part of describing the intervention is to track adherence. Up to now, less than half of the studies reported on adherence (see Table 6). Adherence can be very helpful in explaining the results. In a trial comparing two home-based exercise interventions for people with chronic stroke 40 the main outcome, the 6-minute walk test, differed significantly between the highest and lowest adherence groups, providing supporting evidence for the benefits of exercise post-stroke. It is hoped that all trials will report on adherence and use the information to support the findings.
Provide estimates of the magnitude of effect
Only 39% of trials reported a point estimate and confidence intervals (CI), and the majority are still satisfied with providing simple yes/no responses (hypothesis testing) to complex questions. The reason it is important to move beyond the yes/no answer is because this does not provide any indication of the distribution of change, which can be used to identify how many people may have improved a meaningful amount and also the extent to which very small, unimportant, change may occur.
A 95% CI around a difference in means between two groups indicates that, if different similar samples were tested over and over again, the mean change would fall within the given interval, 19 times out of 20 (95%). A difference between two means of a hypothetical 10 points with a 95% CI from 0.1 to 20 would be statistically significant, but would indicate that 2.5% of the time, the mean could be 0 or less. If a meaningful change was in fact 5 points, a means of 5 or less could occur in 17% of these hypothetically repeated samples (68% CI). As the aim of doing a trial is to translate the finding to patients, this could indicate that a proportion on the sample, 17% would fail to benefit from the intervention.
Another way of reporting results is to use a definition of responder status. This avoids a challenge with reporting mean differences as this does not indicate how many people changed, although an estimate can be derived. The worst case scenario is a mean change of 0 with one-third improving, one-third staying the same, and one-third deteriorating. Responder status, for instance the number of people changing 50 m on the 6-minute walk test, can also be used to calculate another very useful statistic, NNT.9,49 This will indicate how many people need to be treated for one person to respond, which is very useful when thinking about clinical practice. Not all patients treated with the intervention will improve; that does not mean the intervention is ineffective and clinicians need to have a sense of the NNT. However, they will not have it, if it is not provided. No study reported on NNT and only a small handful of studies38,49,50 used responder status. Other types of studies reported on event-related outcomes, readmissions, return to work, or falls, which can be used to estimate NNT.
Design studies with adequate power
Sample sizes (see Table 7) are still relatively modest, which is not surprising given the resources required to mount a large, multicentred trial. The vast majority (~80%) of trials involved 100 subjects or less. This sample size would provide 80% power to detect effect sizes of 0.56 or greater, indicating at least a moderate effect is being sought. Interestingly, a significant between-group effect was found in 72% of the trials that reported a between-group effect. Either rehabilitation type interventions are quite impactful or there is publication bias when non-significant underpowered studies are not submitted for publication or not accepted. Publication bias may be suspected because only 17% of trials did not have a significant effect.
Power considerations were addressed in less than half of studies (43%) and this is similar to findings from other reviews. 54 An underpowered study with no between-group differences are either not published or are labelled as ‘pilot’ after the fact. Pilot studies were common, 191 in all, and these will be reviewed in a subsequent article. Not all studies labelled as ‘pilot’ had any objectives justifying pilot status.
Because of the resources needed to mount an adequately powered study, the results of rehabilitation trials may be doomed to feed meta-analyses. In which case, we need to be clear on what elements are needed for these smaller trials to maximize their benefit when combined with others. For example, one element that would be most useful is to report on responder status (even if this contrast is not significant). To illustrate the advantage of reporting responder status, even in a trial that analyses the data as continuously, is the study by Salbach et al. 47 In this trial, the primary outcome of a walking competency intervention for chronic stroke was the 6-minute walk test. The mean improvement in the intervention group was 40 m and 5 m in the intervention group for a mean difference of 35 m (95% CI: 7 to 64). Presented for interpretation was the proportion of people who change different meaningful amounts. For example, 20% in the intervention group made no change nor deteriorated but, in the control group, this proportion was 55%; 50% of the intervention group made a change of ≥28 m, but only 17% achieved this improvement in the control group (p < 0.001). Reporting change as a proportion makes summarizing across trials easier because its interpretation does not depend on which measure was used.
Communicate the results more effectively
In order for the results of the trials to be accessible to clinician-readers, better presentation of the data is also required. The tables were only adequate in 44% of trials and poor in some. To name some suboptimal features, flaws included: using different row and column headings across tables; referring to groups by letters or numbers with no informative label; arbitrary ordering of the variables; units not specified; scoring range for ordinal rating scales not given; meaning of high value not indicated; missing distribution parameters; false precision by including too many decimal places, rarely are two needed, often none is fine; presenting results of statistical tests in tables as these values have no measurement meaning; multiple p-values sometimes more than the number of subjects; no indication of sample size in the table and how size changed over time; and opaque calculations. An example of the latter is that tables rarely indicated how many subjects contributed at each time point and often the value in the table at the last time point is based on a different number of people than the value at the first time period. Thus, any differences calculated between these time points are not directly calculable from the data provided.
To quote a British statistician and former Professor of Epidemiology and Biostatistics at McGill University, Dr FDK Liddell, 53 with respect to presentation of statistical material in tables: ‘Those who know, know, and you don’t need to tell them, those who don’t know, don’t know, and don’t care’. He felt that casting tables was an art form and a way of presenting a picture of the results that should be clear to any reader; the statistical material should serve as footnotes for those who care.
Limitations
This study reviewed the trials published only in Clinical Rehabilitation. Nevertheless, the results reported here are likely to be generalizable to other rehabilitation journals. The top 21 rehabilitation journals in Web of Science all have basically the same impact factor, range 2.0 to 4.0, with Clinical Rehabilitation ranking 10th with an impact factor of 2.4. A critique across all rehabilitation journals for case-control studies, 54 for example, did not find any one rehabilitation journal superior to any other in reporting on studies with this design. In fact, all were very poor.
However, there have been some very good trials published by rehabilitation researchers or on topics relevant to rehabilitation in the New England Journal of Medicine, Journal of the American Medical Association, Lancet, British Medical Journal, Stroke, etc. These journals had 2014 impact factors ranging from 17.5 to over 55, according to Web of Science, but the number of rehabilitation trials published in these journals is relatively modest. The majority of rehabilitation trials still have room for improvement.
Conclusions
Back to the future? Rehabilitation trialists are answering important questions about their interventions. More advanced statistical methods are needed as the interventions and their answers are complex. Outcomes need to be more patient-centred and a clear measurement framework needs to be explicit. Given the small sample sizes and the propensity for publication bias, should rehabilitation trialists be doomed to feed meta-analyses, 55 and if so how should these studies be structured for this purpose? This article critiqued full trials, a companion article will address pilot studies; perhaps a third type of trial is emerging, those designed only to contribute evidence to be summarized using meta-analysis. For all of these purposes, trials need to be designed and analysed with rigour. The references covered in this article and some of the included examples should serve as a guide. It is also the responsibility of reviewers to educate themselves on trial methodology and editors to ensure that standards are met. Clinical Rehabilitation has a guidance about what to present in randomized studies based on CONSORT, but this review indicates that the ‘how to’ about designing a trial to achieve rigour still has room for improvement.
Clinical Messages
It is difficult to conduct a well thought out trial without a well thought out question that is specific as to the population (P), intervention (I), comparison (C), outcome (O), and time (T): PICOT.
The distinction between primary and other outcomes must be clear; the ICF framework can be used to identify all relevant outcomes and their linkages.
Rehabilitation trials are more common and being conducted with greater rigor, but more methodological attention is still needed.
Analyses that consider the clustering of data within person, as in a study with multiple time points, need to be used.
Missing data needs to be handled in the analysis for an intention-to-treat approach.
It is good practice to ask if evaluators knew the group assignment or could guess, and to incorporate this information into the analysis to see if it changes the estimate of effect.
The estimate of effect is more relevant to clinical practice than a probability that the null hypothesis is rejected.
The duration of the intervention and follow-up need to be justified based on more than convenience.
Tables need to present the results in a way that is transparent and informative to all readers.
Footnotes
Declaration of Conflicting Interests
The author(s) declared no potential conflicts of interest with respect to the research, authorship, and/or publication of this article.
Funding
The author(s) received no financial support for the research, authorship, and/or publication of this article.