
Abstract
This study critically examines the impact of a rail network on mobility of residents in an urban area in the north of England. The research provides a ward-level analysis of rail commuting habits, social indicators and economic trends throughout Liverpool, in order to evaluate how access to the Merseyrail network reflects socioeconomic engagement and opportunity. Secondary sourced quantitative data is used in an exploratory data analysis of mobility and socioeconomic participation in Liverpool. Operating the Travel Time Application Programming Interface (API) furthers the research by generating a spatial analysis of rail accessibility. Initial results indicate that the rail line enables mobility throughout Liverpool. Wards served by the Merseyrail network demonstrate around 8%–12% of residents use the service. Findings highlight that the rail network is associated with socioeconomic opportunity, as eight of the ten wards served by the Merseyrail network represent the lowest unemployment rates. An inequality in rail accessibility is observed as all passenger routes converge on the city centre. Should the limitations to the network be addressed through the Liverpool City Region Long-Term Rail Strategy, new social, economic and cultural opportunities will open for the city and the wider city region.
Introduction
The United Kingdom currently has the largest proportion of residents living in towns and cities in Europe (OECD, 2017). These cities require a transport infrastructure to move individuals through urban areas however, particularly in dense locations. The movement of people, resources and ideas in a town or city is referred to as urban mobility (Hu, 2016). Urban mobility requires a transport network of some distance and quality to stimulate local, regional and national economies and to stretch social systems by providing a method of movement for individuals, capital and goods. A rail network is an example of such infrastructure particularly when it has the potential to provide frequent and fast mass-mobility for a population in the urban realm (Docherty, 2000).
This research focuses on the Merseyrail network located in the Liverpool City Region as a frequent and fast fully electrified heavy-rail system that is concentrated within the Liverpool city boundaries. The work critically analyses how the Merseyrail network enables urban mobility and facilitates economic opportunity across the wards of Liverpool. By using a locational analysis of secondary sourced data, both graphical and spatial mapping techniques are generated to examine commuting patterns and their relationship to socioeconomic trends, including access to employment and social and economic exclusion, throughout the city. The analysis focuses on data aggregated at the statistical ward level, as these boundaries follow those of policy making, by comparing the accessibility within these spatial units to investigate how the rail network influences an individual’s ability to access wider economic opportunity.
The paper begins with an overview of themes relating to urbanisation, mobility and socioeconomic participation. Here, the work opens a discussion on how rail networks enable greater access to various markets, such as labour, although also consumption, and indicate how inequalities may be an outcome of underinvested rail systems. An outline of the rail network, Merseyrail, in the wider context of the Liverpool City Region (LCR) follows this discussion. At this point it is explained how processes of devolution have provided the LCR Combined Authority with new opportunities to plan their transport systems in new strategic ways.
The methodological framework examines datasets from the Office for National Statistics, including information on employment, education, and commuting patterns, and the Travel Time Application Programming Interface (API) is also used to measure accessibility across the city of Liverpool (TravelTime, 2021). The findings from the research illustrate the general levels of mobility enabled by the rail network in Liverpool, demonstrating that somewhere around one in ten citizens use the Merseyrail network to commute to work, and that greater access to the network can advance job accessibility and socioeconomic opportunity.
The contribution here is to set out an empirical base for an understudied part of the Liverpool and city-region wide transport system. Liverpool has a long history of stubborn poverty, with the city ranking as the second most deprived urban space throughout the UK in the most recent deprivation index (Ministry of Housing, Communities & Local Government, 2020). At this time, over 20% of the population were living in income deprivation, with many neighbourhoods noticeable for their longstanding socioeconomic distress (Furmedge et al., 2023. Drawing awareness on an understudied city with a long history of deprivation remains critical in advancing more progressive policymaking.
The research draws upon the recent governance framework of UK regionalism which has enabled the devolution of powers over policymaking and planning to a more localised scale (Thompson et al., 2022). Critical to this work is the role of transport planning, with the newly imposed city regionalism promoting greater control over transport services and infrastructure. Within Liverpool’s transport policymaking, the Merseyrail network is the focal point of the Liverpool City Region’s transport framework, as the network offers a high-frequency service which is fully localised, and one that operates separately from national rail lines. Merseyrail is central to the growth and inclusion initiatives of the Liverpool City Region, but there remains almost no empirical research on the network throughout the academic literature (see Liverpool City Region Combined Authority, undated).
This work evaluates the relationship between Merseyrail and socioeconomic mobility across the City of Liverpool. The research forwards an exploratory analysis, exploring trends and associations between Merseyrail’s usage and wider socioeconomic indicators throughout the city to offer a descriptive account of the influence of the Merseyrail system. The spatial analysis of the Merseyrail network forms the methodological contribution of the research. A catchment area analysis is performed using the Travel Time API to illustrate possible journeys by time, rather than distance (TravelTime, 2021). This mode of analysis enables an easily interpretable study of mobility on the rail network for policymakers, planners and academics alike. Moreover, this exploratory analysis also provides the conceptual foundation for further statistical analyses of the Merseyrail network.
Urbanisation, mobility and socioeconomic participation
The movement of individuals towards urban centres has led to the increase in the proportion of the national population living in towns and cities (Drakakris-Smith, 2012; Gong et al., 2012; Tacoli et al., 2015). Currently, the United Kingdom has the highest urban population in Europe, with around 54% of residents living in cities (Government Office for Science, 2014; OECD, 2017). The United Nations (2018) predicts that the number of cities with a population of around one million will double by 2030.
Greater socioeconomic infrastructure, cultural opportunities and transport amenities act as pull factors in the migration of individuals to towns and cities. An individual may seek relocation towards an area of socioeconomic activity in the pursuit of higher wages or a diversity of leisure opportunities with the belief that urban centres offer an opportunity to strive towards a higher standard of living (Ward and Wilson, 2018). The aptness to relocate can depend on a number of circumstances that form the perception of the quality of life of an urban area (Kabish et al., 2012; Simmie et al., 2006).
Urban mobility involves the movement of people, resources and ideas through space in the urban realm (Hu, 2016). Classical ideas about urban space and mobility argued how transportation and communication were primary factors in the ecology of the city as they enable mobility and competition between actors (Mumford, 1968; Park and Burgess, 1925). As transport systems evolve, through the deployment of greater resources and new technologies, for example, new travel opportunities can emerge and previously unrecognised spaces become connected and over time (Wright et al., 2008). This produces changing forms of mobility, and patterns of production and consumption are altered impacting upon the everyday material existence of citizens (Pooley et al., 2006). When Harvey spoke of new technologies ‘annihilating space through time’ (1990: 241) it was equally applicable to how the rail network is able to shrink regional and national space to create new distributions of wealth, power and economic activity. Transport infrastructures create services that increase the interconnectedness of places with rail providing a rapid and high-capacity method useful in connecting densely populated areas, providing frequent and fast mass-mobility (Docherty, 2000).
Locally, the same effects can be seen. Research by Bertolini et al. (2020) utilised census data to investigate how transport connectivity in the clustered urban environment influenced economic productivity in the consumer service sector. While research on public transport service patterns by Lendel et al. (2020) demonstrated the impact of transport on poverty, employment and property rental values in a local economy. What becomes an opportunity for an individual citizen is their accessibility, and a transport network can generate new possibilities in social connectivity and accessibility with new environments.
Previous research has shown an association, a correlation of sorts, between transport networks, transport investment and economic productivity (Chen and Vickerman, 2016). Intuitively, those areas with strong transport infrastructure are often able to demonstrate greater economic performance and productivity as individuals with readily available modes of transport are able to access markets, notably labour, health and housing, but also consumption of culture and education (Kawabata and Shen, 2006; Liddle et al., 2012). It is this inclusion in economic and social activities that led Brussel et al. (2019: 85) to label it as ‘socioeconomic participation’ and suggest that this is enabled by access to transport systems.
Transport affect goes much further than basic economic impact, however. Montreal was chosen by Páez et al. (2012) for the investigation of child day-care accessibility, while Apparicio et al. (2008) compared health service access by plotting the point data of the origin and destination. In contrast, a study of welfare recipients and public transit options across Los Angeles County found that the dispersal of the population made it difficult to increase public transport access (Blumenberg and Shiki, 2003).
Mobility can cause a reorganisation and redistribution of the power embedded in place. Many studies demonstrate enhanced opportunity through greater levels of access to transport, but equally there are examples of transport inequalities and exclusion. A recent study by Transport for the North, a public-private partnership representing those in transport organisations in the north of England, argued that there exists a vicious cycle of transport under-investment and exclusion in this region (Transport for the North, 2022). The report demonstrates the pressures on planning for transport as increased levels of urbanisation lead to increasing pressure in urban areas and reduced resources in rural areas (Ibid).
One response has been the attempt to move planning to a local scale. This is demonstrated in recent legislation, notably the Government of the United Kingdom (2011), the Cities and Local Government Devolution Act (2016) and the Department for Levelling Up, Housing and Communities (2019). The devolution of powers implemented through the 2016 Act are customised, negotiated between local governance agencies and central government, and have generally devolved powers over housing, transport and planning away from central government and towards the city-region scale as an effort to drive economic growth in England. While this provides some degree of local decision-making and fiscal independence, including control over public sector land use and the chance to develop strategic plans over housing and transport, it tends to concentrate power at the centre (Sykes and Nurse, 2017).
In the Liverpool City Region devolution has brought together six local authorities that include Halton, Knowsley, Liverpool, Sefton, St Helens and Wirral in a Combined Authority (see Figure 1). With a population of around 1.5 million people, it is Liverpool that has traditionally proven to be the centre of economic activity, one that is historically rooted in maritime and related transport activities (Southern, 2014). As deindustrialisation hit areas such as St Helens, Halton, parts of Knowsley and the southern part of Liverpool, it was the decline in the port that affected the city centre and north of the city (Sykes et al., 2013). Nevertheless, with a population that accounts for around a third of the city region, it is Liverpool city that remains the main economic driver for the wider area. Population of each borough in the Liverpool City Region.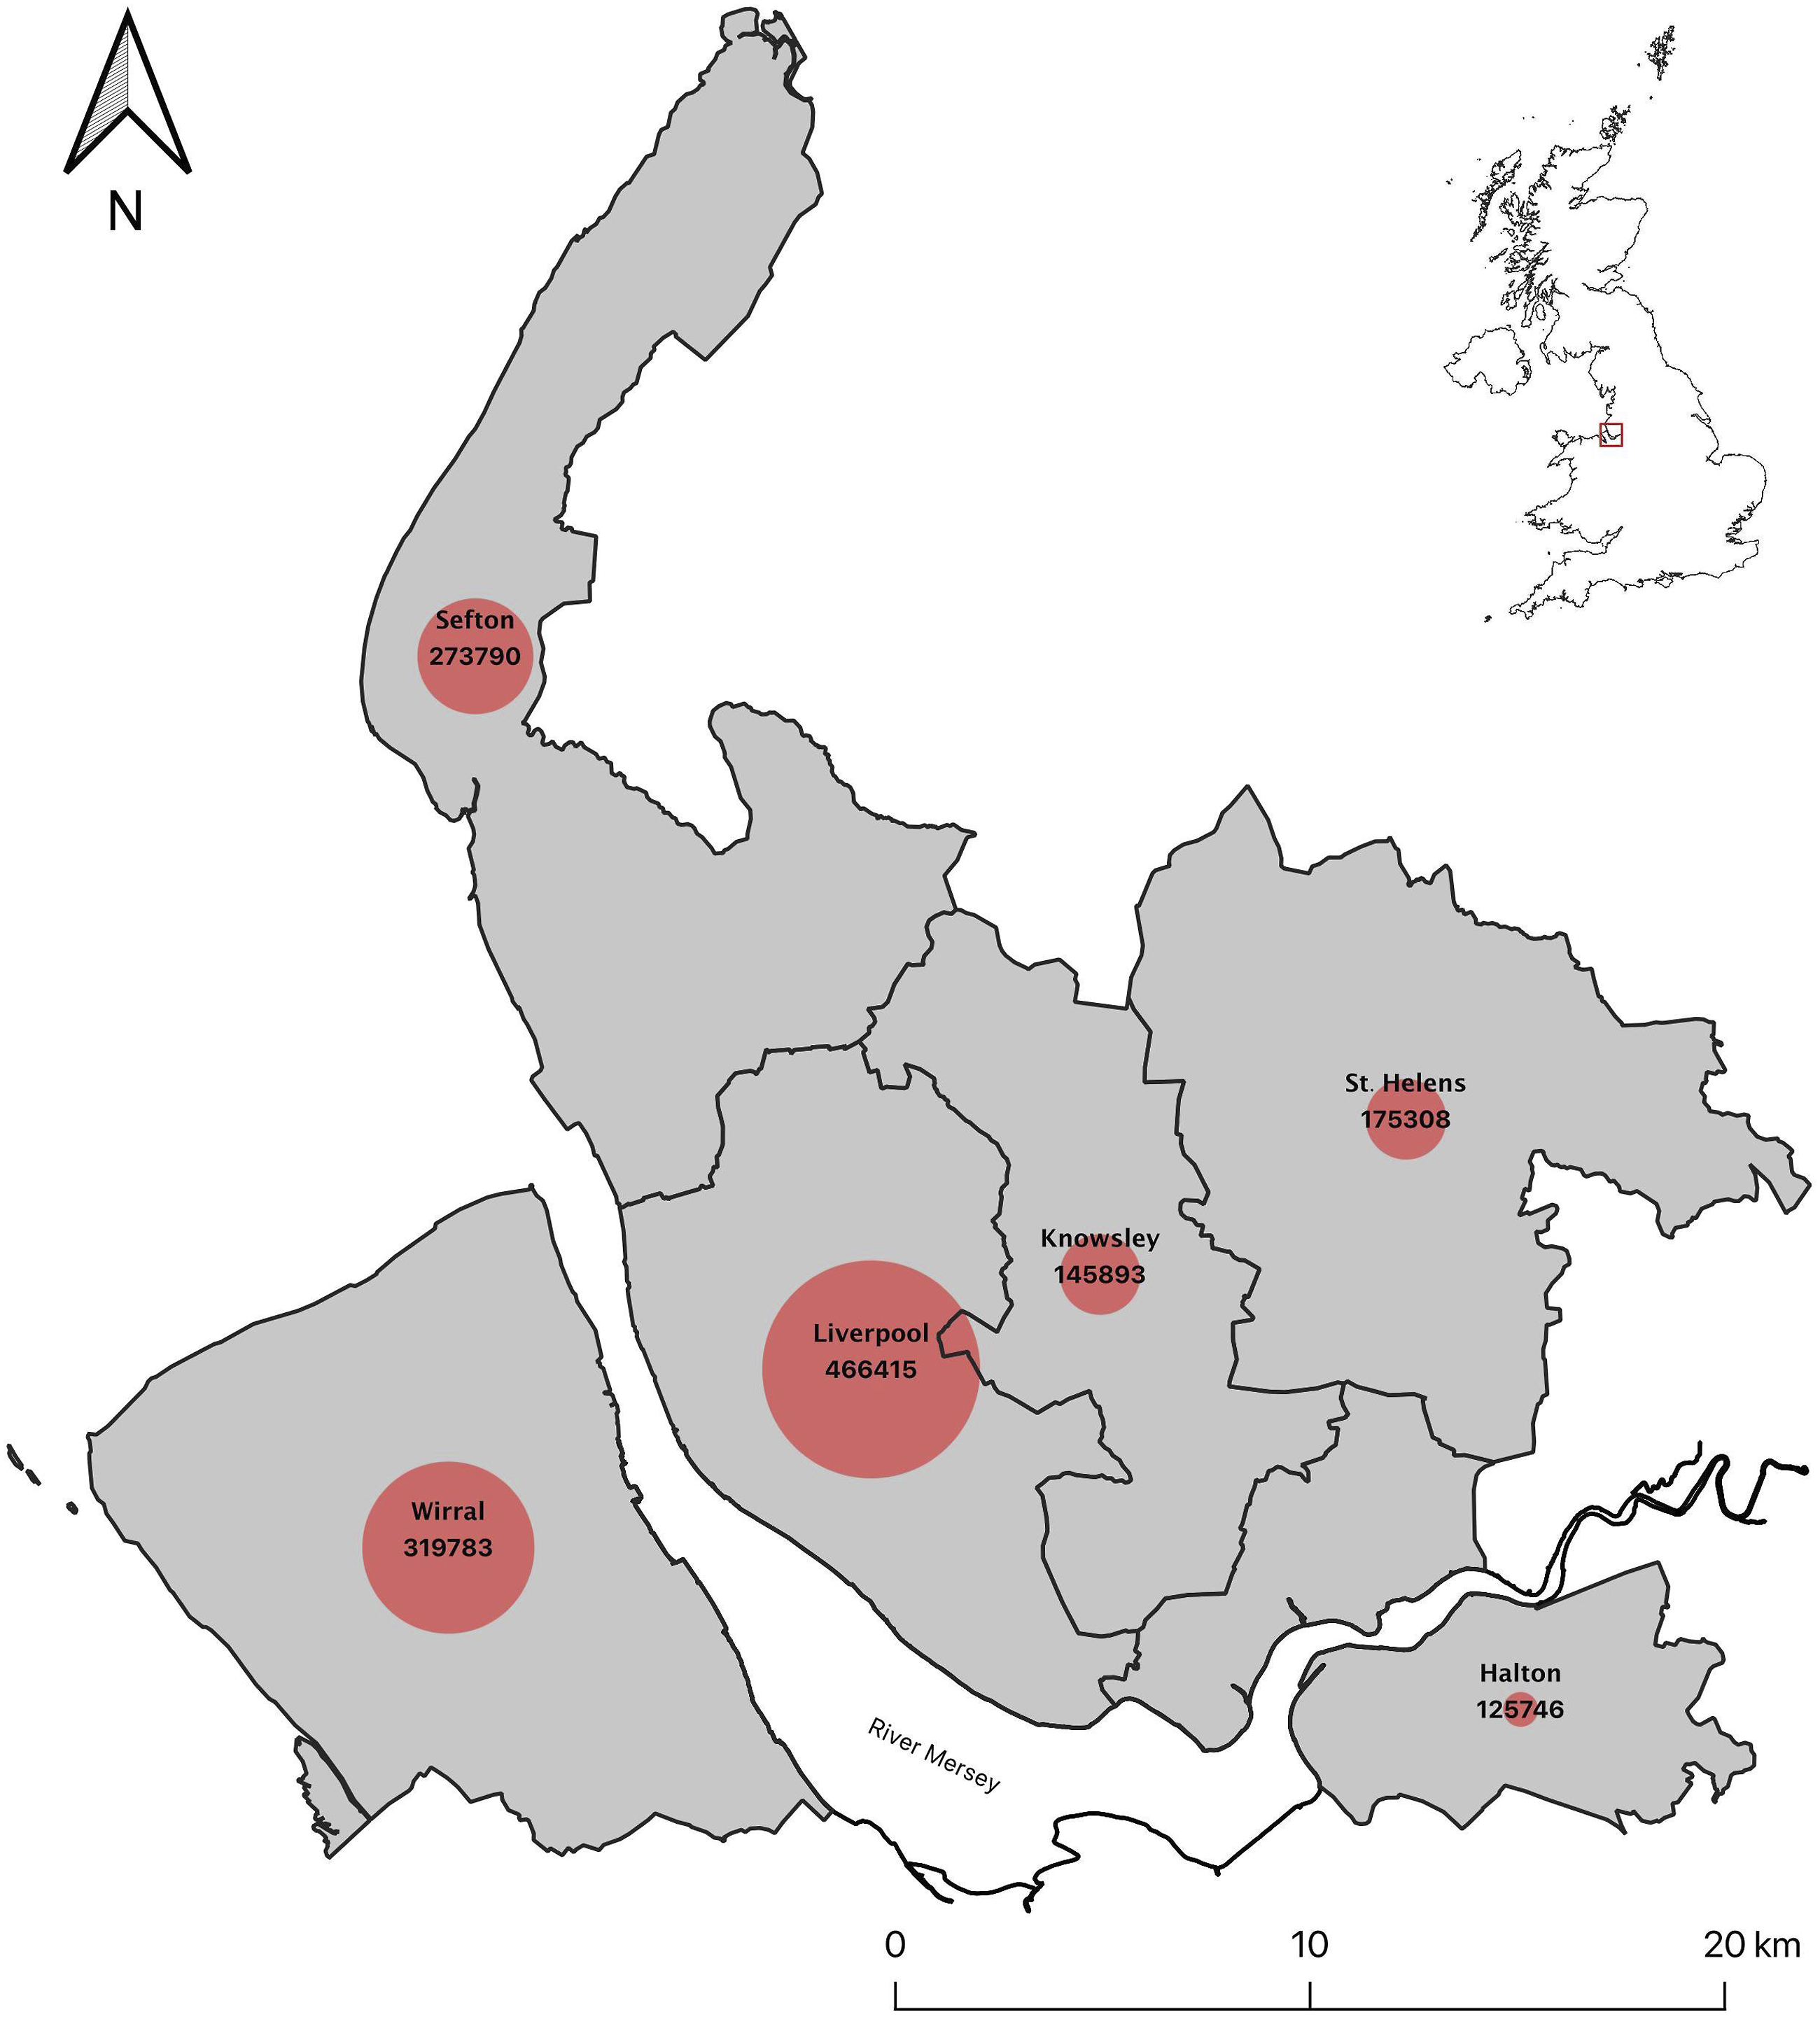
Liverpool City Region and the Merseyrail network
The context of devolution for Liverpool City Region (LCR) is not only the long economic decline of port and industry and the recent political instability of the UK, but the shift from its designation as a European Objective I region as Merseyside (Ellerton, 2011). The reduction in European funding during a transitory period from Objective I coincided with the designation of devolved powers and the decision by the UK to leave the EU. This has had the effect of phasing out of European funds and an allocation specifically to the LCR Combined Authority of some £30 m each year over 30 years. For transport, the devolved powers have enabled the Combined Authority to develop a consolidated transport budget, a bus strategy and a longer-term Special Rail Grant Settlement for the Merseyrail network.
The Merseyrail network hosts one of the oldest subway networks in the world, with the industrial and shipping heritage of the area reflected in the infrastructural form of the space (Smith et al., 2009). Owing to the city’s industrial and particularly maritime past, there remains a substantial amount of rail infrastructure that is either unused or used primarily for freight services. Despite this infrastructural legacy, there remains little knowledge on how the rail network has influenced the social context of this city in recent years. In terms of passenger services, there are currently three intraregional operating systems. The Merseyrail network, which is the city’s main system, is the focus of this research. There is also a less frequent service operated by Northern Rail that links with nearby cities, such as Manchester, by offering a few stopping points in south Liverpool (see Figure 2), and also in the north Sefton area of Southport, while Transport for Wales offers links through Wirral and Halton. Rail infrastructure in Liverpool.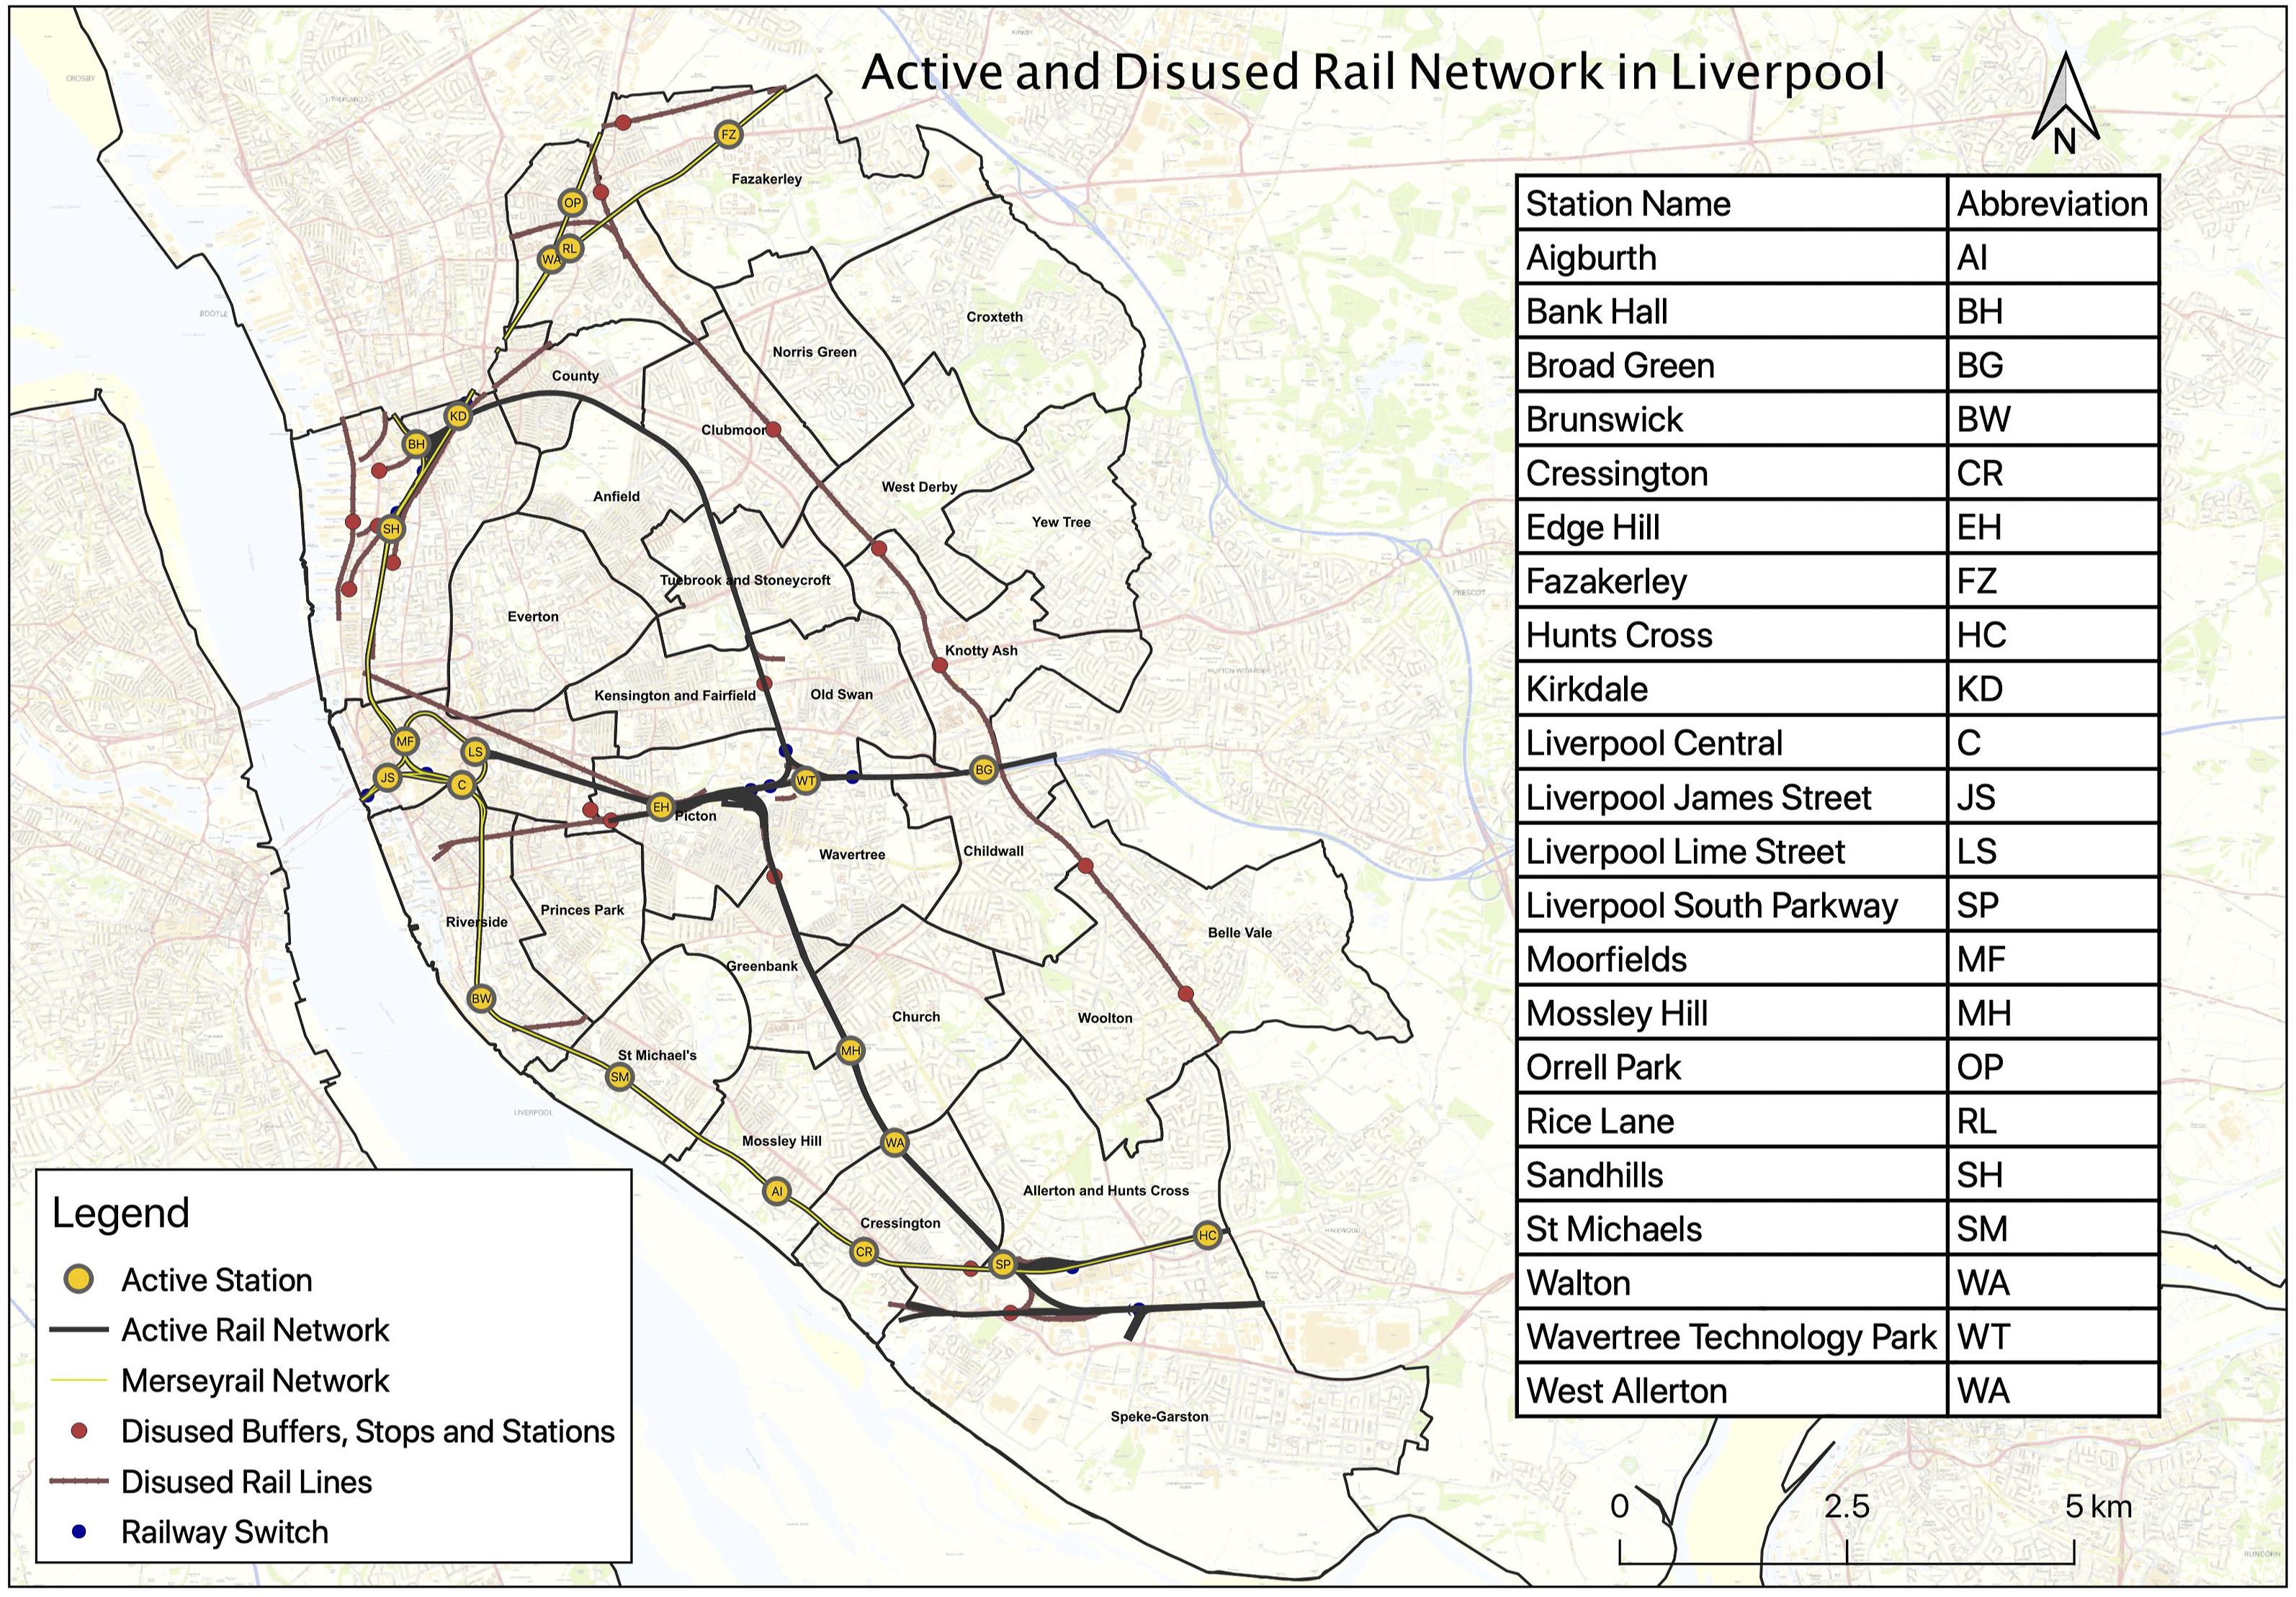
The Merseyrail system is a heavy-rail network that operates both underground and overground services. The system is fully electrified and operates as a separate network from national rail lines with three main services, which include the Northern Line, the Wirral Line and the City Line, that connect nearby towns such as Kirkby, Birkenhead and Maghull, all of which journey towards Liverpool city centre. Over 100,000 passengers travel on Merseyrail each week on a network that totals over 120 km with 68 stations. Merseyrail, who are currently owned by the Serco-Abellio group, recorded the most punctual services of any UK rail operator in 2019 at around 94% (Merseyrail, 2020). The Metro Mayor of the LCR, Steve Rotheram, has made his intention to move the transport body, or as much as possible, back into some form of public ownership. The Merseyrail network will remain a focused priority for policymakers and local actors for the foreseeable future; therefore, it is essential we begin to unpack the impact of this infrastructure on the residents of Liverpool.
The Merseyrail network demonstrates a unique infrastructural heritage, high frequency and efficient services. This part of the city region remains an understudied and underexplored case study and the aim of this work was to use open-sourced data from national bodies including the Office for National Statistics (ONS), to examine the effects of urban mobility. Specifically, this work has sought to examine the impact of a rail network on job accessibility in the city of Liverpool, with a specific focus on the Merseyrail service. This is achieved through a ward-level analysis of rail commuting habits, social indicators and economic trends in order to evaluate how access to the rail network reflects economic engagement and opportunity.
The approach
By drawing on secondary sourced quantitative data published in the 2011 decennial census, and also using the Travel Time API (TravelTime, 2021), a locational analysis is performed on quantitative data to generate an exploratory data analysis of mobility and socioeconomic participation in the city of Liverpool. Census data published by the Office for National Statistics were identified for the purpose in covering a large spatial scale and with a highly accurate count of the Liverpool City Region (Clifford et al., 2016). While census data is published by Office for National Statistics, the files were download from the Nomis data repository, while spatial boundary outlines of Liverpool and its statistical wards were retrieved in shapefile format from the UK Data Service, and information on the rail line infrastructure was sourced from Ordnance Survey.
The most recently available quantitative datasets chosen for the research involved economic activity and rail transit habits from the 2011 decennial census. These datasets articulate a wide array of statistics on social, demographic and economic indicators for residents across Liverpool. Method of travel to work identified the residents who commute by train and was compared against the distance travelled to work to identify patterns of train use against the distance covered. Economic activity datasets contain statistics on economic engagement and poverty on a ward level to compare with employment and social welfare. The research process operates at the scale which best reflects the local policymaking process in Liverpool, and statistical ward-level data was chosen as it aligns with the political units of local authority jurisdiction and councillor representation throughout the city.
Census data was analysed through a series of graphical and spatial activities. Residents commuting by train are presented as the independent variable and metrics such as distance travelled, employment and welfare recipients as the dependent variables. Graphical charts offered a simple and appropriate mode of exploratory data visualisation as they are clear in how they display univariate and bivariate information (Martin, 2020). The spatial analysis in this paper has been generated through the open-sourced mapping software QGIS (version 3.22) and RStudio (version 2023.06.0). Performing a locational analysis is suitable for examining travel behaviours and socioeconomic conditions across spatial territories in Liverpool.
The Travel Time API is a user application developed by the TravelTime group (TravelTime, 2021). It has been used here to address urban mobility and accessibility in Liverpool in this research, but the platform is typically focused on commercial industry to document sales territories and identify potential catchment areas. In this example, the Travel Time API was used in the spatial analysis to identify and analyse journeys on the rail system based on time of travel, rather than distance. The platform was used to generate a series of isochrone maps which illustrate spatial catchment zones and possible travel journeys, proving useful in illustrating the accessible spaces when journeying from the city centre of Liverpool using the rail network. This method was based on the isochrone maps generated by Crisp et al. (2018) showing public transit options at peak commuting hours across Manchester. Parameters of the function included departing from the city centre by train at 8:00 a.m. on the 30th of January 2022, and it was executed for fifteen-minute intervals for up to an hour of travel.
As findings show, the isochrone maps returned several polygon layers which were larger in size as the travel time increased and included the time it would take to walk from the train station. Results were overlaid onto a map of Liverpool to show which areas provide access to the city centre at a traditional commuting time when using the rail network. Following this, rail journeys from the city centre to the mean centre of each statistical ward were performed. This used information on maximum rail network speeds, ticket prices and overall quickest route of travel through Liverpool to calculate the most efficient possible journey between the two points (An et al., 2019). This was performed on 26 out of the 30 wards, with the four exceptions including Everton, Princess Park, Riverside and Central as these areas are equal distance from the city centre and the nearest rail station. The output displayed the quickest route to the nearest train station and the rail journey from this station to the city centre as a total journey for each ward in Liverpool. This is an example of the strength of this research method as the QGIS mapping software generated a multivariate analysis of multiple data sources (Martin, 2020).
Initial results
The rail network and mobility
The method of travel dataset was examined to identify the choices in commuting to work (Nomis, 2011a). A modal share was generated to identify the proportion of residents using each transport method and is shown in Figure 3. Train use range is between 1.3% and 10.9% across all wards in Liverpool and is the fourth most chosen transport method behind private car, bus and walking, most likely attributed to the higher carrying capacity of these modes in their current form. There are eight wards with 8% or more residents using the rail network and six wards with less than 2%. This indicates that the rail network is a preferred method of travel for areas such as Warbreck, St Michael’s and Cressington but not in West Derby, Norris Green and Tuebrook and Stoneycroft. Figure 3 shows that the wards with higher train use, such as Central, Fazakerly and Riverside, have a lower proportion of bus users. Method of travel for commuting to work in Liverpool.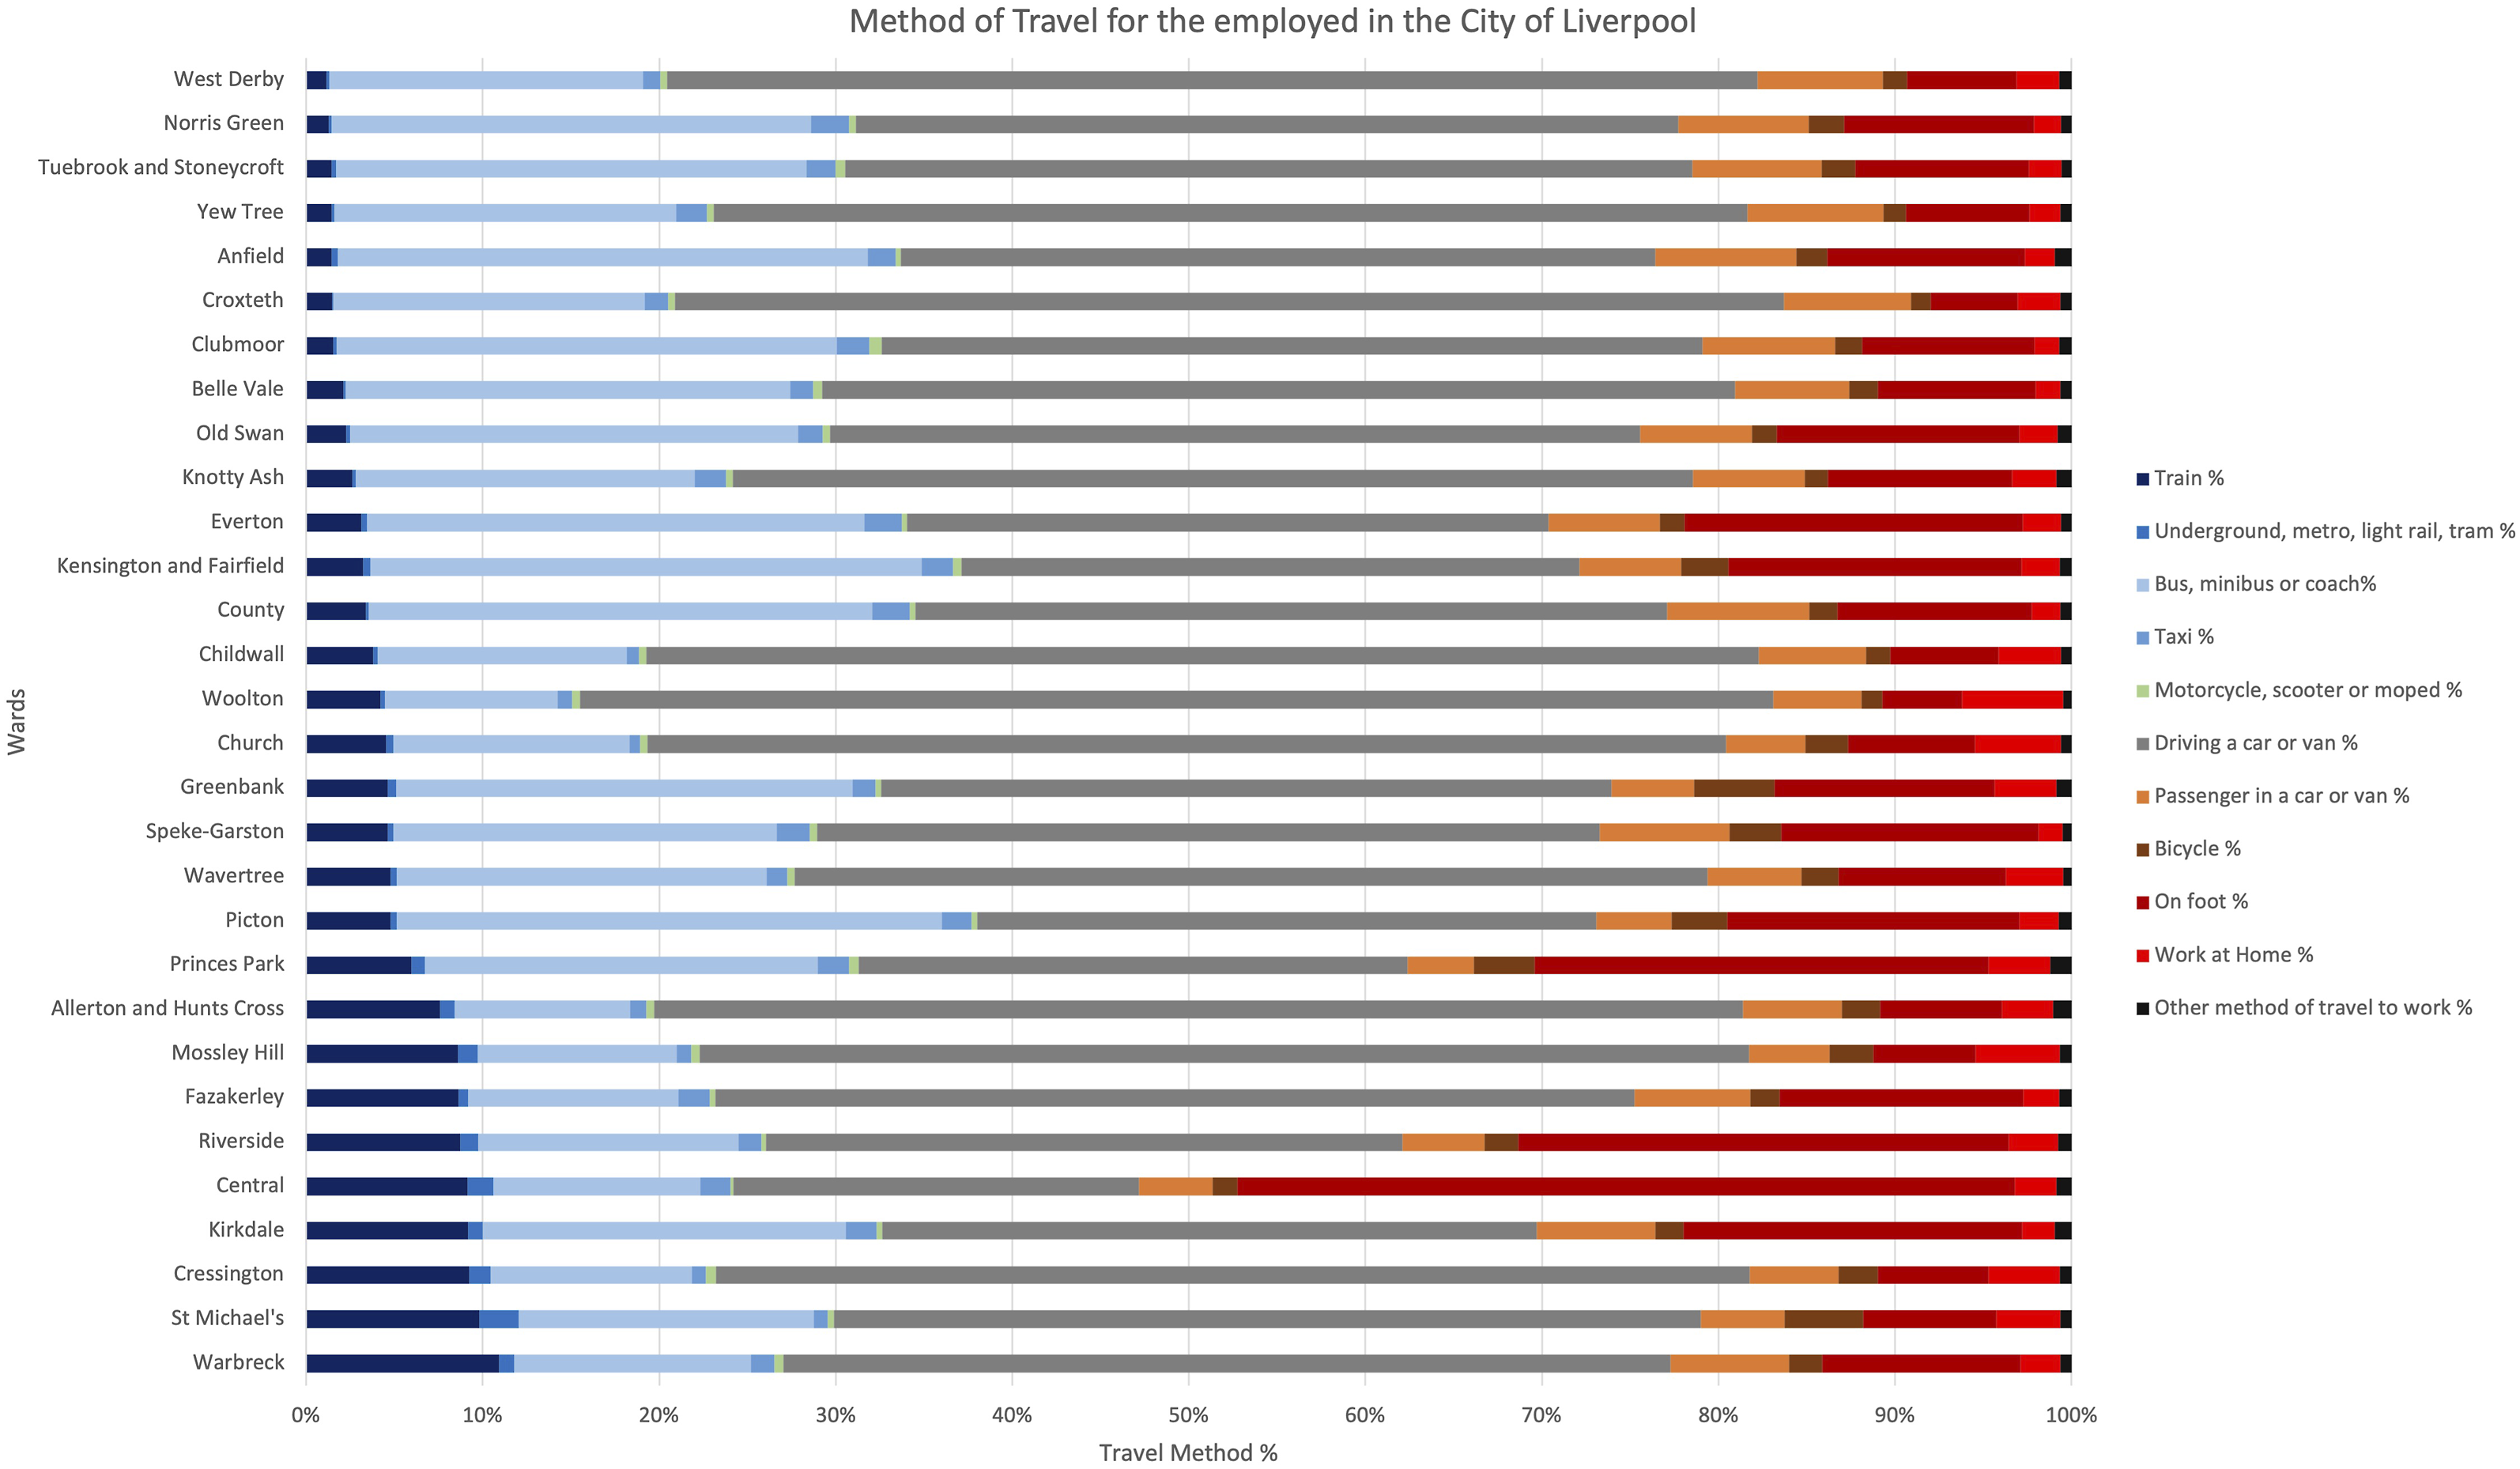
Data on train travel users was isolated and positioned against the distance travelled to work dataset (see Figure 4) to investigate the relationship between the use of the rail network and the distance travelled to work (Nomis, 2011a, 2011b). A trendline was included for the distance travelled to show the general pattern of the wards. Wards such as Warbreck, Riverside and St Michael’s show high rail use while Norris Green, West Derby and Anfield represent the lowest number of residents using the rail network. The inclusion of the trendline shows that the typical distance travelled is generally further amongst the wards with higher rail use. The wards with over 500 rail users have a lowest distance travelled of 12.5 km and a highest distance travelled of 17.2 km. However, the wards with under 200 rail commuters show the lowest commuting distance of 11 km and a highest of 13.8 km. This data poses the idea that wards with higher number of rails users also may see their residents travelling further to the place of work. Number of residents using the train and average distance travelled.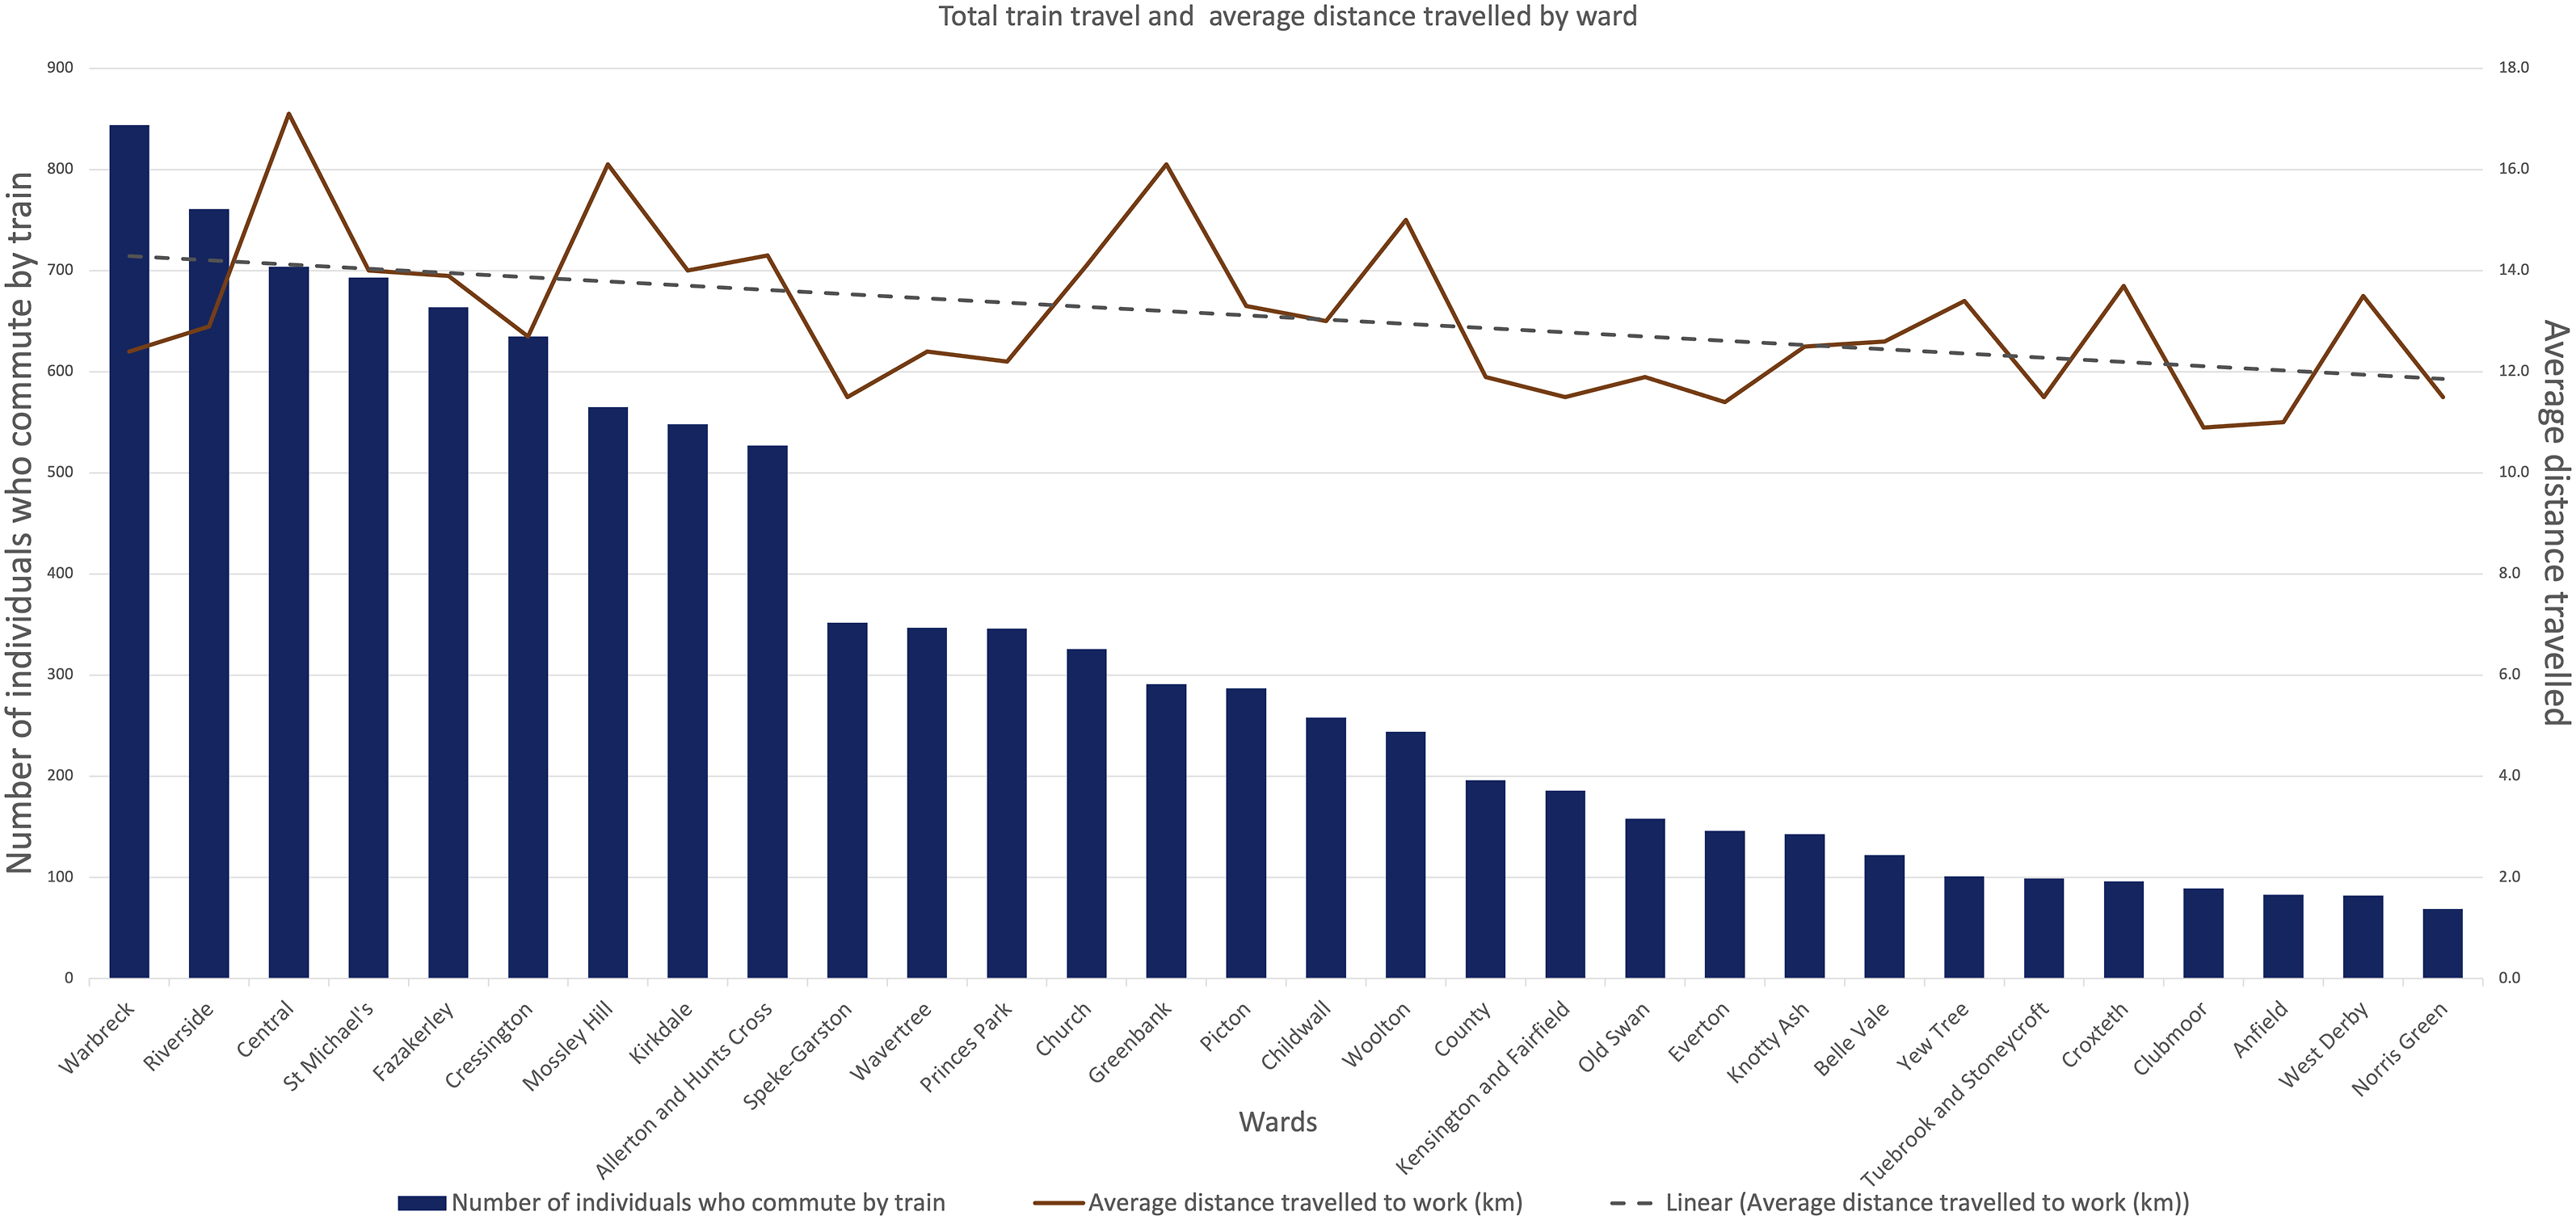
The first step of the spatial analysis was to identify the rail network in Liverpool, including active and inactive stations and rail lines, buffers, switches and the Merseyrail network (see Figure 2 earlier). The rail infrastructure data was added to the choropleth map in Figure 5 to show the proportion of residents who travel to work using the train. The choropleth mapping technique is useful here as it shades and colours the wards of Liverpool based on the proportion of residents who are choosing to use the rail network for their daily commute, with the rail infrastructure data included to provide further spatial context. Warbreck, Kirkdale, Central, St Michael’s and Cressington show the highest train use with over 9% of residents commuting by rail. There are 15 wards which contain or border a train station and 13 of these have over 4% of their residents using the rail service. The Merseyrail service operates in 10 wards and all of these spaces have over 6% of the residents commuting by train. Proportion of residents commuting by train.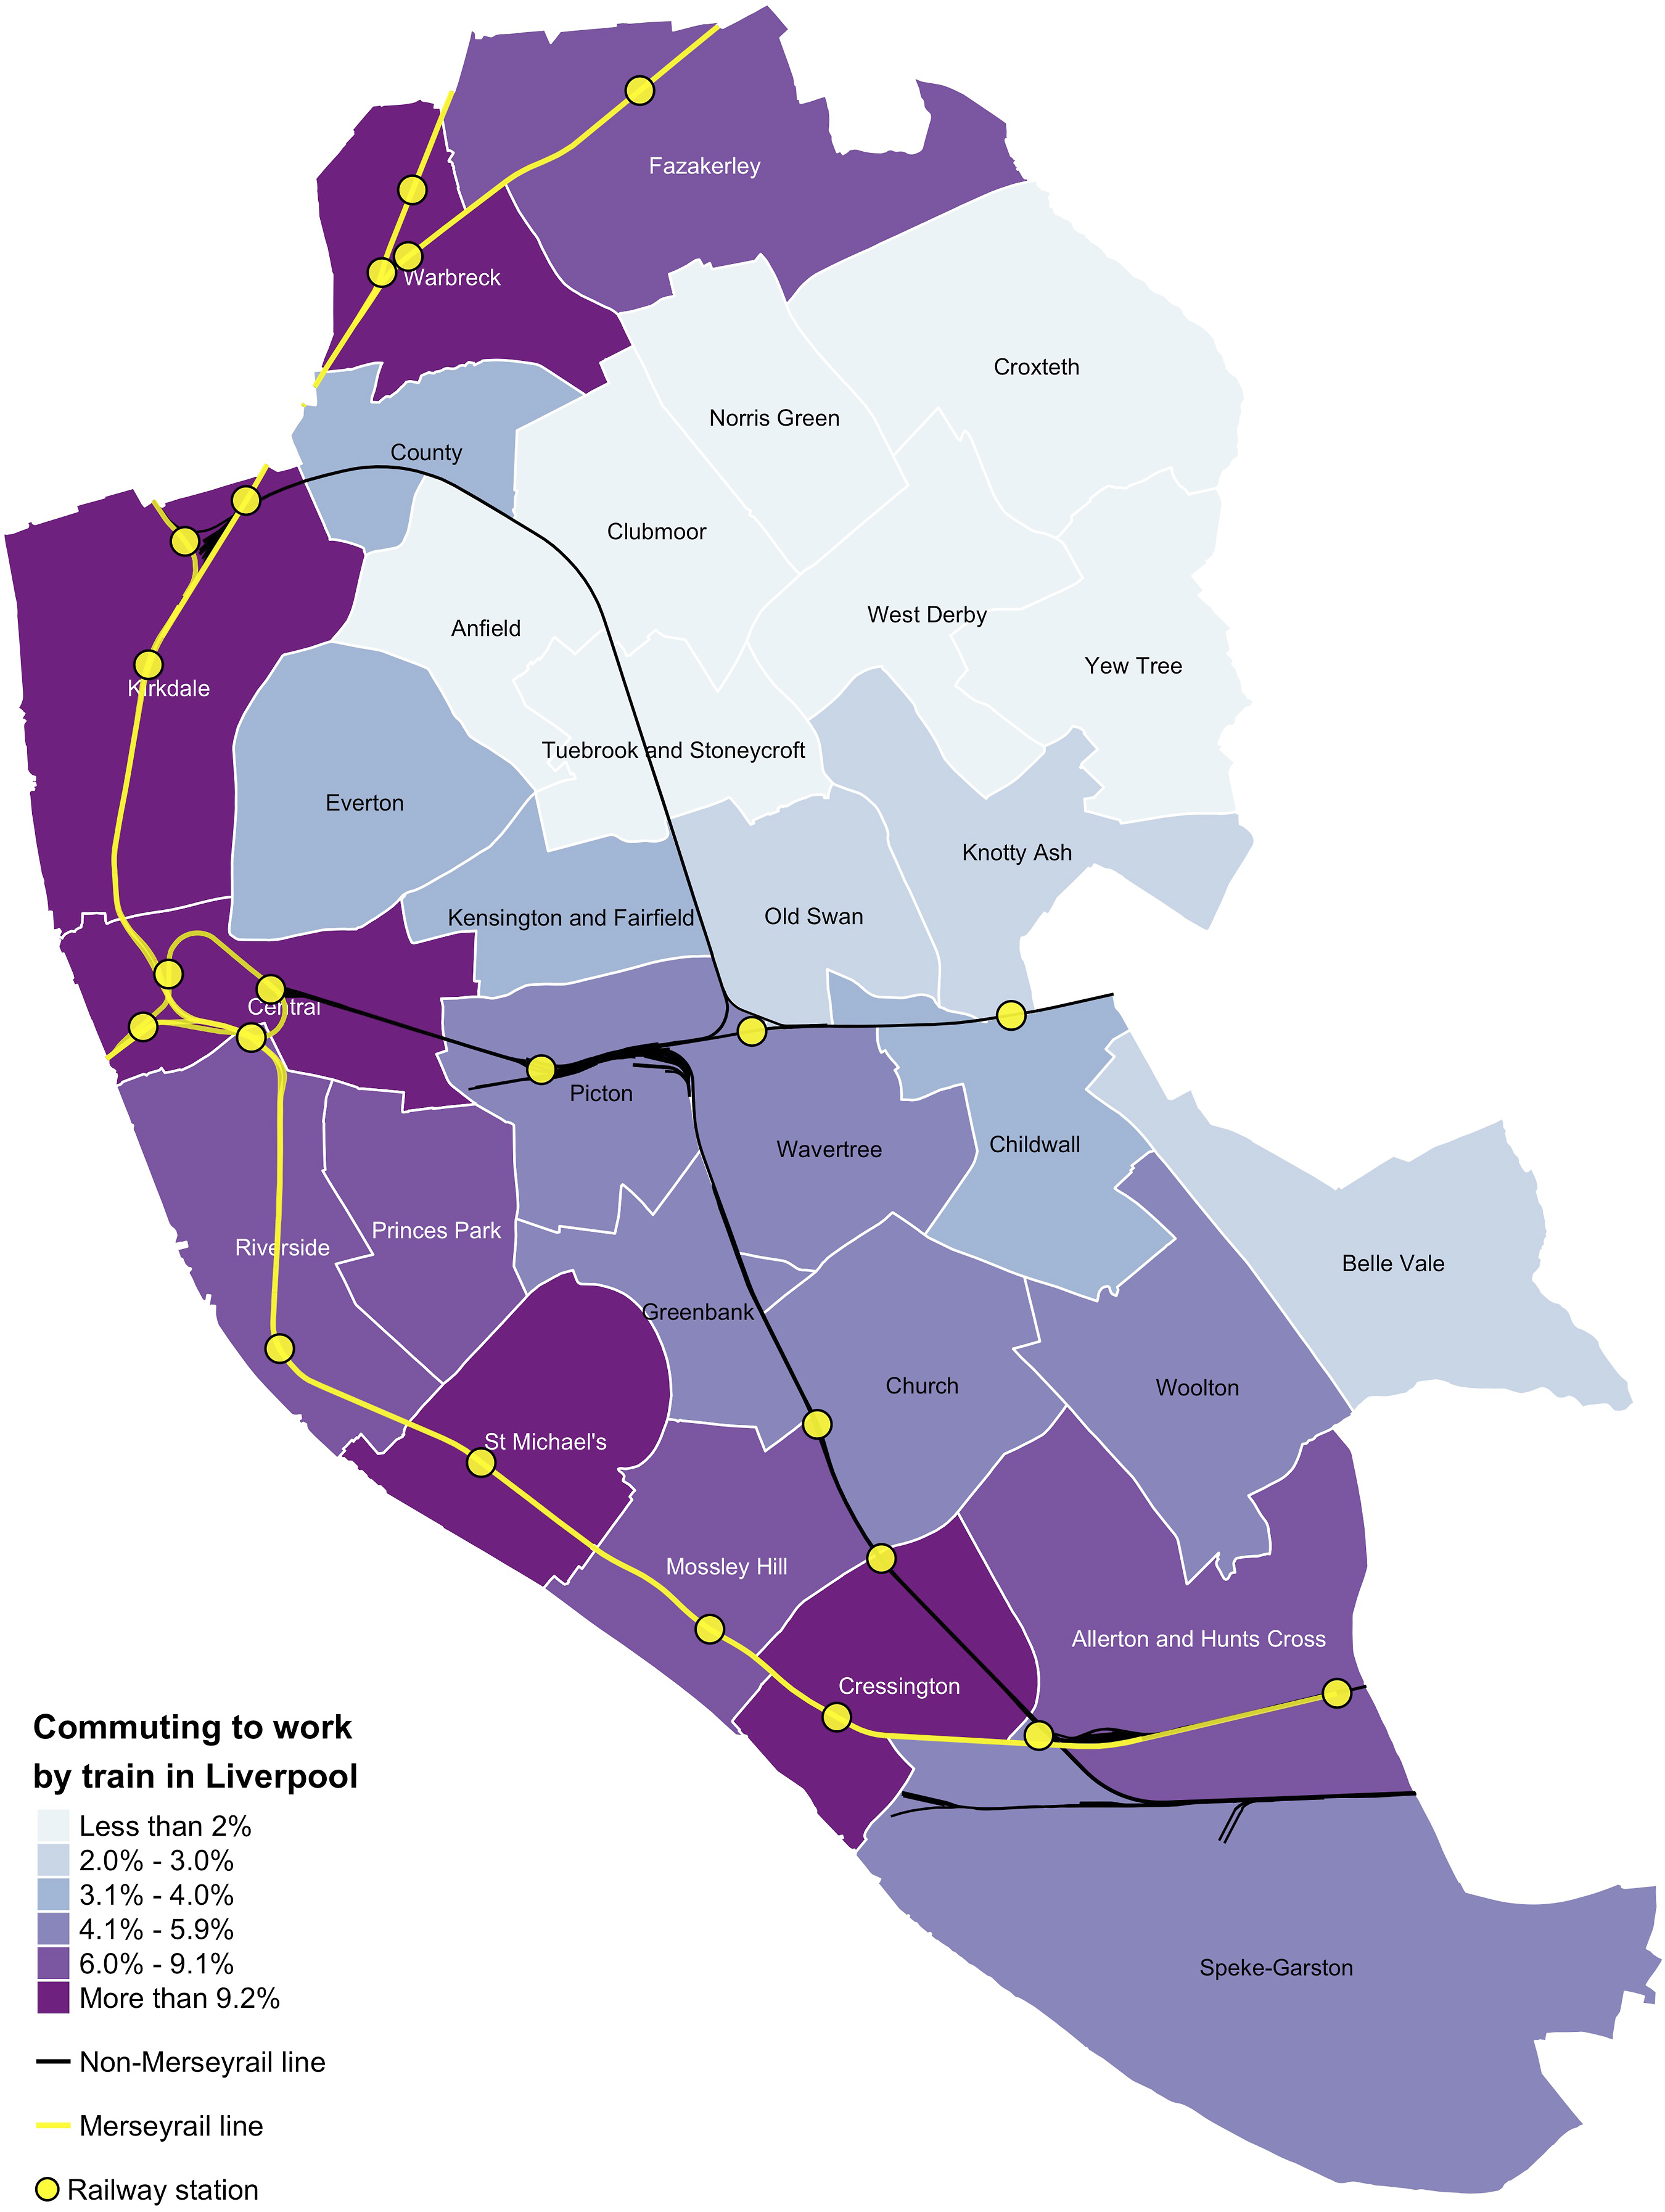
Rail proximity
Proximity to the rail network is shown in Figure 6. The map illustrates active train stations with a series of buffers distanced at a five-, ten- and fifteen-minute walking distance, to examine the rail accessibility of wards by showing the relative distance to nearby train stations (Boisjoly and El-Geneidy, 2017). Wards with the highest rail accessibility include Cressington, Mossley Hill, Central, Kirkdale and Warbeck. There are nine wards which are unable to reach a train station in less than 15 min of walking, including an area in north Liverpool that stretches throughout highly deprived spaces of Everton, Norris Green and Croxteth. That Merseyrail stations are situated closer together than other passenger rail services in Liverpool suggests that the Merseyrail network is a more accessible service. Access to rail stations in Liverpool.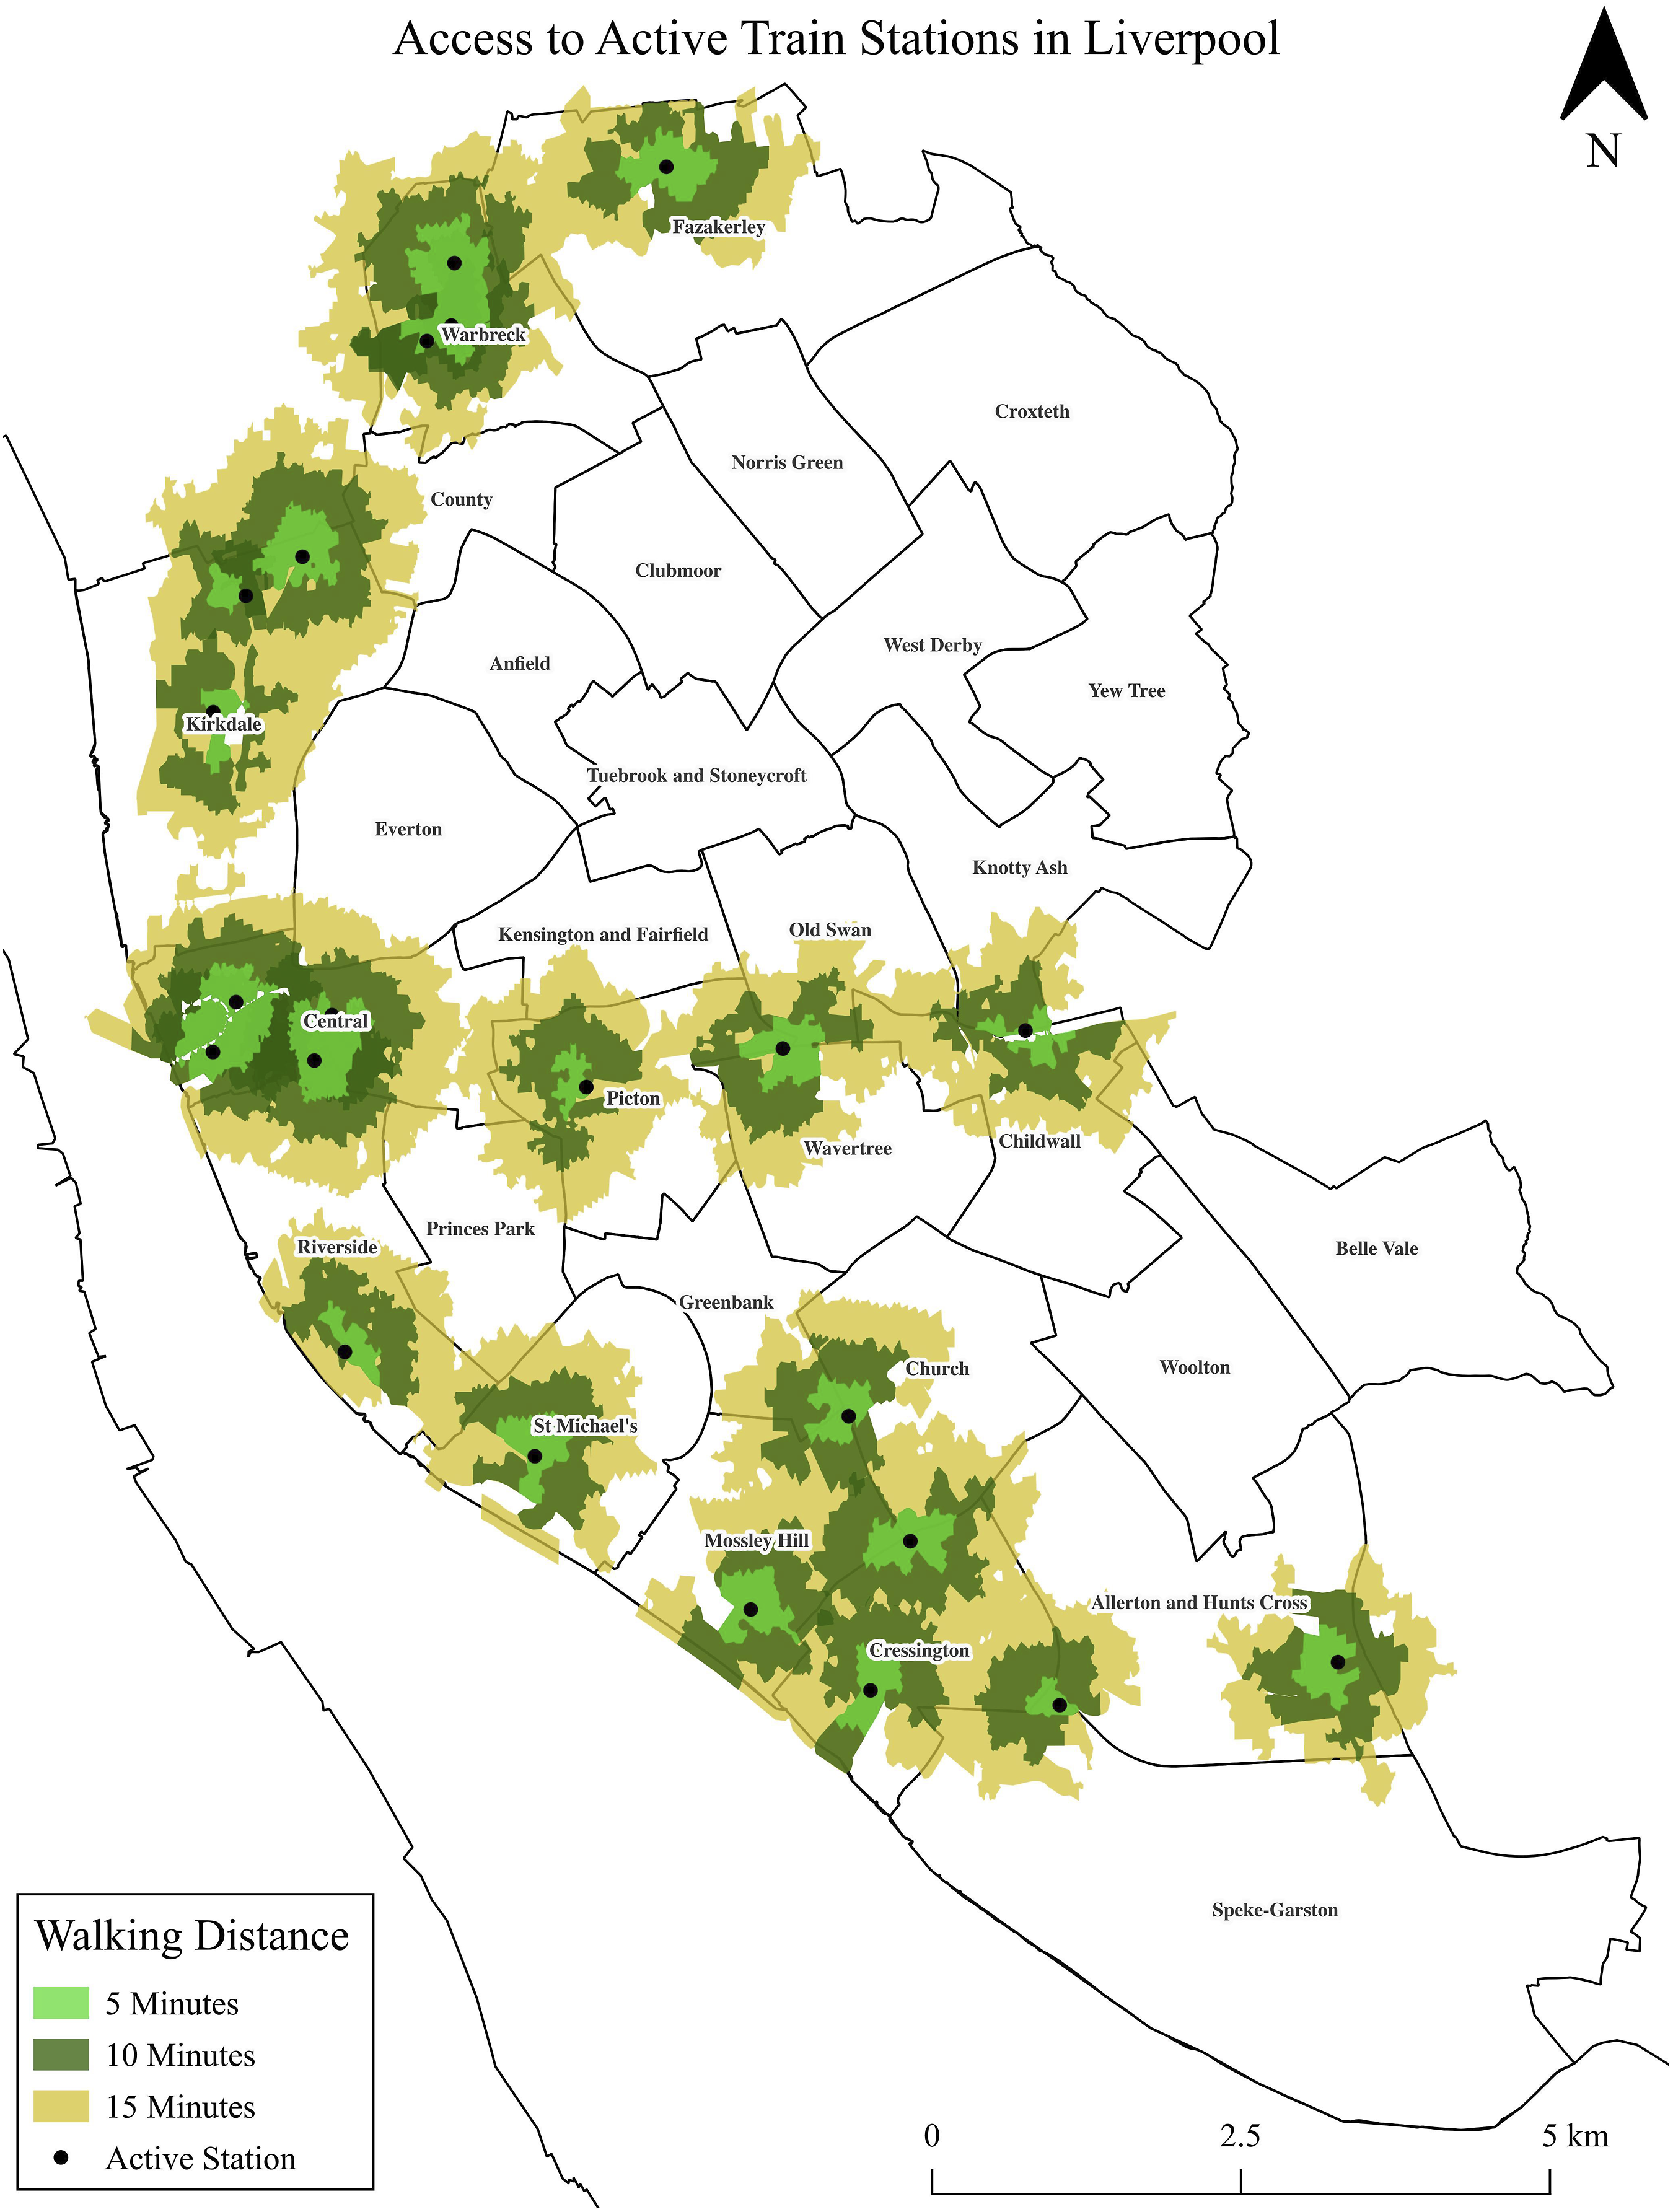
The results of the Travel Time API function are explored in Figures 7 and 8. A series of isochrone polygon layers indicate the journey time to the city centre when using the rail network at 8 a.m. on a weekday, with the walking journey to the train station included in the timeframe and the city centre as the focus. We can see in Figure 7 how the rail network enables mobility across Liverpool. Wards situated at a greater distance can access the city centre in a smaller timescale than areas of close proximity because of the rail network. For example, it is possible to journey from Allerton and Hunts Cross in 30 min as it has access to two rail stations, whereas Anfield does not contain a rail station, resulting in a train journey lasting around 60 min. Journeying time to the city centre of Liverpool. Rail journeys from the centroid of each ward to the city centre of Liverpool.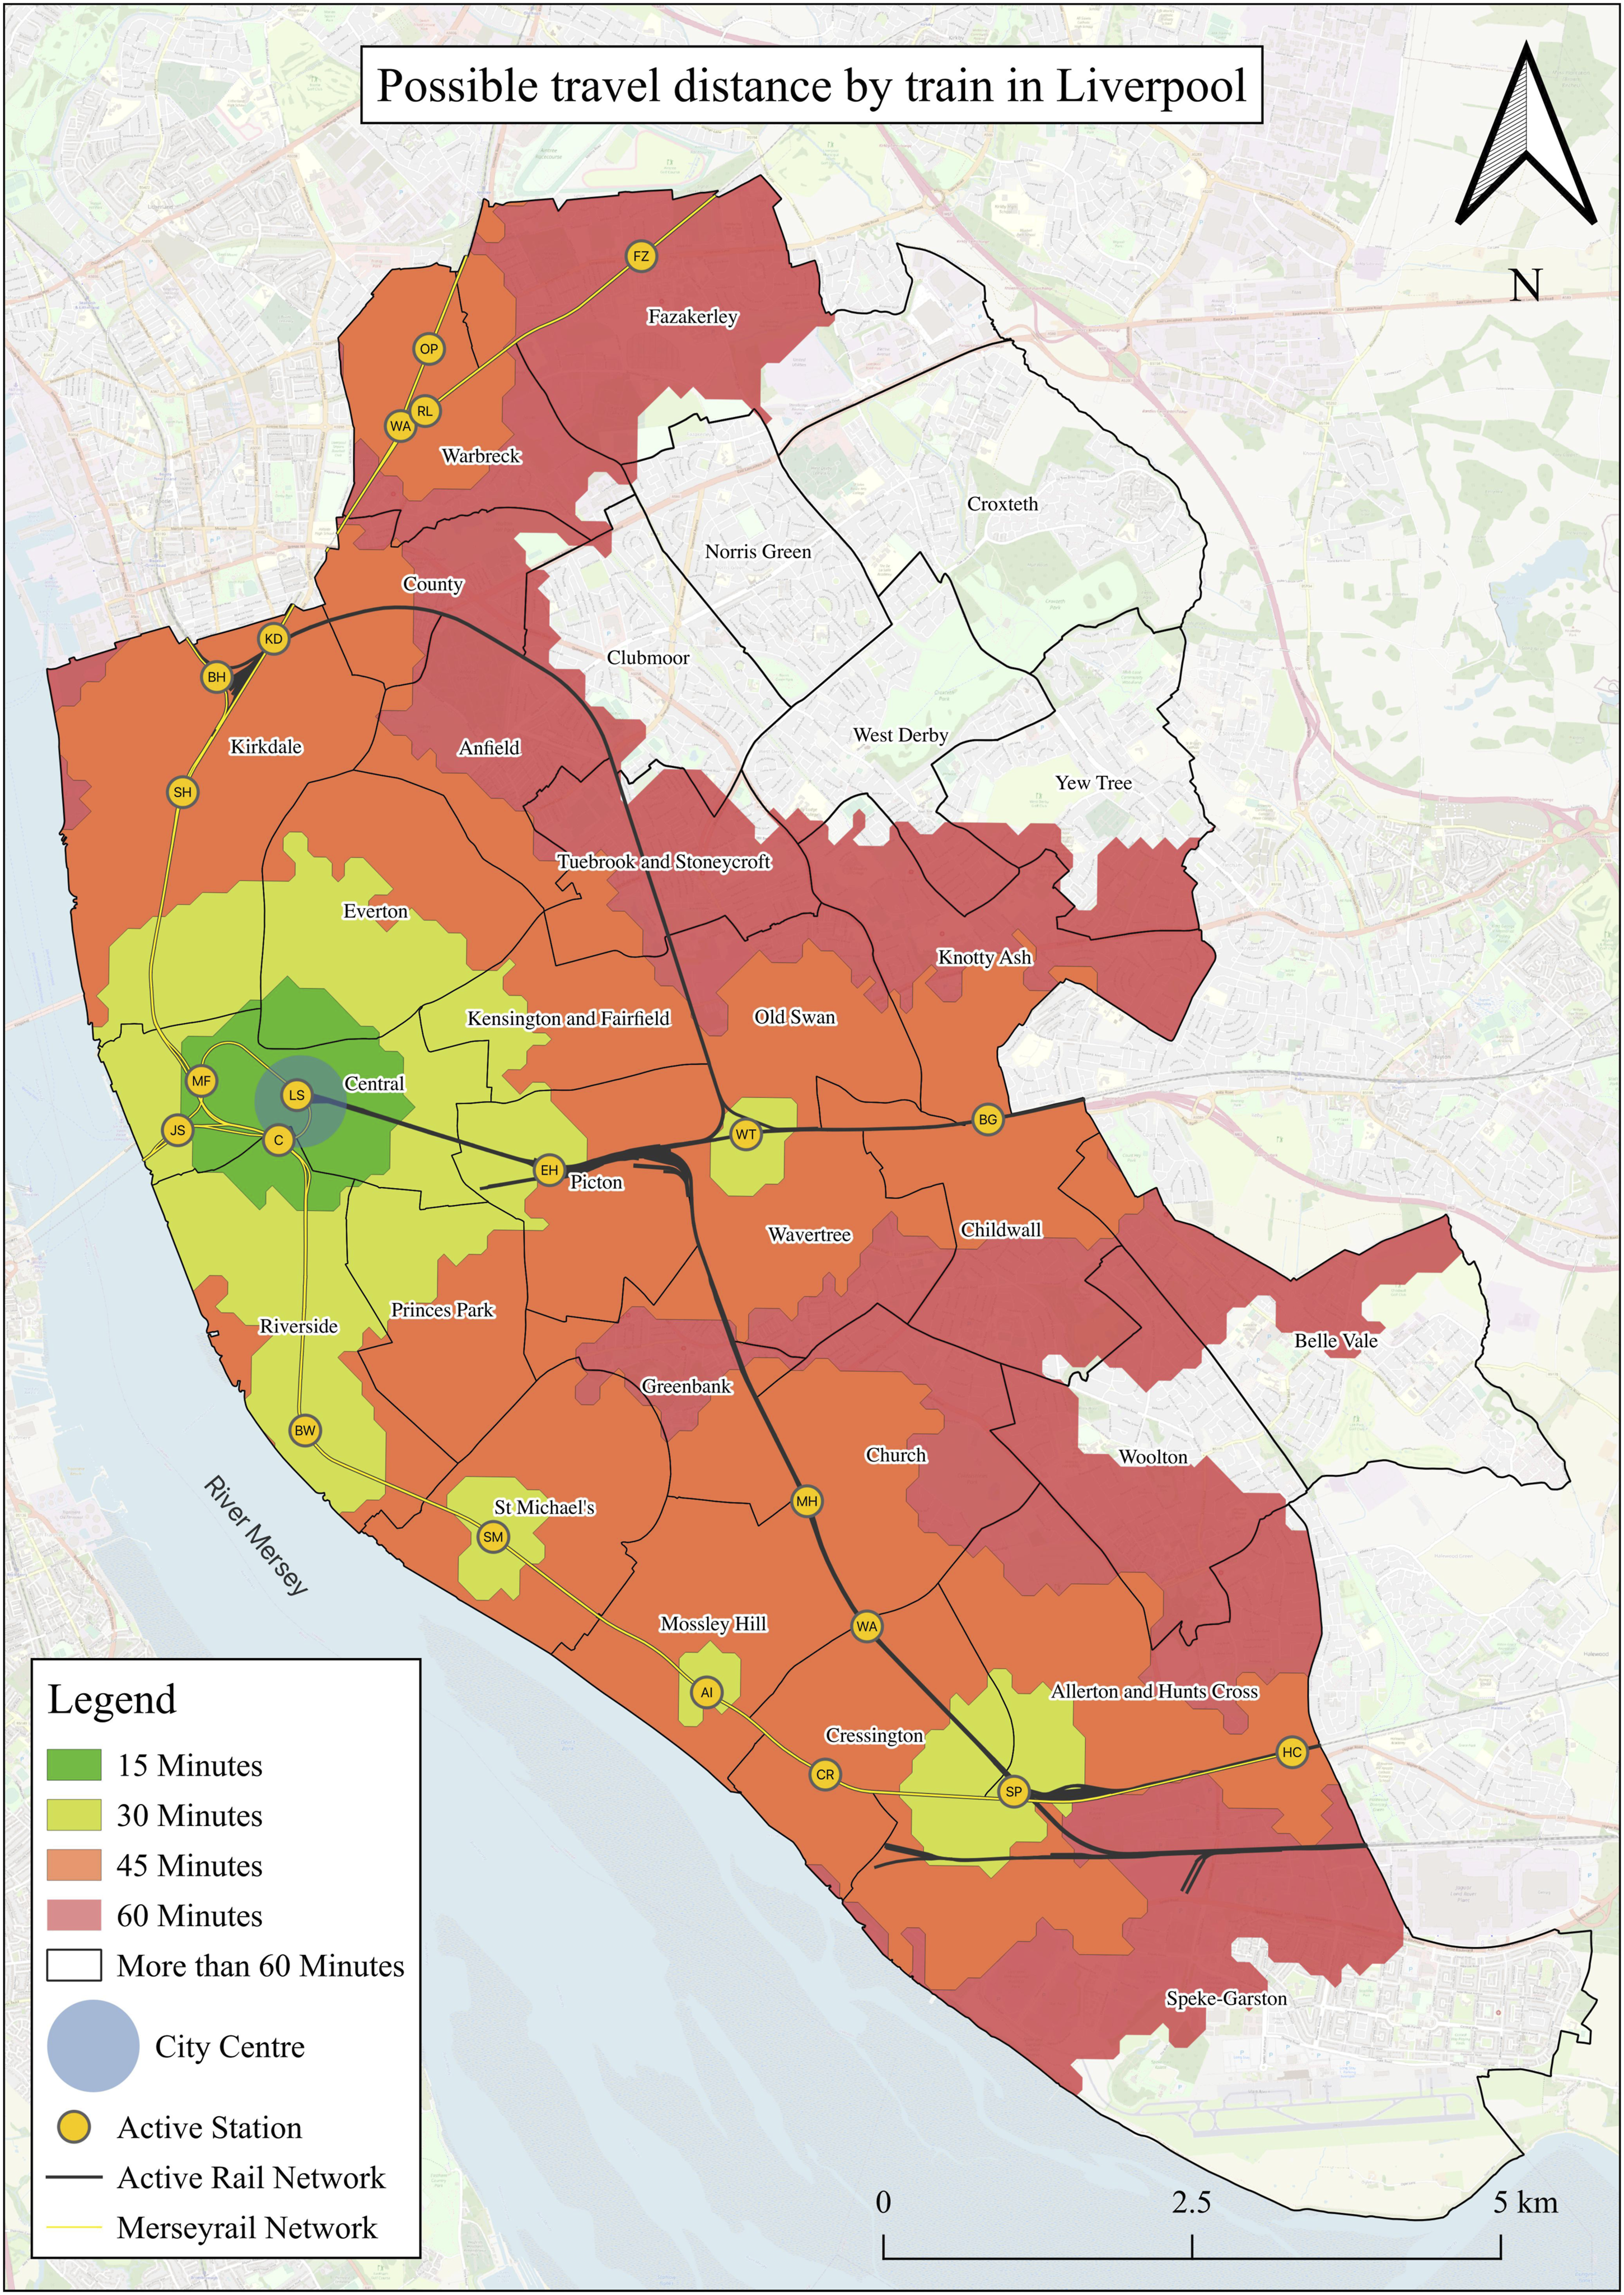
Areas which host a rail station, such as St Michael’s, Mossley Hill, Cressington and Warbreck, are able to access the city centre in less than 45 min, with the walking journey to the station included. The wards without a rail station within 15 min or less walking distance (Figure 6), including Norris Green, Croxteth and Belle Vale, are likely to take around 60 min or more. Figure 7 also demonstrates that the speed and directness of the rail network impacts wider accessibility. An individual situated around Liverpool South Parkway can access the city centre in less than 30 min as this train station is served by two rail lines which most likely travel at differing speeds and journey to different stations in the city centre.
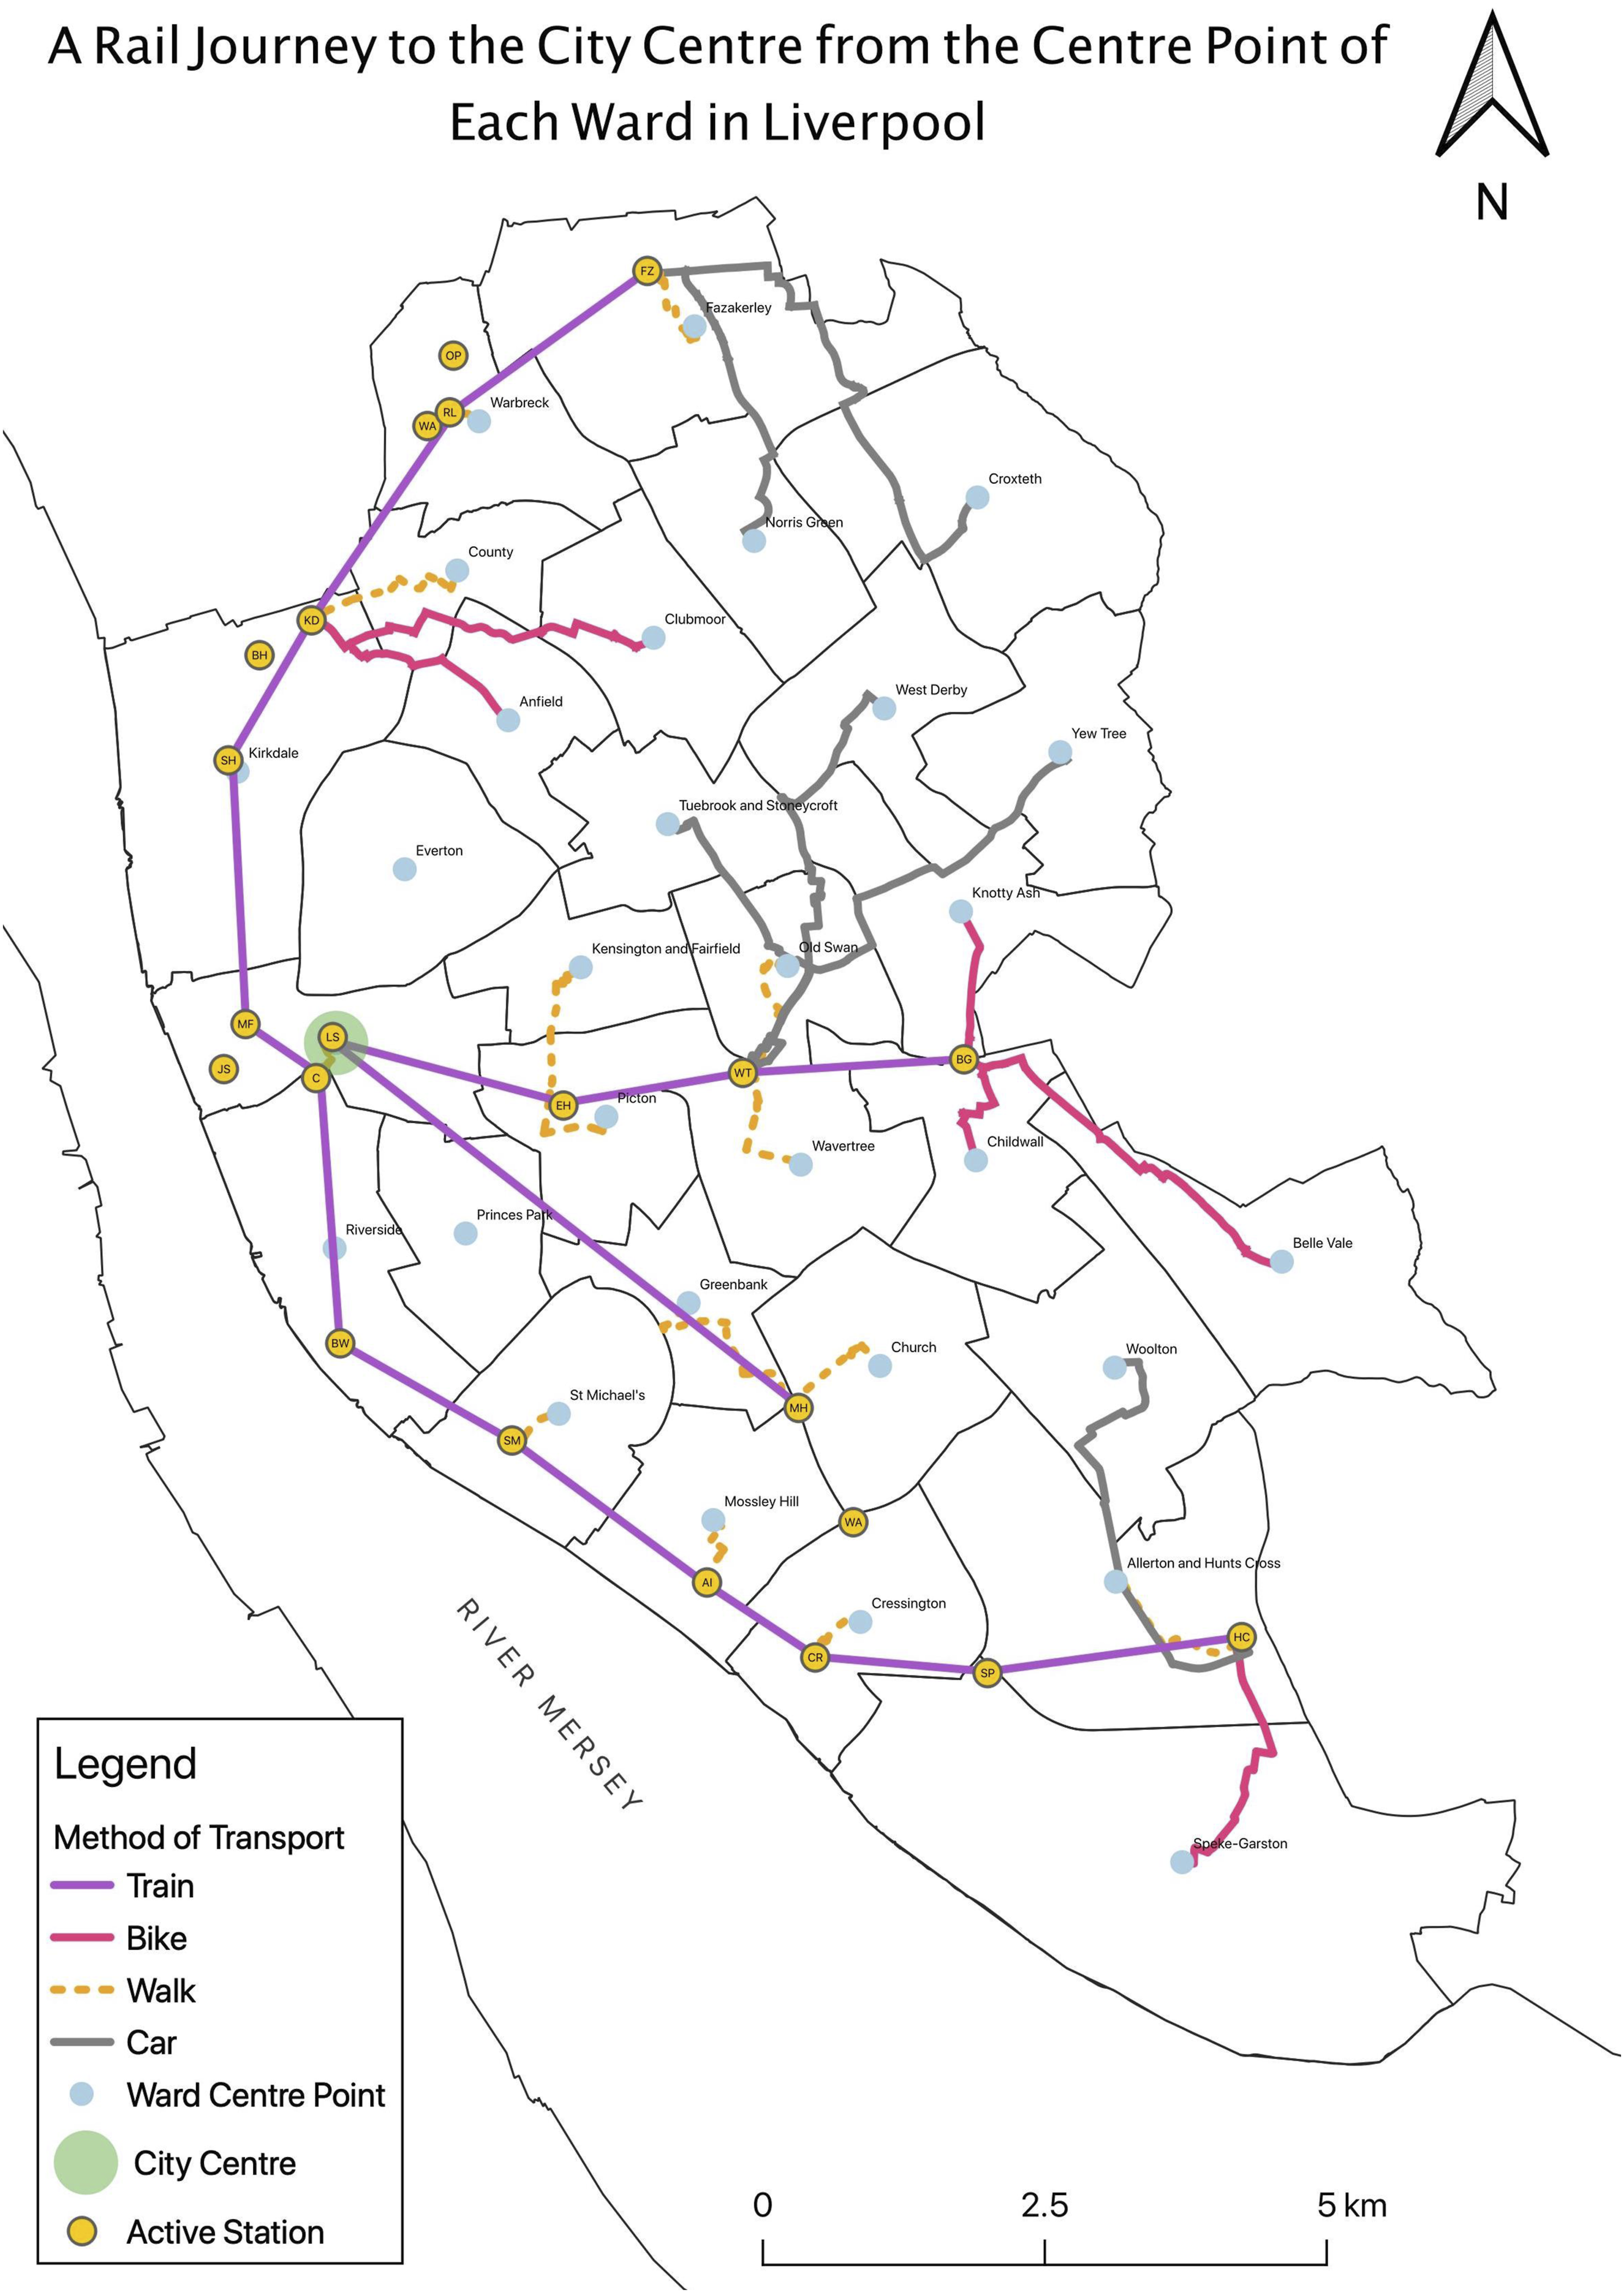
To examine this further, the most efficient journey of each ward to the city centre when using the rail network is detailed in Figure 8. The city centre was chosen as the destination for each possible journey as it is a central focus in the LCR economic strategy with popular retail, cultural, tourist and business districts. The output demonstrates the most practical route from the centre point of each ward with Everton, Central, Princess Park and Riverside excluded (see Figure 8). The calculation is influenced by the distance and transport method to the nearest train station and the rail service in operation. Figure 8 shows that individuals living in wards which host the Merseyrail network, such as Fazakarley, St Michaels and Cressington, can directly access the city centre through a journey which includes a short walk to a nearby station and direct rail transit. Similarly, residents in wards with other passenger rail services, including Picton, Childwall and Church, are able to transit across Liverpool following a short walk and a rail journey.
This contrasts sharply to the wards located at a distance from a rail station. Examples including Croxteth, Norris Green and Woolton require a car journey across ward boundaries in order to engage with the rail network. Furthermore, a number of rail stations are unable to facilitate car journeys. Broad Green, which is located between Knotty Ash and Childwall, does not offer designated car parking space which means individuals are unable to use a park-and-ride style system here (Northern Rail, 2022). Residents of Yew Tree or Belle Vale must find another method of commuting to Broad Green or use another rail station. Figure 8 suggests that the rail network can only facilitate mobility when an individual has high accessibility to the network.
Socioeconomic conditions
In Figure 9, the proportion of unemployed residents was added to the earlier map projecting the proportion of residents who commute by rail (Nomis 2011a, 2011c). Findings here show a corridor of wards from Central to Allerton and Hunts Cross are serviced by the Merseyrail network also demonstrate unemployment scores of 8% or less. There are 10 wards which host an active Merseyrail station and only two with an unemployment rate of over 10%. Of the 15 wards which host or border a train station, only three have an unemployment rate above 10% and one ward above 15%. Furthermore, the areas with the highest unemployment rate of 15% and above are Everton, Princess Park and Kensington and Fairfield. These spaces are equal distance from the city centre and the nearest train station. Unemployed residents and commuting by train.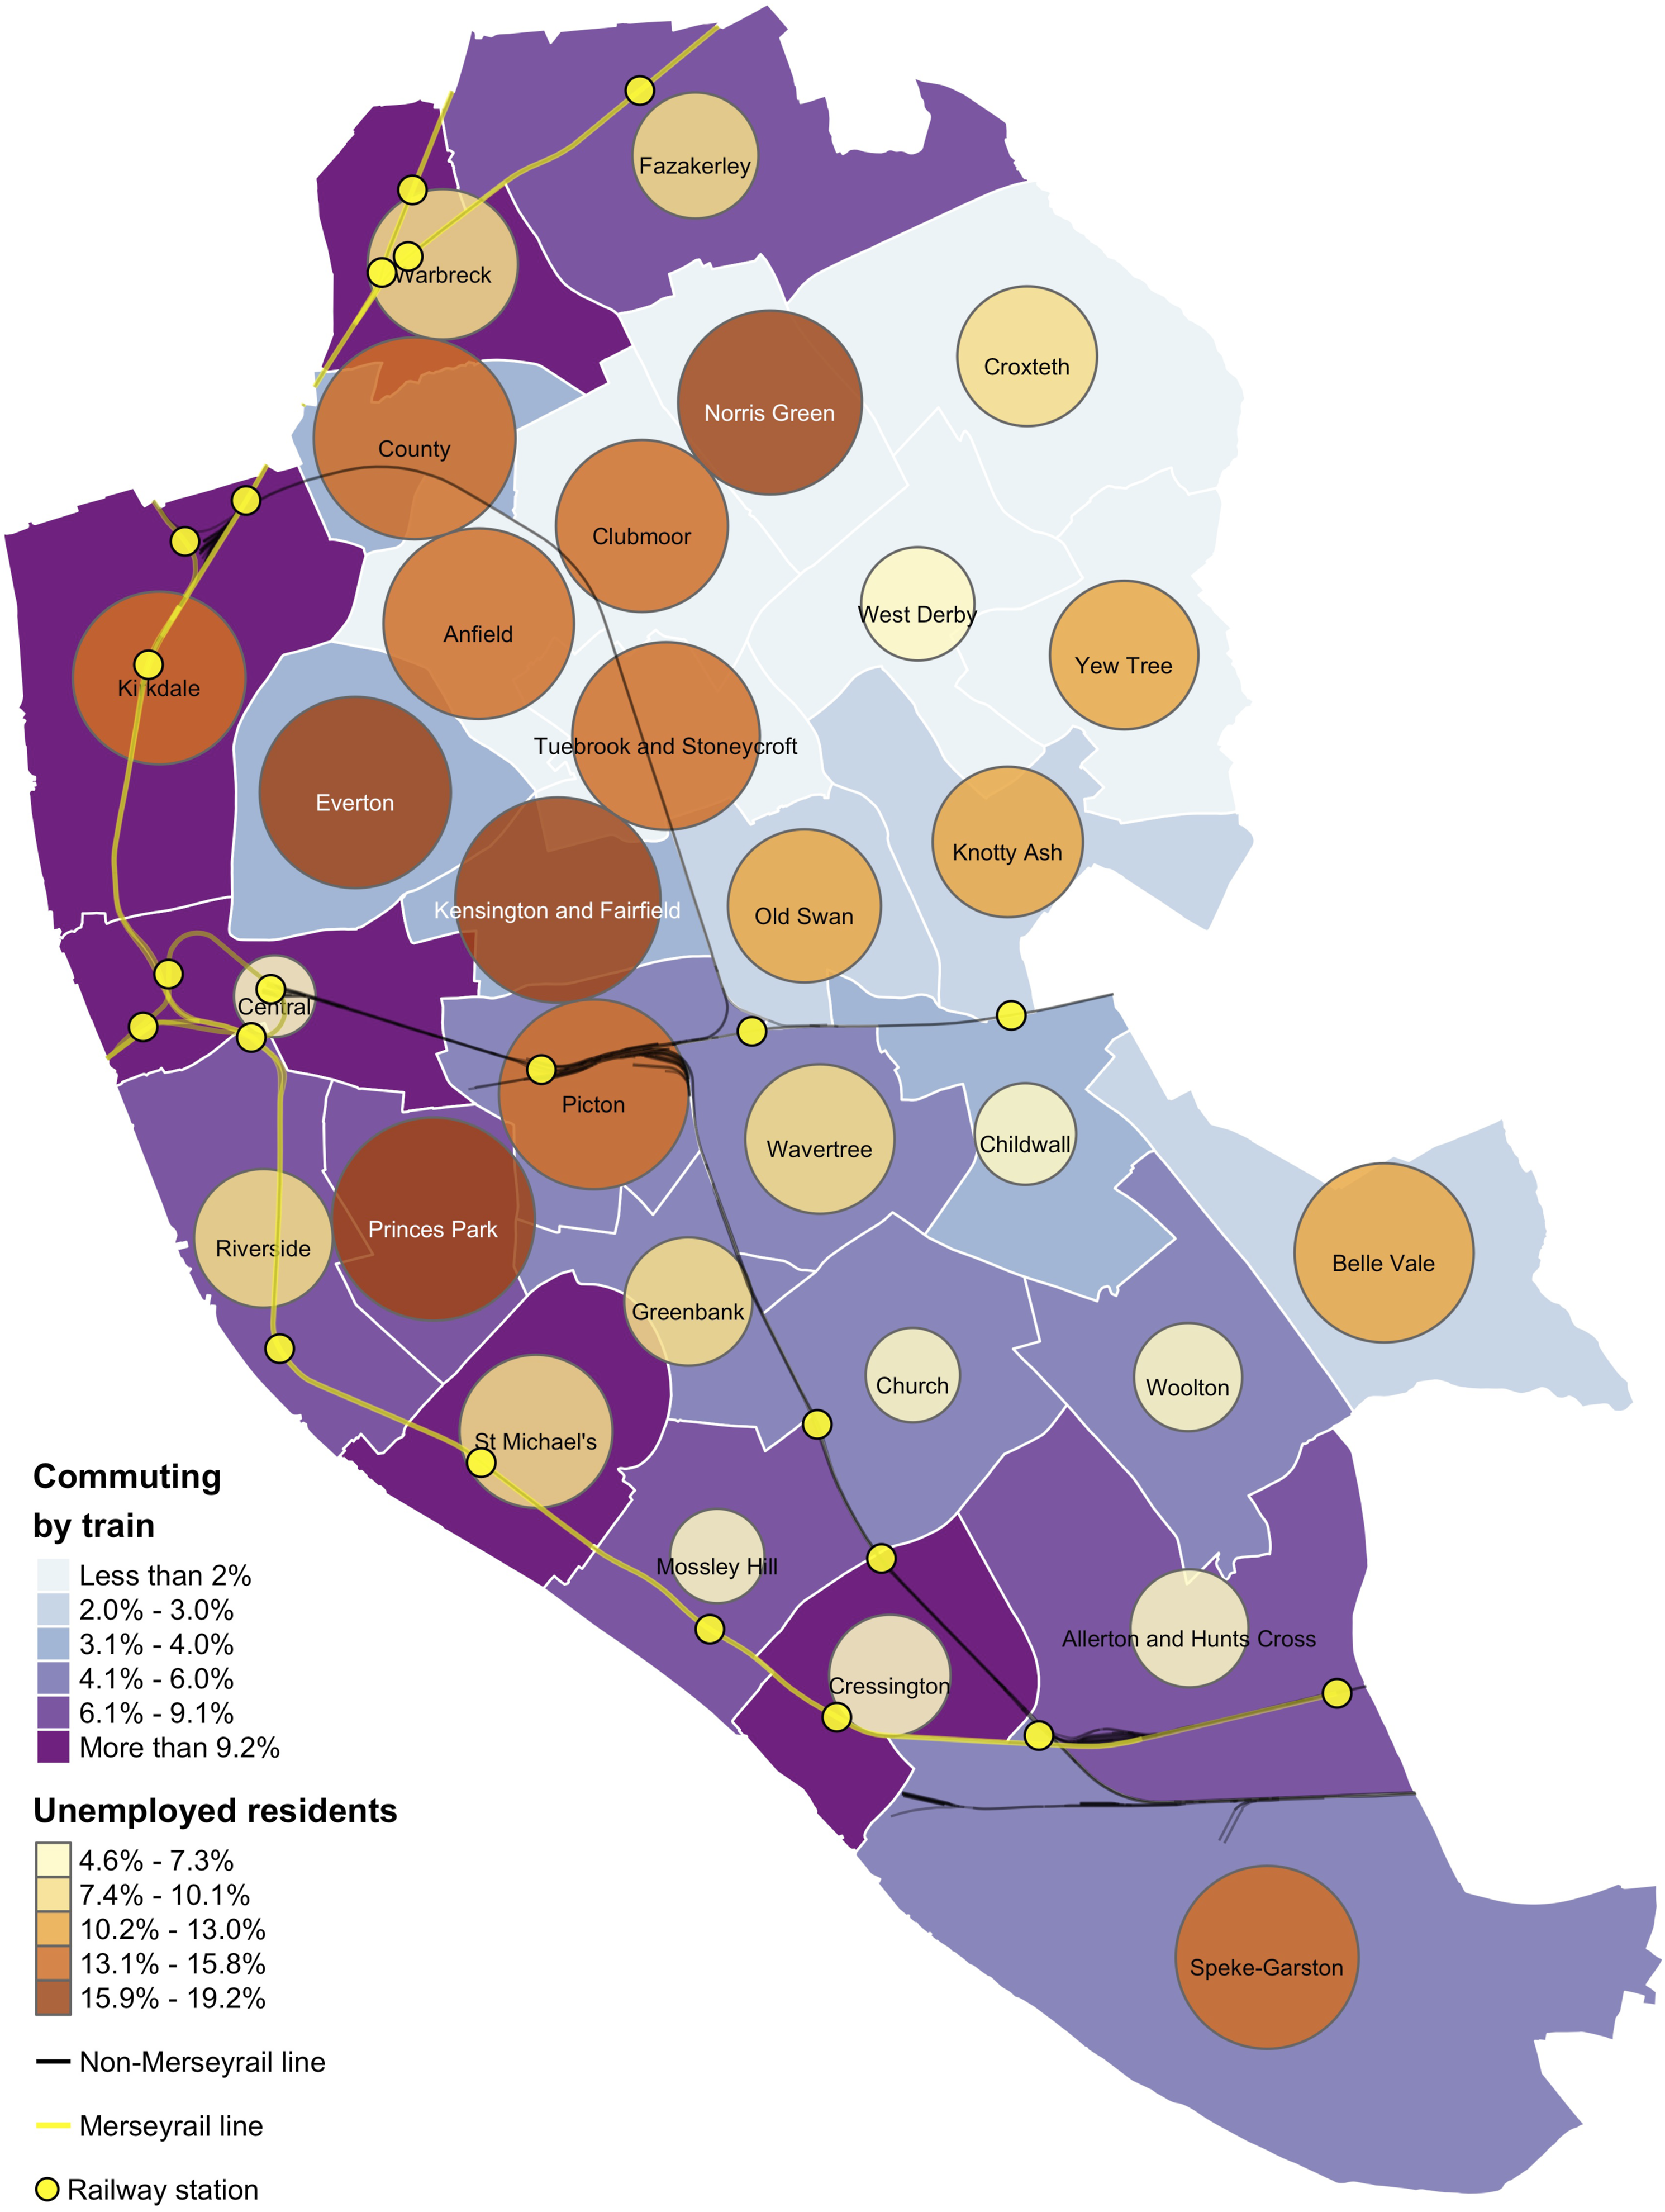
Figure 10 details the median proportion of monthly welfare claimants between 2011 and 2015 overlayed onto the rail commuting data (Nomis, 2011a, 2011d). While displaying similar patterns to Figure 8’s unemployment trends, the data show that areas with the lowest claimant counts are Mossley Hill, Church, Woolton, Childwall and West Derby, and three of these wards host a train station. The wards with the highest claimant counts are Princess Park and Kensington and Fairfield, both of which do not contain a train station. Although the exploratory analysis of Figures 8 and 9 do not define true causation here, it may be that we are seeing an association between rail use and economic activity. Welfare claimants and commuting by train.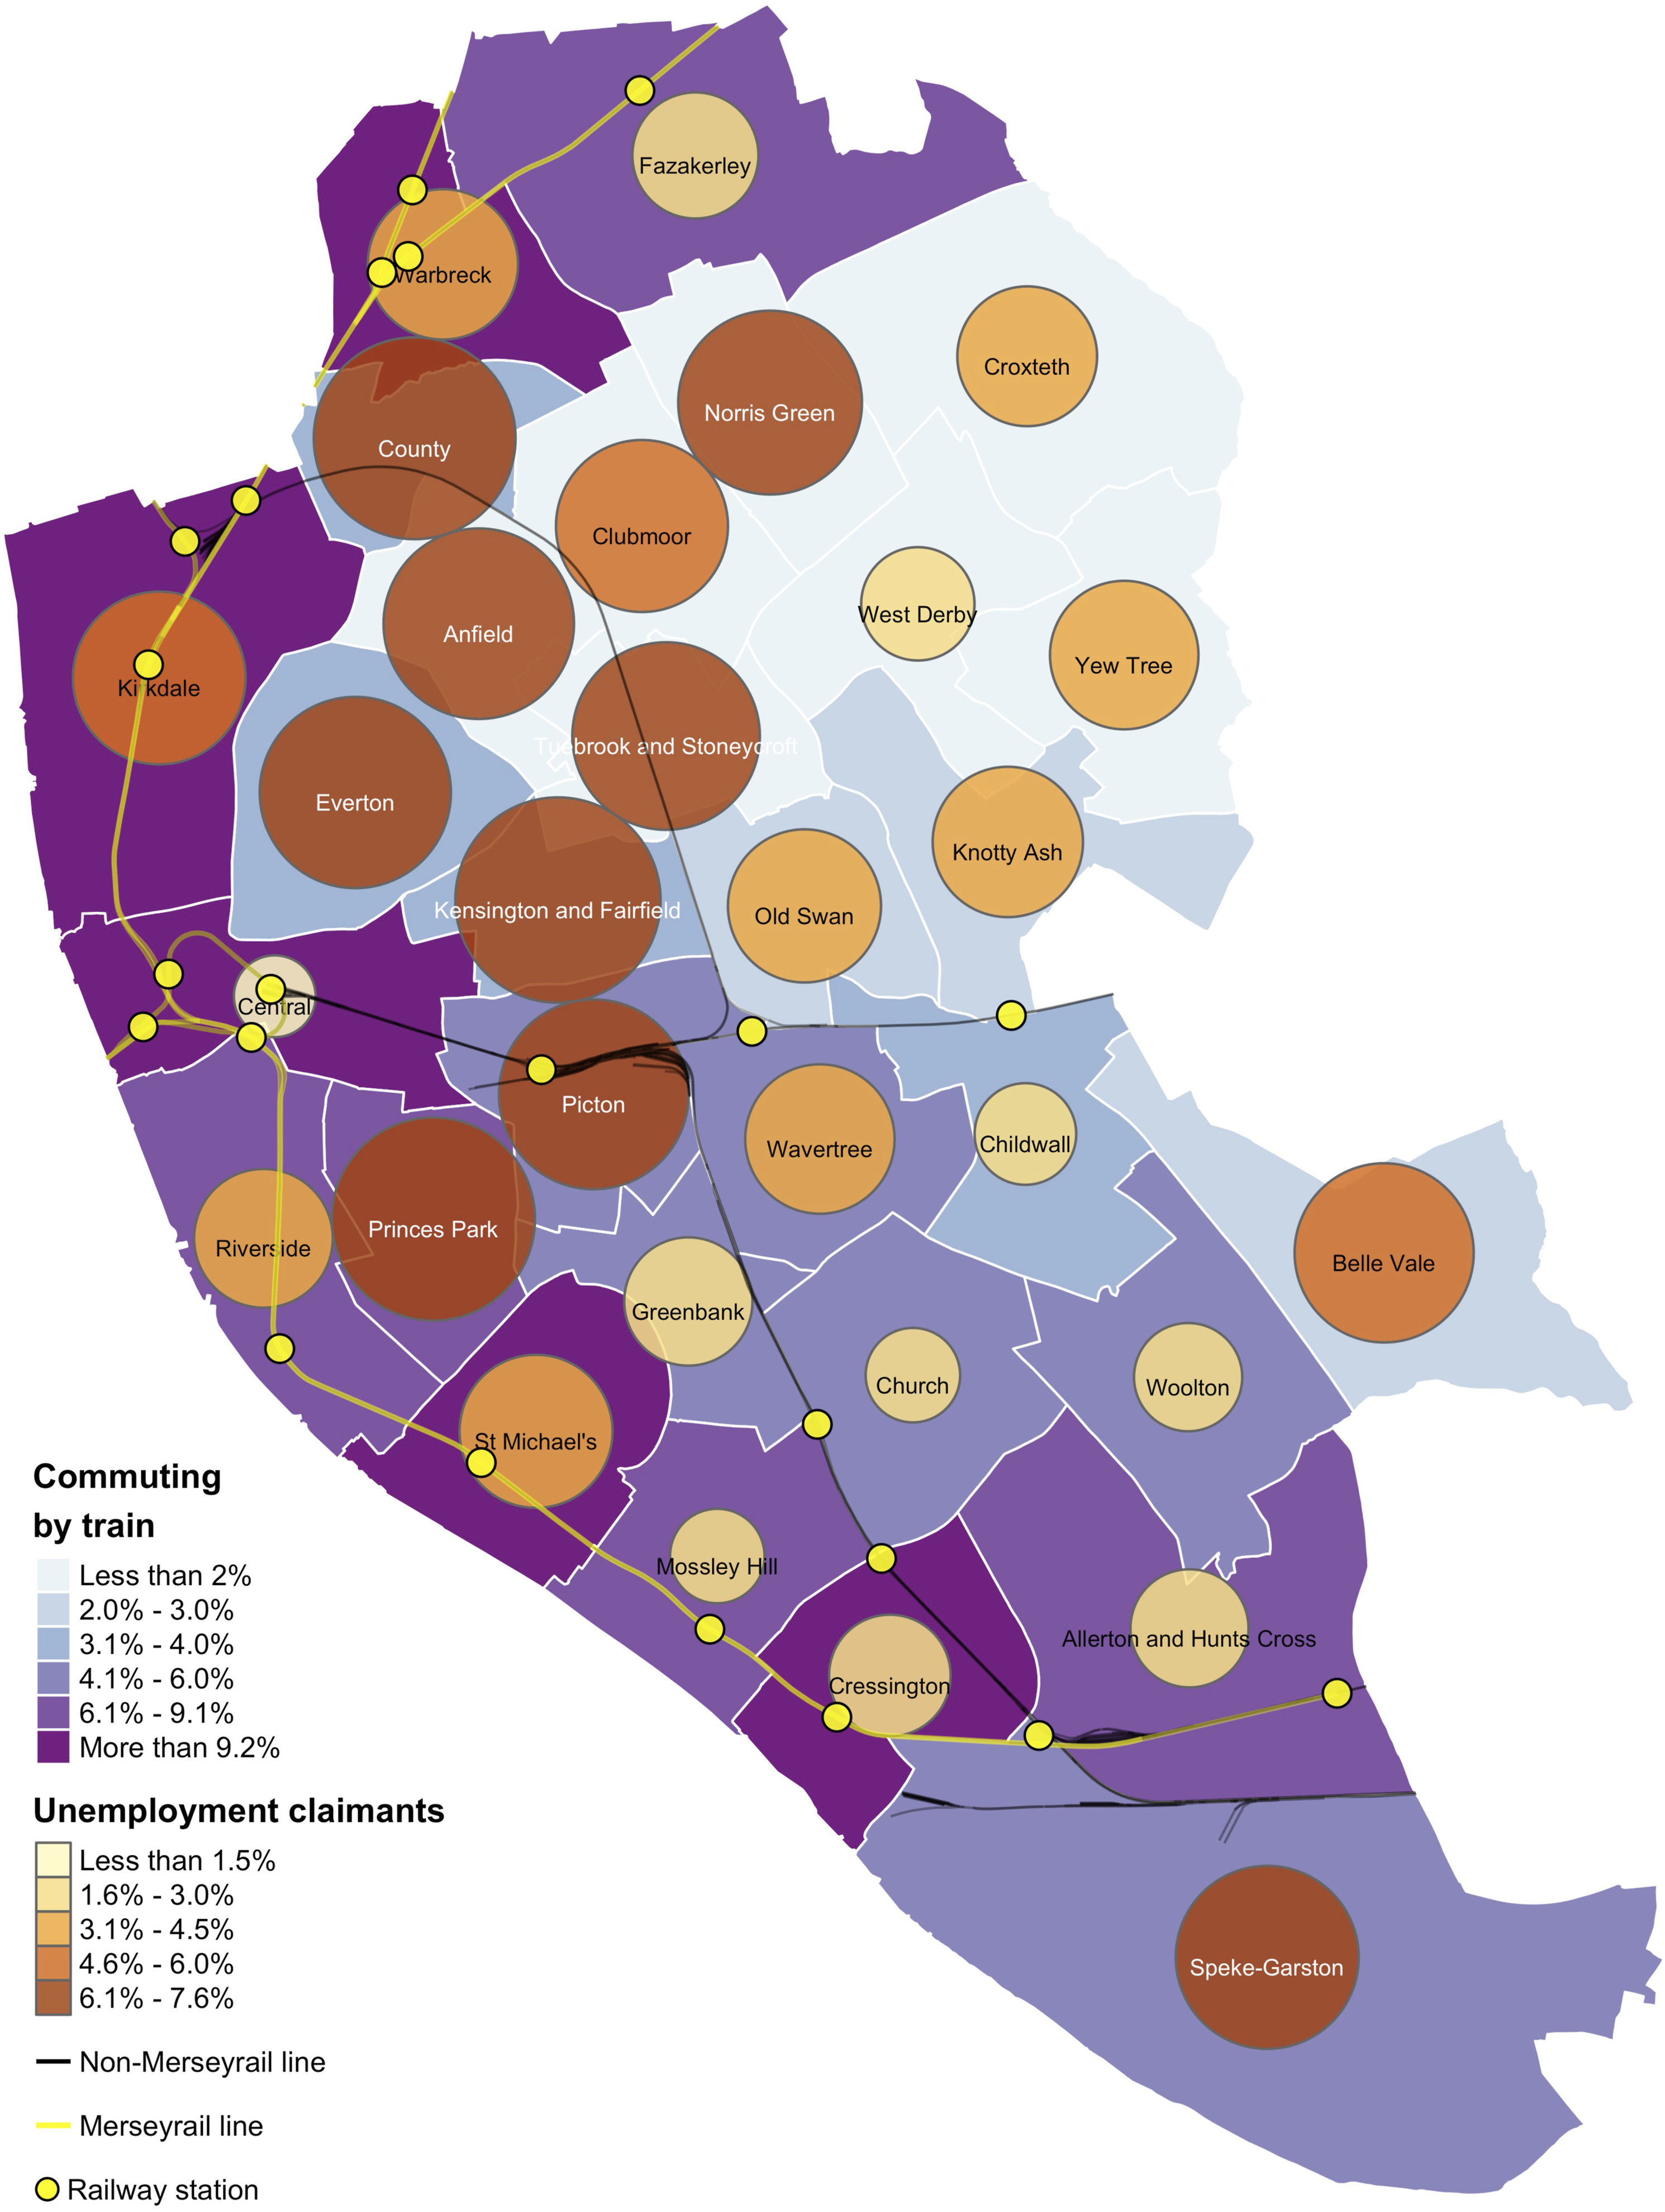
The highest level of qualifications dataset was examined as a method of investigating education across Liverpool (Nomis 2011e). Figure 11 is a density equalising cartogram, a mapping technique which resizes the wards of Liverpool in relation to each other based on the defined variable. Here, the wards of Liverpool are resized based on the proportion of residents without any qualification and those with Level 4 qualifications which allows for general comparison of where low- and high-skilled citizens are living. While the ‘no qualifications’ variable represents those without any formally recognised education, ‘Level 4’ pertains to those with diplomas, foundation degrees and other academic studies. The map is coloured to indicate the proportion of residents with each and it is distorted in its shape to with the largest wards illustrating the relatively highest totals. Residents without any qualifications and with Level 4 qualifications.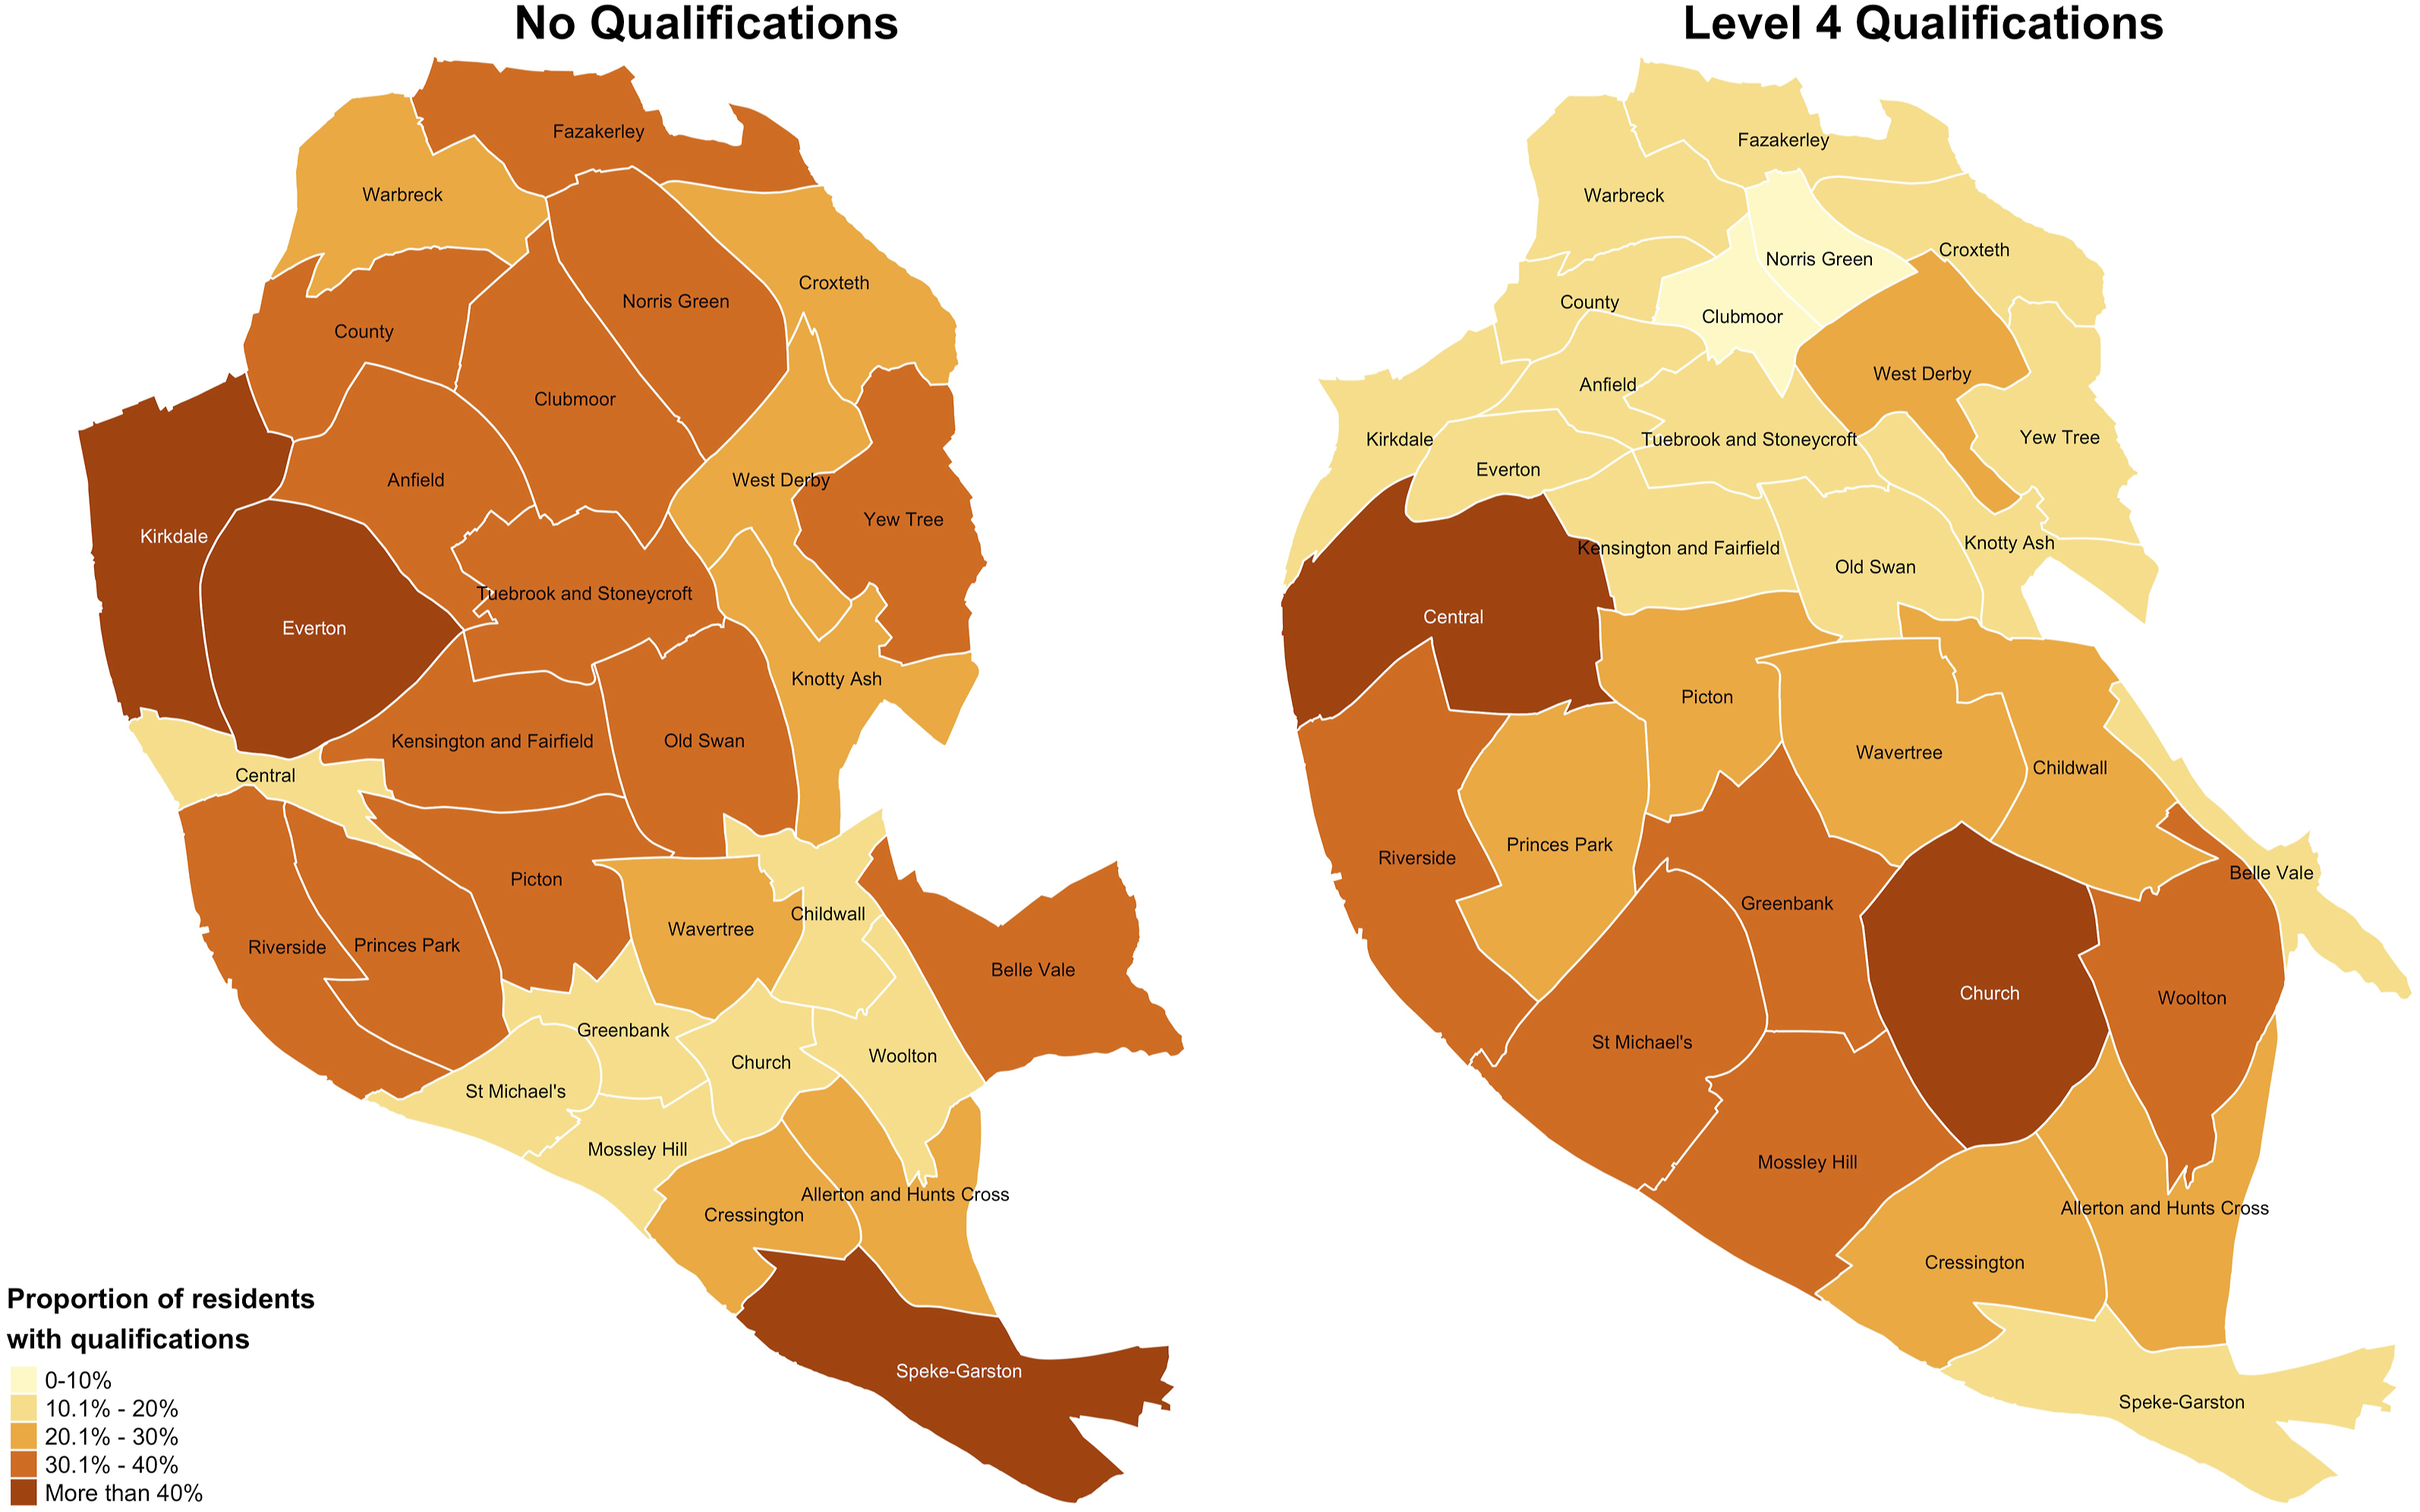
The two maps show how Liverpool is weighted between the north and south, with a higher proportion of unskilled residents living in northern wards while Level 4 educated individuals are generally more represented south of Central. Over a third of residents in Anfield, Tuebrook and Stoneycroft, Clubmoor, and over 40% of residents in Everton and Kirkdale, have no formally recognised qualifications. The Level 4 qualifications map shows this trend in reverse with wards including Central, St Michael’s, Mossley Hill, Greenbank, Woolton and Church with over a third of the population having Level 4 professional qualifications and less than 10% without any. These wards have shown in previous maps that they host a train station and are able to offer residents rail access in less than 10 minutes of walking. The Level 4 map shows the wards in the south of Liverpool larger than usual, but with the exception of Speke-Garston and Belle Vale. These two wards also show unemployment above 10% (Figure 9) and are located at a distance from the nearest train station (Figure 6). While it is likely that access to a rail station in an urban area like Liverpool results in greater opportunities to access markets and public services including jobs, education and health, it may be that individuals are also sorting into neighbourhoods based on available amenities and economic opportunities.
Discussion and future planning: What Merseyrail means for Liverpool
Interconnectedness and mobility
There is an observed association between the presence of rail infrastructure and the number of residents who commute using this method. 15 wards in Liverpool host or border a rail station and only two of these have less than 4% of residents commuting to work on the train (Figure 5). Warbreck, Central and Kirkdale host three rail stations each and represent the highest proportion of residents commuting by train at over 9.2%. Fazakerley is situated in the north of Liverpool and borders Croxteth and Norris Green. Fazakerley has one rail station which is located centrally in the ward and over 6% of the residents commuting by train. In contrast, neighbouring wards, such as Norris Green and Croxteth, have no train station and represent the lowest proportion of residents using the rail network at around 1.2%.
Results show that the wards with higher train use demonstrate a greater distance to travel to work. Wards with over 500 residents commuting by rail averaged a distance travelled of 14.9 km, which contrasts with those wards with less than 500 rail commuters where the average distance travelled was 11.9 km (Figure 4). Central is an example of this, as the ward has the highest number of rail stations in Liverpool, including the nationally served station of Liverpool Lime Street. Around 9.2% of Central’s residents commute by train and the ward has an average distance travelled to work of 17.2 km which is the highest in Liverpool. Moreover, the ward exhibits the lowest unemployment scores in Liverpool (Figure 9).
This suggests that a number of residents living in Central are commuting within the city and beyond, and that this is enabled by the highly connected rail infrastructure. Central demonstrates the lowest car and bus use in Liverpool (Figure 3) indicating how residents use rail to commute high distances, possibly to nearby employment hubs such as Manchester, or even further to London. Rail can facilitate medium-to long-distance commuting, of around 10–40 km, as it is a method which travels at high-speed and is typically punctual in its operations (Clark and Dargay, 2012; Creemers et al., 2012). The interconnectedness of Central (the city centre) enables the outward mobility of labour production, but also the inward movement of consumption towards spaces of culture and leisure (Almendinger, 2009; Overman, 2013).
This may be an example of the rail network facilitating the movement and mobility of citizens throughout Liverpool. In Liverpool, presence of the rail systems encourages the movement of people, resources and ideas throughout the city (Hu, 2016). In fact, Liverpool’s rail network is used to travel to work by 4.9% of the population, similar to Atlanta’s MARTA system at 4.8% (U.S Census Bureau, 2011), although less than the DART system in Dublin facilitates (7.9%, Central Statistics Office Ireland, 2016) and much lower than the highly interconnected rail network in London which is used by around 35% of residents (Nomis, 2011a). Those wards without any rail infrastructure present, including Croxteth, Clubmoor and Anfield, are limited in how they enable mobility, limited in accessing markets such as work.
Accessibility in Liverpool
Residents of Cressington, Central, Kirkdale and Warbreck can access at least three rail stations in 5 min or less (Figure 6) and can journey to the city centre by rail in less than 45 min (Figure 7). Individuals situated in wards with proximity to the rail network demonstrate a greater ability to access the preferred destination and to reach spatially dispersed opportunities of employment, social interaction and cultural consumption (Apparicio et al., 2008; Hu, 2016). Transport infrastructures like the Merseyrail network provide services of mobility which increase the interconnectedness of a space to the wider area (Chen and Vickerman, 2016).
Accessibility in Liverpool is illustrated by rebuilding the accessibility model of Páez et al. (2012) in Figure 12. Yew Tree, Fazakerly and Cressington are compared here as they are wards of similar population size and distance from the city centre of Liverpool. Cressington has greater connectedness to the rail network, ahead of Fazakerly and Yew Tree, as residents can access a larger number of rail services which increases the permeability of the space and simplifies the access to the wider city and city region. Yew Tree is an area underserved by the rail network and with weak accessibility meaning that residents must cross ward boundaries to access a train station. The results demonstrate that accessibility is determined by an individual’s capability in reaching the chosen destination and is enabled by the quality and frequency of the transport network (Hull and Karou, 2014). The accessibility model for Liverpool.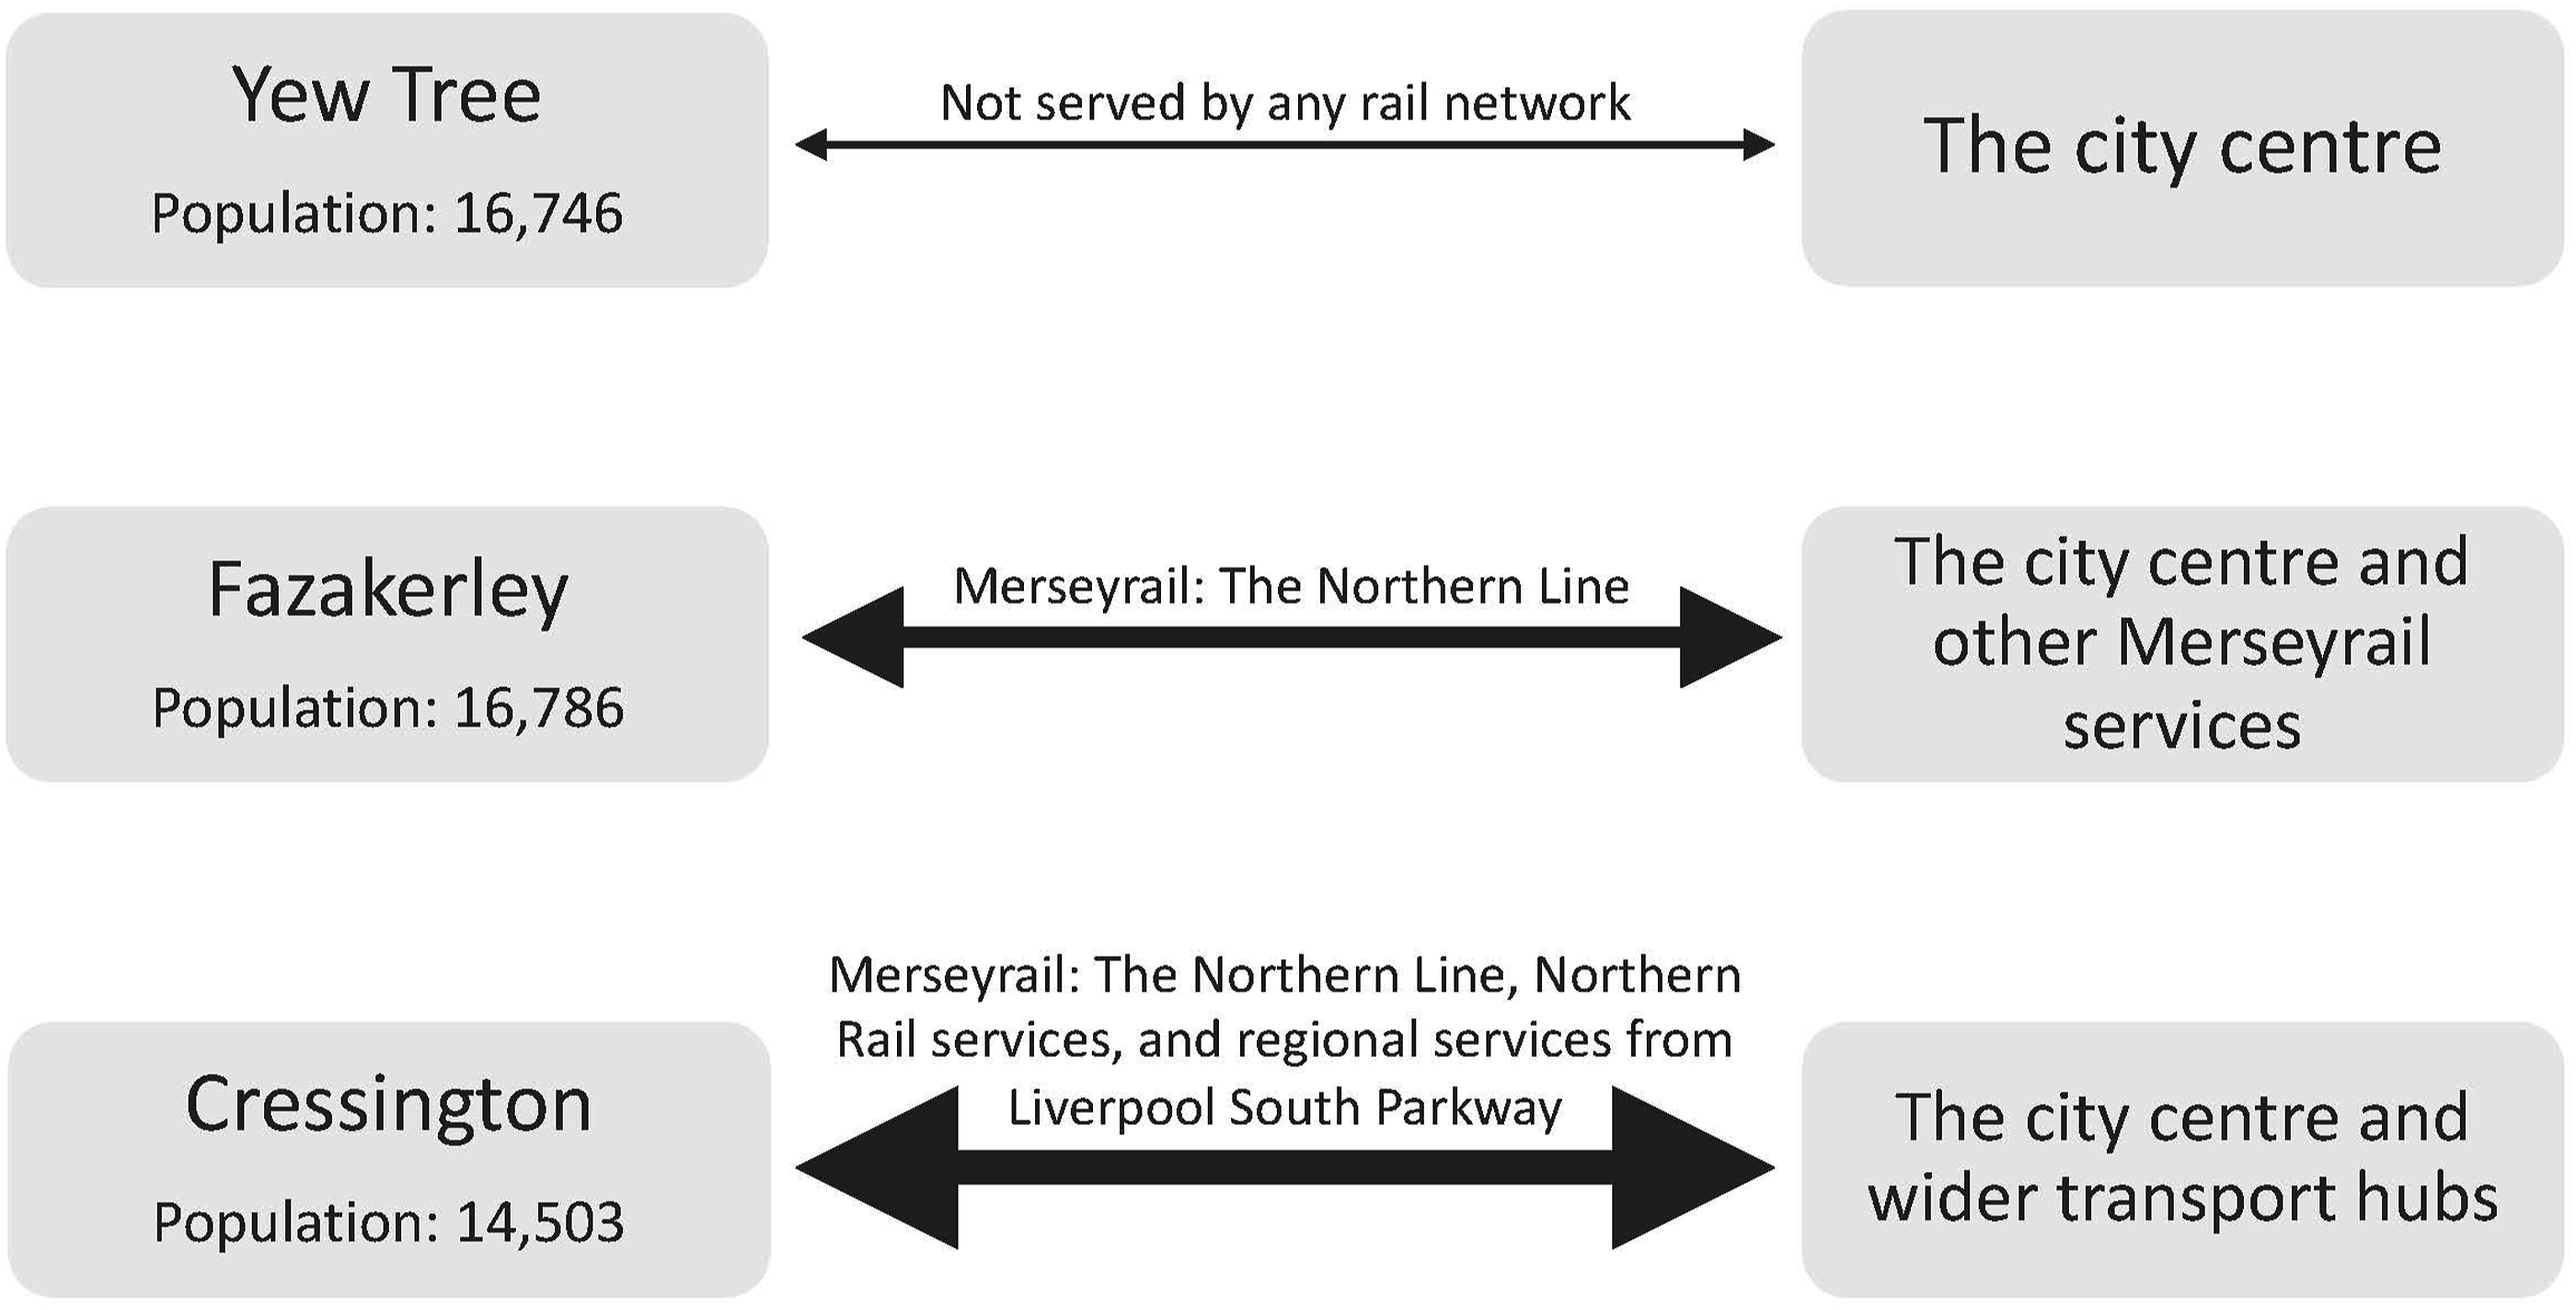
The Merseyrail network provides a service which operates every 15 to 20 min which means that individuals who are able to utilise the service have a greater power and capability to access their destinations. Residents of Cressington can journey to the city centre in 30 min or less showing that an individual living here has a high power of accessibility, while in contrast, Yew Tree takes around 60 min to travel by rail to the city centre from this location. Yew Tree is not part of the interconnected rail network which results in weaker powers of accessibility for residents when attempting to journey from origin to destination, and this has obvious implications when accessing key markets, such as for work (Bocarejo and Oviedo, 2012). With accessibility comes a discourse of power; while the objective distance between journeying locations is important, an individual’s ability to move from origin to destination is critical in the accessibility of the wider urban region (Cui and Levinson, 2019; Reggiani et al., 2010).
The power of accessibility is further reflected in the property values of Liverpool. Real estate values are generally higher in the southeast of Liverpool and lower in the poorly accessible northern area. Properties in Yew Tree are valued much lower than the interconnected area of Cressington, for example, (Zoopla, 2020). Other wards such as Church and Woolton demonstrate moderate rail accessibility but with high real estate values, fitting the general trend is that house prices are typically higher when situated in the general vicinity of transport services (Geng et al., 2015).
Further examples, such as St Michaels, Cressington, Hunts Cross and Kirkdale, show generally higher house prices while in close proximity to a rail station, while places like Everton and Tuebrook and Stoneycroft show the opposite. Outlier exists in these patterns however, and areas around Childwall and Wavertree Technology Park demonstrate little change in property values despite nearby rail access. These wards are served by the poorly received service of Northern Rail, rather than the Merseyrail network, which may suggest that the frequency and efficiency of the transport network is more likely to impact real estate values than the overall presence of the nearest rail station (Grimes and Young, 2013). House prices are effected by a wide range of variables, and in Liverpool, this is no exception. Prices in North Liverpool, for example, have been impacted by industrial decline much more so than in South Liverpool. More research that would help understand how rail infrastructure interacts with real estate price in Liverpool would be helpful.
The rail network and job accessibility
An association exists between areas of high rail accessibility and engagement with the labour market, but questions still remain on whether the rail network is a cause or an effect of this economic participation. In the case of Liverpool, there are 15 wards which host or border a rail station; four of these areas exhibit unemployment above 10%, and eight wards served by the Merseyrail network demonstrate unemployment below 10% (Figure 9). Mossley Hill and Church show the lowest unemployment in Liverpool, at less than 5%, and have access to a total of three rail stations which journey towards Liverpool Central, Liverpool Lime Street and Liverpool South Parkway. All wards which have over 6% of residents commuting by train also have unemployment below 10%, except for Kirkdale.
Where rail accessibility is higher, findings do show greater levels of economic activity. This follows the belief that transport investment can result in greater economic performance as more mobility can advance job creation and employment (Chen and Vickerman, 2016; Knowles, 1996). For residents of Liverpool, the Merseyrail network offers an available mode of transport increasing the possibility of participation in the labour market across the city region (Kawabata and Shen, 2006). This empowers those with greater levels of access to the rail network and who are able to expand their social, economic and cultural activities thereon. As a result, new spaces of wealth accumulation and inequality emerge and are reinforced as access to markets constantly form and reform (Crescenzi and Percoco, 2012; Bertolini and Cheng, 2013).
Datasets depicting welfare claimants and highest levels of qualification reinforce this perception of unequal spaces across the city. Everton, Kensington and Fairfield and Princess Park demonstrate the highest unemployment in Liverpool at more than 16%, a relatively high number of low-skilled residents, and they do not contain a train station. These areas without any rail infrastructure are the spaces which are situated at an equal distance from the city centre as they are to the nearest rail station and form what Anacker (2019) describes as a policy blind spot. These wards are not situated near enough to the city centre to directly benefit from the greater economic activity there, but they are not located at a far enough distance to justify major transport investment (Curtis et al., 2017).
An absence of rail infrastructure and the increased unemployment and welfare claims for these wards suggests that poor transportation choices and weaker accessibility economic opportunity may be a barrier to employment (Blumenberg and Shiki, 2003). These spaces indicate greater levels of exclusion from socioeconomic participation as residents are limited in the opportunities they seek out and an individual cannot access the wider economic, social and cultural possibilities of the urban area (Manville and Storper, 2006). Wards such as Anfield and Everton demonstrate a lack of transport access which restricts the pursuit of socioeconomic opportunity and ultimately, is associated with limits to the overall standard of living for residents of these areas (Currie et al., 2010; Ward and Wilson, 2018).
The rail network also serves Liverpool unequally; residents in Warbreck have access to three rail stations but those in Norris Green do not have any rail access. All active passenger services journey towards Central whereas the inactive railroads between Warbreck and Woolton/Belle Vale and the routes without rail stations from Kirkdale to Wavertree at distance from the city centre (Figure 2) limit new socioeconomic developments. Wards including Norris Green, Belle Vale, Everton and most of Speke-Garston exhibit higher deprivation and weak access to the rail network. These areas show very little economic reward from the large-scale and high-cost rail network, and that rail accessibility across Liverpool is unequal. The inability to engage with areas of economic opportunity from these wards demonstrates that insufficient access to transport networks contributes towards social exclusion in Liverpool.
Planning out transport inequality
There are spatial planning opportunities to address the transport inequalities in Liverpool. Liverpool has a substantial amount of unused rail infrastructure throughout the city, including a disused line between Belle Vale/Woolton and Warbreck and a rail line from Kirkdale to Wavertree Technology Park which is currently used by diesel-powered freight trains only. Enabling the inclusion of this infrastructure into active passenger rail networks of Liverpool would challenge the centripetal force of current rail services and enable mobility between wards situated away from the city centre (Niedzielski and Malecki, 2012).
Potential passenger routes are depicted spatially in Figure 13 and include two rail lines which journey north and south in Liverpool. An outer loop line that follows the current Merseyrail network from Hunts Cross to Warbreck and then journeys through Clubmoor, Knotty Ash and Woolton, is an option that would introduce six wards to the rail network (Line A). Implementing a passenger service between Kirkdale and Wavertree would engage wards such as County, Anfield and Clubmoor and enable journeys to the city centre in less than 30 min (Line B). Potential planning opportunities to extend the rail network.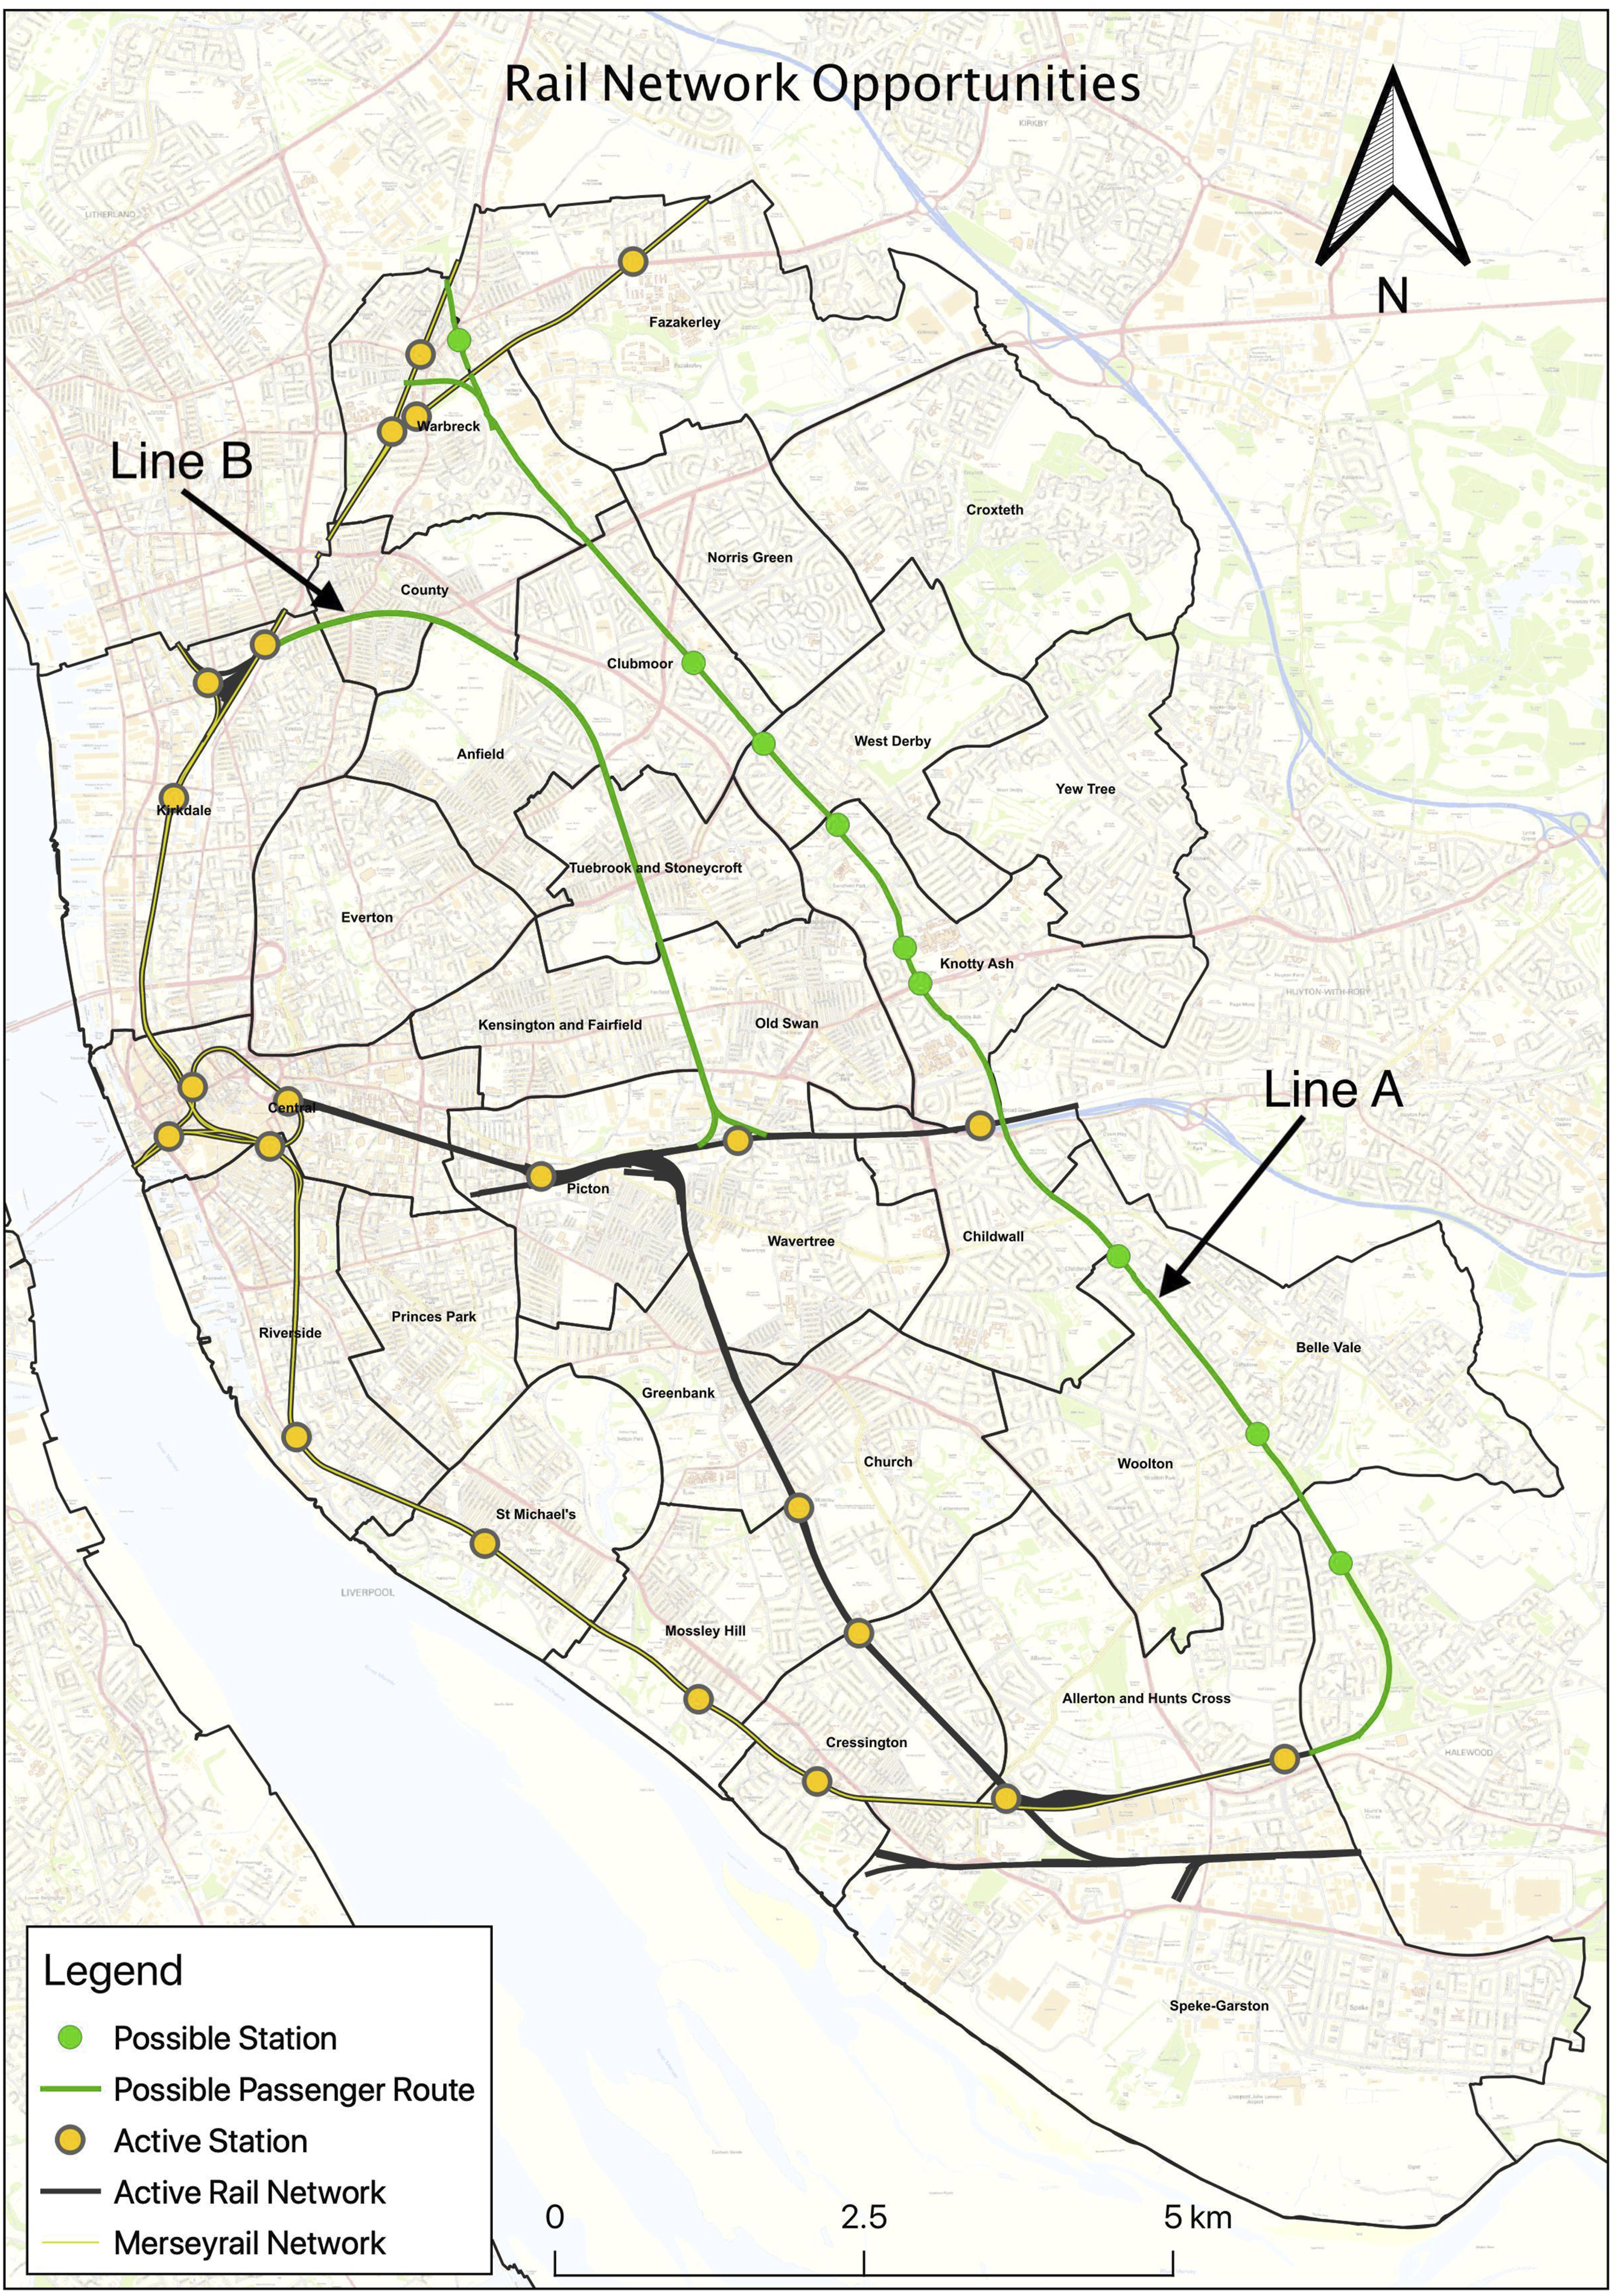
Suggestions such as these would add a substantial catchment area to the rail network and allow around 60% of land in Liverpool to be situated within 15 min of walking to a train station (Figure 14). Proposals to use existing infrastructure to develop a circle-line follows Liverpool City Region’s Long-Term Rail Strategy (2018) of reducing single-ended termini and to increase the overall carrying capacity of the network. This would be particularly useful on Merseyrail’s Northern Line which is limited to a maximum of 20 operations per hour. Engaging with the unused rail infrastructure could address current inequalities of the rail system by increasing accessibility to the network in low-income neighbourhoods and enhance the potential of the economy. Further, increasing the catchment area of accessibility presents opportunities involving transit-oriented development and increases the possibilities of compact and efficient liveable sub-centres across Liverpool. Potential catchment area following the reintroduction of disused rail infrastructure.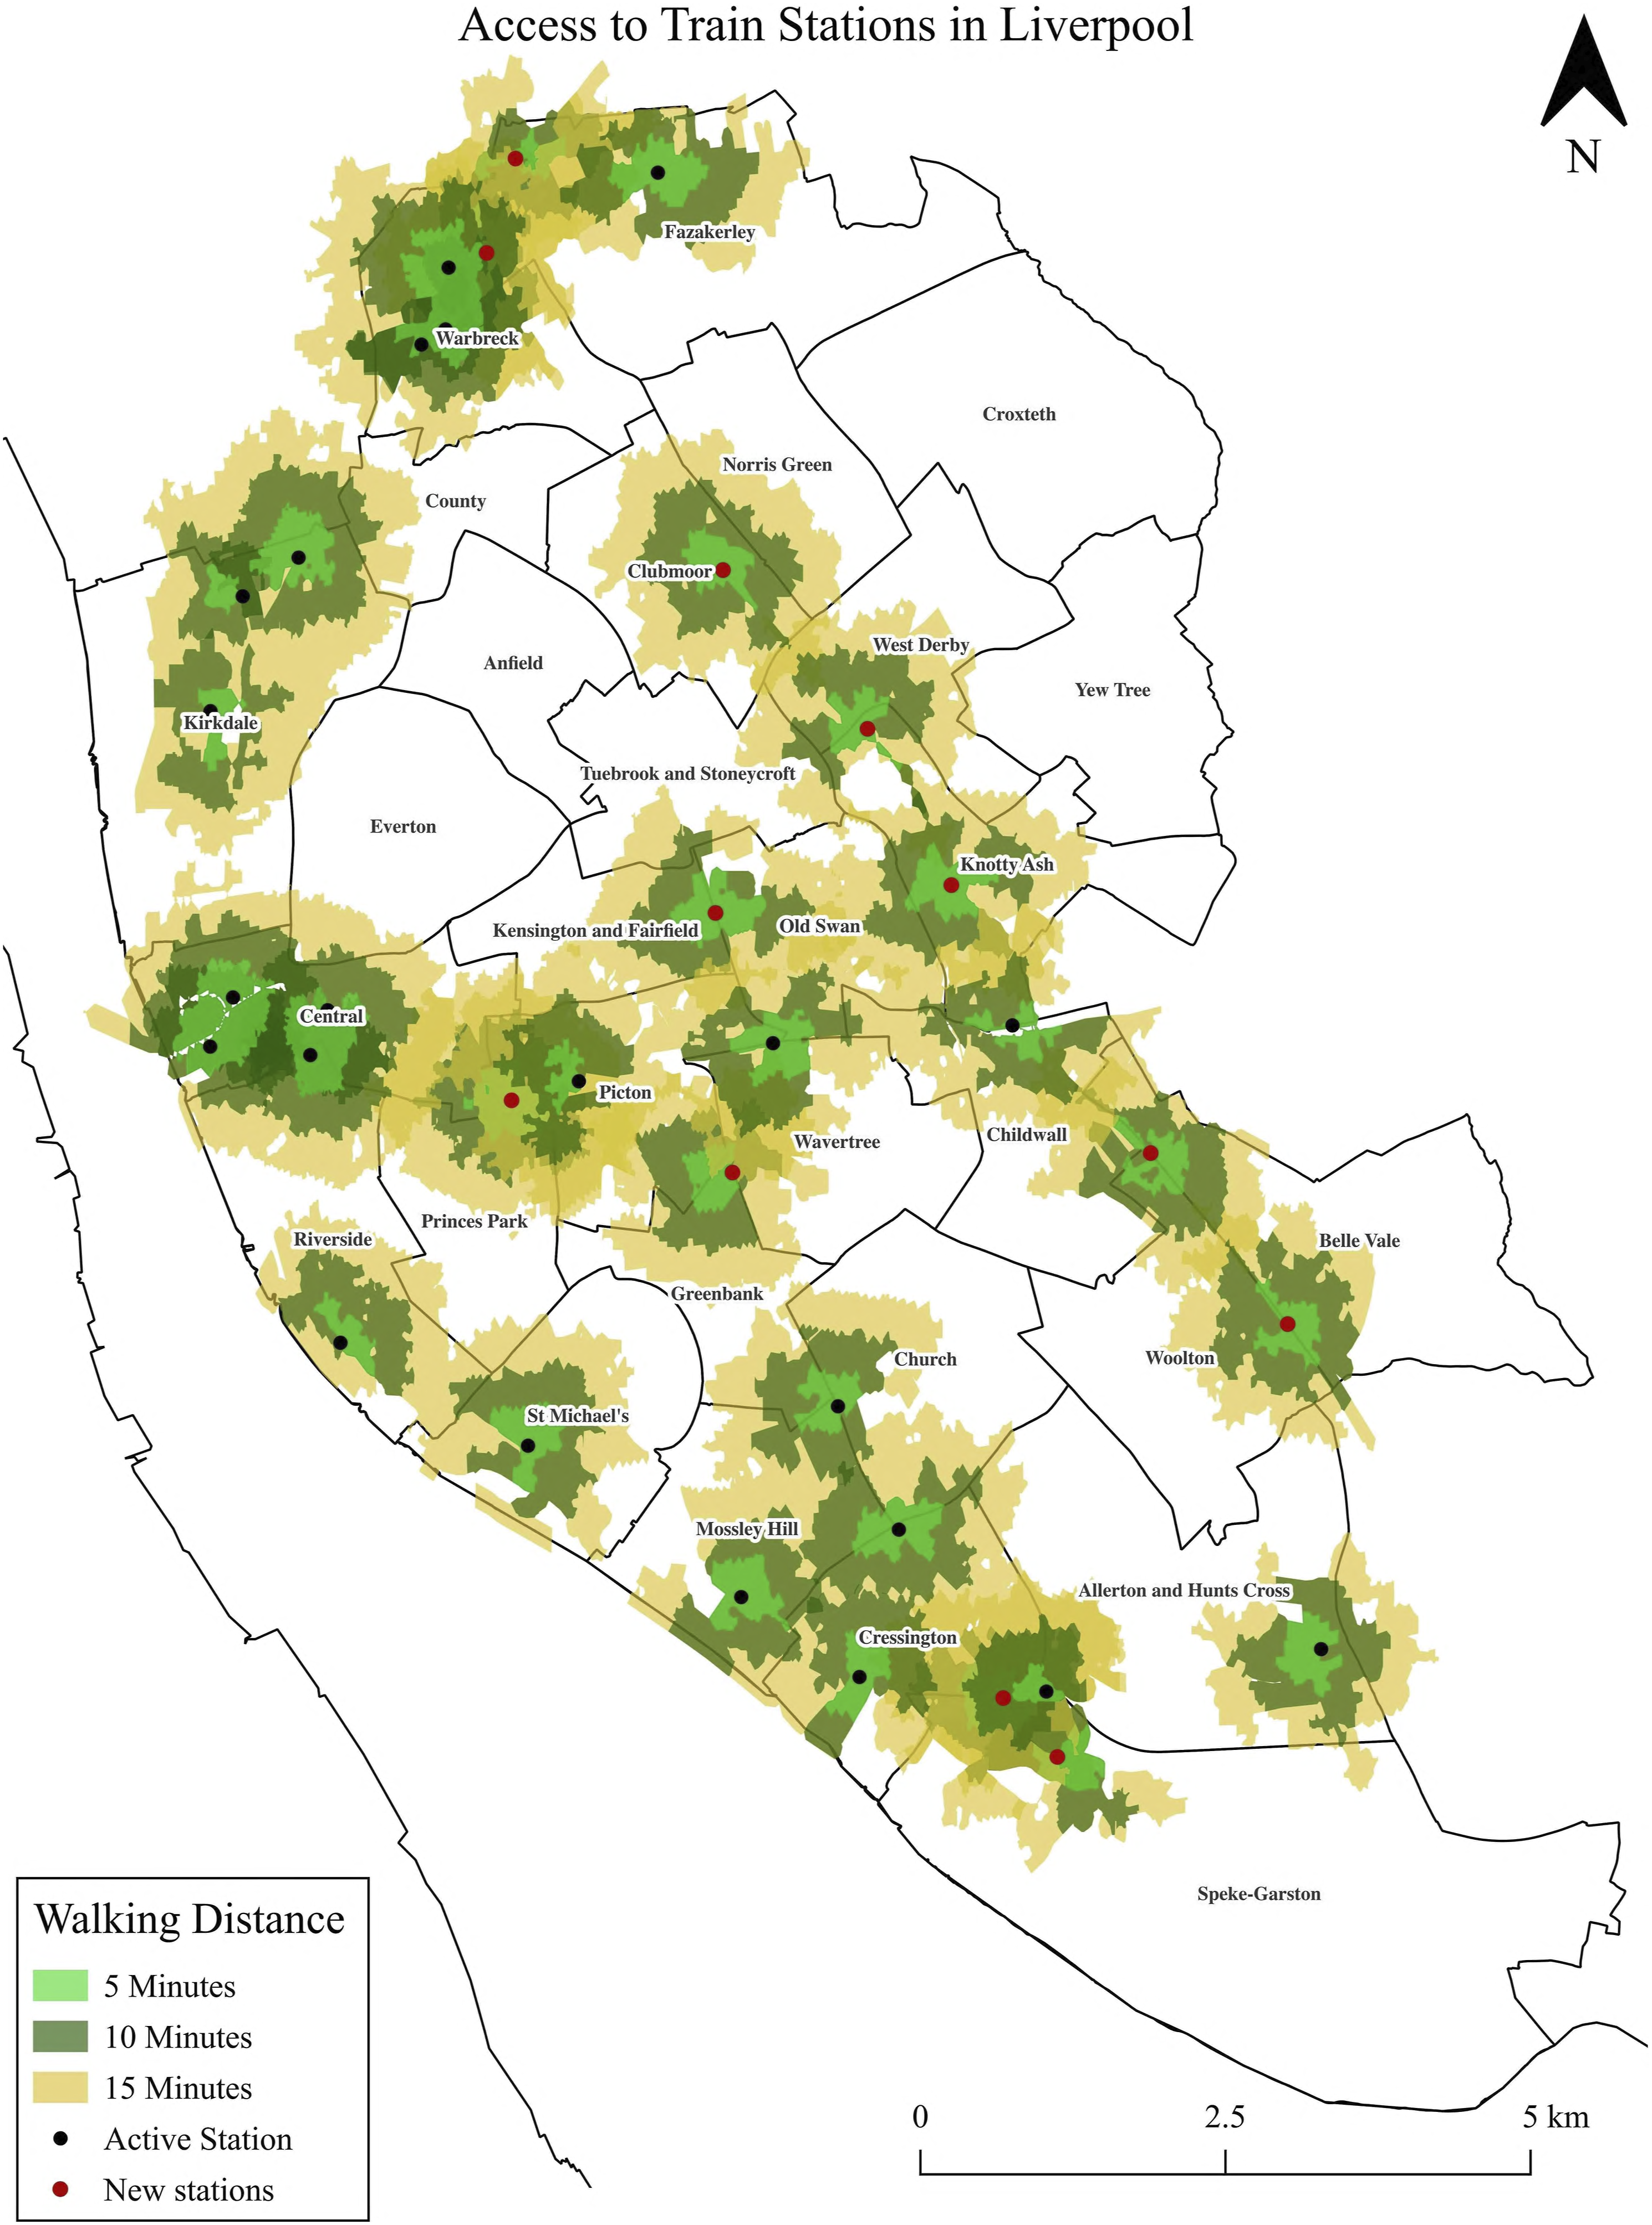
Future research and concluding remarks
The term ‘opportunity’ was specified earlier when considering the link between rail and job accessibility. Wards such as Kirkdale show high train use and high unemployment, while spaces like West Derby pose low train use and low unemployment. These trends indicate how the presence of rail infrastructure presents a more nuanced association between transport and economic growth. It may be the case that the Merseyrail network provides residents with an opportunity to access wider socioeconomic possibilities, which is a pattern we can identify in multiple spaces across Liverpool. With this thought in mind, future work could be pursued in several ways.
First, a greater focus of the city region might examine the six authorities and their engagement with the Merseyrail network. This may include data from before and after the introduction of the city region governance structure to think about how the city regionalism framework has influenced rail transit in the LCR. Further, the descriptive and exploratory techniques used in this research are helpful in building a conceptual foundation for future research. This work has provided a necessary starting point in describing the Merseyrail network, and it presents an essential exploration prior to a more sophisticated study.
The general associations of lower unemployment rates in wards with Merseyrail infrastructure suggest that there may be scope for further statistical analyses. Wards served by this infrastructure demonstrate relatively higher train use but more importantly, eight of the ten wards served by the Merseyrail network represent the lowest unemployment rates. The findings of this work do indicate that greater proximity to transport provide opportunities to access employment markets, confirming the arguments made by Knowles (1996), Chen and Vickerman (2016) and more recently, Bertolini (2020).
We can see in this work that there exists inequality in rail access across the wards of Liverpool, however. The LCR Combined Authority, through the deployment of the Long-Term Rail Strategy (2018), has the opportunity to address the imbalance in the network; all passenger services already converge towards the city centre meaning that the rail network currently serves an area of high economic output and consumption. To address this, future rail developments could add a substantial catchment area to the rail network and widen the accessibility of wards throughout Liverpool. At a time when urban areas and their wider hinterland in the north of England are struggling to achieve economic growth and social inclusion, a focus on this part of the transport system in Liverpool City Region may prove beneficial.
Footnotes
Declaration of conflicting interests
The authors declared no potential conflicts of interest with respect to the research, authorship, and/or publication of this article.
Funding
The authors received no financial support for the research, authorship, and/or publication of this article.