
Abstract
Across Britain as a whole, the number of non-employed adults of working age in receipt of incapacity-related benefits substantially exceeds the number claiming unemployment benefits. This article explores the extent to which the large number of incapacity claimants hides unemployment. Building on previous methods and evidence but deploying an updated methodology to adjust for underlying differences in health, the article finds that the number of incapacity claimants who might have been expected to have been in work in a genuinely fully-employed economy remains substantial, though somewhat lower than in the early 2000s. It also finds that this hidden unemployment is disproportionately concentrated in the weaker local economies of Britain’s older industrial areas and a number of coastal towns. The benefit claims are legitimate it is argued, but the scale and location of hidden unemployment casts doubt on assumptions that the contemporary UK economy is operating close to full employment.
Introduction
One of the features of debate around the contemporary UK economy is the assumption that unemployment is very low. Putting aside the temporary surge during the Covid pandemic, the widely held view is also that the UK has had low unemployment since at least the mid-2010s following recovery from the financial crisis. This perspective is common in the media, shared by prominent labour market analysts (Institute for Employment Studies, 2022; Institute for Fiscal Studies, 2022) and voiced by the UK government itself (HM Treasury, 2022).
There is no dispute that official measures of unemployment are low. In the summer of 2022, Office for National Statistics (ONS, 2022a) figures based on the Labour Force Survey put the unemployment rate at just 3.5% of economically active adults, lower than at any time since 1974. The Labour Force Survey uses the International Labour Organisation (ILO) definition of unemployment which counts those who are not working, would be available to start work within 2 weeks and have looked for work in the last 4 weeks. Even on wider definitions, official measures still point towards modest unemployment (Office for National Statistics, 2022b). For example, adding in ‘discouraged’ workers who are not looking for work because they feel no suitable jobs are currently available and ‘marginally attached’ workers who fail to meet the ILO criteria but say they want a job adds only 2.1% points to the unemployment rate.
However, the existing evidence on labour market performance in the UK is primarily rooted in a limited range of Labour Force Survey headline unemployment and employment measures. This provides only a partial view of the health and trajectory of the labour market, usually from only a national perspective, which is then propagated in the media by commentators and international agencies.
This article contributes to the literature by questioning this perception of the UK labour market, deploying an updated methodology that provides an alternative measure highlighting the extent to which unemployment is hidden. In particular, the article considers whether official statistics accurately reflect the situation in many of the less prosperous parts of the country. It focuses specifically on the scale of hidden unemployment among incapacity-related benefit claimants, an especially numerous group in the UK, larger indeed than the group claiming unemployment-related benefits. We argue that in the parts of Britain where there has long been an imbalance in the local labour market there is extensive hidden unemployment. Moreover, this is not a recent phenomenon but has persisted since at least the 1980s and has been little dented by more recent upturns in the jobs market. Our evidence here builds on a series of reports on the ‘real level of unemployment’, published at five-yearly intervals since 1997, most recently Beatty et al. (2022).
In the context of the UK benefits system, ‘incapacity-related benefit claimants’ are the out-of-work adults of working age who claim Employment and Support Allowance (ESA) or its replacement Universal Credit on the grounds of limited capability for work. Universal Credit was introduced from 2013 onwards as the key part of a major reform of UK welfare benefits consolidating six previous benefits and became fully operational for new claimants across the country in late 2018 but the migration of the existing stock of claimants on legacy benefits, including ESA, is still on-going. The pre-ESA family of incapacity-related benefits included Incapacity Benefit, Severe Disablement Allowance and, prior to 1995, Invalidity Benefit. These income replacement benefits for those out-of-work with long-term health conditions or disabilities are sometimes referred to as ‘sickness’ or ‘disability’ benefits but for simplicity we use the term ‘incapacity benefits’ throughout.
To access the current incapacity benefits, medical evidence is required and a Work Capability Assessment is undertaken by health care professionals working on behalf of the UK government’s Department for Work and Pensions. The Work Capability Assessment has undergone a series of independent reviews and amendments over the years (Litchfield, 2014) but aims to consider how well an individual can carry out a range of activities – both physical and mental, cognitive and intellectual – to assess the extent to which a health condition or disability affects a claimant’s capability to work. Qualifying claimants need not necessarily be incapable of all work in all circumstances but need to be sufficiently ill or disabled to be not required to look for work. The health problems need not be permanent. The incapacity benefits are paid by the state as part of normal public expenditure, not by private or company insurance schemes.
There are of course likely to be other groups of hidden unemployed as well, some of whom do not claim any benefits, but in the UK hidden unemployment on incapacity benefits appears particularly extensive. Nevertheless, it is important to note that in pointing towards hidden unemployment none of our arguments imply that the benefit claims are fraudulent or that the health problems and disabilities are anything less than real.
The first part of the article examines the evolution of the literature on hidden unemployment among incapacity claimants. This is followed by a compilation and examination of trends in claimant numbers since the late 1970s and an overview of the geography of incapacity claims at the local authority scale across Britain. The article then addresses methodological issues – how to define and measure hidden unemployment. The preferred method of measurement is then applied, generating estimates of the changing level of hidden unemployment for Britain as a whole over the last 25 years and estimates for all local authorities for 2021. The article concludes by considering the likely causes of the persistence of hidden unemployment and the ways in which the numbers might be brought down.
Evolution of the evidence base
Doubts started to arise about the reliability of UK unemployment data as far back as the 1980s, when reforms began to curtail eligibility for unemployment benefits (Gregg, 1994). The reforms were the focus of a review by the Royal Statistical Society (1995), which leaned away from the claimant count (the numbers claiming unemployment-related benefits) in favour of the Labour Force Survey measure based on the ILO definition as a more reliable source of unemployment data.
It was in the late-1990s that attention began to turn to the surge in incapacity claimant numbers. In the UK coalfields, for example, a big increase in incapacity numbers appeared to explain why the loss of coal jobs had not led to an increase in claimant unemployment (Beatty and Fothergill, 1996). A diversion out of the labour market into ‘permanent sickness’ rather than recorded unemployment was confirmed in a study of redundant miners (Fieldhouse and Hollywood, 1999). It soon became apparent that other parts of the UK were experiencing a similar shift, including Northern Ireland (Armstrong, 1999), North West England (Sutherland, 1999) and the shipbuilding town of Barrow-in-Furness (Beatty and Fothergill, 2002).
In parallel with studies of incapacity numbers there was growing awareness of the role of ‘economic inactivity’ among adults of working age, of which incapacity claimants formed a significant part (Erdem and Glyn, 2001; Green, 1997). Especially in weaker local economies, the distinction between the large numbers of economically inactive and the unemployed seemed to be blurring. MacKay (1999) went as far as to argue that ‘the greater the degree of labour market disadvantage, the less appropriate is unemployment as a measure of labour market slack’. By the mid-2000s, that there was extensive hidden unemployment on incapacity-related benefits in the less prosperous parts of the UK was well documented (Anyadike-Danes, 2004; Beatty and Fothergill, 2005; Webster, 2002).
In other Western economies, where ‘disability’ benefits tends to be the usual term, there were also increases in claimant numbers though not always to the same extent as in the UK. Marin and Prinz (2003) placed the claimant rate in the UK behind Norway, the Netherlands, Sweden and Denmark but some way ahead of France, Germany, Italy and Spain. Green (1999) identified big differences in the extent of economic inactivity across the EU. In the United States, Autor and Duggan (2003) flagged up an increase in disability claimant numbers that varied across the country. In the United States there was also evidence, paralleling the UK experience, that mining job loss had led to higher disability claimant rates (Black et al., 2002).
There appeared to be multiple factors behind the increase in incapacity claimant numbers, though not necessarily of equal importance. Given the high numbers in places where jobs had been lost, the demand for labour was clearly playing a key role. Labour demand was at the heart of the theory of employment, unemployment and sickness put forward by Beatty et al. (2000) and reviews of the evidence from the UK and US on why disability rolls vary between regions (McVicar, 2006, 2008) pointed to labour demand as a key explanatory factor. Baumberg (2014) argued that it was not just the number but also the type of jobs that matters because employment that offers little control over an individual’s input are poorly suited to workers with disabilities.
Sickness and disability were clearly part of the picture. Whilst it was widely agreed that rising incapacity numbers could not be explained by a deterioration in general standards of health, which if anything were tending to improve, there was also acceptance that the health problems and/or disabilities are real. As Beatty et al. (2000) argued, it was the interaction between widespread ill health/disability and the demand for labour was at the root of the problem. Norman and Bambra (2007) quite correctly pointed out that in the UK mortality rates and Census measures of ill health are correlated at the local level with the incidence of incapacity claims. There is also a well-established causal link from unemployment and poverty to ill health (Bellaby and Bellaby, 1999) and evidence on the wider social determinants of ill health (Marmot et al., 2010, 2020). Moreover, once claimants with health problems and/or disabilities had become detached from the labour market it was clearly very difficult to get them back (Little, 2007).
Financial incentives to claim incapacity benefits rather than unemployment benefits appeared to have played some role. As Huddleston (2002) noted, at the time that incapacity claimant numbers were rising steeply in the 1980s and 90s, reforms to unemployment benefits had reduced their relative value and introduced more stringent job-seeking conditionality. Huddleston also noted that at the same time entry-level wages for men – the wages for those starting a job after a period of unemployment or incapacity – were falling. Pushing in the opposite direction, reforms reducing eligibility and entitlement for incapacity benefits for the less severely disabled have since 2010 included the time-limiting and means-testing of benefit payments and a requirement to undertake ‘work-related activity’ (Jones and McVicar, 2022).
In the UK, administrative and medical hurdles have always stood in the way of access to incapacity-related benefits so there have been constraints on the role of incentives arising from differences in payment rates. In particular, the medical hurdle was raised in 1995 when responsibility for assessing claims shifted from the claimant’s own doctor to practitioners working on behalf of the Department for Work and Pensions and the Work Capability Assessment was introduced.
From around 2010 onwards, however, academic inquiry into the UK’s incapacity claimant numbers began to fade. Partly this was because the numbers themselves had peaked and were beginning to subside, as Anyadike-Danes and McVicar (2008) noted. A case study of Glasgow (Webster et al., 2010), where at peak almost one-fifth of the working-age population had claimed incapacity-related benefits, found that the numbers had fallen sharply from three times to just twice the national average. McVicar (2013) documented not only falling UK numbers but also convergence between the places with the highest and lowest claimant rates.
Falling incapacity claimant numbers did not seem an unreasonable expectation. The former industrial workers who had boosted the incapacity numbers in the 1980s and 1990s in the wake of deindustrialisation were getting older and finally dropping out of the figures into retirement. The UK government was at the same time introducing back-to-work policies intended to reduce incapacity claimant numbers by a million (Fothergill and Wilson, 2007). These included increased conditionality for some claimants and in some cases reduced entitlement or eligibility. If the numbers were slower to decline after 2010 than had been intended this could at least in part be explained by the increase in women’s state pension age (from 60 to 65) bringing in an additional eligible cohort, and from 2018 onwards the increase in the state pension age for all from 65 to 66. Incapacity claimant rates rise with age, so increases in the state pension age were always likely to push up the headline numbers.
Furthermore, in the 2010s the wider economic context in the UK seemed far more benign. Even in the wake of the 2008 financial crisis, recorded unemployment stayed well below the levels in the 1980s and 1990s and by the mid-2010s had fallen back again to low levels. If high unemployment had been driving a diversion onto incapacity benefits, low unemployment might be expected to bring the numbers down again. In practice, as we show below, the UK’s incapacity claimant numbers fell by nowhere near as much as expected and even in the economic ‘good times’ there remained substantial hidden unemployment.
The post-pandemic labour market then began to shift perceptions once more. By mid-2022 it had become apparent through Labour Force Survey data that the employment rate in the UK had not returned to pre-pandemic levels. Instead, there had been an increase in economic inactivity, especially among older workers, of which an increase in the numbers recorded as too sick to work formed an important part (Institute for Employment Studies, 2022). In addition, Labour Force Survey data showed that self-reported long-term sickness or disability included many people still in employment – in total 16% of the entire working-age population (Haskel and Martin 2022).
The Centre for Cities (2023) drew the conclusion that the figures were hiding large-scale unemployment. They argued that all of those who are economically inactive because of sickness or disability – some 2.5 million according to the Labour Force Survey – should be counted among the ‘UK’s army of hidden unemployed’. Moreover, they calculated that the hidden unemployed are disproportionately concentrated in the UK’s weaker local economies, especially those scarred by deindustrialisation. As we demonstrate below, the Centre for Cities’ measure of hidden unemployment among the sick and disabled is excessive. We do, however, concur that the hidden unemployment is extensive and that it is concentrated much more in some places than others. These are key features of the contemporary UK labour market and it is good that at last they have begun to resurface in public debate.
Trends in claimant numbers
Figure 1 shows the numbers claiming incapacity benefits (including those on older benefits gradually being replaced) alongside the numbers claiming unemployment benefits from 1979 to 2022 for Great Britain as a whole, drawing on data from the UK government’s Department for Work and Pensions (DWP). The two groups here are mutually exclusive: it is not possible to claim incapacity benefits at the same time as unemployment benefits. Out-of-work working age benefit claimants, GB, 1979–2022. Source: DWP.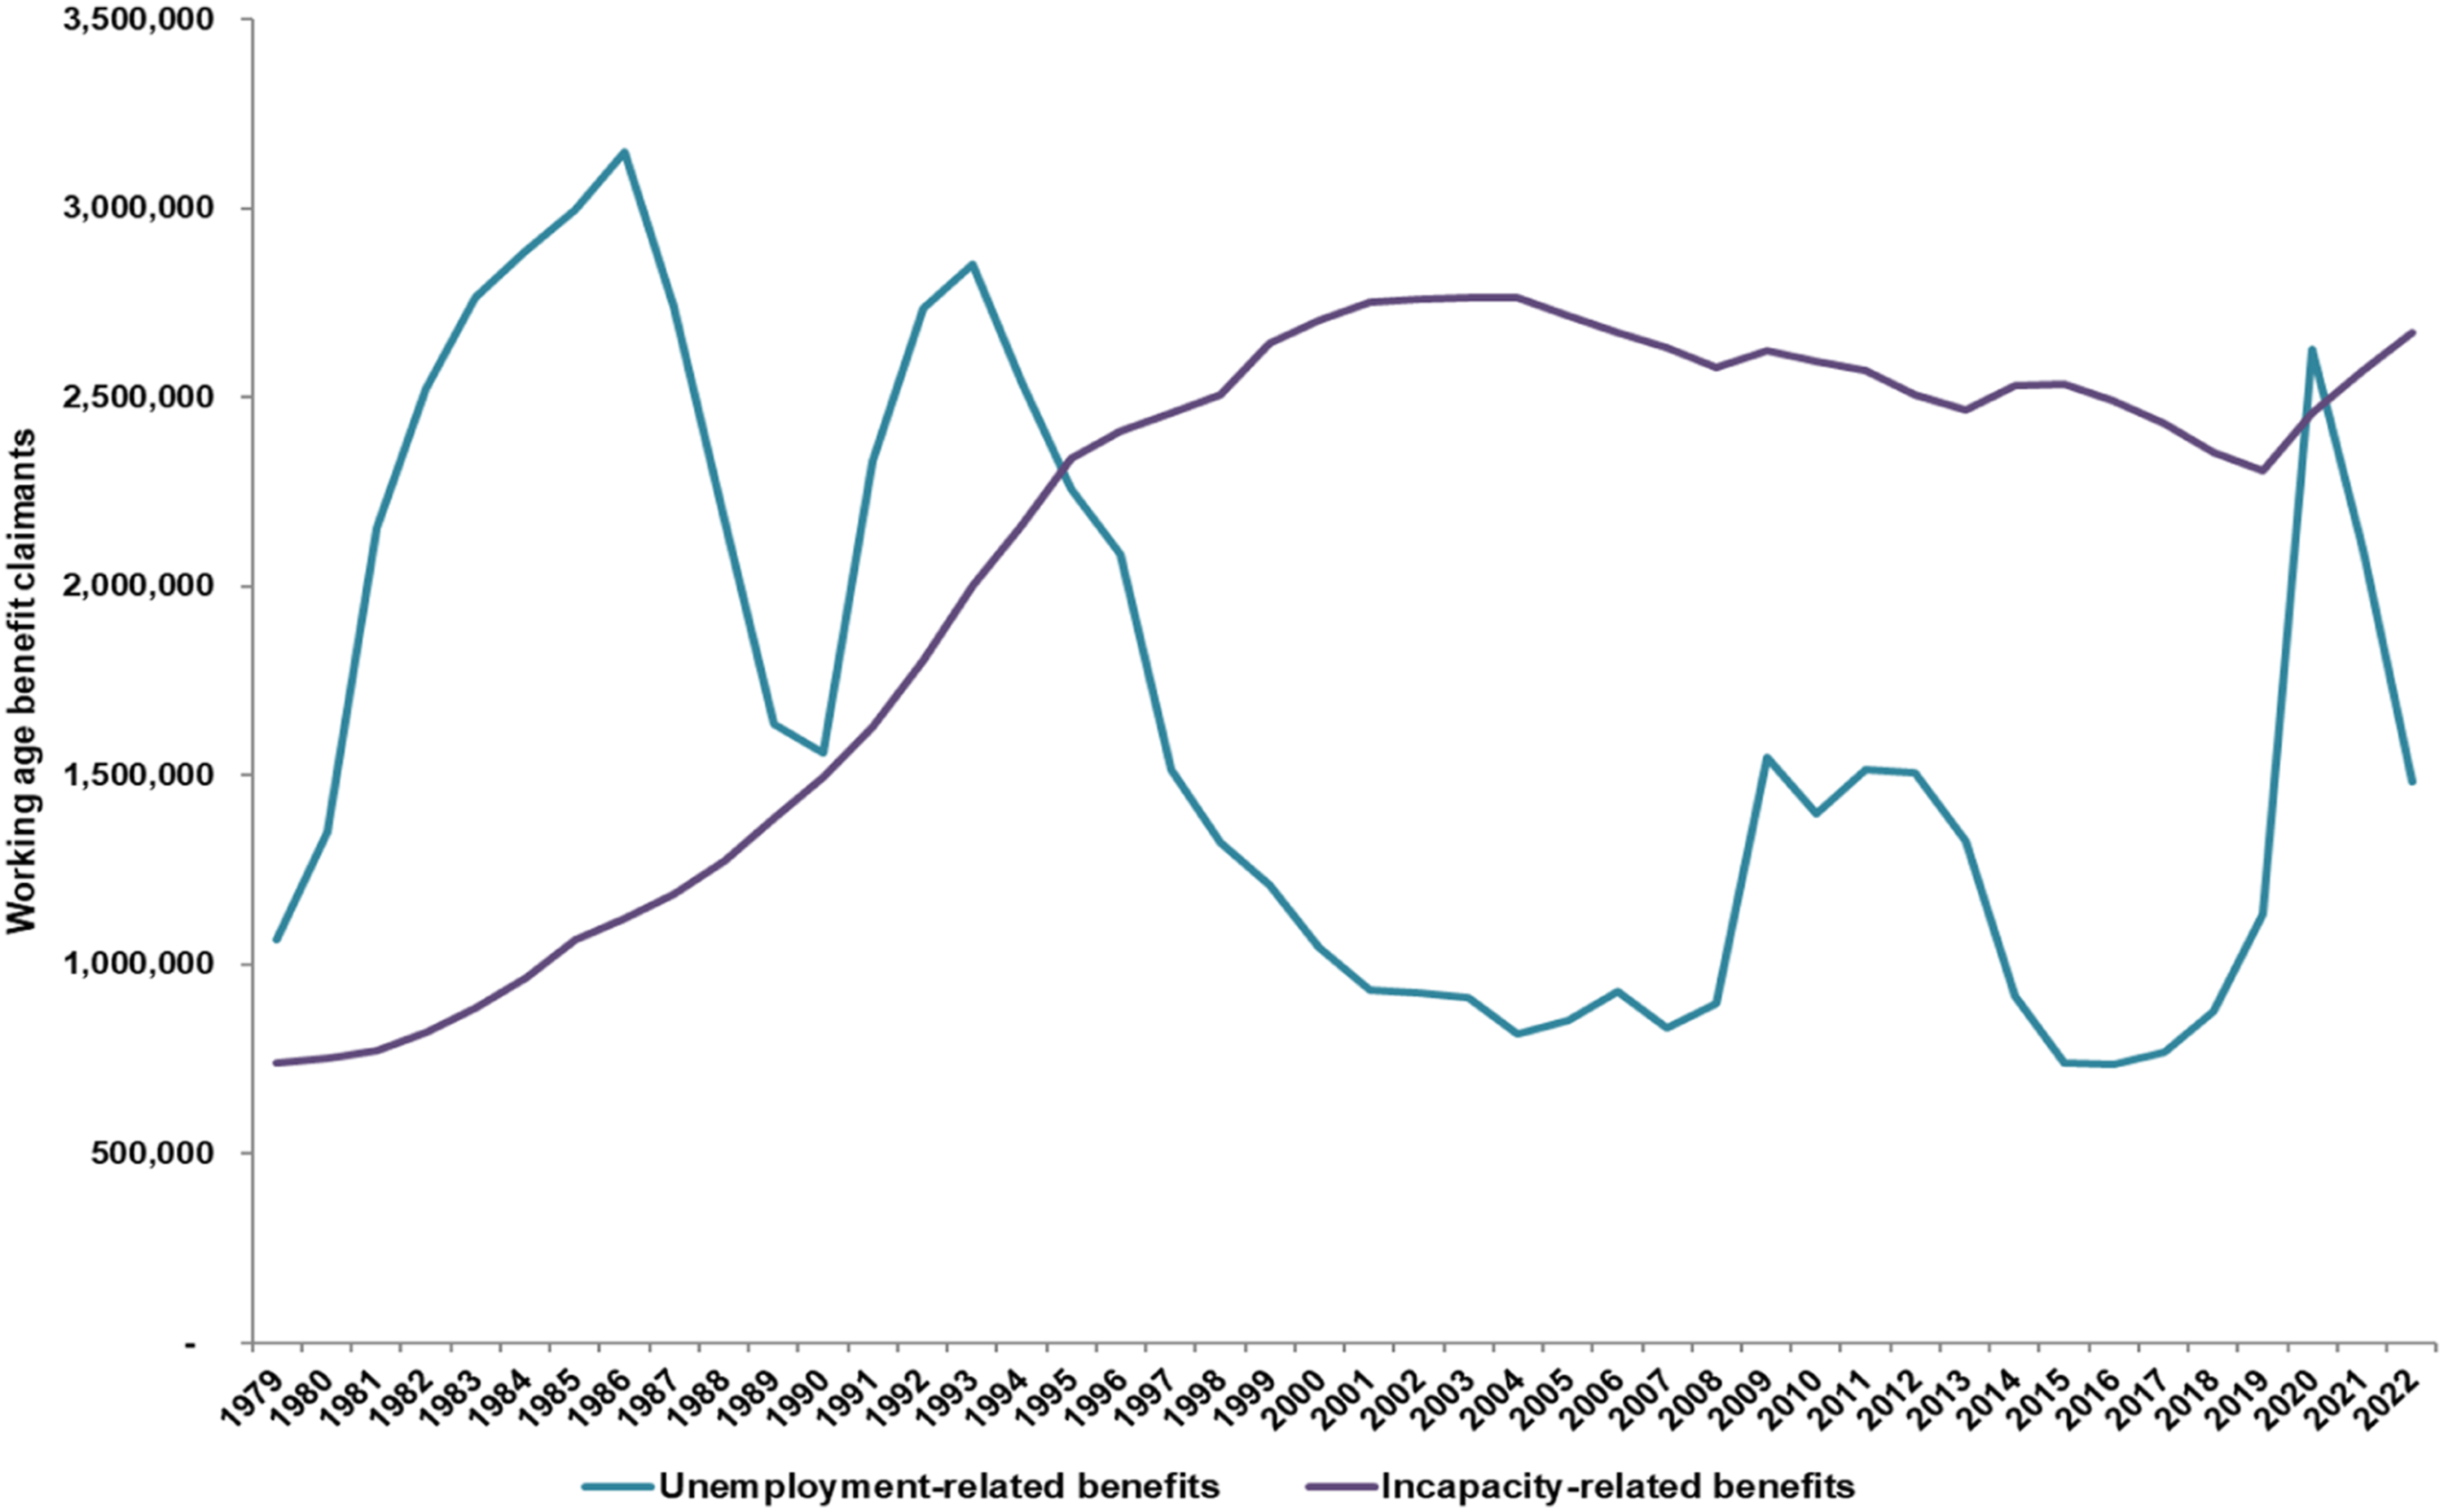
The unemployment benefits in Figure 1 are presently Jobseeker’s Allowance (for claimants with sufficient recent National Insurance contributions) and Universal Credit with a requirement to look for work. The numbers on unemployment benefits are widely known as the ‘claimant count’ and differ from the unemployment figures from the Labour Force Survey, which do not depend on benefit claims.
The incapacity benefits in Figure 1, as explained earlier, are presently Employment and Support Allowance or Universal Credit on the grounds of limited capability to work. Incapacity benefits do not carry a requirement to look for work, though for the less severely ill/disabled there can be a requirement to undertake ‘work-related activity’ which includes taking part in work-focussed interviews.
Tracking claimant numbers through time is complicated by changes in benefit rules which at various times have narrowed or widened the eligibility for each benefit, meaning that in detail the numbers are comparable only as an administrative count under the rules operating at each point in time. The introduction of Universal Credit from 2013 onwards was the most significant of the changes. Nevertheless, the broad trends are sufficiently powerful to tell an important story.
In the wake of the recession in the early 1980s the numbers claiming unemployment benefits reached three million, fell back, then rose again during the recession of the early 1990s before declining to under a million in the early 2000s. Following the 2008 financial crisis the numbers peaked at around 1.5 million before falling back once more to below a million. From around 2017 onwards the numbers crept up again as the widening roll-out of Universal Credit extended the range of claimants required to look for work, for example, to include partners of unemployed claimants and some low-wage employees who are required to seek more hours or higher pay. During the Covid pandemic there was a spike in numbers (exaggerated by the administrative expedient of keeping claims open for 6 months) before they fell back again as the economy re-opened.
In August 2022, across Great Britain as a whole there were just under 1.5 million out-of-work unemployment-related benefit claimants, around 250,000 more than the number of unemployed recorded by the Labour Force Survey (the UK government’s preferred measure and the one widely reported in the press). This represented a reversal of the previous situation in which the Labour Force Survey measure of unemployment had consistently exceeded the number of claimants and owes much to the widening requirement to look for work under Universal Credit.
The striking feature in Figure 1 is the rise in the numbers out-of-work on incapacity-related benefits – up from around 750,000 at the end of the 1970s to a peak of over 2.7 million in the early 2000s. It is impossible to explain this increase in terms in terms of changing benefit rules or widening eligibility. After the early 2000s peak the numbers then declined gradually but only to around 2.3 million, despite the government pledge to ‘take a million off incapacity benefit’ (Department for Work and Pensions, 2006).
The Covid pandemic brought a reversion to rising incapacity-related claimant numbers – up around 350,000 compared to pre-pandemic levels – and unlike the claimant unemployment numbers, which fell away as the economy re-opened, the incapacity claimant numbers stayed at an elevated level. In mid-2022, across Great Britain as a whole more than 2.6 million adults of working age were out-of-work on incapacity-related benefits, barely fewer than at peak in the early 2000s. This is the sum of the individuals claiming Employment and Support Allowance (ESA) in either the ‘work-related activity’ or ‘support’ group, plus a small residual number on pre-ESA incapacity benefits, plus the number of household entitlements to Universal Credit on the basis of limited capability to work. The most recent figures are actually an under-count because in Universal Credit statistics only one household entitlement is recorded even if it covers two or more long-term sick or disabled of working age and, probably more importantly, because following rule changes in 2017 some new claimants assessed as having ‘limited capability for work’ no longer qualify for additional entitlement due to ill health or disability.
The key point is that incapacity-related claimant numbers rose to exceptionally high levels 20 to 30 years ago and have largely stayed there. Though the pandemic led to an increase in incapacity numbers, this was from an already very high base.
We use the incapacity-related claimant numbers as the basis for our estimates of hidden unemployment in preference to Labour Force Survey data on the number of working-age adults who are economically inactive because of long-term sickness or disability. This is because the claimant numbers are a precise administrative count (within the limits of benefit rules) and therefore allow local-area analysis that is not possible with Labour Force Survey data that is subject to sampling error.
The geography of incapacity claims
Incapacity claimants are far from evenly spread across the country. This is illustrated in Figure 2, which shows the share of all adults of working age (16–64) claiming incapacity-related benefits in each lower-tier local authority across Britain. The numbers here and subsequently combine Employment and Support Allowance claims (plus a residual small number on predecessor benefits) in August 2021 and Universal Credit entitlements on the basis of limited capability to work in November 2021. Incapacity-related benefit claimant rate, by district, 2021. Sources: DWP and ONS.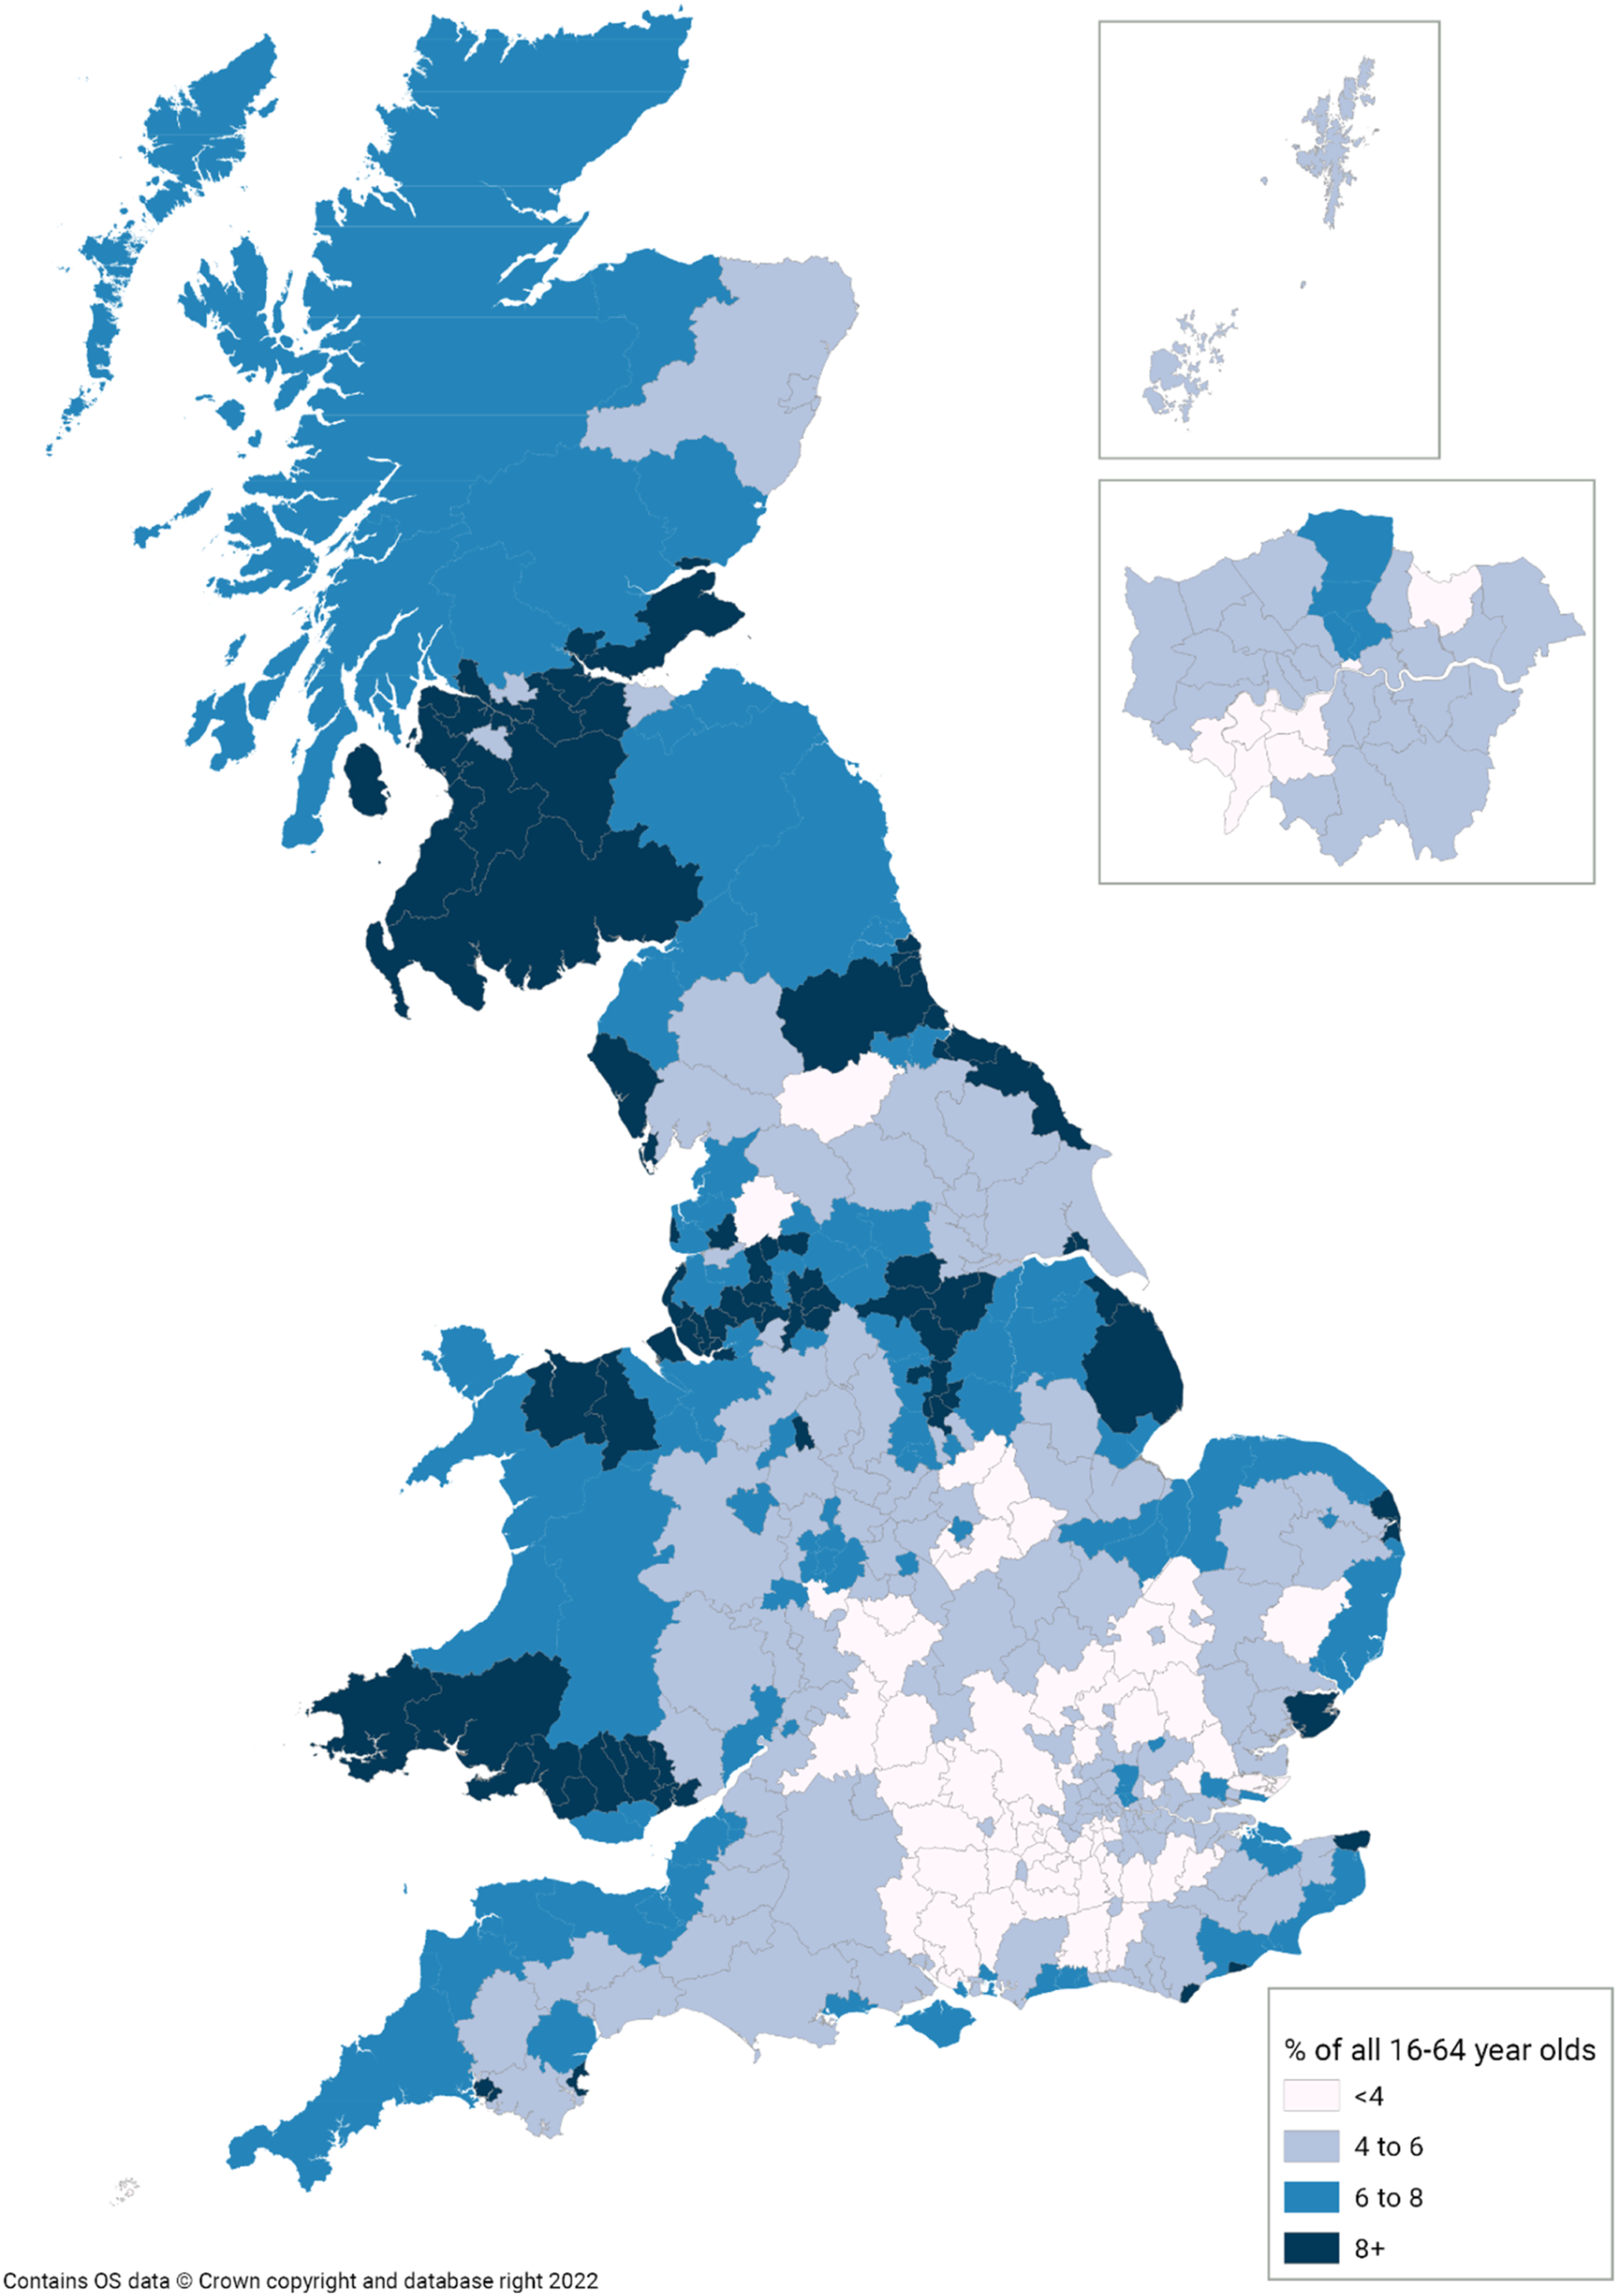
There are stark differences across Britain. In large parts of southern England outside London the incapacity claimant rate is low, typically 2–3 per cent. By contrast, the claimant rate is far higher – sometimes exceeding 10% – in parts of South Wales, Merseyside, North East England and Clydeside. A number of coastal districts also have high claimant rates. Anyone familiar with the economic geography of the UK will see a pattern here, with the places with the weakest local economies typically having the highest incapacity claimant rates.
Incapacity benefit claimant rate a , 2021, top 20 districts.
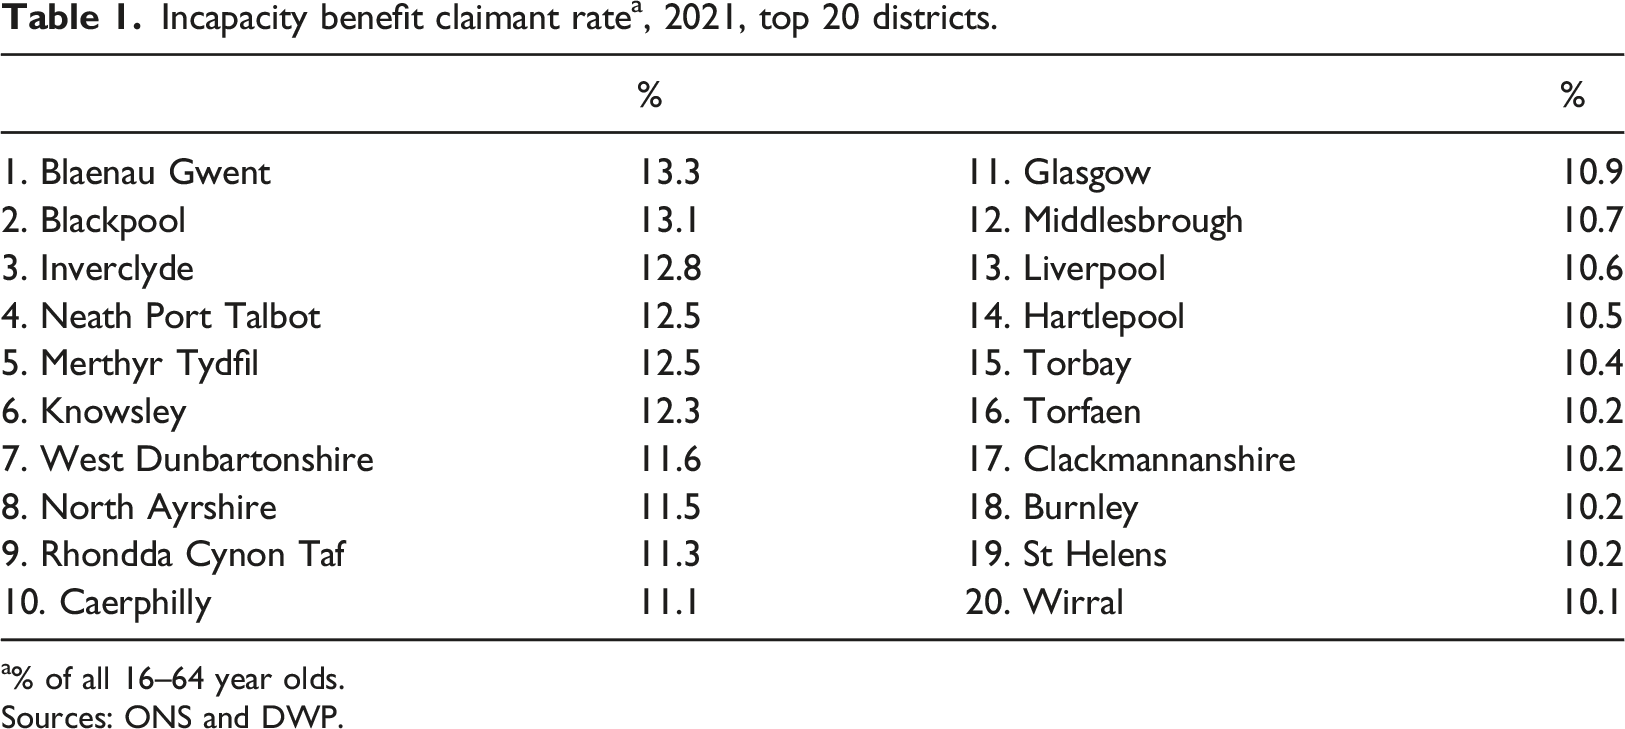
a% of all 16–64 year olds.
Sources: ONS and DWP.
The point here is that alongside the quite large numbers that claim unemployment-related benefits there is a further, larger group out-of-work on incapacity-related benefits and they are far from evenly spread across the country.
Measuring hidden unemployment: Methodology
There is no official definition of ‘hidden unemployment’. The one we use here, in the context of incapacity-related benefit claimants, is those who might reasonably be expected to have been in work in a genuinely fully-employed economy.
This definition stops well short of including all those who claim incapacity benefits. Clearly, there are many whose health problems or disabilities would prevent them from working in all circumstances. But this definition also goes beyond just those incapacity claimants who say they would like a job or are already looking for work. Surveys and in-depth interviews show that in practice many incapacity claimants give up hope of returning to work as their duration out of the labour market increases, not least because they see their chances of finding work as slim (Alcock et al., 2003; Beatty et al., 2009).
The key to deploying this definition of hidden unemployment among incapacity claimants is in quantifying what would have happened in a genuinely fully-employed economy. Here it is helpful that parts of the UK have operated at or close to full employment for much of the last two or three decades. We can therefore use the incapacity claimant rates in these areas as a guide – or ‘benchmark’ – to what might be possible if there was full employment elsewhere in the country. We use seven counties in southern England – Berkshire, Buckinghamshire, Hampshire (minus Portsmouth and Southampton), Hertfordshire, Oxfordshire, Surrey and West Sussex – to provide this fully-employed benchmark. In late 2021 in this part of southern England the average unemployment benefit claimant rate, expressed as a share of the total working-age population, was just 2.6% and the equivalent incapacity claimant rate 3.8% (Office for National Statistics, 2022c).
There is a complication. Apart from labour market conditions, the health of the population also varies from place to place and the poorer average levels of health tend to be in the less prosperous places where incapacity claimant rates are highest. Other things being equal, we would therefore expect incapacity claimant rates to be higher in these parts of Britain. It is therefore necessary to adjust the benchmark for underlying geographical variations in the extent of incapacitating ill health and disability. Excesses over this adjusted benchmark can then be deemed to be a form of hidden unemployment.
The fundamentals of this methodology are tried and tested. In its earlier applications (Beatty and Fothergill, 1996, 2005) data on ‘permanent sickness’ from the 1981 Census, before the surge in incapacity numbers, was used as the benchmark for the underlying differences between places in the extent of incapacitating ill health or disability among the working-age population. The adjusted benchmark was therefore the incapacity claimant rate in the fully-employed part of southern England plus the difference between the 1981 permanent sickness rate in each district and the permanent sickness rate in fully-employed southern England.
The problem with 1981 data on permanent sickness is that it has become dated. A benchmark rooted in more recent data on health differentials was piloted in a 2017 report (Beatty et al., 2017). As a guide to differences in the incidence of incapacitating ill-health between places this used the ratio between the Standardised Mortality Rate (SMR) in each district (Office for National Statistics, 2022c) and the SMR in the fully-employed part of southern England. If the SMR in a given district was 20% above the level in fully-employed southern England the assumption was that the incapacity claimant rate would be 20% higher. The robustness of the revised method was tested against the original benchmarking method and for Britain as a whole in 2017 this revised method generated an estimate of hidden unemployment that was just 35,000 (or 4%) above the previous method.
SMRs measure the death rate in each area after adjusting for the age structure of the local population and are widely regarded as the single most objective measure of health. Ultimately, they provide only a proxy for variations in incapacitating ill health or disability from place to place but they do offer a guide that is unaffected by benefit status, which is a clear risk affecting survey-based data on self-reported health. In the estimates presented here we use the revised method based on SMRs. We also use SMRs for 2019 to avoid distortions arising from the Covid pandemic. This is a snap-shot at a point in time, of course, hiding what can be shifts in healthy life expectancy at the local level (Walsh et al., 2022).
In summary, our estimates of hidden unemployment amongst incapacity claimants take account of what has been shown to be possible in full-employed parts of Britain and adjust for underlying local differences in the extent of incapacitating ill health or disability.
Nevertheless, there are limitations to the data and it needs emphasising that the hidden unemployment figures we present are estimates. Crucially, they are based on benchmarking against claimant rates and health data in a swathe of southern England, albeit a prosperous part of the UK that should offer a helpful guide. What is important is not the precise figures but the orders of magnitude, the trends through time and the local and regional geography. The strength of the estimates is that they are based on publicly available data collected on a systematic basis for all local authorities across Great Britain, and as such no ethical concerns were encountered for this desk-based study which nevertheless underwent approval under University Ethics procedures.
The extent of hidden unemployment
National overview
For Great Britain as a whole in the autumn of 2021 the benchmarking method used here points to hidden unemployment among incapacity claimants of 790,000. These are the claimants who might reasonably be expected to have been in work in a genuinely fully-employed economy. The figure is an estimate and it needs to be emphasised again that there is no suggestion here that the claims are in any way fraudulent or that the health problems or disabilities are anything less than real.
This large number of hidden unemployed needs to be seen in the context of the headline GB total of 2.57 million out-of-work on incapacity benefits at this point in time. In effect, our figures suggest that almost 1.8 million men and women would remain on incapacity benefits even if there were full employment across the whole country. The hidden unemployed are a minority of incapacity claimants (around 30%).
Hidden and visible unemployment, GB 1997–2021.
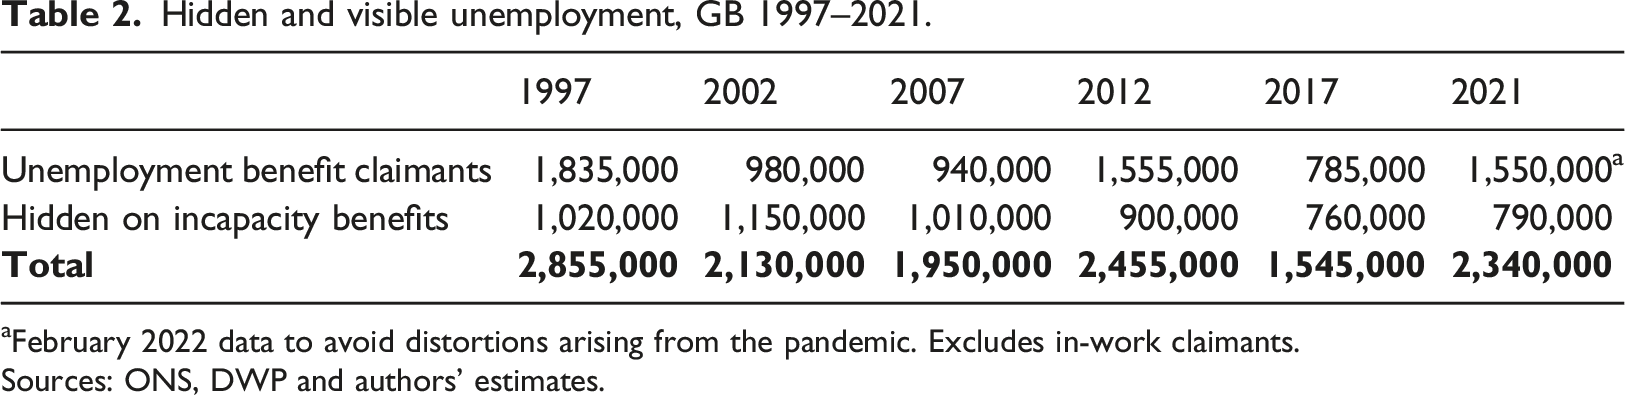
aFebruary 2022 data to avoid distortions arising from the pandemic. Excludes in-work claimants.
Sources: ONS, DWP and authors’ estimates.
The most important point to note is that hidden unemployment among incapacity claimants is estimated to have remained substantial throughout this long period – never less than three-quarters of a million. Between 2002 and 2017 the numbers did fall by around 400,000 but, at 790,000, hidden unemployment on incapacity benefits in the autumn of 2021 is estimated to be a little higher than in 2017. The previous reduction in hidden unemployment appears to have stopped, and at a still high level.
During the 2000s, when claimant unemployment was low, the estimated hidden unemployment on incapacity benefits exceeded the number of unemployment benefit claimants. In 2017 the numbers were fairly evenly matched. More recently the claimant unemployment numbers have moved ahead. Adding the ‘visible’ unemployed on unemployment benefits to the ‘hidden’ on incapacity benefits points to numbers that have remained around or above two million throughout this period except in the mid-2010s.
Prior to 2021, when the unemployment recorded by the Labour Force Survey exceeded the claimant count, this additional group can be added to provide a more complete picture. With their inclusion, total unemployment rises to 3.2 m in 1997, 2.6 m in 2002, 2.6 m in 2007, 3.4 m in 2012 and 2.3 m in 2017 (Beatty et al., 2017).
Regional differences
Estimated hidden unemployment on incapacity benefits, 2021.
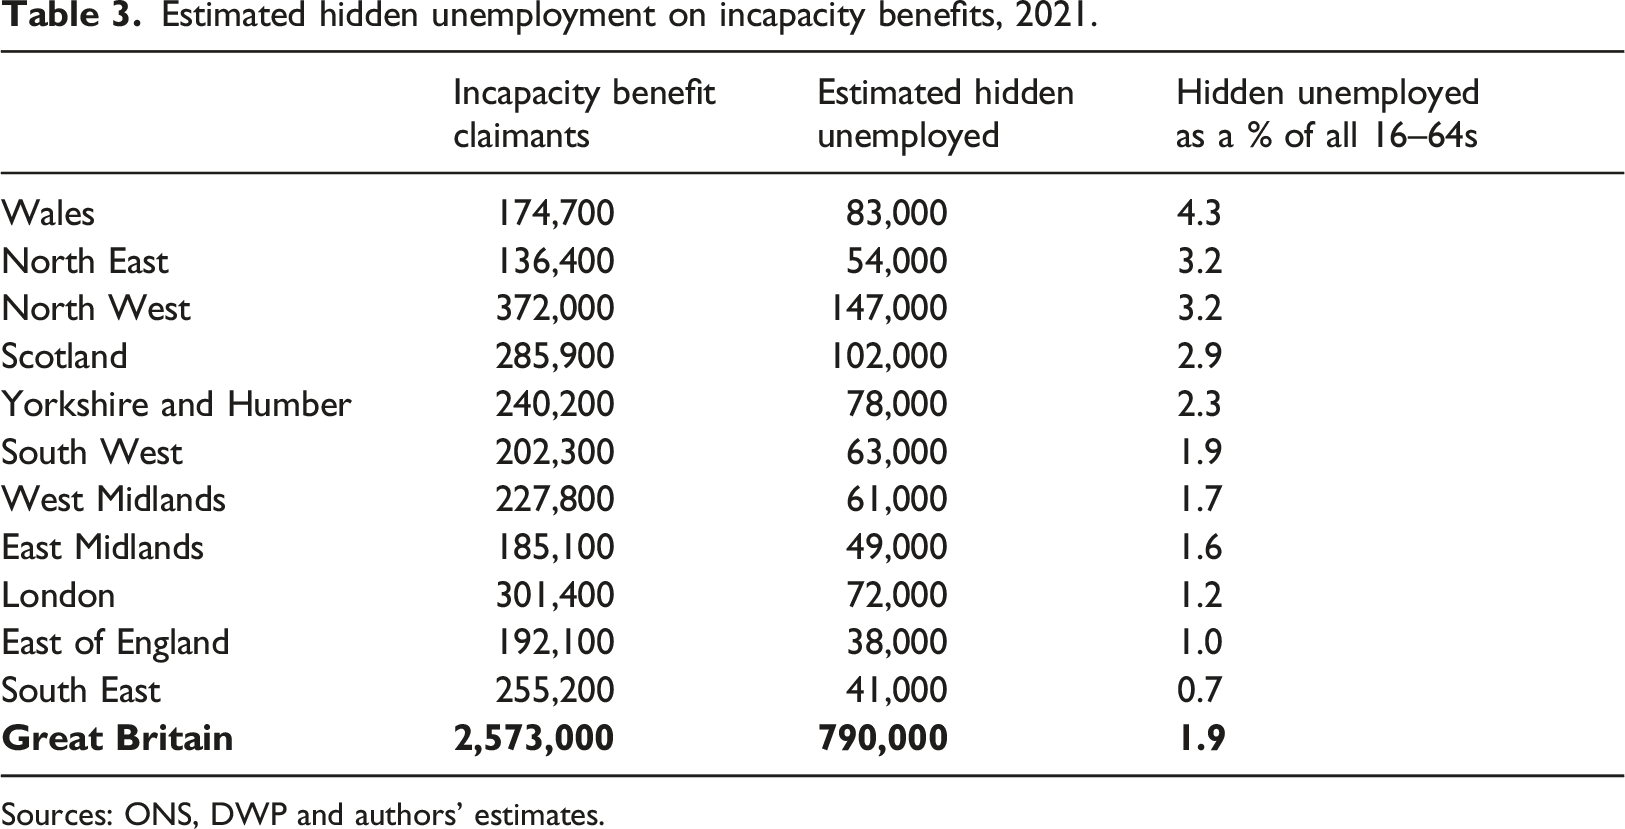
Sources: ONS, DWP and authors’ estimates.
Share of unemployment hidden on incapacity benefits, 2021.
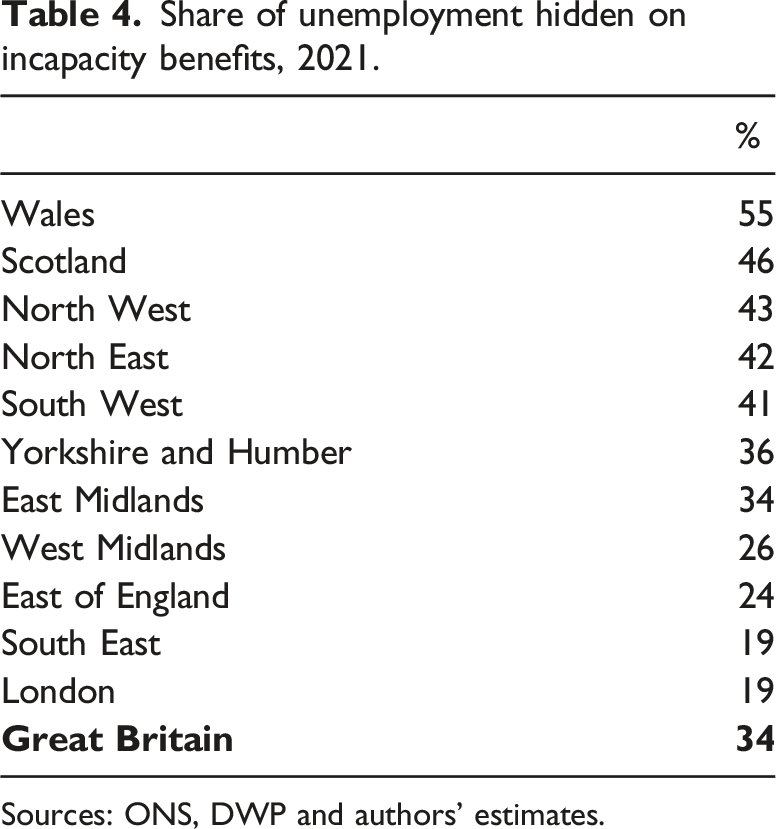
Sources: ONS, DWP and authors’ estimates.
The local picture
Figure 3 shows the estimated rate of hidden unemployment on incapacity benefits by lower-tier authority across Britain. The map shows how hidden unemployment remains a feature of substantial parts of the country. Parts of South Wales, North Wales, Central Scotland, North East England, South and West Yorkshire and the Liverpool, Manchester and Birmingham areas stand out as having high levels. A number of districts covering seaside towns also have high levels. On the other hand, there is little to suggest that hidden unemployment is more than a marginal issue in large parts of southern England outside London. Some parts of northern England, such as much of North Yorkshire, also fall into this category. Estimated hidden unemployment on incapacity benefits, by district, 2021. Sources: DWP, ONS and authors’ estimates.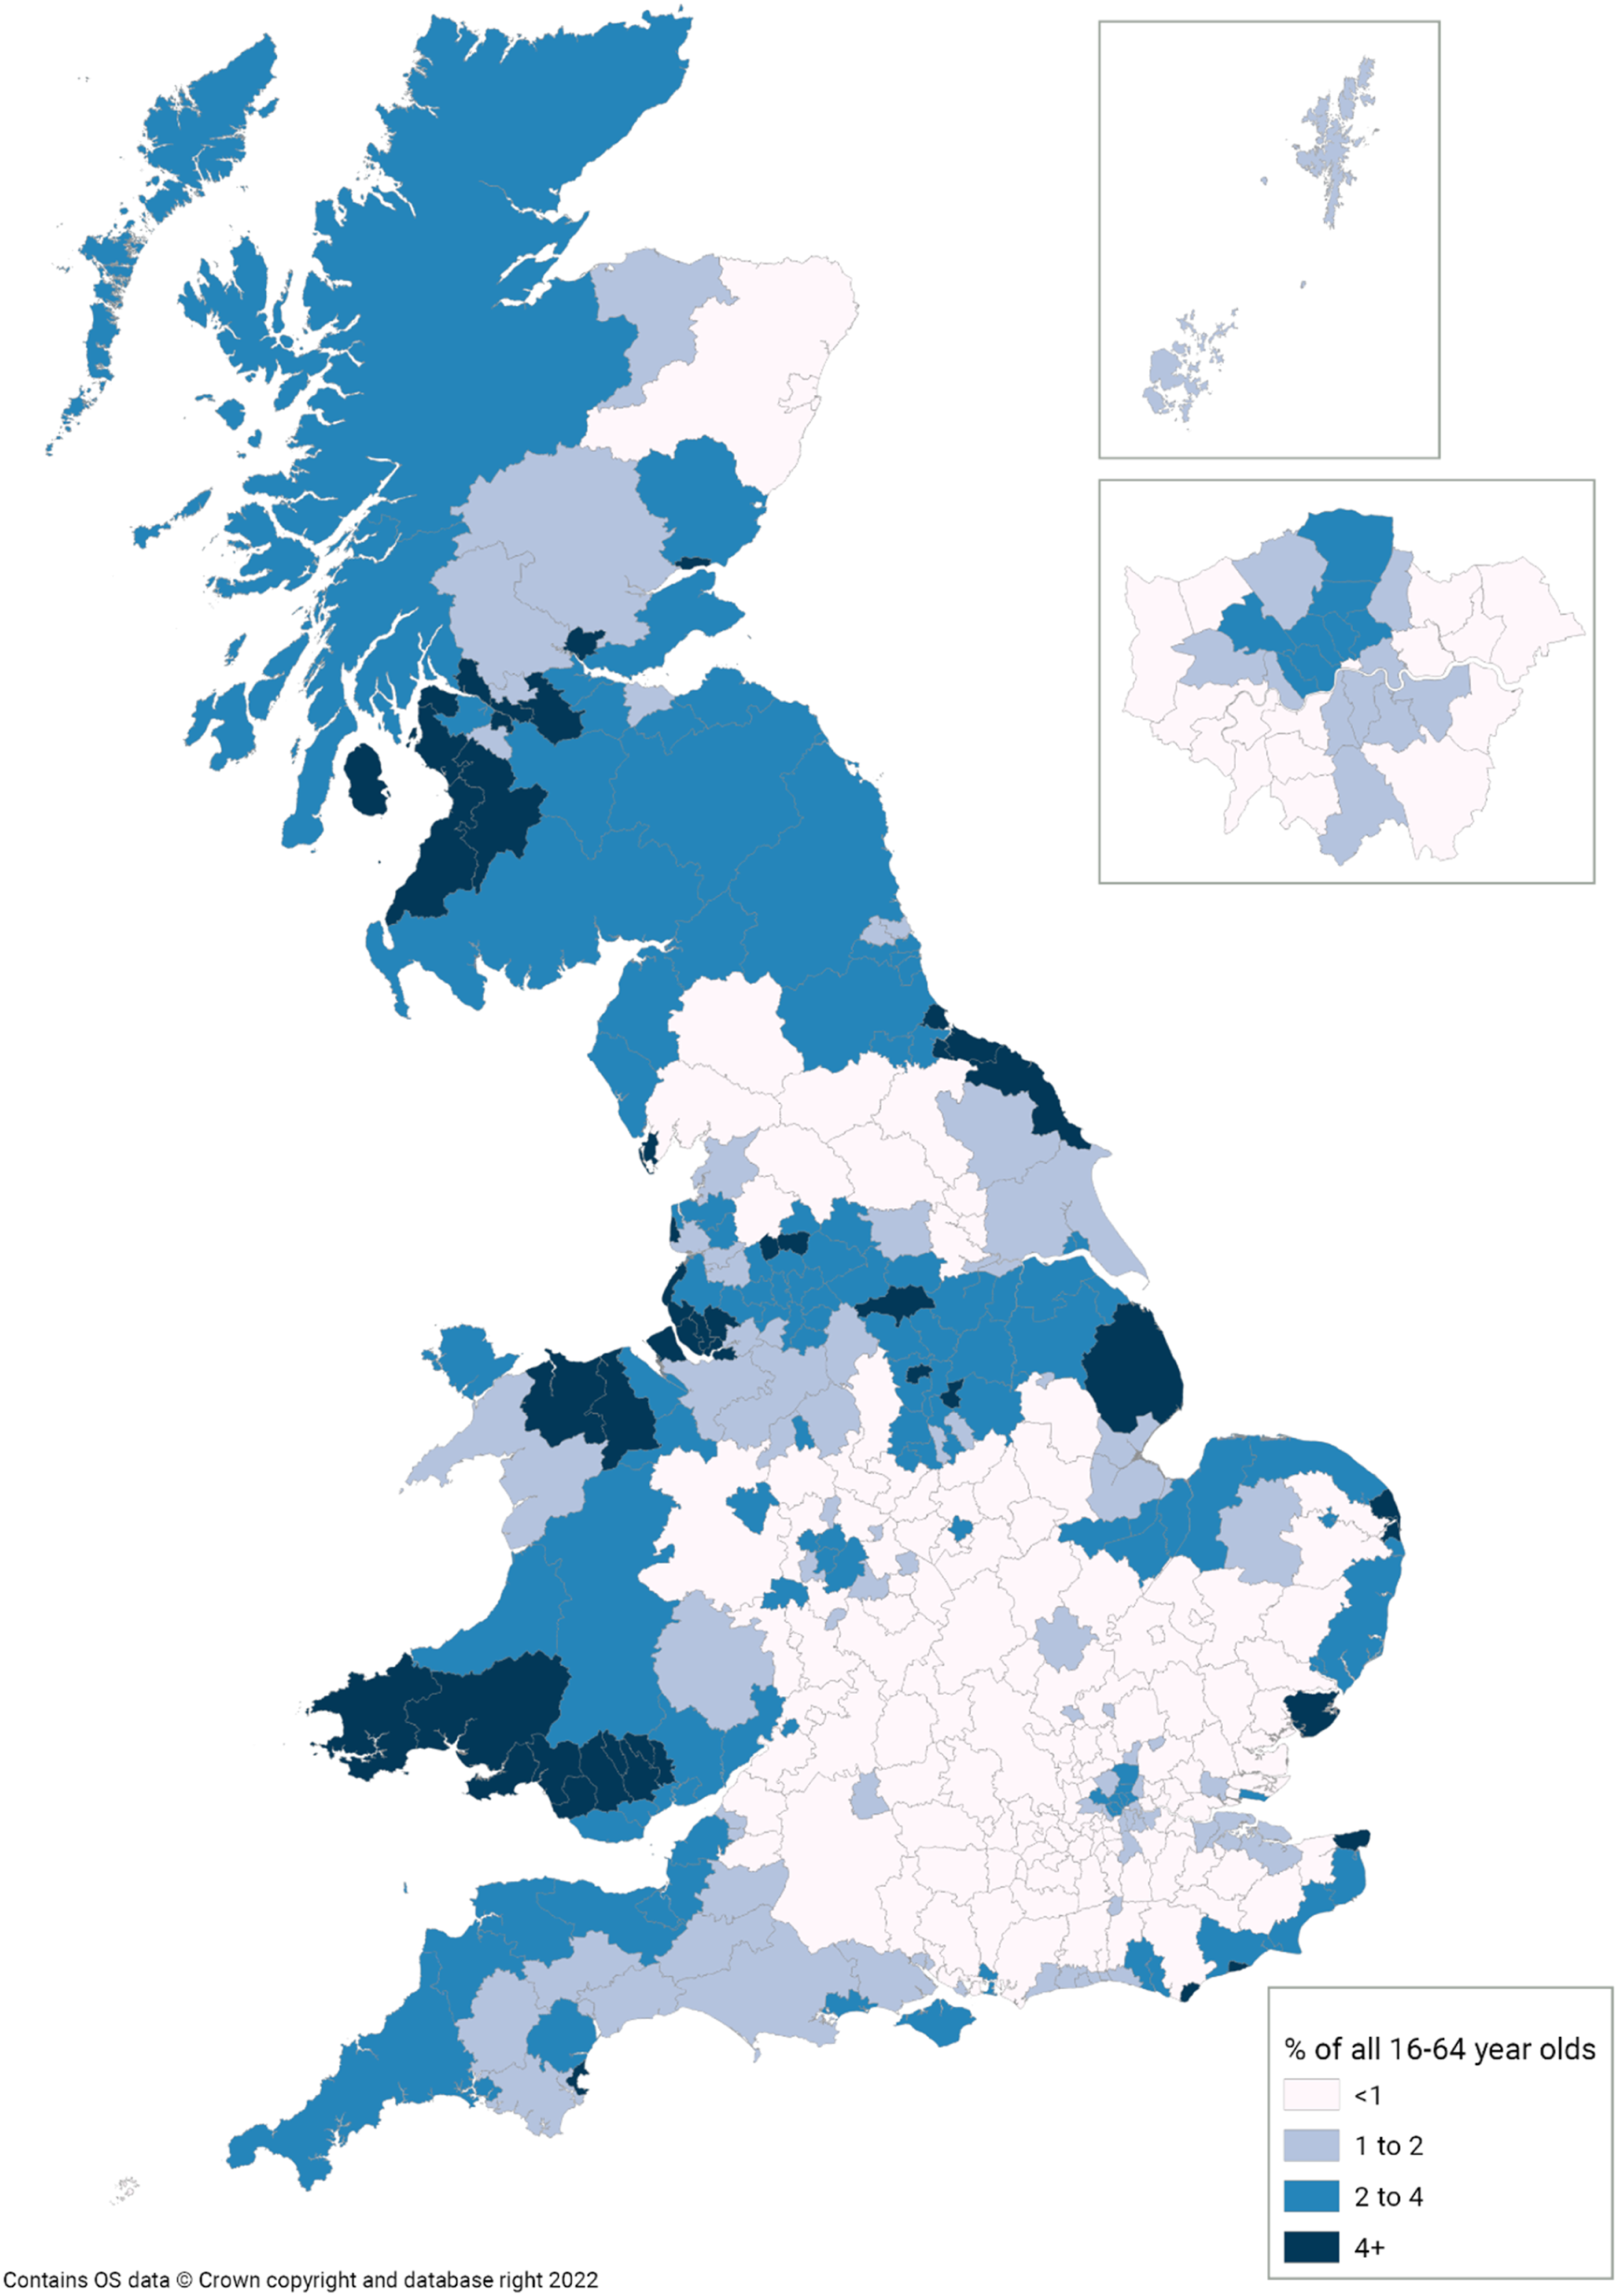
The local authorities with the highest hidden unemployment rates are mostly those with the highest overall incapacity claimant rate (see Table 1 earlier). Blaenau Gwent in Wales, at 7.9% of all adults of working age, again tops the list. Overall, 20 local authorities are estimated to have a hidden unemployment rate of at least 5% whereas in over 100 local authorities the rate is below 0.5%.
What the data shows, in effect, is that in the wake of the Covid pandemic there are really three different Britains. The first is Full Employment Britain, where total unemployment (claimant plus hidden on incapacity benefits) accounts for below 4% of all adults of working age. This part of Britain covers 141 unitary and district local authorities has a population of 20 million – rather less than a third of the GB total. Total unemployment here averages just 2.8%, of which only 14% is hidden.
The second is Middling Britain, where total unemployment is between 4 and 8%. This covers 158 local authorities and 31 million people – approaching half the GB total. Total unemployment here averages 6.0%, of which 34% is hidden.
The third is High Unemployment Britain, where total unemployment is more than 8%. This covers 64 local authorities and 14 million people – around one-in-five of the GB total. Total unemployment here averages 9.4%, of which 42% is hidden.
Share of total unemployment hidden on incapacity benefits, late 2021/early 2022.
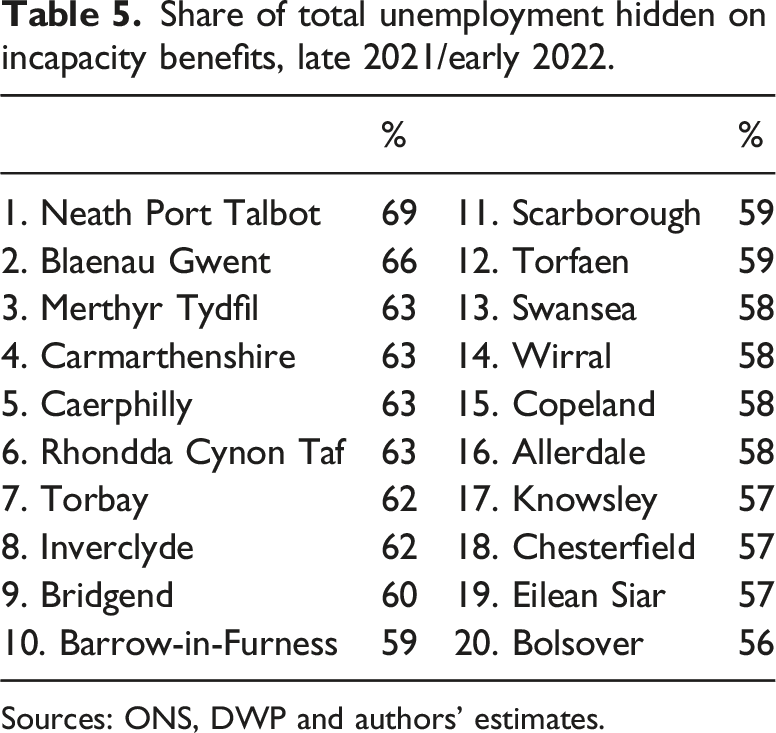
Sources: ONS, DWP and authors’ estimates.
London is the important exception to the rule that high claimant unemployment and high hidden unemployment go together. A number of London boroughs have high claimant unemployment but this is not matched by high numbers estimated to be hidden unemployed on incapacity benefits. Given that the likelihood of claiming incapacity benefits rises with age and that London has a markedly younger workforce than the rest of the country, the lower incapacity claimant rate in London is not entirely surprising. The effect is that much more of London’s unemployment is ‘visible’ in the claimant unemployment figures.
The roots of persistence
The evidence here shows that substantial hidden unemployment on incapacity benefits, first documented in the UK in the 1990s and 2000s, has persisted through to the early 2020s. This is not what policymakers had intended or anticipated. It is worth commenting on the likely causes of this persistence.
Let us begin with the original increase in incapacity numbers. As we noted earlier, there can be little doubt that the scale, timing and geography of the increase points strongly to the key role of deindustrialisation and it is impossible to explain the increase in health terms alone. For a while during the late 1980s there does seem to have been encouragement from Jobcentre officials to move from unemployment benefits to incapacity benefits and thereby lower the politically embarrassing high levels of recorded unemployment, but thereafter the opposite was true as administrative reforms which reduced entitlement, eligibility and increased conditionality were introduced to try to bring incapacity numbers down.
The key point during the years of deindustrialisation is that the jobless who suffered from health problems or disabilities were generally able to claim incapacity benefits instead of unemployment benefits. Many people pick up injuries over the course of their working life and there is the effect on physical capabilities of illness, disease and simply getting older. On top of this, mental health conditions including anxiety and depression are widespread. In practice, therefore, in the wake of deindustrialisation many of the unemployed with health problems or disabilities were able to qualify for incapacity benefits and there was a modest incentive to do so because in many circumstances the benefit entitlement was a little higher and subject to lower levels of conditionality.
In older industrial Britain, where the increase took root, there has generally been progress in regeneration and new jobs have been created. This has helped bring down hidden unemployment from the peak levels in the early 2000s and, as we noted, the evidence from Webster et al. (2010) and McVicar (2013) is that the biggest falls in incapacity numbers have been in the places where the claimant rate was formerly highest. It helped that the industrial workers made redundant in the closing part of the last century have now nearly all dropped out of the figures into retirement.
The Centre for Cities (2023) nevertheless notes that ‘the scars of deindustrialisation are still visible on today’s labour market’. As the figures presented here confirm, it is the older industrial cities and towns of the North, Scotland and Wales that still dominate the list of places with the highest hidden unemployment. Seaside towns – the other group of places with high hidden unemployment – have generally not lost jobs on the scale of older industrial Britain but their economies too have been under pressure from changing patterns of tourism and their peripheral location does not make it easy to attract new businesses. Their distinctive housing stock – former guest houses converted into cheap flats for example – can also draw in claimants from surrounding areas and further afield. Their generally older population tends to boost incapacity numbers too.
Partly what we appear to be observing in all these places is a continuing imbalance between labour demand and labour supply. In difficult local labour markets, the competition for jobs squeezes out adults with physical or mental ill health or disabilities. They know they have limitations on the jobs they are able to undertake and they also know that they are unlikely to be employers’ first choice. Women are just as likely to be marginalised in this way as men, particularly as labour markets that were once highly segmented by gender have increasingly merged into one, even for example in the former coalfields (Beatty, 2016).
What we are also probably observing is a mismatch between many of the jobs on offer and the capabilities of many incapacity claimants. As the Centre for Cities (2023) notes, ONS data shows that people who previously worked in the wholesale and retail trade, in transport, construction and manufacturing are the most likely to be economically inactive due to poor health. Many of the jobs in these sectors can be physically demanding and more likely to impair health than most white-collar jobs, and they are harder to carry out while managing long-term sickness. These essentially manual jobs form a larger component of the economy of many of Britain’s older industrial towns (Beatty and Fothergill, 2020), in contrast for example to much of London and South East England, and the jobs are often less well-paid, which reduces their attractiveness.
It is nevertheless important to be clear about the nature of hidden unemployment on incapacity benefits. As we have emphasised, the health problems or disabilities are not necessarily anything less than real nor the benefit claims in any way fraudulent. Also, the hidden unemployed on incapacity benefits are not necessarily active jobseekers – indeed, the majority have given up looking for work. The hidden unemployed we identify are those who could reasonably be expected to have been in work in a genuinely fully-employed economy.
Concluding remarks
We set out in this article to establish whether official measures adequately reflect the scale and geography of unemployment in the UK. The conclusion we reach is that there remains substantial hidden unemployment on incapacity benefits in large parts of the country. In simple terms, the official figures stop short of providing the full picture.
In estimating the scale of hidden unemployment among incapacity claimants we have taken account of what has proved to be possible, in terms of claimant rates, in the parts of Britain operating at or close to full employment and we have also adjusted for underlying differences in health between places. The novel method we have used, incorporating Standardised Mortality Rates as a guide to underlying local variations in health, provides a step forward from earlier estimates based on now outdated Census figures and delivers credible estimates.
In terms of numbers, estimated hidden unemployment on incapacity benefits appears to be down on peak levels of 15–20 years ago but at just under 800,000 remains very high. The hidden unemployed are also concentrated in the least prosperous parts of Britain rather than spread across all areas. Older industrial areas and some seaside towns are worst affected. These numbers, and their geographical distribution, are sufficiently large to influence the way the contemporary UK labour market needs to be understood. There may (in early 2023 at least) be full employment in some places, mostly in southern and eastern England, but as a general description of the UK labour market and of the less prosperous half of the country in particular ‘full employment’ is misleading. The hidden unemployment figures show that there is still some way to go.
That said, it would be wrong to assume that incapacity claimants are a ready supply of labour waiting to be tapped. Our estimates suggest that perhaps no more than a third might be regarded as hidden unemployed and, as we noted, unlike most of the claimant unemployed they tend not to be active jobseekers. Even though they often have many years of previous work experience their present-day detachment from the world of work is often considerable in terms of time away from paid employment and ability to undertake the physically demanding, stressful or lower-paid jobs often on offer. In practice, the challenge may be to reduce the numbers dropping out of the labour market – to stem the onflow to incapacity benefits and to facilitate an early return to work – as much as to move existing incapacity claimants back into work.
Taking the long view, improvements in the health of the working-age population would make it easier to reduce the numbers claiming incapacity benefits but this is a wide-ranging societal challenge. Furthermore, if the underlying problem in the places with the highest incapacity claimant rates is a deficient demand for labour, as we have argued, improvements in health might only help at the margins.
A reduction in incapacity claimant numbers needs to involve employers at least as much as claimants. For too long, employers have been too ready to discard men and women with health problems and/or disabilities. They need to be more flexible about expectations and requirements, and more open-minded about potential employees who have health problems but still have skills and abilities to offer. The benefits system too needs to be flexible enough to cope with people with fluctuating conditions and concerns about the suitability of new jobs, who are likely to fear moving into work because they might never be able to re-access their previous benefit entitlement.
It is also important that the right jobs are created in the right places. Hidden unemployment is concentrated in many of the least prosperous parts of the country and it is these areas that need an increase in job opportunities, especially beyond the manual and sometimes menial low-paid work that offers an implausible or unattractive way forward for those with health problems or disabilities. This points towards local and regional economic development, or what has recently become known as ‘Levelling Up’. There is actually a lot of positive experience, accumulated over many decades, about how to deliver successful Levelling Up even if it has too often been the case that genuine progress has been offset by continuing job losses from older industries. Investment in infrastructure, support for business, investment in skills and in R&D all have roles to play. The reality is that hidden unemployment on incapacity benefits is unlikely to fall very much unless there are appropriate jobs available in the places where claimants live.
Footnotes
Acknowledgements
The authors would like to acknowledge David Leather for his support in generating the maps used within this paper and Tony Gore, in particular, for his contribution to the series of reports that this paper draws upon. For the purpose of open access, the authors have applied a Creative Commons Attribution (CC BY) licence to any Author Accepted Manuscript version arising from this submission.
Declaration of conflicting interests
The authors declared no potential conflicts of interest with respect to the research, authorship, and/or publication of this article.
Funding
The authors disclosed receipt of the following financial support for the research, authorship, and/or publication of this article: This work was supported by the Research England - Enhancing Research Culture Fund.