
Abstract
Against the background of strong growth in tertiary education globally, this paper documents the continued expansion of the United Kingdom’s higher education sector in the twenty-first century and examines the impact which the British tradition of ‘going away to university’ has been having on both the receiving and sending ends of this process. For each of the UK’s 379 local and unitary authorities, it compares the numbers of modal undergraduate age (19–21 year olds) with the number that would have been living there if the late school-age population (16–18 year olds) had merely aged in place. This approach is applied initially to 2019, with the findings then being compared with those for 2001, revealing that this migration funnels school leavers into a relatively small number of university cities and towns containing up to four times as many 19–21s as 16–18s, while siphoning off over 30% of school leavers from some of the main recruiting grounds–a pattern that has intensified since 2001. This raises questions about the future scale and nature of this process and its implications for local economies, given the current questioning of role of higher education in the UK and developments such as Brexit and the COVID-19 pandemic.
Keywords
Introduction
In recent decades the United Kingdom (UK), like many other countries around the world, has experienced a substantial increase in numbers continuing in education beyond secondary level. In the UK case, the vast majority of this growth has taken place in the higher education (HE) sector rather than via the more vocationally-oriented further education (FE) route, driven by the 1992 decision to grant university status to many former polytechnics and colleges and by the government’s 1999 adoption of a HE participation rate target of 50% of school leavers (Augar Report, 2019; Willetts, 2021). Given the tradition of students ‘going away to university’ (with 75% quitting their parental homes and over half these moving more than 90 km according to Donnelly and Gamsu, 2018), this growth has had major consequences for the cities and towns on the receiving end of this process. In both the media and academic literature, particular attention has been given to some of the more negative effects of this phenomenon, encapsulated in the somewhat pejorative term ‘studentification’ which – voted BBC Word of the Year in 2002 – refers to the conversion of traditional family neighbourhoods into ‘student ghettoes’ (Munro and Livingston, 2012; Sage et al., 2012a; Smith et al., 2014b). On the more positive side of the balance sheet are studies assessing the contribution made by students to the local economies in which the HE providers are based, alongside the expansion of university staff numbers and the knock-on effects on the local service multiplier (Goddard and Vallance, 2013; UPP Foundation, 2019).
The underlying purpose of this paper is to examine the local population impacts of rising undergraduate numbers at both the receiving and the sending ends of the ‘going away to university’ phenomenon. As documented by many including Nathan and Urwin (2006), Rae (2013), Cambridge Econometrics (2018), Swinney and Carter (2018) and Townsend and Champion (2020), the years since the Rogers Report (1999) have witnessed a substantial ‘urban renaissance’, especially for some large cities outside south-east England but also smaller cities and towns across the UK. A key question, therefore, concerns the extent to which the urban population revival since the turn of the millennium can be attributed to the expansion of student numbers and how much this has varied between places. Another relates to the impact on the undergraduate recruitment grounds, perhaps most notably on the so-called ‘left-behind places’ at which the current government’s ‘levelling-up agenda’ is primarily targeted (HM Government, 2022; see also Beatty and Fothergill, 2020). There is also the question of the sustainability of this driver of recent urban growth, given the current debate about the future of the HE sector in the wake of developments like Brexit and the COVID-19 pandemic and as prompted by the Augar report (2019) and the government’s subsequent consultation on post-18 education (Secretary of State for Education, 2022).
The present study employs a novel, yet straightforward, approach to gauging the changing scale of the local population impact of ‘going away to university’ migration. It uses the official population estimates for local government areas to compare each place’s number of people of modal undergraduate age (19–21 year olds) with the number that would have been living there if the late school-age population (16–18 year olds) had merely aged in place. This metric is applied initially to 2019, being the latest year before the COVID-19 pandemic struck and disrupted students’ living arrangements, and is then repeated with the equivalent data for 2001, so as to identify the extent and nature of change over the intervening 18-year period. The paper’s first section on results is devoted to identifying the places that gain most from the migration of undergraduate-age people, this being followed by a section identifying the areas experiencing the largest proportionate net losses of school leavers. The concluding section discusses the significance of the results within the context of current uncertainties about the future prospects for HE in the UK. Before this, the paper sets the scene by providing the fuller background behind the study and by going into more detail about its approach.
Background
Higher education (HE) must rank as one of the world’s leading growth industries. According to UNESCO (2022), global enrolment in tertiary education totalled 231 million in 2019, more than double its 100 million in 2000 and almost seven times its 34 million in 1970. High-income countries have contributed substantially to this increase, but generally at a lower rate owing to their earlier start and their generally weaker overall population growth. In aggregate, their 18 million university students in 1970 accounted for around half of all enrolments worldwide then, but despite a trebling to 55 million by 2019 their global share had dropped to just under a quarter by that time. Even so, their numbers have continued to rise since the turn of the millennium, up by 35% between 2000 and 2019 (UNESCO, 2022).
The UK has followed a trajectory very similar to other high-income countries. Its HE sector is big business, generating a total revenue of £36.1 billion in 2019/20 in England alone according to NAO (2022). Following the Robbins Report (1963), the number of UK universities doubled to 45 in 1970 and doubled again to 89 in 2000 in the aftermath of the 1992 decision to grant university status to polytechnics and colleges, reaching 133 by 2018. The precise numbers, however, depend on how the HE providers are defined; for instance, whether federal universities (like London and Wales traditionally) are counted singly or in terms of their constituent elements. The number of separate institutions in the UK submitting data to the Higher Education Statistical Agency rose from 182 for the academic year 1995/96 to 281 for 2020/21 (HESA, 2022), while NAO (2022) reports that 254 HE providers were registered with England’s Office for Students in July 2021.
Student numbers have grown in parallel, albeit with some short-term checks arising from the government’s imposition of recruitment caps at various times and from the changing financial regime relating to student fees, grants and loans. According to UNESCO (2022), the UK’s tertiary enrolments rose from some 600 thousand in 1971 to 1.18 million in 1990, 2.02 million in 2000 and 2.62 million in 2019. Most relevant for the present study is that, according to HESA (2022), undergraduate numbers rose from 1.54 million in 2000/01 to 2.01 million in 2020/21, up by 30%. Also, according to Department for Education (2021), the HE ‘initial participation rate’ – using the OECD definition of the likelihood of an English resident participating in HE by age 30 – had reached 53.4% by 2019/20, up from 41.8% in 2006/07, the first year for which this indicator is available in this form.
This strong growth over the past two decades make now a highly appropriate time to take stock of ‘going away to university’ migration and its population impacts across the UK, just as previous rounds of expansion have generated substantial literatures. The primary focus of such work post Robbins was on regional patterns of student recruitment and graduate migration, linked to economic differences across the UK (e.g. Hoare, 1991; Johnston, 1989; Rees, 1986) – a theme that was developed further after the post-1992 boom by Belfield and Morris (1999), Duke-Williams (2009) and Smith and Sage (2014) who identified a clear ‘conveyor belt’ of student-age population redistribution. By far the most prolific strand of work since the turn of the millennium has been that dealing with the very local-scale effects associated with ‘studentification’ (e.g. Allinson, 2006; Hubbard, 2008, 2009; Kenyon, 1997; Kinton et al., 2016, 2018; Macintyre, 2003; Munro et al., 2009; Munro and Livingston, 2012; Sage et al., 2012a, 2012b, 2013b; and the tranche of studies by Smith, 2002, 2005, 2006, 2008, 2009; Smith et al., 2014; Smith and Holt, 2007; Smith and Hubbard, 2014). At this time, there was also strong interest in the topics of international students and graduate retention, which has continued to the present day (e.g. Carrascal-Incera et al., 2021; Centre for Cities, 2016; Comunian et al., 2017; Corcoran and Faggian, 2017; Faggian et al., 2007; Kollydas and Green, 2021; Sage et al., 2013a).
According to Smith and Jons (2015), however, the subject of internal migration and its impact on population redistribution across Britain has been relatively neglected since the early 2000s, hence this paper’s primary focus on the recent situation and how this compares with that of a couple of decades ago. As mentioned previously, it aims to identify the cities and towns gaining most from ‘going away to university’ migration and how much this has boosted their populations, as well as revealing those places that have taken the biggest hit as a result of it. The ulterior motive is to provide a baseline against which to assess the implications of any future changes in this migration arising from such factors as government decisions on the scale and nature of post-18 education, the willingness of UK-domiciled undergraduates to study at non-local universities and the number of students recruited from abroad.
Data and approach
Previous research has used a variety of data sources to track the UK’s HE-related migration at regional and local scales, including censuses, official estimates and data collected by the Higher Education Statistics Agency (HESA) from universities about the origins of their students. The present study is based entirely on the official population estimates for the UK’s 379 local and unitary authorities (LUAs) as defined in 2020, drawing on their breakdown by single year of age. This source has the advantage over the HESA data in that its methodology allows for the fact that not all students live in the same LUA as their university’s main site, either because of the university comprising more than one campus or because of students living in a nearby LUA and travelling into classes. It also, by definition, covers the whole population, as is needed for gauging the impacts of changes in the numbers of modal undergraduate age.
As mentioned above, the approach adopted for this analysis is to examine the picture in 2019 and then compare it with that in 2001. The year 2019 (rather than 2020 which is the latest year for which data were available at the time of the study) is selected in order to avoid the disruption to students caused by the pandemic-related lockdowns that started in March 2020, while 2001 is the first year for which the full single-year-of-age data are available on a consistent geographical basis across the UK.
The main step is to calculate for each of these LUAs the difference between the number of residents of modal undergraduate age (19–21 at the reference date of 30 June used in the official population estimates) and the number of residents in the three final years of schooling age (16–18). A very large proportion of this difference will be due to the net effect of the ‘going away to university’ migration process, being the balance between the numbers who have moved into a LUA area to pursue their degree courses and those who have left to study elsewhere. The difference can then be related to each LUA’s population to assess the impact of this geographical redistribution of school leavers.
The measures used in this analysis are the following. Initially, its main focus is on the ratio of a LUA’s number of those aged 19–21 to its number of 16–18 year olds, such that a ratio higher than 1.00 represents a situation where the undergraduate-age population outnumbers the late-school-age one, signifying a net ‘excess’ arising from more arrivals than departures. The opposite would be a net ‘deficit’ in the case of the ratio being below 1.00, with more undergraduate-age departures than arrivals, while a ratio of 1.00 (or very close to it given that mortality is extremely small at this age) indicates an equal number of inflows and outflows. The difference between the two age groups can also be expressed in absolute numerical terms, and it is this which will be used to calculate its importance for each LUA’s total population at that particular time. Finally, the change in the difference between 2001 and 2019 can then be related to the change in each LUA’s total population over the intervening 18-year period so as to gauge the scale of the contribution of the former to the latter.
It should be noted that it was a conscious decision to compare the size of the two three-year age groups with data for the same year. The alternative would have been to follow a birth cohort, which for 2019, for instance, would have involved relating a LUA’s number of 19–21s in its 2019 population to its number of 16–18s in 2016. When the two approaches were compared at the outset of the study, there proved to be little difference between their results, this being because the number of 16–18s in any LUA does not alter greatly from year to year (mainly due to the very low level of between-LUA movement during this crucial teaching and examination life stage). The former approach has the advantage of allowing study of the full 18-year period of change back to 2001 rather than needing to focus on 2004 because of having to compare the 19–21s then with the 16–18s in 2001.
The main gainers from ‘going away to university’ migration
This first section of results aims to identify the LUAs that gain most people from ‘going away to university’ migration. This is achieved by reference to the ratio of 19–21s to 16–18s in the population of the LUAs. Then the absolute size of the net gain is related to the total number of residents for the top 10 LUAs in order to gauge the importance of this university-ward movement for each of the principal destinations. This process is undertaken initially for 2019, with comparisons then being drawn with the situation 18 years earlier in 2001, when the policy of raising the HE participation rate to 50% was just getting underway.
The main gainers in 2019
The UK’s local and unitary authorities with at least 25% more 19–21s than 16–18s in their 2019 populations.
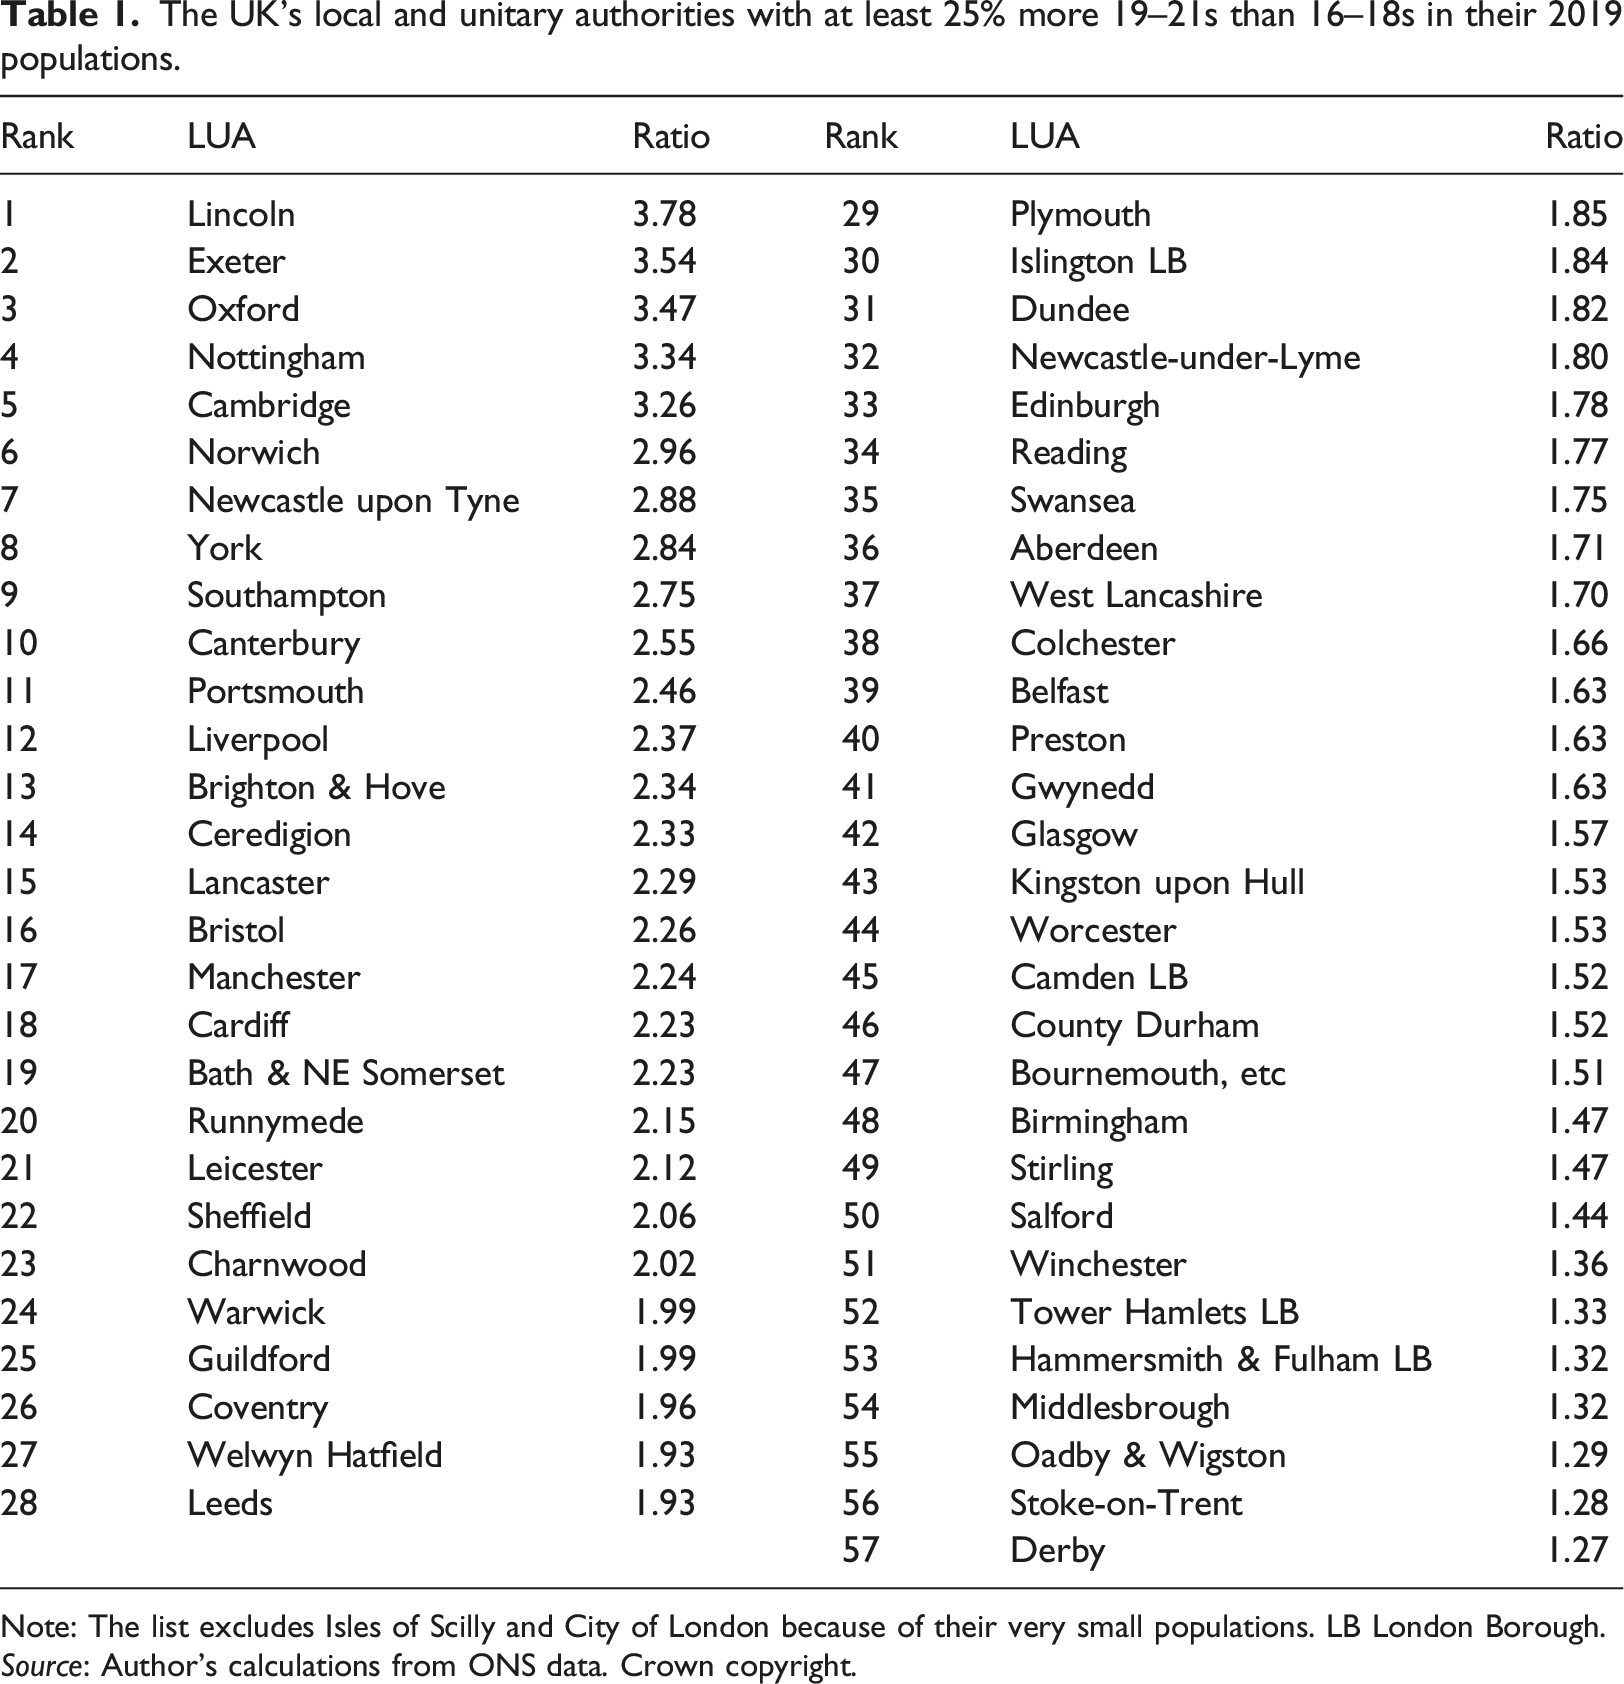
Note: The list excludes Isles of Scilly and City of London because of their very small populations. LB London Borough.
Source: Author’s calculations from ONS data. Crown copyright.
Working down the list in Table 1, there are four other places where the number of 19–21s is more than three times the number of 16–18s: in rank order, Exeter, Oxford, Nottingham and Cambridge. A further five LUAs post ratios of at least 2.50, signifying a gain of at least 150% as a result of this net movement: Norwich, Newcastle upon Tyne, York, Southampton and Canterbury. The next 18 places in the first column of the table display ratios of over 1.90, meaning around a doubling of numbers or more. It is not surprising – but comforting in terms of the approach used here – that all these 28 contain at least one university, usually with this having the same name as the LUA but not always: Ceredigion is home to the University of Aberystwyth, Runnymede has Royal Holloway, Charnwood has Loughborough and Guildford’s is Surrey, while Welwyn Hatfield houses the main campus of the University of Hertfordshire.
The next 29 LUAs in the ranking (shown in the right-hand column of Table 1), spanning the range of ratios from 1.90 down to the 1.25 threshold and denoting places where the 19–21s outnumber the 16–18s by at least 25%, serve to reinforce the image of migration in the late teens being dominated by flows towards university cities and towns. Again, most of these places contain universities of the same name, but not all. Among the latter are four London Boroughs (labelled LB) that are home to some of the UK’s most prestigious universities and their halls of residence, while Newcastle-under-Lyme has Keele University, Gwynedd has the University of Bangor and West Lancashire has Edge Hill University.
The UK’s top 10 local and unitary authorities ranked in terms of the relative contribution of the excess of 19–21s over 16–18s to their total 2019 populations (final column).
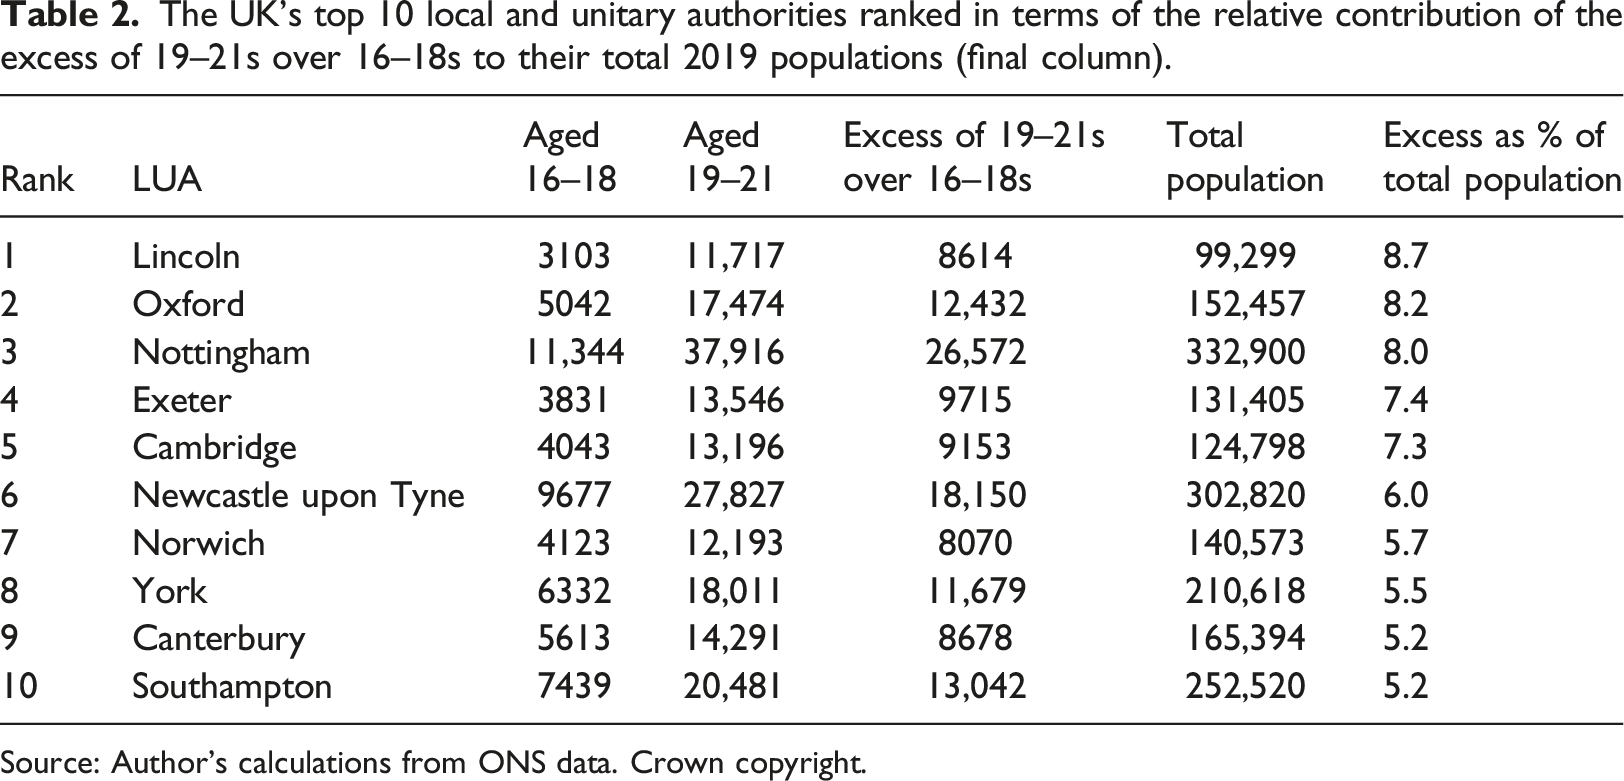
Source: Author’s calculations from ONS data. Crown copyright.
As regards the absolute size of the net gains made by LUAs, the list is somewhat different, this being due to the considerable variation in the total population size of LUAs. Lincoln’s total population of just under 100,000 is relatively small, certainly compared with Birmingham’s 1.14 million and Leeds’ 793,000. On this basis, Nottingham comes top with an ‘excess’ of over 26,500, followed by Leeds, Manchester, Liverpool and Sheffield, all with some 20,000 or more, and then by Newcastle upon Tyne, Bristol, Cardiff and Leicester, all above 14,000. Another seven had at least 10,000 more 19–21s than 16–18s in their populations in 2019: in descending order, Southampton, Oxford, Brighton & Hove, York, Coventry, Edinburgh and Glasgow.
Finally, on a cautionary note, these numbers should not be taken as equating with the total undergraduate enrolments in these LUAs. In the first place, they represent the net difference between the numbers of non-locals taking up HE places there and the numbers of locals moving to other LUAs for their courses. Secondly, they exclude the LUA’s own residents attending their local HEI from their family homes, as well as those who live in a nearby LUA and commute in. Lastly, the numbers can be affected by late teenagers moving for non-study reasons, whether between LUAs or into and out of the UK. Nevertheless, given the fact that all the LUAs identified so far contain universities, it is likely that the vast majority of the ‘excess’ numbers shown in the tables will comprise undergraduates. Therefore, they give a fairly reliable impression of the impact of the ‘going away to university’ process on each place’s demography. This will presumably have been proving especially challenging for the planning of places where this phenomenon is not of long-standing, so the next section adopts the same approach to examine the situation in 2001 and identify the biggest changes over the intervening 18 years.
Change from the situation in 2001
The UK’s local and unitary authorities with at least 50% more 19–21s than 16–18s in 2001.
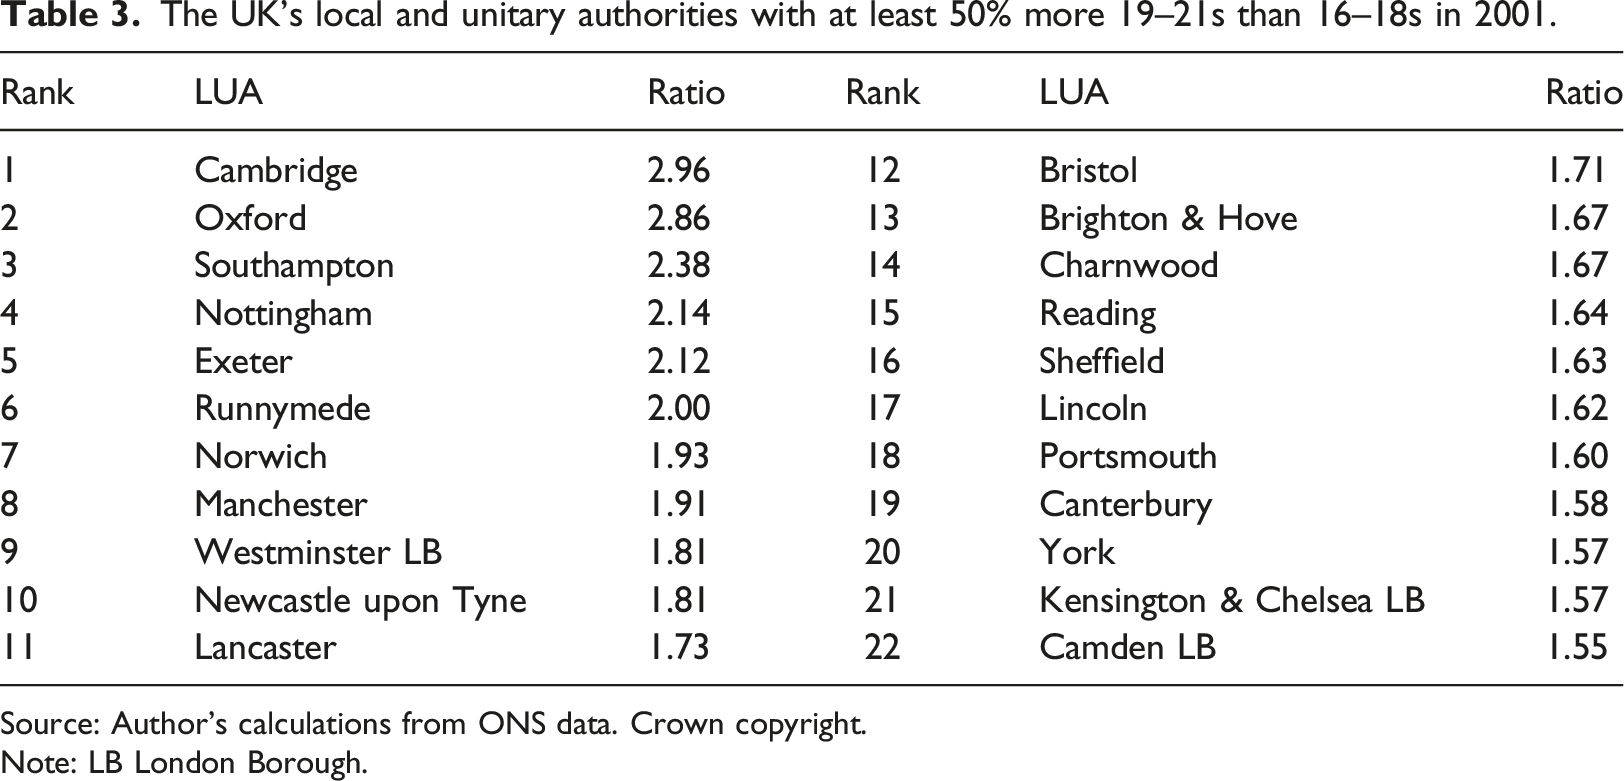
Source: Author’s calculations from ONS data. Crown copyright.
Note: LB London Borough.
Also, the identity of the LUAs most affected by the net gain of undergraduate-age people was somewhat different in 2001, when it was the places with England’s two oldest universities that headed the list. One of the biggest contrasts is the relatively low position of Lincoln, which headed the 2019 ranking but was only in 17th place 18 years earlier. On the other hand, a clear majority (17) of the top 22 in 2001 also featured in the top 22 of 2019 (see Table 1), so even if their relative positions altered somewhat between the two dates there is a fairly strong degree of continuity. The new entries to the list in 2019 were Bath, Cardiff, Ceredigion, Leicester and Liverpool, while the places that had dropped out of the top 22 by 2019 were Charnwood (though only just, being 23rd in 2019), Reading (34th in 2019) and the three London Boroughs (LB) shown in Table 3. The latter change is perhaps the most surprising, but it probably reflects two factors – the slower growth since 2001 in the total number of undergraduate places at the central London universities than for many HEIs across the rest of the UK and the likely reduction since 2001 in the proportion of school leavers moving for work since 2001, for whom central London has traditionally been a strong magnet but less so by 2019 because of more of them going on to university.
The UK’s local and unitary authorities with an upward shift of more than 0.50 in the ratio of 19–21s to 16–18s, 2001–2019.
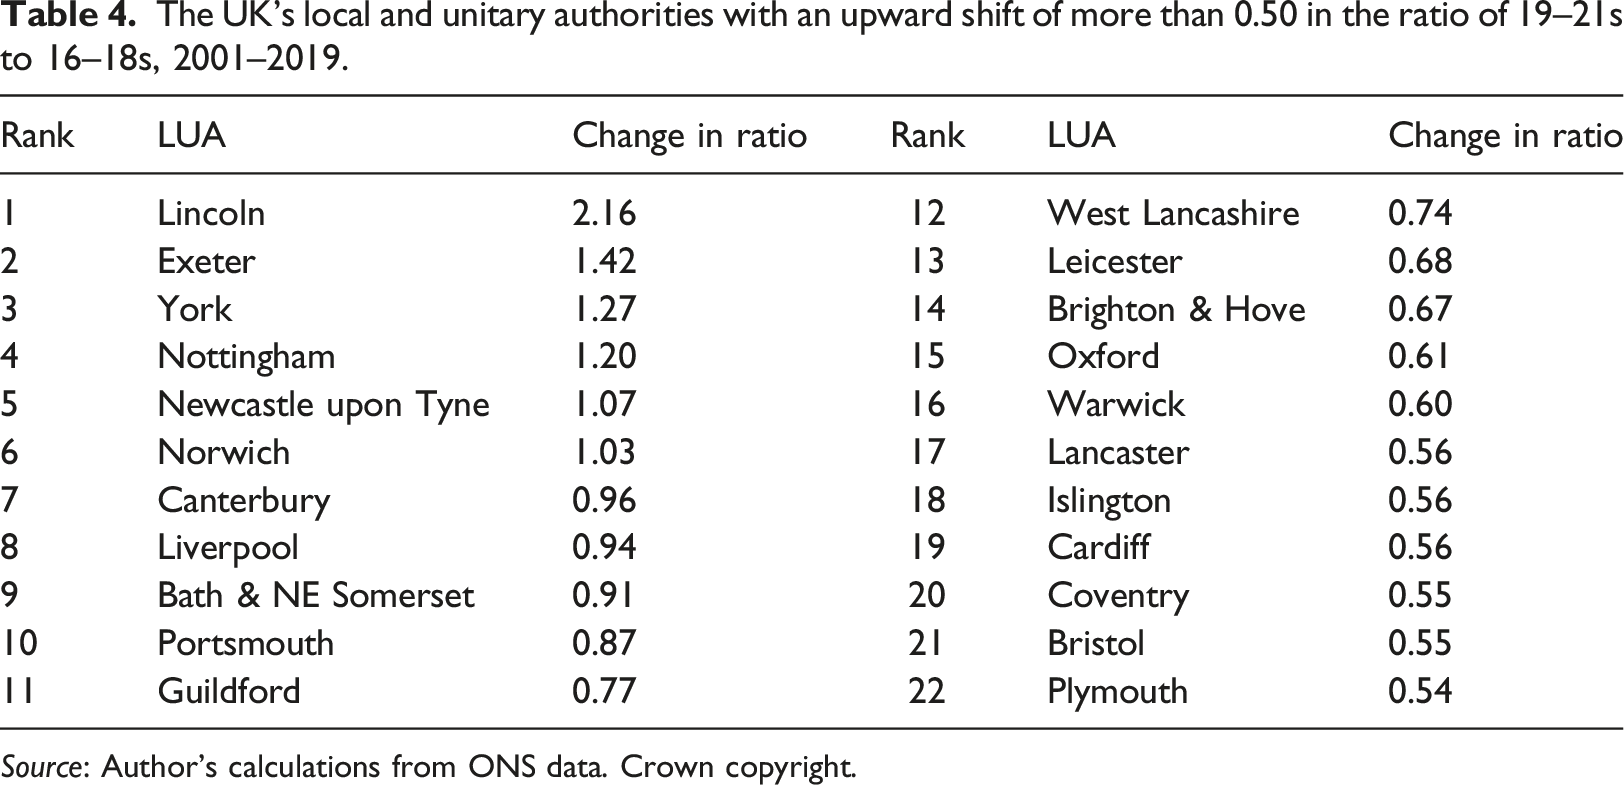
Source: Author’s calculations from ONS data. Crown copyright.
The UK’s top 10 local and unitary authorities ranked in terms of the relative contribution of the excess of 19–21s over 16–18s to their total 2001 populations.
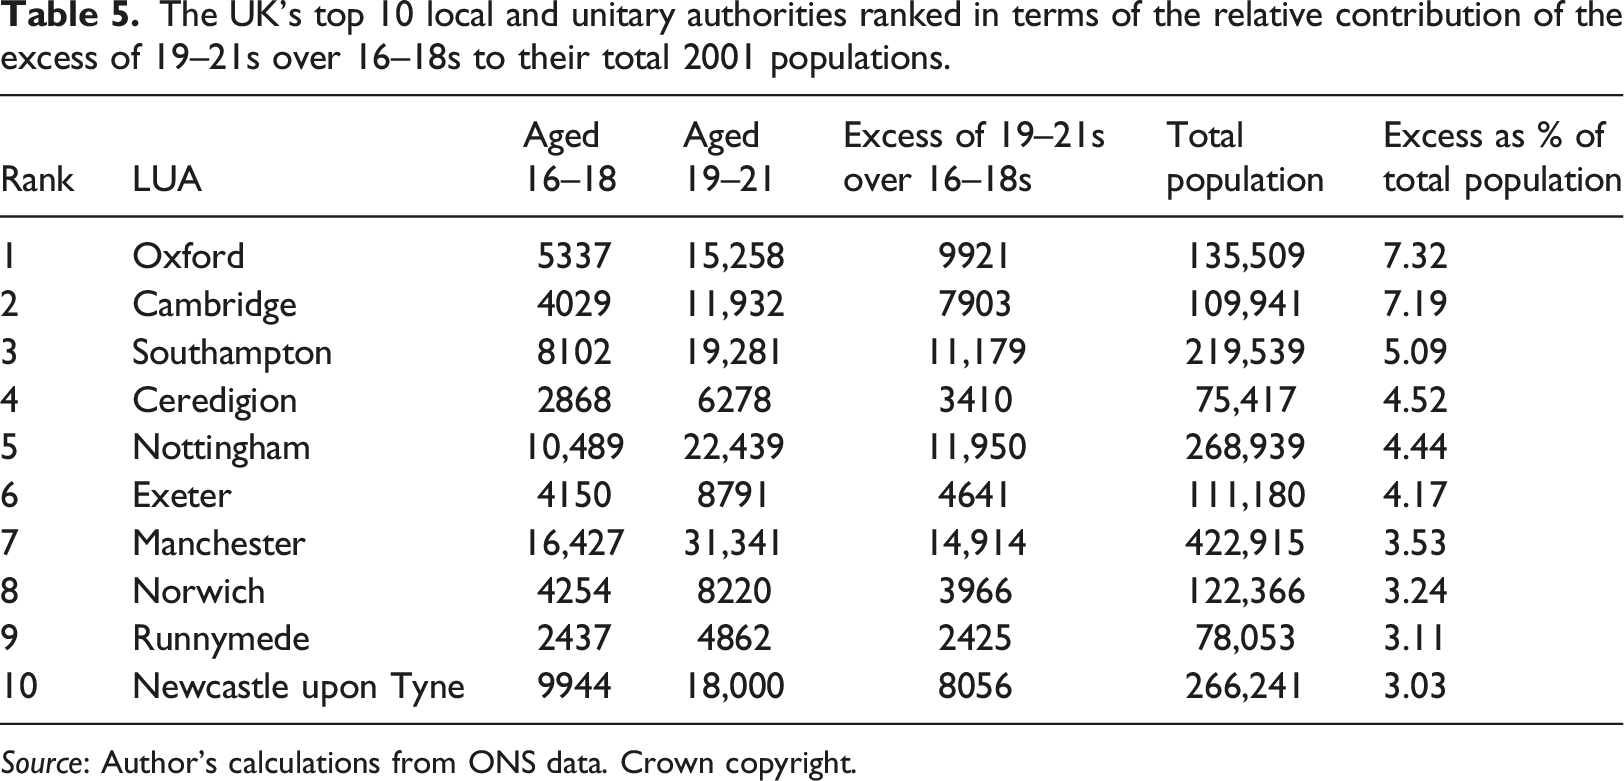
Source: Author’s calculations from ONS data. Crown copyright.
Figure 1 goes on to show which places experienced the largest increase in impact on their total population numbers between 2001 and 2019. Lincoln leads the ranking as it did for the change in ratio in Table 4: at 2.4% in 2001 it did not feature in the top 10 then, but compared with its 8.7% level in 2019, the contribution of this undergraduate-age swelling to its total population was up by 6.3% points. Nottingham and York come next, with an upward shift of around 3.5% points and the other seven up by around 2.5% points or more. Moreover, for some places in this top 10, this was essentially a new phenomenon, this most notably for West Lancashire where there had actually been fewer 19–21s than 16–18s in 2001 but also for Guildford and Bath where the impact then had been only around 1%. The UK’s top 10 local and unitary authorities ranked in terms of the percentage point change, 2001–2019, in the contribution of the excess of 19–21s over 16–18s to their total populations.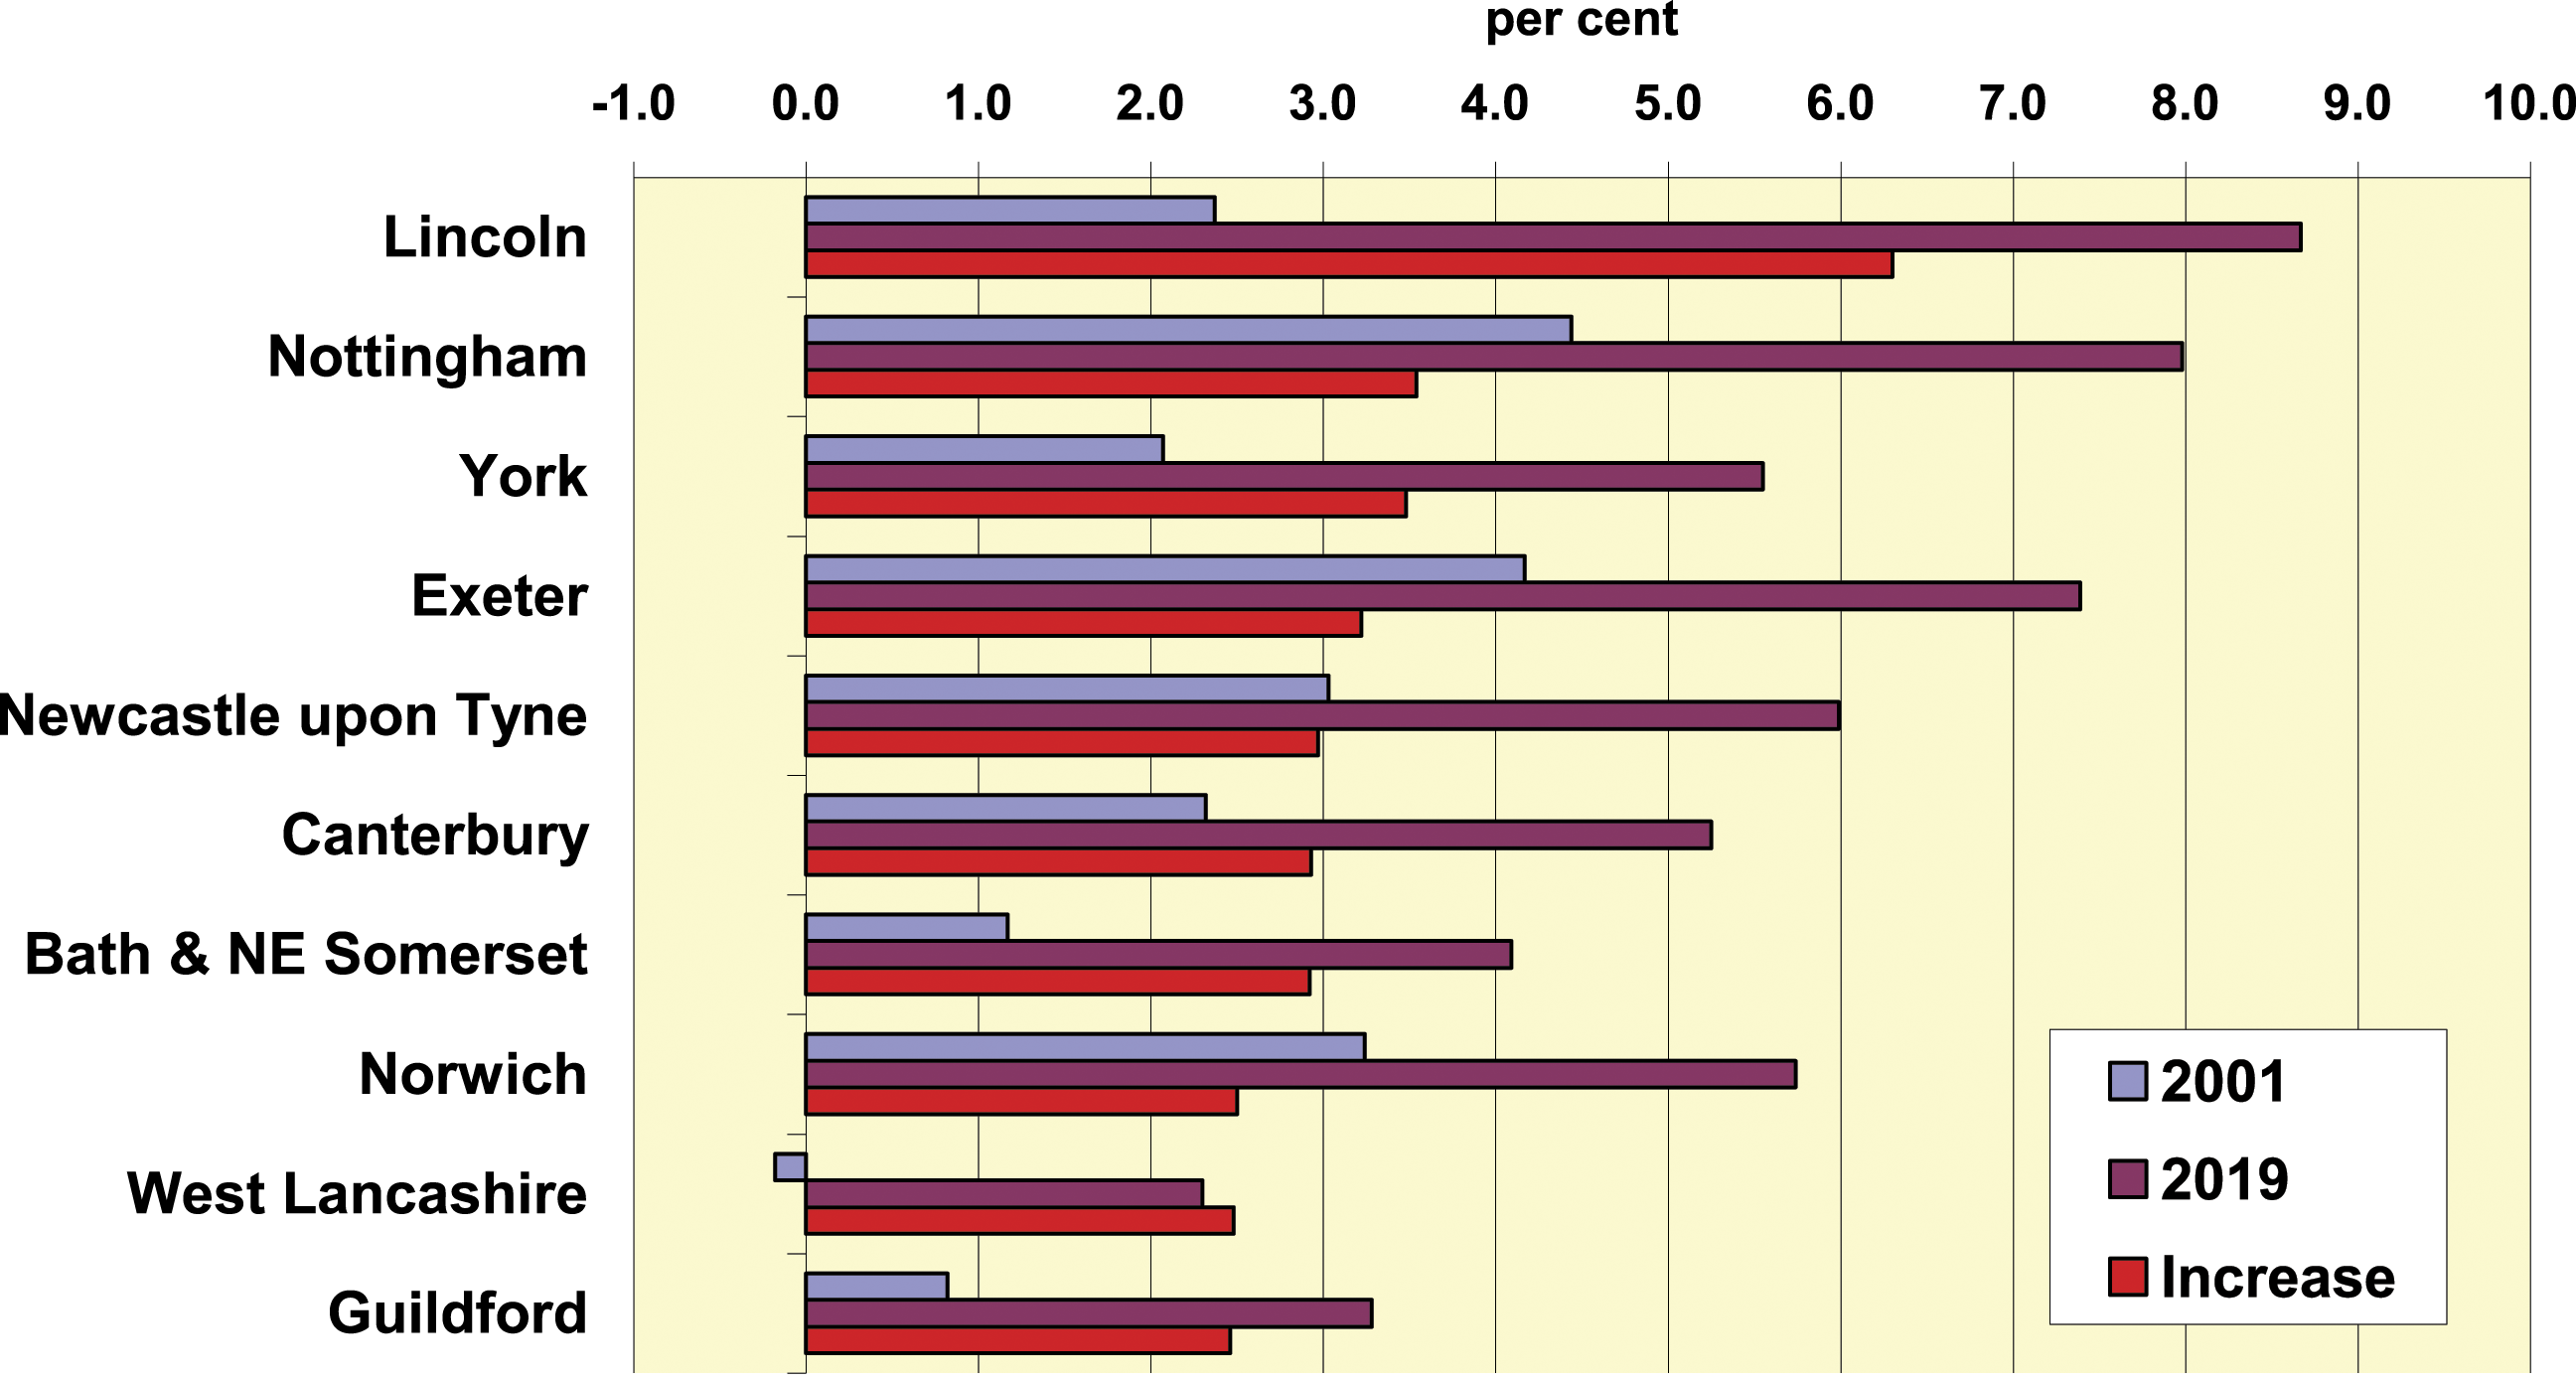
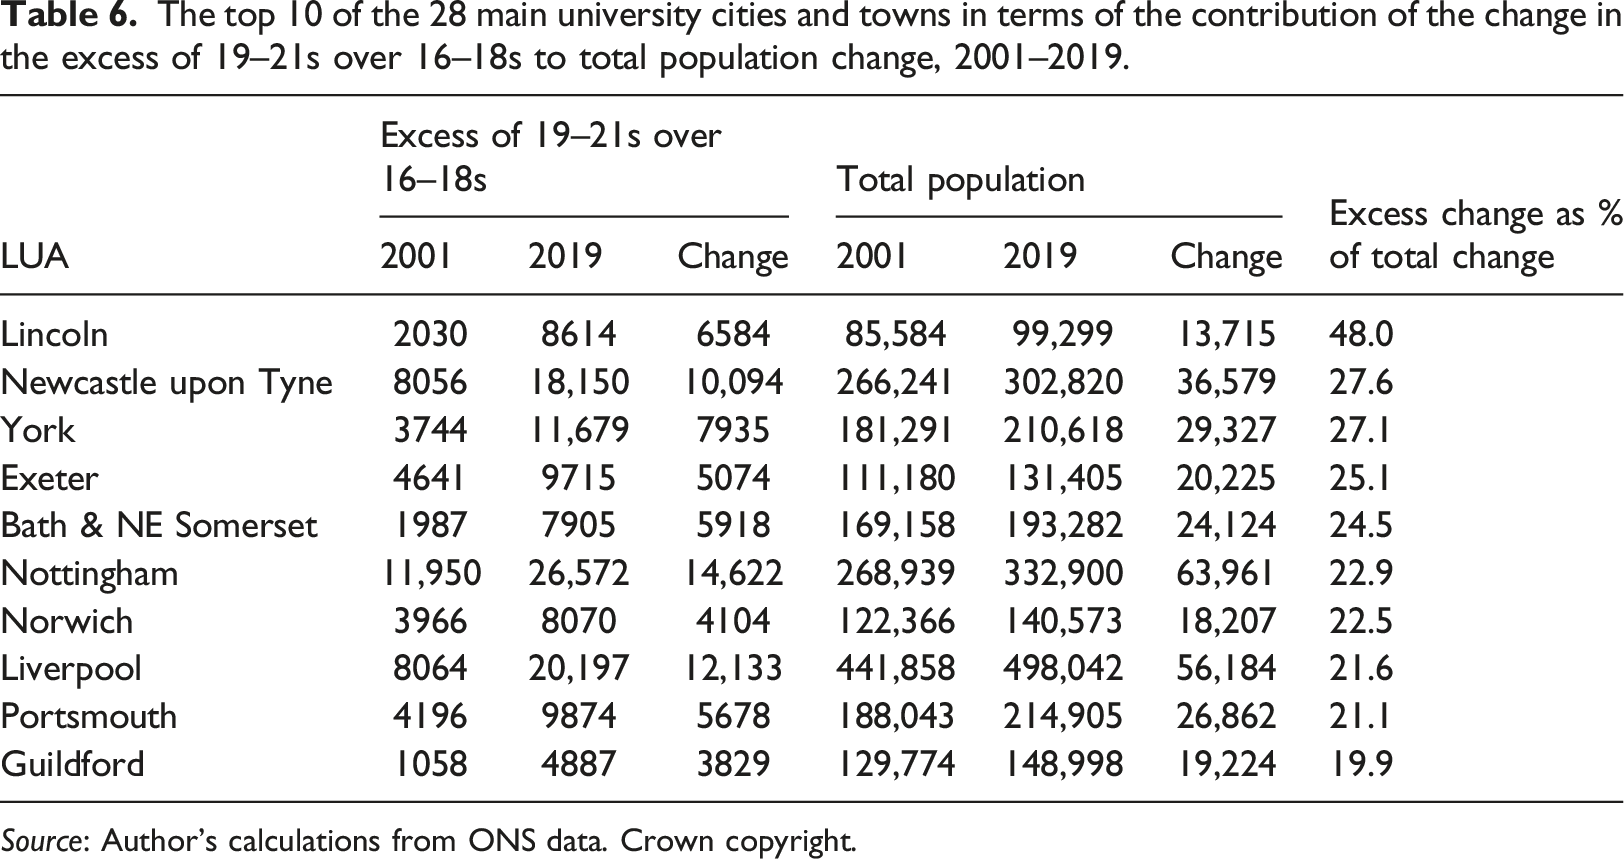
The top 10 of the 28 main university cities and towns in terms of the contribution of the change in the excess of 19–21s over 16–18s to total population change, 2001–2019.
Source: Author’s calculations from ONS data. Crown copyright.
The first point to note is that all 10 LUAs listed in Table 6 recorded overall population growth for the 18-year period, even Liverpool with 56,000 more residents in 2019 than in 2001, reflecting the urban renaissance mentioned at the outset. Secondly, it can be seen that the increase in their net gain of school leavers becoming 19–21 years old over this period contributed to around 20% or more of their overall growth for these 10 places. Once again, Lincoln is the stand-out case, with the increase of some 6,600 in its net trade of undergraduate-age people between 2001 and 2019 accounting for almost half of its total population gain of 13,700, with Newcastle, York, Exeter and Bath seeing contributions of a quarter or more.
Beyond the 10 places listed in Table 6, there are another 11 LUAs where the contribution to their overall growth was at least one-tenth; in rank order, Ceredigion, Canterbury, Lancaster, Brighton & Hove, Warwick, Oxford, Leeds, Leicester, Sheffield, Sheffield and Cardiff. Among the remaining 8 of the 28 main university LUAs, Coventry comes next on 9.6%, followed by Bristol, Welwyn Hatfield, Cambridge, Runnymede and Southampton, with Manchester bottom with a 5.4% contribution. If the roll call is extended further to cover the other 29 LUAs in Table 1, then one of these – West Lancashire – matched Lincoln with 48%, with Belfast, Dundee and Newcastle-under-Lyme also above 20%. A further 7 were above 10% and another 10 at around 5% or more, leaving just 10 where the contribution was smaller than this.
In terms of the changes since 2001, therefore, there is a distinction to be drawn between those places which had previously been receiving a sizeable influx of undergraduate-age people and those for which it is a relatively new experience or where it has accelerated sharply since the turn of the century. It is also clear that for some university cities and towns the increase in their net gain of school leavers between 2001 and 2019 has provided a significant boost to their populations. In fact, the scale of the local population impacts observed above should be treated as a minimum, because not all undergraduates will be just temporary residents who leave at the end of their courses: a proportion will be staying on for postgraduate qualifications, work or other reasons, thus remaining in the population while a new cohort of undergraduates arrives.
The main losers of school leavers from ‘going away to university’ migration
The corollary of ‘going away to university’ migration concentrating undergraduate-age people in places with large HE providers is that other places lose out in the process, with suggestions that this process is sucking the lifeblood out of the LUAs from which these flows originate, especially places that are now labelled as being ‘left behind’. This section identifies the extreme losers of school-leaving-age people as of 2019 and then examines which places have recorded the biggest increases in this ‘leakage’ since 2001.
The UK’s local and unitary authorities with the lowest ratios of 19–21s to 16–18s in their 2019 populations.
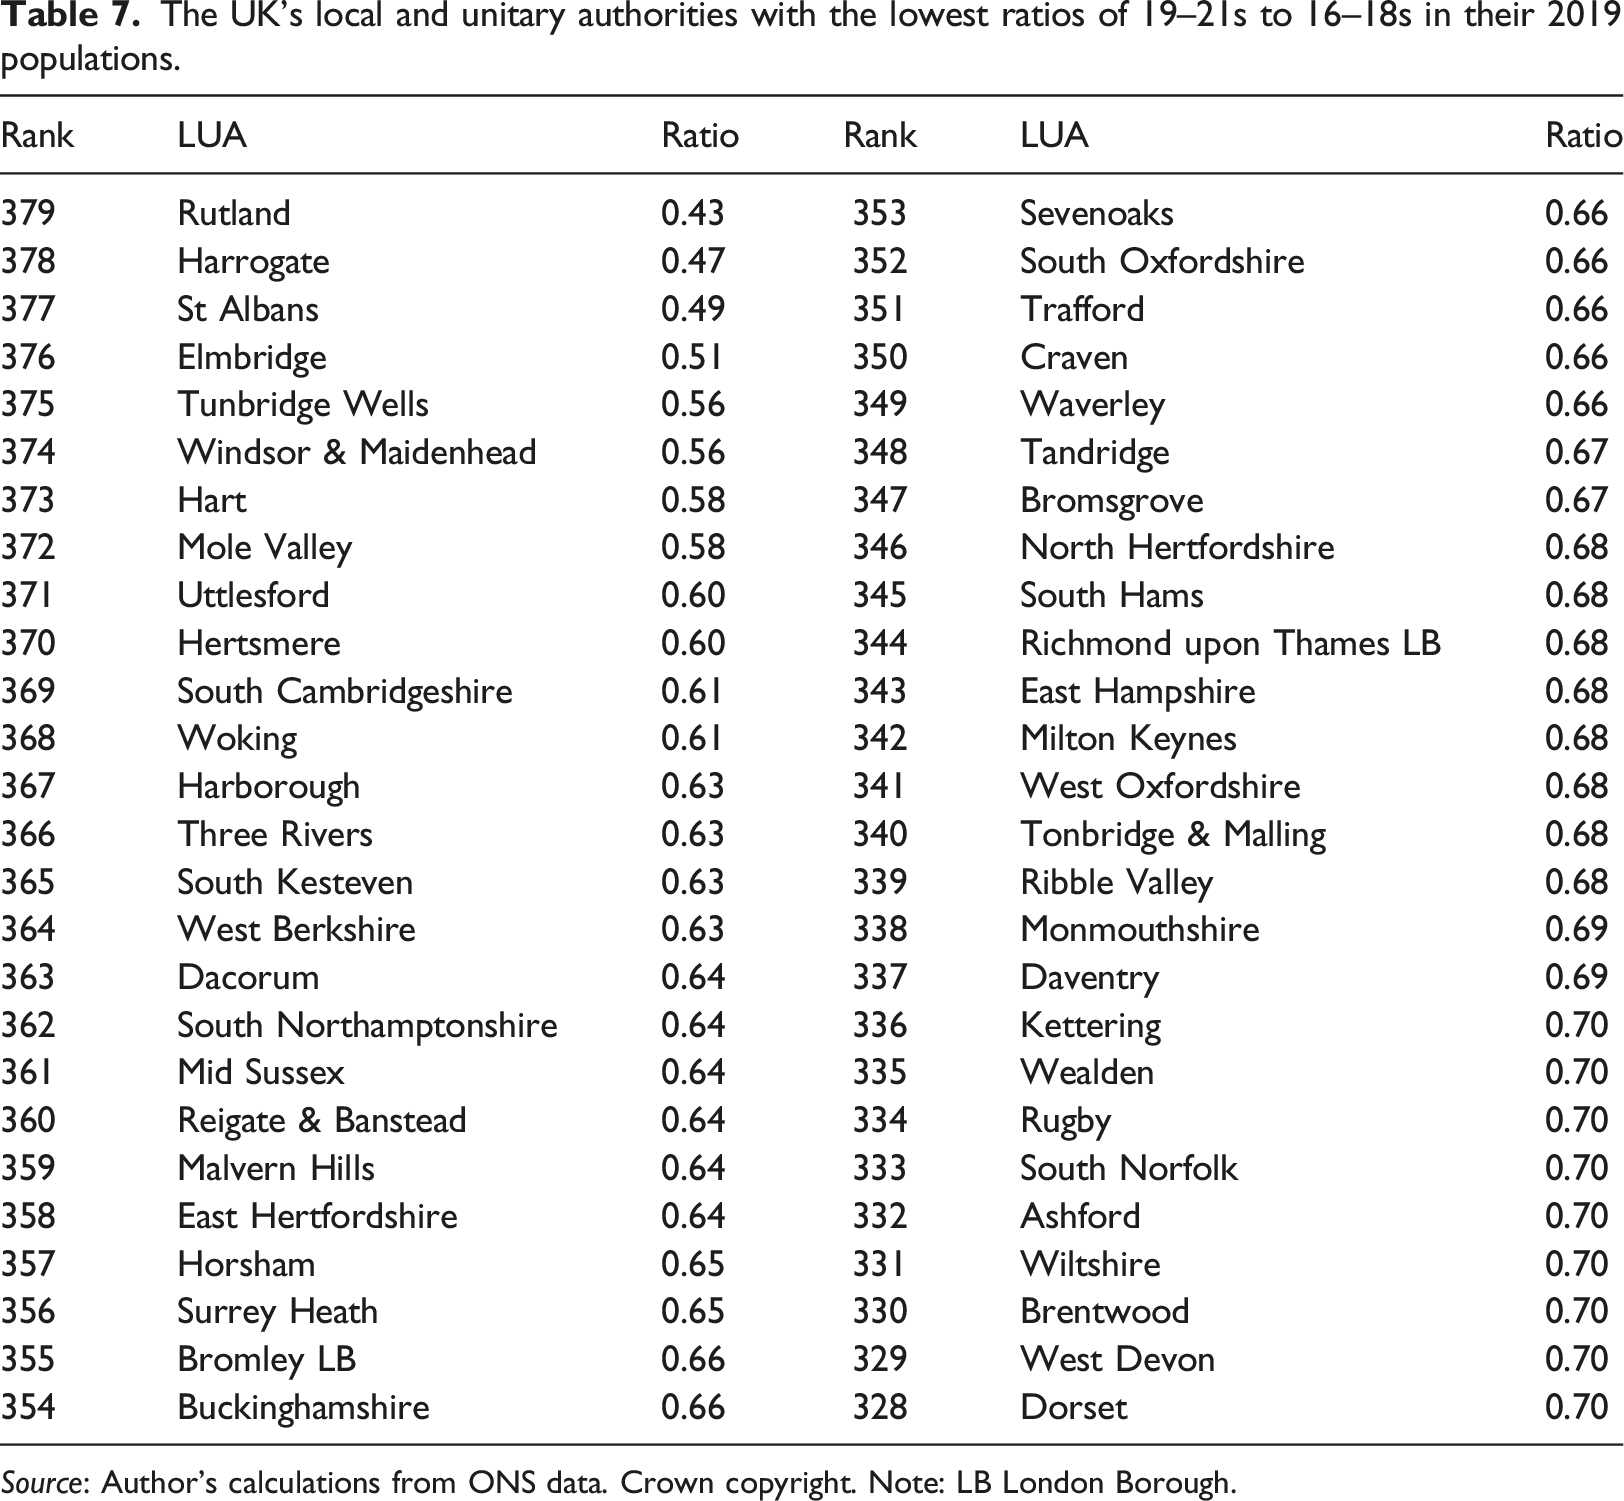
Source: Author’s calculations from ONS data. Crown copyright. Note: LB London Borough.
What do the 52 LUAs in Table 7 have in common? Almost by definition, the list contains hardly any of the cities or large towns that would be expected to possess a significant HE presence. Perhaps the exception that proves the rule is Milton Keynes, which – as a city developed under the New Towns Act – is home to the Open University which specialises in distance learning. Also conspicuous by their absence are the old industrial and coal-mining areas, which are generally places with relatively low levels of HE participation amongst their school-leavers. Instead, most of the 52 comprise what are usually termed ‘rural’, many with names that mean very little to non-locals except where they incorporate the county name (like South Cambridgeshire). In fact, in international terminology many of these would be considered ‘towns’ or ‘suburban’, the latter most obviously represented by Trafford in Greater Manchester and the London Boroughs (LB) of Bromley and Richmond upon Thames. Also, they count among the more privileged non-city places across the UK, with the vast majority located in south-eastern England and its fringes. In some cases, this effect is reinforced by boarding schools with large Sixth Forms from which most leave for university, with the prime example being Rutland, with Uppingham School’s leavers contributing to this small district’s extreme position in the list.
How does the 2019 picture of the main losers of 16–18s as they become 19–21s compare with that of 2001 before the 50%-target-inspired rise in HE participation got fully underway? Inspecting the 2001 version of Table 7 (not presented here for space reasons), it is found that many of the same places appear among the ‘bottom 52’ LUAs as in 2019, with Rutland again being the extreme case. At the same time, there would seem to be two main differences. One is that the extreme ratios in 2001 were not as low as in 2019, with none below 0.50 then, suggesting that the rise in HE participation since 2001 has impacted more deeply on those places that had already been experiencing the greatest exodus of their school leavers. The other difference is that the 2001 list contains a rather larger preponderance of the UK’s most rural LUAs and rather fewer of the wealthier town and suburban ones than 18 years later. This may be because the traditional shortage of job opportunities for well-qualified school leavers in the countryside meant that these young adults were already leaving in large numbers, with possibly the main change between 2001 and 2019 being that more of this rural exodus is now going to university rather than directly to places offering more jobs and better career prospects.
Also, when it comes to assessing the importance of these ‘deficits’ in the context of these places’ total population and population growth in the same way as above for the ‘excesses’ for the university-dominated LUAs, the picture is much less dramatic than for the latter. Even in the extreme case of Rutland in 2019, when its 19-212/16–18s ratio of 0.43 represented a net loss of more than half of its school leavers including those from Uppingham, this loss was equivalent to just 2.3% of its total population. For only five of the rest of the ‘52 bottom’ LUAs was the hit above 1.5% and, for the vast majority of them, it was around 1%, so in these terms the exodus was barely noticeable. This is even more the case in terms of the effect of the acceleration of this exodus on these places’ overall population change between 2001 and 2019. Every one of the ‘bottom 52’ LUAs listed in Table 7 registered overall population growth between 2001 and 2019, so increases in the net exodus of school leavers over this period have been more than offset by growth in the rest of their populations, and this by a large margin in almost all cases.
Nevertheless, the fact remains that around 1 in 5 of the UK’s LUAs not classified as its main university cities and towns are experiencing a net loss of at least 30% of their school leavers, with another 2 in 5 losing between 15 and 30%. Moreover, given that nowadays most of these departures will be prompted by taking up university places rather than seeking work, it can be expected that the exodus will be biased towards the better-qualified Sixth Formers, thus representing a substantial loss of locally-nurtured talent. At the same time, however, the overall population growth of most of the affected places means that these losses are being recouped in some way, though from the present analysis it is unclear whether this process is driven mainly by the return of the original school leavers bringing home their newly-won knowledge and skills immediately after graduation or, alternatively, by the arrival of newcomers at more advanced stages of their working careers or even retirees. This can only be established by estimating the geographical redistribution of people as they age through their 20s and beyond, most exactly via longitudinal datasets that track individuals’ residential histories through the crucial life stages between completing schooling and reaching a more settled status in career and family terms.
Concluding discussion
The results reported above have shown that the UK’s ‘going away to university’ migration, which accelerated initially as a result of the 1963 Robbins Report and then again after the 1992 extension of university status to former polytechnics and colleges, has further intensified in the twenty-first century, with some marked impacts on both the sending and receiving ends, especially the latter given that the process funnels school leavers into a relatively small number of university cities and towns. Lincoln has proved to be the stand-out case, with its ratio of 19–21s to 16–18s increasing hugely between 2001 and 2019 and with its rising net gain of 19–21s accounting for almost half of the city’s overall population growth over this period. While this is unsurprising given that its university was set up only in 1996 and now teaches 14,500 students (Hall, 2021), its experience is not so far different from some longer-established university centres where the net influx of 19–21s contributed at least 5% of their total population in 2019 and in some cases accounted for over a quarter of their population growth since 2001.
Clearly, there have been some substantial changes in the UK’s ‘going away to university’ migration since the turn of the millennium. Some of these are due to the uneven way in which the HE sector has been responding to rising participation rates, with Lincoln being the prime example of a new foundation and with undergraduate numbers increasing in many older universities but less so in others such as Oxbridge and London. Other changes reflect unevenness on the demand side, such that it is generally the places which have traditionally been the principal recruiting grounds for students that have seen the largest increase in their net loss of school leavers, most notably suburban areas but also the wealthier towns and countryside in the shire counties, especially in southern and midland England. At the same time, between these two types of place lie a considerable number of LUAs that seem to have been little affected by these changes, usually either because they are not home to large HE providers or because they have not seen their HE participation rates increase by much. Extensive swathes of former industrial and coal-mining territory, together with coastal towns, fall into this category.
At the same time, it is important to note that the HE sector is already more important to university cities and towns than indicated above. In focusing on the modal undergraduate age, this paper has not only ignored the contribution made to their populations by those employed to teach, research and maintain the services and fabric of the universities but has also underplayed the full extent of the undergraduate impact. Around one in five undergraduates start their courses at age 22 or older, some degrees last 4 years or more (and not just in Scotland where this is normal) and, perhaps most importantly, not all new graduates leave their place of study but remain for postgraduate courses, employment or other reasons, all these adding additional elements to the swelling of the local population. What this also means is that, should the numbers reaching undergraduate age or rates of HE participation rise above recent levels, then the effects on university cities and towns will be that much larger than is currently the case. Contrariwise, if the current size of the HE sector or the popularity of ‘going away to university’ were to prove unsustainable for any reason, then the negative impact on the HE-providing places would also be larger than suggested by this study.
In that context, there appear to be conflicting signs as to what the future holds for HE in the UK. That participation rates have continued to rise despite the official abandonment of the 50% target in 2010 suggests that there is scope for further expansion, as too does the fact that the rate is already higher in some other countries like Japan (61%) and Korea (70%). There is also the drive to widen participation into the ‘forgotten 50%’ by recruiting more from the social, ethnic and other groups and places that have so far been underrepresented at university (House of Commons Education Committee, 2021). Set against these arguments, however, there are other considerations suggesting that ‘peak higher education’ might now have been reached. The government’s consultation on post-18 education is looking to reduce the burden on the Exchequer while growing FE’s role in providing skills and vocational training (Secretary of State for Education, 2022), echoing Turner’s (2020) plea that ‘former polytechnics should go back to their roots’. The financial strain is already beginning to show, with the proportion of England’s HE providers with an in-year deficit increased from 5% in 2015/16 to 32% in 2019/20 (NAO, 2022), while Conlon et al. (2021) forecast 57% fewer first-year EU enrolments in the wake of Brexit. Additionally, the COVID-19 pandemic has exacted a heavy toll on student satisfaction, especially with the switch from in-person to online teaching and possibly undermining some of the rationale behind ‘going away to university’ behaviour given by Whyte (2019).
Given all these considerations, what should places with a large HE presence be planning for over the next decade or two? Several scenarios can be conceived, based on alternative assumptions about the overall size of the HE sector and the willingness of undergraduates to go away to university. On the bullish side, it can be envisaged that HE participation rates will continue their upward trajectory and perhaps reach 60–65% by 2040 and with no substantial drop in the proportion of students attending non-local institutions, such that the population boost observed for university cities and towns over the past two decades will continue apace. Alternatively, will it be the case that ‘peak HE’ has now been reached with what might be called a ‘50:50 society’ in terms of the percentage of adults with and without degrees, such that places now need to consolidate around their current numbers of undergraduates? Or might the UK now be entering a period of ‘correction’, involving a reduction in the volume of ‘going away to university’ migration due to a switch of emphasis away from HE towards more investment in FE and an increase in the proportion of students studying from home? Of course, whichever of these scenarios emerges at national level, there will be considerable variation in how it impacts on individual places, just as the growth since 2001 has been spread unevenly. This will depend on the precise manner in which individual HE providers respond to the opportunities and challenges that arise, as well as to how far their local councils support or oppose their plans and – perhaps most intriguing of all – the appetite for following Willett’s (2021) advice to set up new universities ‘from Blackpool to Chatham’.
In conclusion, this paper has shown that the substantial growth in the UK’s HE sector over the past two decades has wrought big changes for many of its university cities and towns, some for the first time but mostly building on the impacts of the two previous rounds of HE expansion, and with some experiencing welcome boosts to their local economies while others have struggled to cope with the additional pressures on housing and services. The situation now, however, resembles something of a crossroads in terms of what the future holds in terms of numbers of undergraduates, where they are recruited from and whether they will go away to university or study locally. Indeed, what Hoare (1991: 367) wrote some 30 years ago – ‘The future structure of university education is more uncertain than at any time most of us can recall’ – seems equally apposite now. The next few years look like providing fertile ground for monitoring the impact of the changes that do occur, not least through analysis of the population shifts taking place between school and university and of the migration flows underpinning them.
Footnotes
Acknowledgements
I am very grateful for the helpful comments made on an earlier version of this paper by John Goddard, Anne Green, Chris Millward and Alan Townsend, as well as for the suggestions of the two referees and the journal’s editor-in-chief. I take full responsibility for any remaining errors.
Declaration of conflicting interests
The author(s) declared no potential conflicts of interest with respect to the research, authorship, and/or publication of this article.
Funding
The author(s) received no financial support for the research, authorship, and/or publication of this article.