
Abstract
This study examines how social status is assessed in contemporary Ukrainian society (on the case of Kyiv city). We expect that social status deviates from traditional occupation-based measures prevalent in Western contexts and is more closely related to material wealth than to occupation. Using a multidimensional framework (Warner’s Status Characteristics Index), we employ a factorial survey experiment to test the importance of four (independent) dimensions for status assessment: occupation, income, area of residence, and housing conditions. The experiment was implemented as an online survey in Kyiv 2023. The results confirm that income is the primary determinant of social status judgment, followed by housing conditions, while occupation and area of residence exert less influence. The criteria for judging social status remain consistent across gender, age, and socio-economic strata. This study contributes to the establishment of a standardized index for measuring social status and highlights the nuances of social stratification in Ukraine. Finally, we critically discuss our findings and the future relevance of occupation as a status marker due to the current war and its aftermath.
Introduction
While the ‘methodological globalism’ approach (Simonchuk, 2016) often advocates a single standard tool for measuring social status, alternative tools for measuring social status remain relevant and have been methodologically justified. This approach of ‘methodological globalism’ is based on the class concepts developed by Goldthorpe (2000, 2002) and Wright (1997, 2005; Wright and Martin, 1987), among others. All of these scholars utilize ‘class’ as a categorical scheme based on occupations to differentiate social status positions. To date, the application of these occupation-based schemes to Ukraine has yielded only limited explanatory power for the study of values, attitudes, and political behavior in these societies (Simonchuk, 2018). In Ukraine, the relationship between occupation and education, on the one hand, and income, on the other hand, is not as straightforward as in Western societies. In Ukraine, social status (defined as power, wealth, and prestige) appears to be more directly influenced by material resources, such as income and housing conditions. Several scholars suggested adapted stratification models to the specific socio-economic realities of Ukraine (see Kovalisko, 2008; Kutsenko, 2000; Makeev, 2010; Simonchuk, 2024, 2014).
In this study, we apply an ‘old’ status index, Warner’s Status Characteristics Index (WSCI), originally suggested for mapping social status in a small town in the United States – in the 1930s and 1940s. WSCI included occupation, source of income, area of residence, and housing conditions. We test the relative importance of these four dimensions in a heterogeneous population of city of Kyiv. With Max Weber’s (1946) ideas, the WSCI encompasses three primary sources of an individual’s social status: power, wealth, and prestige. In the original version of the index, power and wealth were defined in terms of the source of income (e.g. capital income vs income from participating in the labor market vs social security payments). In the applied version, the amount of material income is the primary indicator of status, with the source of income becoming irrelevant.
Warner’s indicator of prestige is accommodation, that is, the place of residence, the type of house and conditions of housing serve as an additional source of status. As Warner (1957) originally proposed, the type of accommodation an individual resides in independently of the source of income contributes to social status. Indeed, there is broad evidence that that housing can be identified as an important factor in social stratification. For example, G. Knight (1982) concluded that there is a close relationship between accommodation and status positions in society. Accordingly, Prasad and Richards (2006) utilized real estate and rental prices in neighborhoods as indicators of social stratification. This ecological perspective of neighborhoods considers social differentiation of residential areas to be an important factor in the construction of socio-spatial maps (Guijt and Woodhill, 2002) with some neighborhoods providing higher resp. lower status for their residents. As shown in previous research, housing conditions particularly contribute to social status in Ukraine (Cherenko et al., 2020).
The research problem of this article is the validation of a multidimensional status index (including housing) in Ukraine and to discuss the relevance of its components. We use a factorial design experiment in which around 800 citizens of Kyiv evaluate social status of hypothetical fellow citizens. We find a rather limited importance of occupation for assigning social status while ‘income’ and ‘housing conditions’ matter. Finally, we discuss the results of our evaluation strategy against the background that Ukraine has experienced an ongoing war for more than 3 years.
Lloyd Warner’s multidimensional status measurement adapted to Ukraine
Lloyd Warner (1957) proposed a multidimensional status index which adds housing to occupation and income. This index has been adapted to Ukraine in a previous study: Kovalska (2019, 2020) has suggested replacing ‘source of income’ by ‘income level’ and has adjusted the accommodation characteristics to the conditions in Ukraine (specifically in its capital Kyiv). The adaptation includes (1) ‘occupation’ (suggesting that occupation still plays some role in status) and (2) ‘income’ as separate dimensions, and additionally introduces the dimensions (3) ‘housing conditions’ and (4) ‘area of residence’. Like the original index (WSCI), the adapted Warner’s Status Characteristics Index (AWSCI) distinguishes six status classes: highest-high, lowest-high, highest-middle, lowest-middle, highest-low, lowest-low.
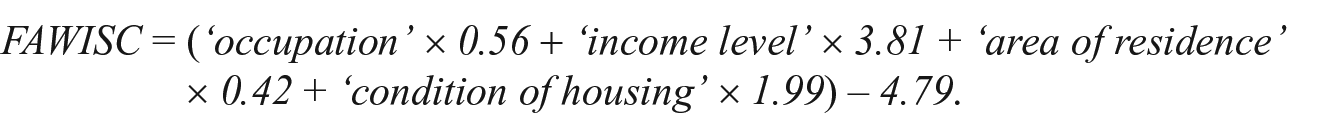
To calculate the index values, Warner proposed the following formula
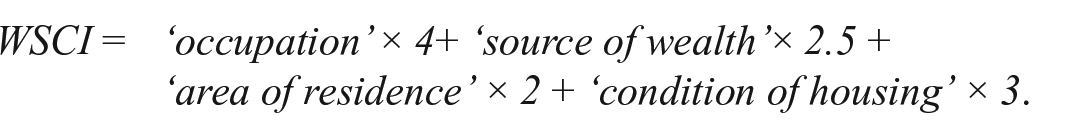
Note that all dimensions are measured on a standardized scale (i.e. the estimated coefficients of factors represent their relative importance). When we look at the weights of the four factors there is a clear rank order of importance: ‘Occupation’, followed by ‘condition of housing’, ‘source of wealth’, and ‘area of residence’. As said above, index values translate into six social strata. Warner used an inverted scale with lower values indicating higher social status and vice versa (see Table 1 for the original values).
Intervals for categorizing respondents based on WSCI values.
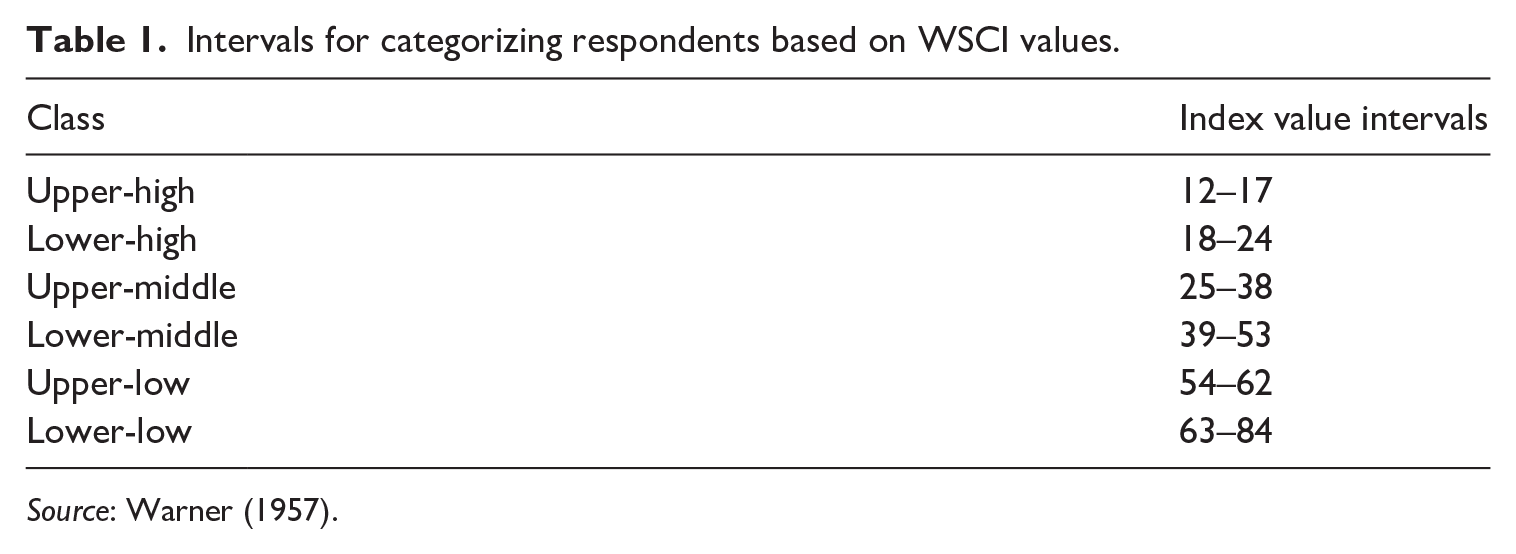
Source: Warner (1957).
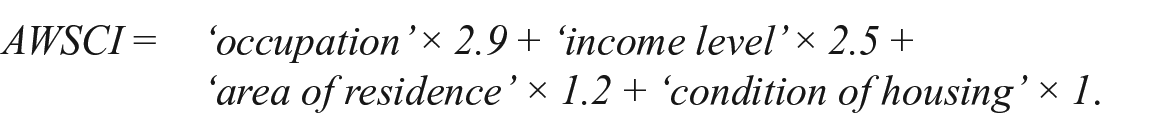
Technically, the values of the WSCI result from an additive model of four weighted components. Since this feature principally fits the more ‘fluid’ characteristics of a transformational society, WSCI was used to build upon a new (adapted) version for Ukraine. As noted earlier, Kovalska (2019) invited experts on social stratification research in Ukraine to discuss the logic of the index and to develop an adjusted formula to better reflect the conditions of modern Ukrainian society. Her study had two stages: in-depth interviews (N = 8) and an online survey (N = 13). In the first stage, most experts pointed to the weak differentiating potential of the ‘source of wealth’ 1 characteristic in the Ukrainian context. Thus, it was proposed to replace ‘source of wealth’ by ‘income level’. In addition, experts identified ‘occupation’ and ‘income level’ as key indicators of an individual’s location in the current system of social stratification in Ukraine (Kovalska, 2019). As part of the second stage of the study, each of the four characteristics was assigned its own weight, which made it possible to suggest a modified formula for calculating the AWSCI
How to operationalize the four dimensions
In order to evaluate the index, we first need to be clear how the four dimensions will be measured – keeping in mind that scales with a common spectrum of values are in place for all four dimensions. According to Warner’s setup, we use 7-point rating scales for all dimensions.
Occupation
The first dimension is indicated by an ordinal variable in which occupations pre-coded using the ISCO-88 classifier are assigned to one of nine major groups according to the level of required qualification and corresponding competencies (Simonchuk, 2008). Nine major groups have been combined into a 7-point rating scale (see Kovalska, 2019, for details).
Income level
Direct questions on income in Ukrainian hryvnia are somewhat problematic to depict material well-being in Ukraine. An Official statistical information on income is most probably downward biased because a significant share of the population’s income is unofficial and hidden, to avoid taxes. Due to the instability of the exchange rate of the Ukrainian hryvnia and inflation, Kovalska (2019) used US dollars as a unit of measurement of income, as a more stable analog. In order to build appropriate income intervals, additional monitoring data from the Institute of Sociology of the National Academy of Sciences of Ukraine were used (Vorona and Shulga, 2016). The following seven intervals have been used (USD per month): from 1,259,000 (1 point); from 12,500 to 1,258,999 (2 point); from 950 to 12,499 (3 points); from 580 to 949 (4 points); from 345 to 579 (5 points); from 115 to 344 (6 points); up to 114 (7 points). Note that we use a self-assessment of financial conditions (similar as Tikhonova, 2014) to grasp the respondents’ own situation whether available income meets certain needs.
Area of residence
To formulate the categories of prestige associated with the ‘area of residence’, previous research applied a localization procedure of neighborhoods for the city of Kyiv. This procedure included an extensive analysis of the opinions of real estate specialists in the city of Kiev. The following criteria for the prestige of the area of residence have been defined: geographical location, availability of infrastructure (remoteness of metro stations, transport interchanges), and type of house (construction period and type). Thus, it was decided to divide this characteristic into a standardized sub-characteristic, ‘house type’, which includes types of construction, and a sub-characteristic called ‘prestige of the area of residence’. These categories correspond to the specific place of residence (street, micro-district, district). Both of these sub-characteristics contribute values from 0.5 to 3.5 points. Again, the third dimension, ‘area of residence’, will be evaluated on a 7-point scale (see again Kovalska, 2019, for details).
Condition of housing
To assess the ‘condition of housing’ indicator, a special standardized index was developed. It has the following components: the number of square meters per living person, the year of the last renovation, the number of bathrooms, and the availability and number of durable items. The categories included in this index were identified through expert interviews (Kovalska, 2019). The weights of all components of the index were assessed by experts as being equal. Consequently, their single contribution to the total value (again a range from 1 to 7) can vary from 0.25 to 1.75. To obtain the final value of the ‘housing conditions’ indicator, it is necessary to sum up the four obtained values.
We see from the proposed formula that occupation and income are key characteristics in determining social status. In turn, according to experts in the study of social stratification of Ukrainian society, the dimensions ‘area of residence’ and ‘condition of housing’ are indicators of minor importance, but both contribute to the overall status value.
Taking into account the peculiarities of scoring for individual components of the AWSCI, its value can vary from 5.4 to 53.2. These status values then need to be translated into six corresponding status classes (see Table 2). When calculating the intervals of class boundaries, we referred to the social structure of Ukrainian society, identified by other scholars (see Makeev, 2010; Simonchuk, 2014; Vorona and Shulga, 2016). The distribution of status positions takes the form of an ‘onion’, i.e. due to the presence of large a share of the upper-low class (47.1%) and a relatively upper-middle class (5.5%; see Makeev, 2010; Simonchuk, 2014; Vorona and Shulga, 2016). For example, a possible profile of the lower-high class is a person with a monthly income of 12,500 USD who is a legislator, senior civil servant, manager, owner or top-level professional, living in a prestigious area, having at least 40 m2 per person, two or more bathrooms, nine or more durable items, and renovations carried out no later than 2010. This group makes 6.4% of the population. For each category of status positions, one could verbally describe specific profiles (see for details again: Kovalska, 2019).
Intervals for categorizing respondents based on AWSCI values.
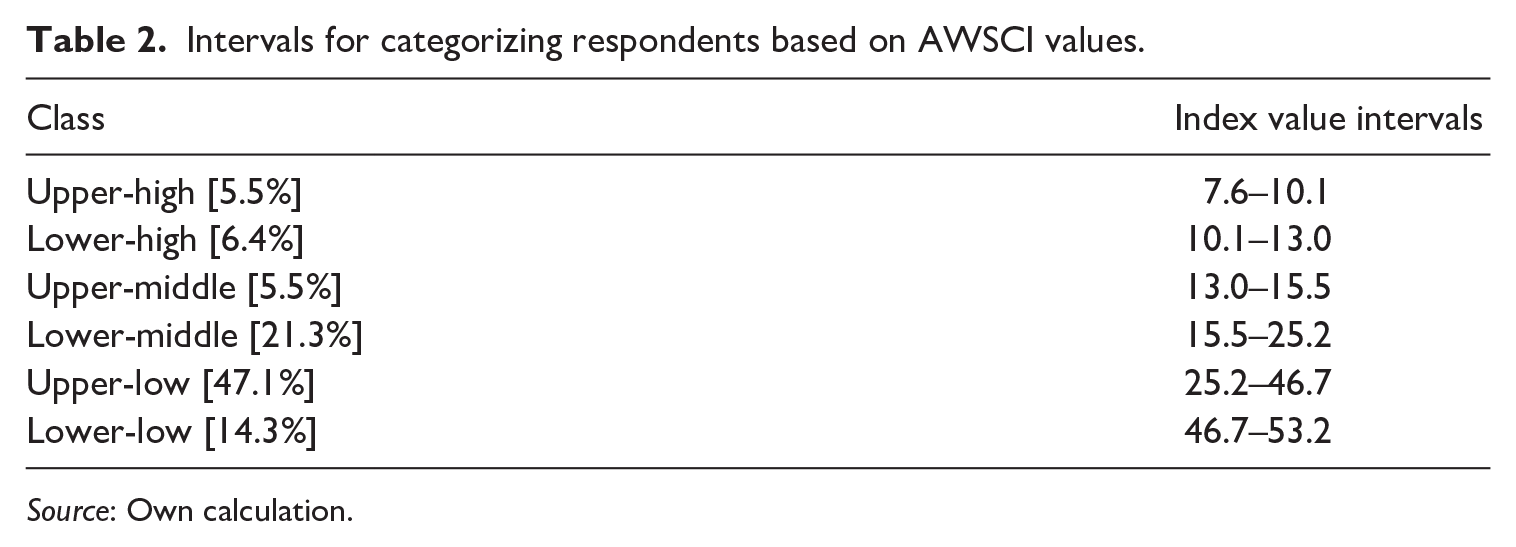
Source: Own calculation.
Evaluation of AWSCI
As outlined above, this article mainly aims to evaluate the AWSCI as an instrument for measuring social status in contemporary Ukraine. In the remainder, we follow three steps to achieve this goal. First, we put the weights of the four dimensions, as suggested by experts, to an empirical test based on survey data from a heterogeneous population sample in the city of Kyiv. Respondents evaluated the status positions of fictional (third) persons described in vignettes who varied systematically across the four status dimensions. Thus, we will able to control for shared principles to assign social status – at least across important socio-demographic groups in terms of respondents’ gender, age, and own status. After this first step of validation, we suggest an empirically modified formula (MWSCI).
Second, we study how the modified index behaves in subgroups of respondents. We analyze whether we can detect expected differences by subgroups (gender, age, status of respondents) Third, we use all three versions of the status index (WSCI, AWSCI, MWSCI) to calculate an index value for the respondents (given their status characteristics measured in the survey). Then we compare these index values which result from the three formulas to a self-estimated social status indicator. Thereby, we get a proxy of predictive validity.
Factorial design
We propose to use the factorial design (FD) method for checking the relative importance of feature weights of AWSCI. FD was first developed by Peter Rossi (1979) and applied to many empirical studies where judgments have been measured in an experimental setup (for an introduction to the method: Auspurg and Hinz, 2014). 2 The essence of this method is creating experimental stimuli in the form of vignettes which are randomly assigned to respondents who are asked to evaluate certain objects/situations based on specified dimensions. 3 Thus, this method is well-suited to return to Warner’s (1957) original idea, which as well focused people’s subjective perceptions of social stratification. In our evaluation study, we ask respondents to assess the social status of vignette persons with four (independent) characteristics. One advantage of FD is to present vignettes with inconsistent characteristics of a hypothetical individual. Due to the orthogonality of dimensions, we can, for instance, construct experimental situations where a head of city administration earns only 120 USD, residing in an old district of Kyiv far from metro stations in a panel house built before 1991 and so on. 4 In this example, at least occupation and income are inconsistent. Respondents are requested to react to all kind of combinations, including some inconsistent but possible descriptions.
In constructing the vignettes, we exactly follow what AWSCI proposes. We work with the four main dimensions, two of which have sub-dimensions. The dimension ‘area of residence’ is divided into ‘the prestige of the area of residence’ and ‘the type of house’. ‘Condition of housing’ includes ‘the number of square meters per person living’, ‘the year of the last renovation’, ‘the number of bathrooms’, and ‘the presence and number of durable items’. This gives eight dimensions for vignette building, in total. To further test the potential influence of the vignette person’s gender on the assessment of social status, we added a ninth factor – gender.
To limit the number of vignettes in the vignette universe (all possible combinations), we restricted the experimental setup to two, three or four contrasting levels for all (nine) dimensions. The ‘occupation’ dimension has four attributes. We selected four occupations to represent a broad spectrum of occupational status: two high-status positions (‘head of city administration’ and ‘university professor’), one medium-low status occupation (‘seller in a shoe store’), and one low-status occupation (‘hotel maid’). This selection was based on the ISCO classification system, ensuring the inclusion of contrasting categories from different ISCO major groups. Two of the indicators of housing conditions (‘number of bathrooms’ and ‘durables’) have two levels each. All other dimensions have three levels.
All dimensions and levels are presented in Table 3, together with a translation to the index scale points.
Factors and levels of FD and index points.
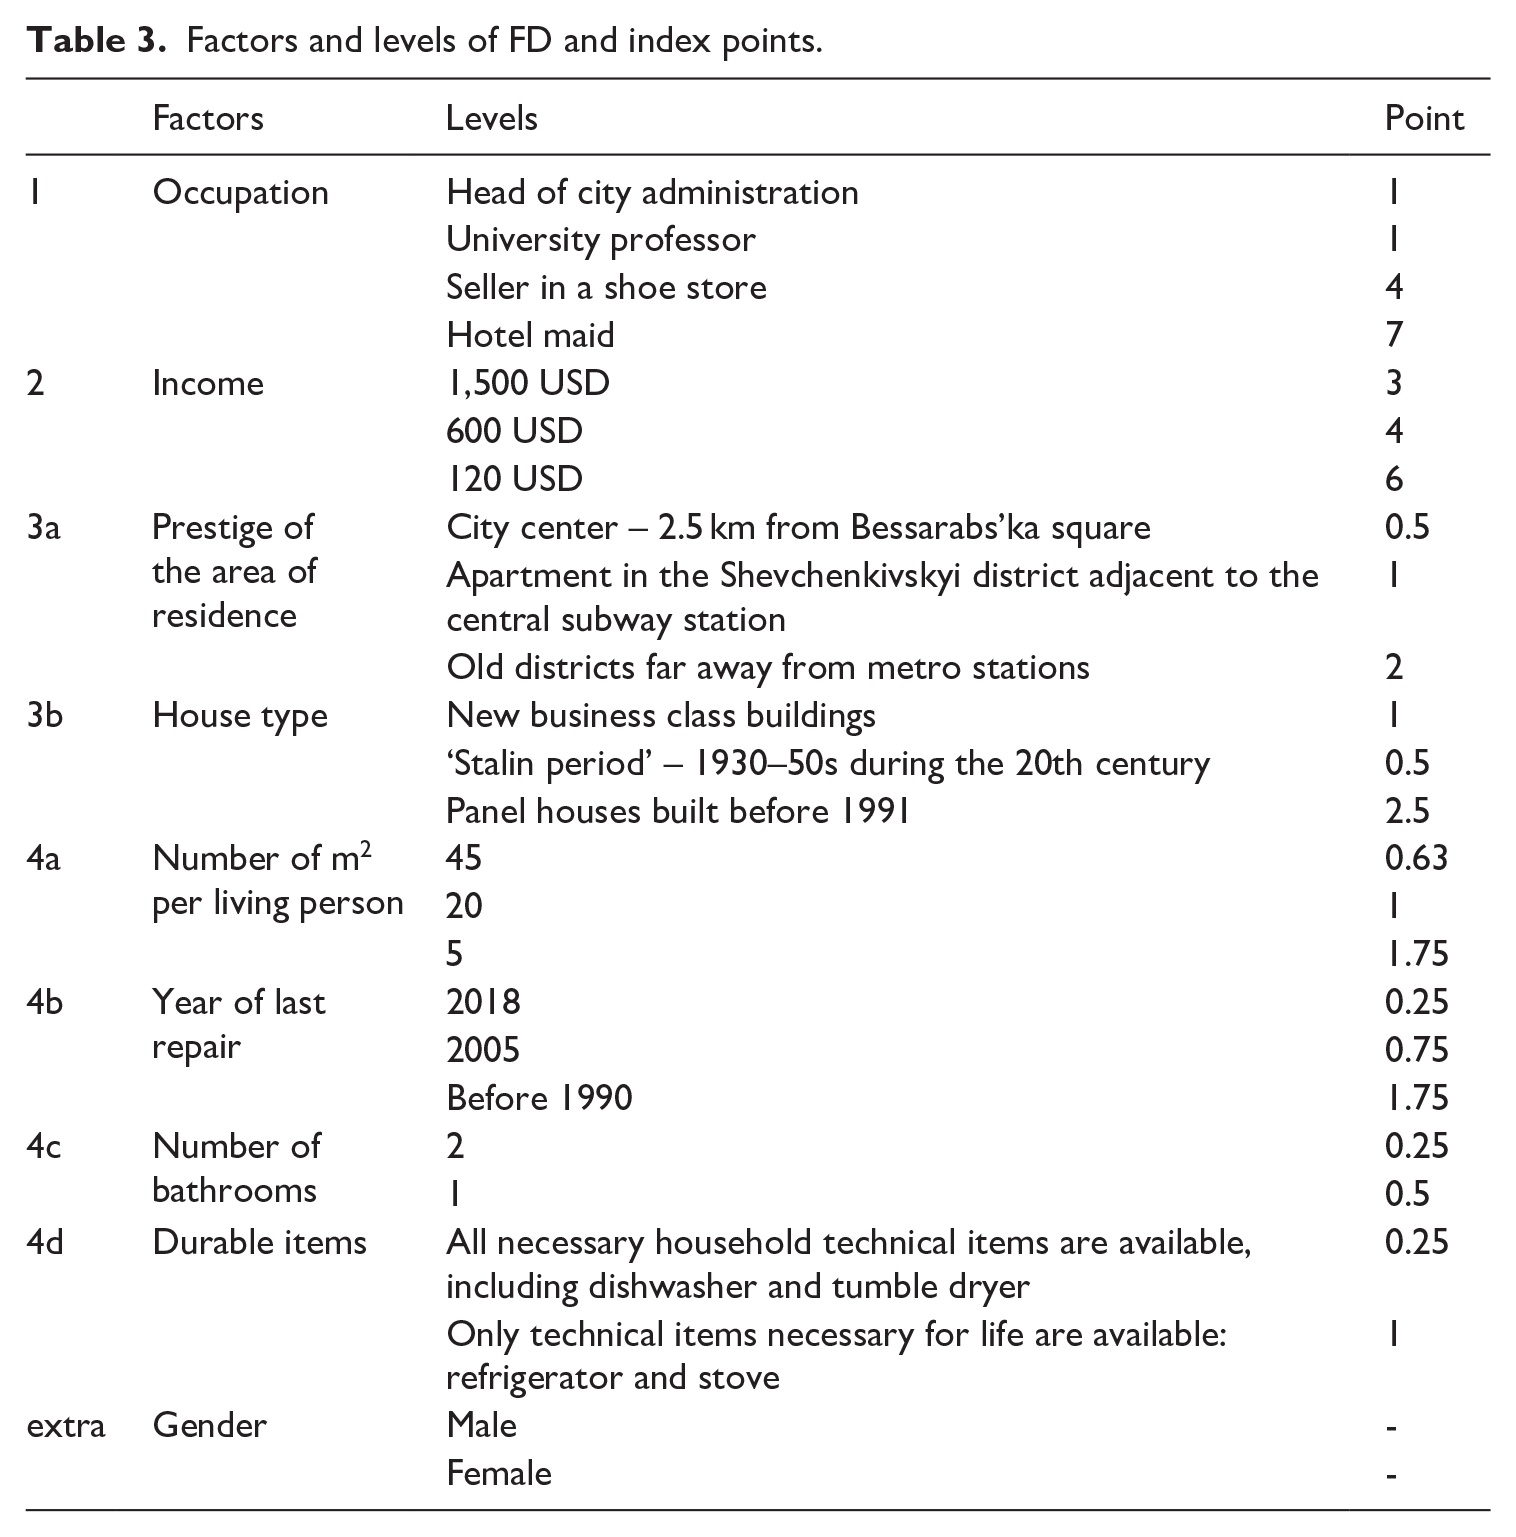
Note that ‘area of residence’ (third dimension) consists of two sub-categories (3a and 3b) and ‘housing conditions’ (fourth dimension) consists of four sub-categories (4a, 4b, 4c, and 4d). The total vignette universe for our study contained 7,776 combinations (4*3*3*3*3*3*2*2*2) after excluding illogical cases (incompatible combinations of house type and year of last repair). We draw out a fractionalized sample of 320 vignettes and distribute them across 40 decks, with eight vignettes per deck. The D-efficiency of the fractionalized sample with all two-way interactions identifiable is 91.1.
Online survey and statistical models
The respondent survey was conducted based on an online access panel, run by Research UA. The recruiting platform meets global quality standards for recruiting participants and verifying information collected during surveys. 5 The panel covers residents in cities with a population of more than 10,000 inhabitants, except in the temporarily occupied territories. According the Research UA, the panel members represent the online audience of Ukraine with regard to several socio-economic dimensions. 6 The total number of panel members is more than 147,000.
We only invited respondents from the city of Kyiv to participate because the area of residence of the vignette persons to be evaluated had to be known to the respondents. Furthermore, we employed quotas for age and gender, developed according to statistical data on the general population of Kyiv city (aged 18–65 years). The survey was fielded from 10 March 2023 to 19 March 2023. A total of 807 respondents completed the questionnaire. Reminders were sent out automatically as long as the quotas were not met. The response rate was 33.8% (number of participants against invited panelists), which is higher than in some other online surveys implemented during the war.
After a careful inspection of the data, we found cases in which respondents gave identical answers to all vignettes, regardless of the vignette person described. Those cases (not meeting the manipulation check) were excluded from the analysis. The total number of valid questionnaires after cleaning data matrix was 791.
Using a linear regression model with cluster robust standard errors for prediction of a status value (as the dependent variable), the coefficients of four status dimensions directly provide the respective weights (occupation, income, area of residence, conditions of housing). Keep in mind that, for each dimension, an indicator value will be defined using the same 1 to 7 scale as for the AWSCI. Vignette dimensions (with their values) have been translated into the four dimensions.
Results
Based on the factorial survey with 791 respondents and a transformation of vignette values into scale points for four dimensions, we estimated a linear regression model with the vignette evaluation (transferred to the AWSCI points) as the dependent variable. The eight vignette variables measuring the four dimensions have been combined into four factor scores contributing to the index value. The primary objective of our analysis was to estimate the weights of four dimensions based on the results of the survey experiments. We built a linear regression model including a constant. Both the original and the adapted version of the status index do not have a ‘natural’ zero point; therefore, we decided to include a constant in the regression model.
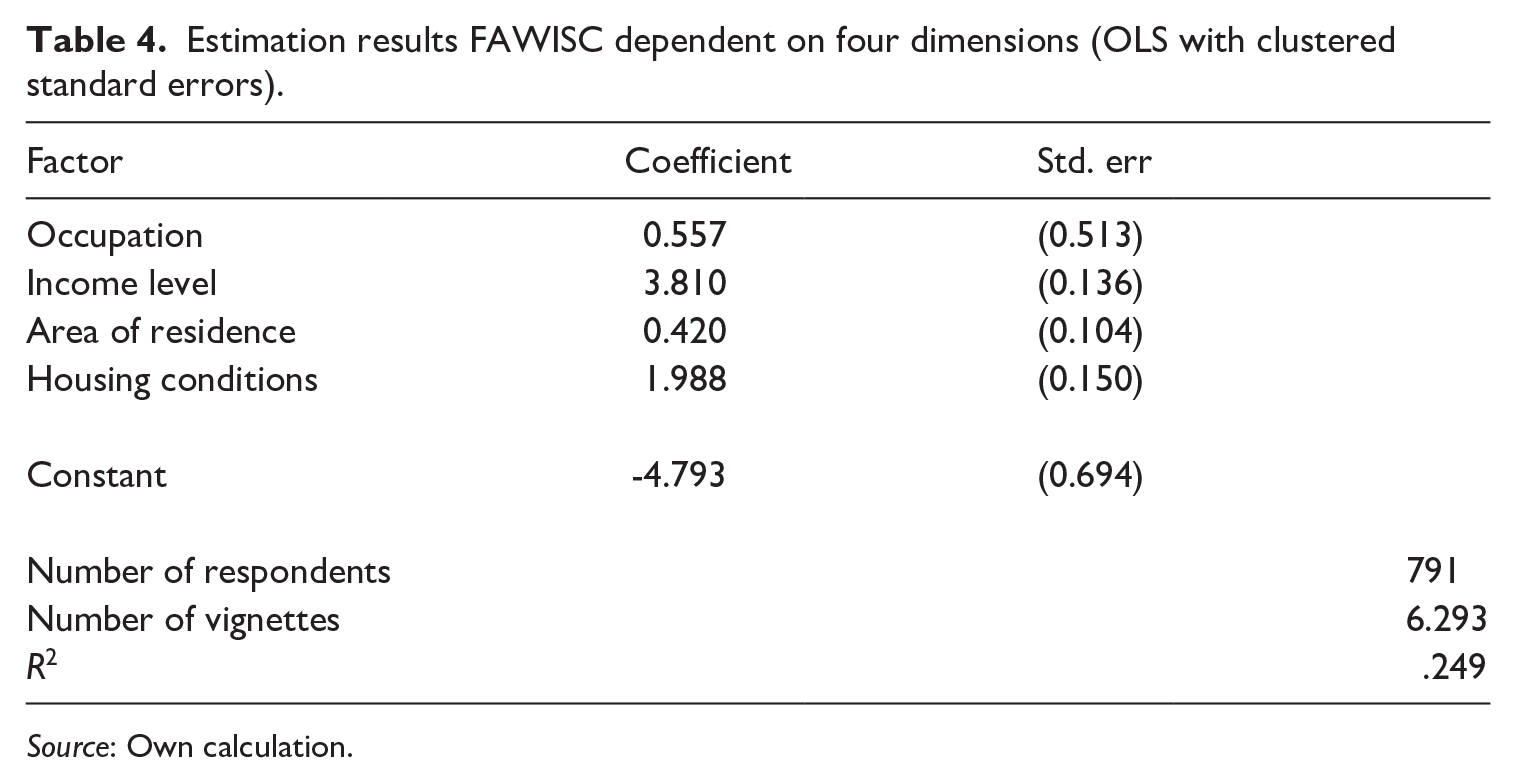
From the obtained model (see Table 4), it can be seen that the factor ‘income level’ (3.81) has the largest contribution, and the factor ‘housing conditions’ (1.99) is in second place. The contribution of the others factors is much smaller and is almost at the same level (‘Occupation’ .56 and ‘Area of residence’ .42). As a result, we applied the following formula to modify the AWSCI
Estimation results FAWISC dependent on four dimensions (OLS with clustered standard errors).
Source: Own calculation.
These results show us that the theoretically based weights of the AWSCI differ significantly from the empirically based ones. In fact, we see that – given our evaluation with respondents instead of experts – occupation only plays a minor role in status prediction, whereas income and, surprisingly, the ‘quality’ of housing has a much higher predictive power. In the remainder of the article, we discuss these deviations from the theoretically adapted index and present suggestions for further evaluating these findings. 7
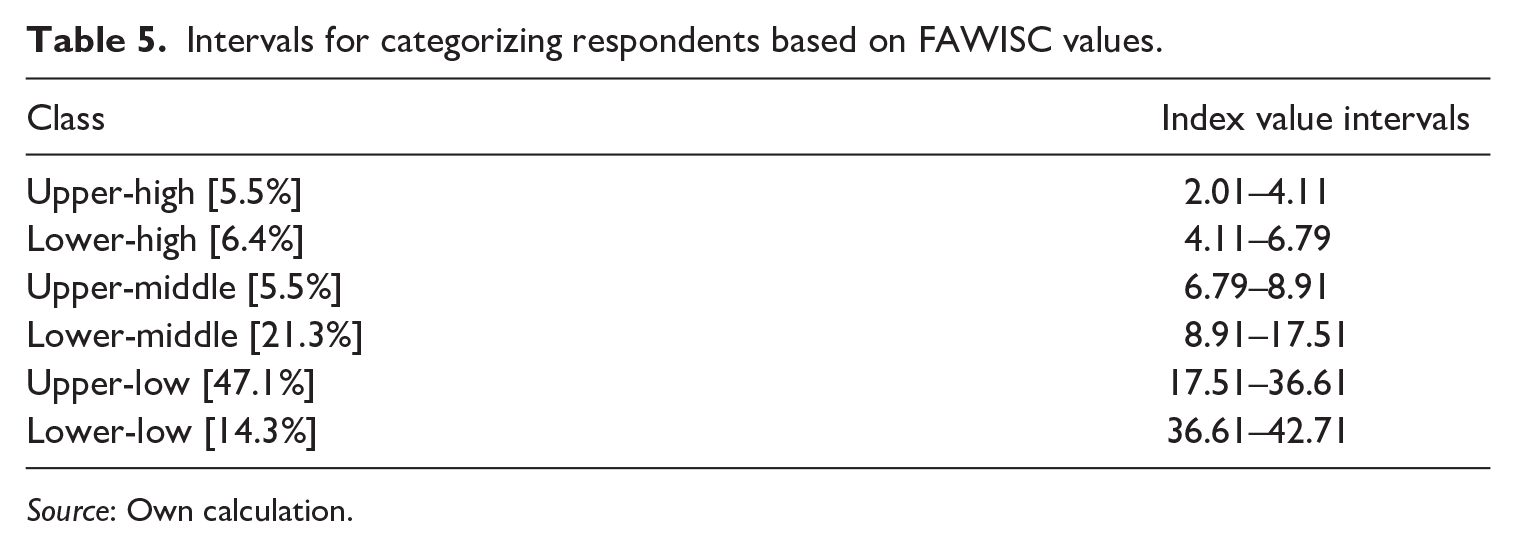
Based on the formula, the lower limit of the index is the value of 2.01 points, and the upper limit is 42.71. We translated the values of the empirical study into the six status categories using the logic described above, and obtained the following intervals (see Table 5):
Intervals for categorizing respondents based on FAWISC values.
Source: Own calculation.
Validity checks
We use the subgroup analysis as a strategy to test for construct validity. We assume that for subgroups of respondents some dimensions should indicate theoretically expected differences. More precisely, we tested the influence of three binary characteristics of the respondent on the size of the weight of the characteristics: gender, age group, and subjective social status.
In the subgroup analysis of gender, we determine a significant difference in the effect size of ‘income level’. For men, this characteristic is more important than for women (see Figure 1). This is theoretically expected since there is a clear gender pay gap in Ukraine (according to the State Statistics Service of Ukraine, 8 it was 18.6% in favor of men in 2023). Since the shares of employed men and women also differ, we expect that income level is more important for men than for women. A Chow test reveals a significant difference only for income level (F-test statistic 12.09 (df 1), p = .0005).
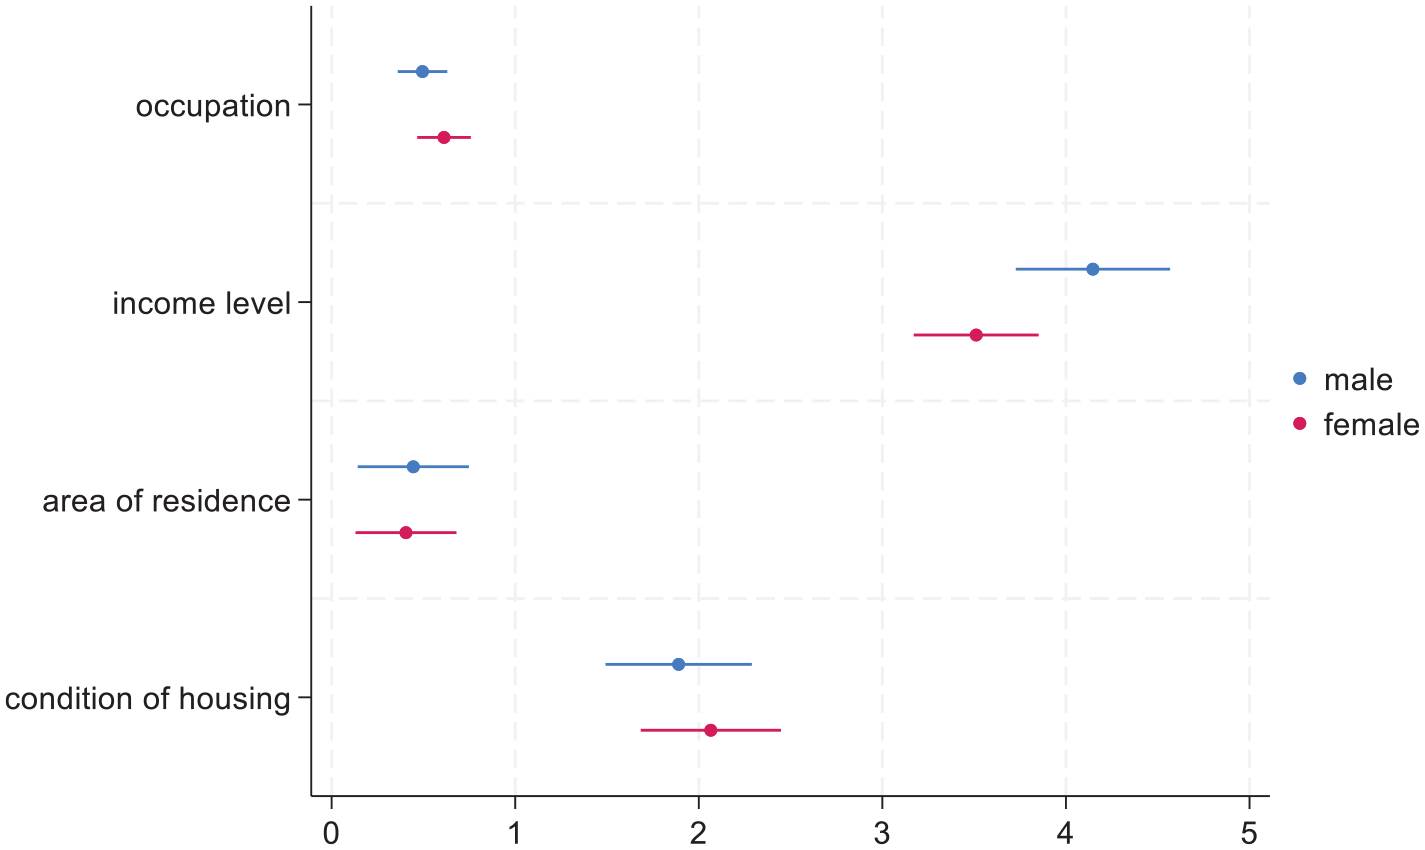
Weight of index characteristics of FAWISC depending on gender of respondents (with 2910 vignettes evaluated for men (R2 = .24), and 3383 for women (R2 = .26)).
In a second model (see Figure 2), we compare two age groups: younger and older than 45 years (the younger group includes 45). It is assumed that respondents over 45 years of age (whose main socialization took place in the USSR) would give occupation a higher relevance than respondents younger than 45 years. For income, we expect a reversed pattern, simply assuming that older respondents more probably stick to occupations as salient status markers and give income a lower weight (income inequality was relatively smaller in the past). The Chow test indeed detects that the relevance of occupation is higher for respondents from the older age group (F Test statistic 7.37 df(1) p = .0068). In tendency, income level is evaluated as more important in the younger group (but the difference is not statistically significant at the 10% level, p = .1185).
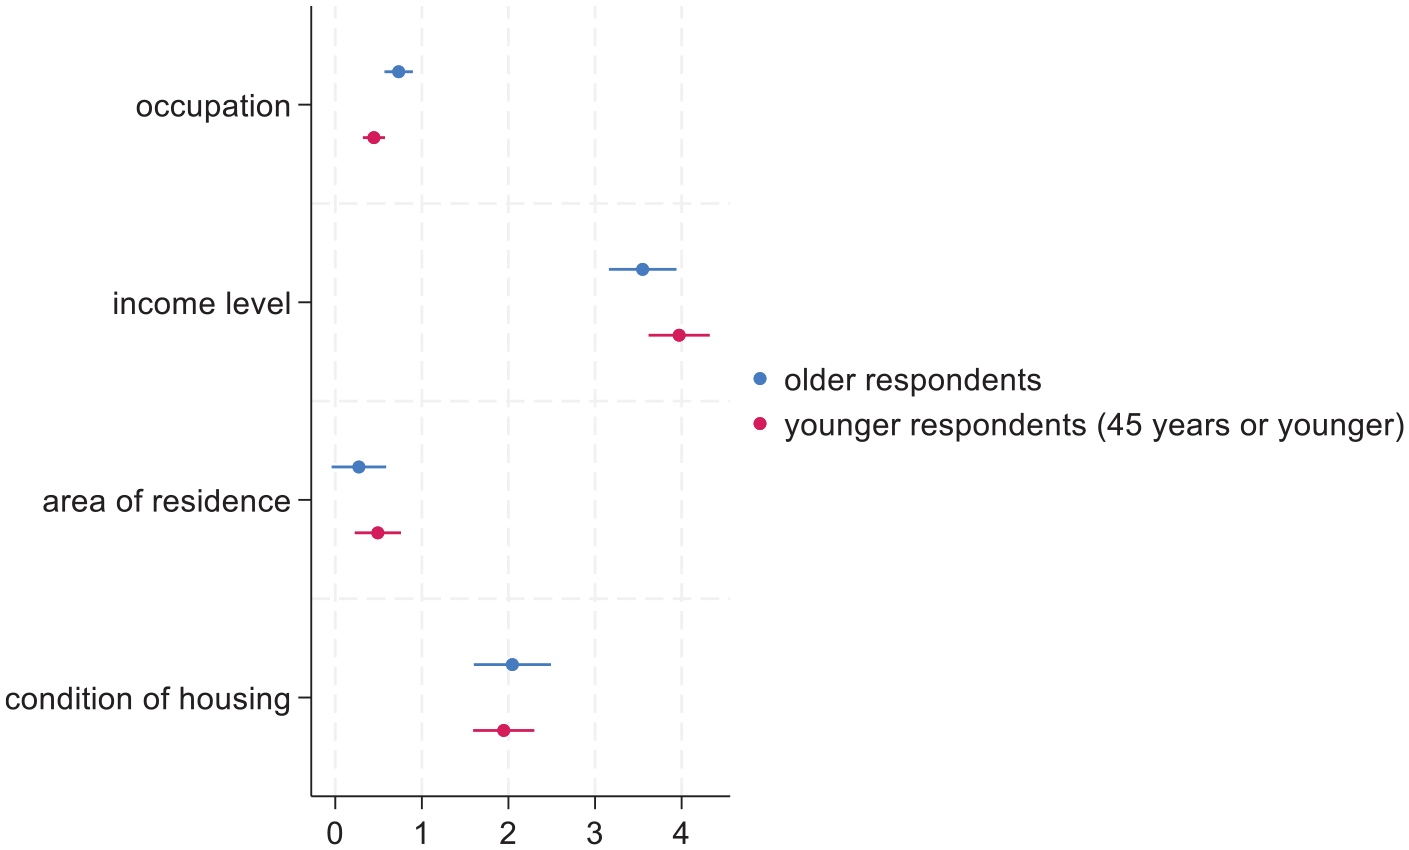
Weight of index characteristics of FAWISC depending on age group of respondents (with 2457 vignettes evaluated for older respondents (R2 = .26), and 3836 for being 45 years or younger (R2 = .25)).
Finally, we dichotomized the social status of respondents (measured by a subjective classification) (see Figure 3). A Chow test reveals that housing conditions differ in their impact on the status evaluation, with marginal significance (F Test statistic 3.60 (df 1) p = .0582). Substantively, the difference might be explained by the fact that living conditions (size of housing, availability of modern renovations and necessary equipment, etc.) are more salient for members of the high-status group.
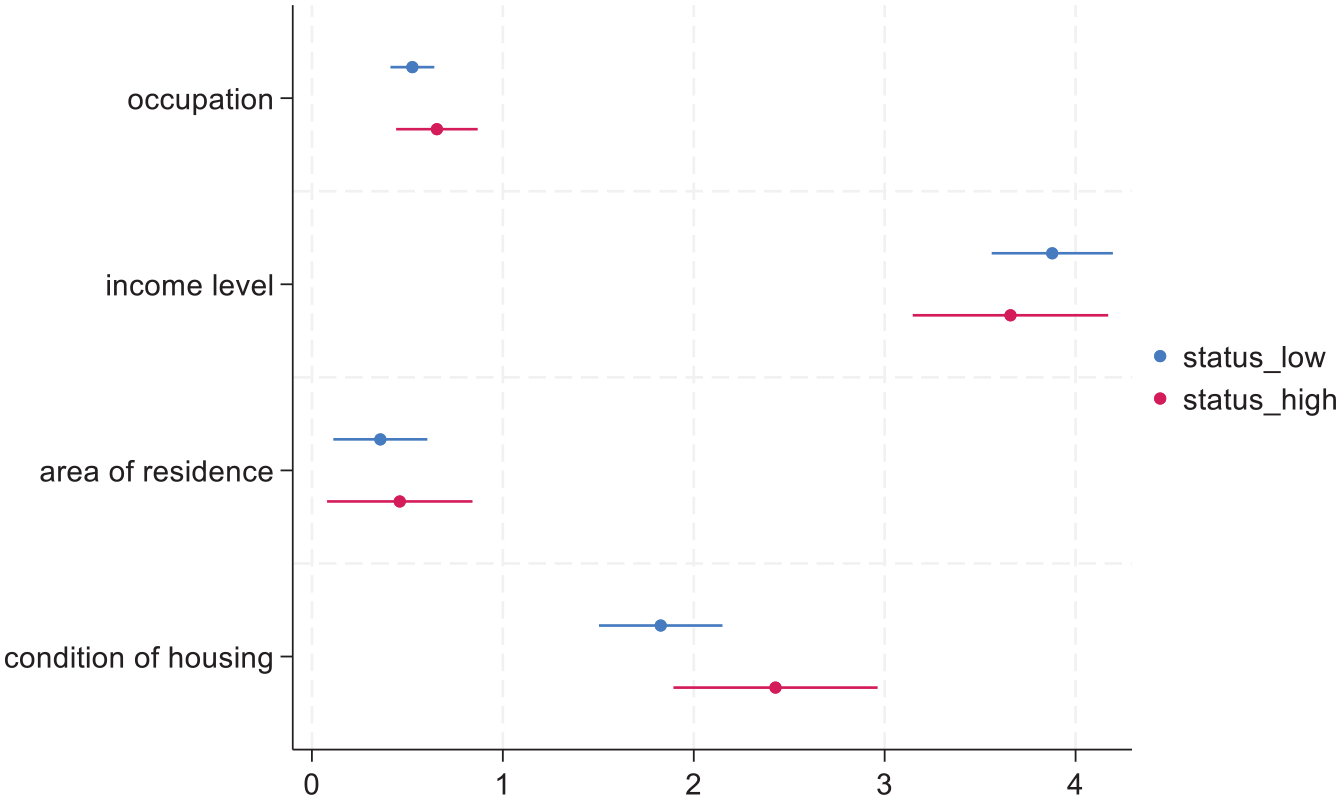
Weight of index characteristics of FAWISC depending on social status of respondents (with 4373 vignettes evaluated for low-status respondents (R2 = .26), and 1816 for high-status respondents (R2 = .24)).
Taken together, the subgroup comparisons yield some differences that fit theoretical expectations. In other words, they indicate construct validity. Note that in general the overall differences in judgments are rather small. This points to the external validity of the index.
In order to check predictive validity of the index, we finally calculated based on respondents’ occupation, income level, area of residence and condition of housing three status indices for the respondents (using the different formulas for Warner SCI (WSCI), adapted Warner ISC (AWSCI), and factorial Warner ISC (FAWISC). We compared these index values for the social status of respondents to their subjective evaluation of own social status, and used the most popular tool for subjective social status measurement in Ukraine – ‘The test of integral self-assessment of social status’. In this measurement, respondents are asked to determine their place on the ‘ladder’ of social status. We used a 5-point scale, where 5 is the highest status and 1 is the lowest. To highlight it again, the index values were calculated based on the respondents’ information on occupation, income level, area of residence and housing conditions (provided in the survey).
To assess the relationship between the three indicators and these variables, the Spearman rank correlation coefficient was used. The strength of the correlation was –0.344 (p < 0.01) for the WSCI, –0.356 (p < 0.01) for the AWSCI, and –0.483 (p < 0.01) for the FAWISC, respectively. Note that the coding order of variables is reversed for ‘ladder’ and the indices. The (by far) largest correlation was detected between the FAWISC and the ‘ladder’ indicator, which supports the predictive validity of the modified index.
Discussion and conclusion
In this article, we employed the factorial design method to evaluate an index of social status in contemporary Ukraine. We built upon the previous work of Kovalska (2019, 2020) by testing her suggestion of a status measurement index which comprises four independent dimensions (occupation, income level, area of residence, housing quality) and that was developed through expert discussion. A total of 791 respondents from the city of Kyiv evaluated approximately 6400 vignettes (describing fellow citizens), which varied orthogonally with respect to the factors of occupation, income, area of residence (neighborhood), and housing conditions (quality of housing). The four dimensions of the Kovalska’s proposed index (AWSCI) were translated into eight vignette factors, which were used to construct a fractionalized sample of vignette persons. The social status of these fictive characters was rated using these factors that corresponded to Lloyd Warner’s original concept. The factors of occupation and income situation were found to be independent, while the factor of area of residence of Warner’s concept was split into two parts: ‘prestige of the area of residence’ and ‘house type’. The factor of ‘house type’ was constructed to contain four sub-characteristics: ‘number of square meters per person’, ‘year of last repair’, ‘number of bathrooms’, and ‘durable items’.
The results of the analyses indicate that the factor ‘income level’ has the largest influence on the model’s predictive capacity, with a coefficient of 3.81. This is followed by the factor associated with ‘housing conditions’, which has a magnitude of 1.99. The contributions of the remaining factors, namely ‘occupation’ (0.56) and ‘area of residence’ (0.42), emerge as notably smaller, indicating a comparably marginal influence on the overall status evaluation. Our findings from the survey indicate substantial deviations from the expected coefficients based on the theoretical considerations of experts. Substantively, our analysis indicates that occupation has an even more limited impact on status evaluation compared to the experts’ estimation in previous research of Kovalska (2019). It is important to note that the use of the factorial design method in the assessment of occupation for the social status has an obvious limitation in the study at hand. Because we had to work with a fractionalized sample of vignettes in the experiment we could only vary four types of occupation. Although the four occupations came from different occupational status positions it would be recommended to include a much larger number of occupations in future studies (e.g. from all ISCO main categories).
Income level and, somewhat unexpectedly, the perceived ‘quality of housing’, contribute significantly to social status evaluation. We interpret the ‘quality of housing’ dimension as another ‘material’ criterion – in contrast to the neighborhood (‘area of residence’) which is more in line with classic concepts of high or low-status places to reside. In other words: it is not the location that provides Ukrainians with social status. It is more the characteristics of the housing: How modern is it? Does it have amenities? The low importance of the ‘area of residence’ is to some degree indicative for the loss of homogeneity in residential development in formerly prestigious (central) areas, where ‘old’ houses without appropriate renovation and amenities can be frequently observed. The characteristic of ‘housing conditions’ constitutes a more direct manifestation of residents’ social status. Consequently, this status signal is more dynamic and easier to ‘read’ in society, which explains the larger weight given to this characteristic.
Taken together, both ‘material’ dimensions currently drive the assignment of social status. This result refers to a profound transformation of the outdated ‘Soviet’ social order, which was mainly structured according to the contributions of individuals to the ‘Soviet’ system. With the advent of the market transformation, however, the value of material rewards derived from various market activities (including the black market and corruption) and the investment into better housing conditions become increasingly significant.
Note again that research was conducted with residents of the city of Kyiv. Nevertheless, we assume that overall patterns detected apply in general to other parts of Ukraine as well. But it well can be that the dominance of material factors is more pronounced in the metropolitan area. As the largest city in Ukraine, Kyiv certainly has a distinct employment structure, housing market, and socio-economic dynamics that may not fully reflect the status evaluation patterns in other regions. While our findings may provide a robust assessment of status perceptions in an urban context, they may not be directly generalizable to the more rural regions. Future research should examine how these status determinants vary across different regional contexts, including smaller cities, rural areas, and war-affected regions. 9
While our major finding demonstrates that occupation plays a relatively minor role in determining social status compared to income and housing conditions, the concept of occupation as a source of prestige nevertheless might regain importance in the near future. Ukraine is still in a state of an ongoing war which precipitates an economic recession, a surge in unemployment, and a general impoverishment of the population. Occupations that serve the basic needs of the state in wartime are in demand. These include medical doctors, construction workers, and military personnel. The number of people employed in these sectors is constantly growing. In addition, the processes of internal migration (within Ukraine) and external migration will very likely result in the emergence of new status markers (such as displacement, refugee status in another country, and the ability to remit financial resources to family members who remain in Ukraine). Certain areas of residence will gain or lose their impact on social status. It appears that certain regions of western Ukraine have become more attractive as a result of internal migration.
To sum up, the multidimensional index has the potential to serve as an explanatory variable in sociological research on Ukrainian society. Its application extends to the study of social stratification, as well as to analyses of values, leisure practices, and political orientations across different social groups. Integrating this index into broader sociological studies can provide deeper insights into how status characteristics influence various aspects of social life in contemporary Ukraine.
Footnotes
Declaration of conflicting interests
The authors declared no potential conflicts of interest with respect to the research, authorship, and/or publication of this article.
Funding
The authors disclosed receipt of the following financial support for the research, authorship, and/or publication of this article: This project has received funding through the MSCA4Ukraine project, which is funded by the European Union. Views and opinions expressed are however those of the author(s) only and do not necessarily reflect those of the European Union. Neither the European Union nor the MSCA4Ukraine Consortium as a whole nor any individual member institutions of the MSCA4Ukraine Consortium can be held responsible for them (Y.K.). T.H. acknowledges support of the Cluster of Excellence ‘The Politics of Inequality’ EXC2035/1–390681379.