
Abstract
The Covid-19 pandemic has increased the pressure on organizations to ensure health and safety in the workplace. An increasing number of organizations are considering wearables and physiolytics devices as part of their safe return to work programs so as to comply with governments’ accountability rules. As with other technologies with ambivalent use (i.e., simultaneously beneficial and harmful), the introduction of these devices in work settings is met with skepticism. In this context, nudging strategies as a way of using design, information, and other ways to manipulate behaviors (system 1 nudge) and choices (system 2 nudge) has gained traction and is often applied alongside the introduction of ambivalent technologies with the aim to “nudge” their use. While the feasibility of different nudge strategies is often studied from only a managerial perspective, where employees’ volitional autonomy and dignity is often treated as secondary, we explore which nudges are acceptable from the perspectives of ordinary workers. Using Q-methodology as a more evolutionary and participatory way to design nudges, we describe five basic strategies that are (to varying degrees) acceptable to them: (a) positive reinforcement and fun, (b) controlling the organizational environment, (c) self-responsibility, (d) collective responsibility, and (e) adapting the individual environment. Our findings show that there is a wide range of viewpoints on what is being considered an acceptable nudge and stress the importance of a transparent, equal dialogue between those who design nudges and potential nudgees.
Keywords
Introduction
Data-driven health initiatives are gaining interest among employers to improve occupational safety and health through monitoring and tracking employees in the workplace (Charitsis 2019). Particularly the Covid-19 pandemic has forced organizations to profoundly reflect on health issues in the workplace and to make the necessary arrangements so that employees can safely return to work (Kudyba 2020). In their struggles to meet ever-changing health regulations, organizations have begun to introduce numerous surveillance technologies: alongside mobile tracing applications relying on user input (e.g., manual entry of infection), wearables, or physiolytics devices (Mettler and Wulf 2019)—such as badges, patches, rings, wristbands, or smartwatches—are being used to monitor employees’ body functions (e.g., temperature, pulse, sweat, respiration) and behaviors (e.g., physical (in)activity, communication patterns) more reliably and without the need for user input (Cox 2020).
Now that the pandemic is coming to an end, organizations face the question what to do with the acquired surveillance technologies (Olson 2023; Putzier and Cutter 2023). Our central tenet is that we are witnessing a repurposing or rebranding of the surveillance technologies that have been introduced. Under the guise of occupational health and wellbeing (Tarafdar and Saunders 2022; Yassaee et al. 2019)—and tolerated by the European General Data Protection Regulation (GDPR) 1 —managerial oversight is being extended (Faraj et al. 2021) in order to decipher intimate preferences, everyday routines, subjective wellbeing, or emotions, so as to, for instance, predict performance loss (Fang et al. 2018) or job burnout (Dai and Zhu 2021). Several studies have highlighted the benefits of introducing wearables or physiolytics devices, such as for preventing serious work accidents (Sarkar et al. 2019), protecting against life-threatening hazards (Asadzadeh et al. 2020), or long-lasting physical damages due to unhealthy work habits (Ailneni et al. 2019). But even if it there may be benevolent intention, the implementation and continued use of these devices poses risks to workers’ fundamental rights and dignity (de Vaujany et al. 2021; Gal et al. 2020; Leidner and Tona 2021). Given the sensitive nature of the data that are being collected by these devices, it is not particularly unusual that employees are critical and sometimes even dismissive of their introduction (Oesterle et al. 2019; Young et al. 2021).
Where a usage cannot be mandated by heightened public interest—such as for policing, firefighting, or public transportation (Bu-Pasha 2022; Lee et al. 2016)—organizations therefore rely on hidden, reinforcing, or reprogramming strategies for altering employees’ attitudes, perceptions, motivations, and actions (Feng et al. 2019; Pellegrini and Scandura 2008). Nudging—understood as a concealed way of using design, information, and interaction elements to manipulate choices and behaviors (Hansen and Jespersen 2013; Ho and Lim 2018; Johnson et al. 2012)—is often presented in this context as a noncoercive way to adjust persons’ demeanor without necessarily affecting discretion (Sunstein 2014). In IS, nudging has become the focus of research owing to its potential to assist users in their decision processes (Haki et al. 2023; Hummel et al. 2017) or to elevate their user experiences (Schneider et al. 2018; Xiao et al. 2022), but more importantly also to improve adherence to organizational guidelines (Feng et al. 2019; Nwafor et al. 2021) as well as to enhance work outcomes (Mohammadhassan et al. 2022). Owing to the fact that nudges can be designed both to strengthen surveillance capitalism by increasing personal data disclosure as well as to protect individuals from the negative consequences of unsafe data behaviors (Balebako et al. 2011; Kroll and Stieglitz 2019), the subject of and controversy around privacy nudges have been a subject of a wide range of studies (Acquisti et al. 2017; Barev et al. 2021; Dogruel 2019; Zimmermann and Renaud 2021). However, the research in this line of investigation has often neglected the workplace as a setting for analyzing and solving privacy issues, focusing instead on consumer market scenarios, such as to prompt individuals to purchase or recommend certain products (Ho and Lim 2018; Mirsch et al. 2017) or to accept service defaults (Figl et al. 2021). In proposing IS nudge strategies, the research has equally been limited to online decision environments or user interface design elements (Bammert et al. 2020; Caraban et al. 2019; Weinmann et al. 2016). There has been little work on social nudges or the integration of analog cues for triggering behavioral changes (Kretzer and Maedche 2018). Finally, and owing to the widespread tendency in IS to regard the practitioners with whom engagement is sought to be exclusively managers (King and Learmonth 2015), the concerns of ordinary staff members have also received little scholarly attention (Giermindl et al. 2021). Accordingly, recommendations for nudge designs are often formulated so as to maximize organizational profits within the scope of legal possibilities and employees’ tolerance, seeing their dignity and volitional autonomy as a secondary consideration.
With this article, we seek to better understand what employees consider acceptable nudge strategies in occupational health and wellbeing programs to incentivize the use of wearables or physiolytics devices. An investigation of this nature is necessary because the implementation of controversial information systems (IS), such as wearables or physiolytics in the workplace, requires an organic approach that considers the perspectives and emotions of the user base, rather than a top-down structured or expert approach, which may encounter resistance from employees (Jewer and Compeau 2021; Nan 2011). Research suggests that the acceptability of nudges, which refers to the degree to which individuals respond positively to nudges after they become transparent, may differ depending on their individual views, values, or beliefs (Al-Natour and Benbasat 2009; Hagman et al. 2015; van Gestel et al. 2021). Therefore, in order to anticipate potential causes of resistance and potentially avoid implementation failures (Iivari and Iivari 2011; Iivari et al. 2010), it is essential to gain a better understanding of employees’ distinct worldviews or niches (Mettler et al. 2017). Likewise, any problematic aspects of nudging must be exposed in a timely manner to prevent the desire to better orient employees in the use of an IT artifact from turning into disguised manipulation within a normative framework (Reach 2016).
This article represents a departure from prior research by focusing specifically on the workplace and intentionally concentrating on the opinions of ordinary staff regarding the appropriate use of wearables or physiolytics devices for promoting health and wellbeing. Moreover, this article applies a socio-technical perspective by extending the notion of nudges to include both digital and analog cues. Unlike most existing research, this article recognizes that individuals who are being nudged are not a homogeneous group, but rather have distinct preferences and perceptions toward the technology and the employer that may influence their behavior and reaction towards nudges. Therefore, the objective of this article is to identify various profiles that exhibit diverse attitudes towards accepted nudge strategies in the workplace context. In doing so, we contribute to and extend the research on nudging (Caraban et al. 2019; Davidson et al. 2022; Dennis et al. 2020; Xiao et al. 2022) by providing a critical and socio-technical reflection on how to develop ethical and more widely accepted nudge strategies to be implemented in cyber-physical spaces. To achieve this, we use Q-methodology (Klaus et al. 2010; Mettler et al. 2017), a robust methodology for systematically exploring human subjectivity, to show the wide range of diverse opinions and attitudes towards nudges. In applying this method, we not only contribute to the dissemination of a relatively unknown approach in the IS field, but also highlight the often-underestimated complexity of developing ethical and accepted nudge strategies (Bergram et al. 2022; Dalecke and Karlsen 2020; Mele et al. 2021). Given that wearables and physiolytics devices have ambivalent use (Aanestad et al. 2018), offering health benefits while posing privacy risks to staff members, our research equally provides a compelling case for IS ethics research. It emphasizes the crucial importance of considering ethical implications when implementing such technologies in today’s complex reality.
The remainder of the paper is structured as follows. In Section 2, we delineate the emergence of a new market for wearables and physiolytics devices and clarify their relationships to and possible ethical conflicts emanating from using nudge strategies. In Section 3, we provide a step-by-step description of Q-methodology, which we used to examine employees’ different worldviews toward nudging their use of wearables or physiolytics in the workplace. This is followed by our qualitative interpretation of the empirical findings, which we detail in Section 4. In Section 5, we discuss the implications and limitations of our work, concluding in Section 6 with reflections on possible future research avenues based on our Q-methodology examination.
Background
The emergence of a new market for connected devices
The emergence of connected devices that collect and process huge amounts of information is widespread among organizations in industrialized countries (Olson, 2023). It is hard to find a workspace in which such digital technologies do not support employees in their daily activities (Al-Dabbagh et al. 2016; Young et al. 2021). From simple digital signposts to complex sensor-based steering control systems, organizations have expanded the collection and integration of information (in real-time) for enhancing collaboration, increasing productivity, and/or ensuring workforce safety (Dawson-Haggerty 2019; Jarrahi et al. 2021). Considered to be the infrastructural foundation of an innovative and interactive workplace, these digital technologies often bring new challenges into the workplace, because they continually reshape how employees and organizations interact and communicate in their working environment and profoundly transform both work practices and governance (de Vaujany et al. 2021; Lyytinen et al. 2004; Möhlmann et al. 2021). In general, the relationship between humans and machines becomes more intertwined: so-called connected workplaces require more accuracy, consistency, and effectiveness to meet certain standards and norms (Benbya et al. 2021; Burton-Jones and Grange 2012). Users need to co-evolve with technologies. Thus, with the implementation of new digital technologies, there are frequent tensions owing to employees’ incapacity to adapt to new workflows and vice versa (Majchrzak et al. 2016; Yu et al. 2019).
Wearables and physiolytics devices constitute typical instances of digital technologies that are being implemented as part of connected workplaces (Mettler and Wulf 2019). Designed as an ensemble artifact, consisting of a hardware component (e.g., a biosensor or motion sensor) and software algorithms for processing physiological and behavioral data, they seek to change human behaviors and perceptions through analytical feedback (Wilson 2013). Intuitive and easy to use, they stand out for their capacity to gather a large number of data, their high accuracy, and their relative affordability (Demiris 2016; Lavallière et al. 2016; Lupton 2014; Patel et al. 2015).
Overview over use cases and data collected by wearables and physiolytics devices.
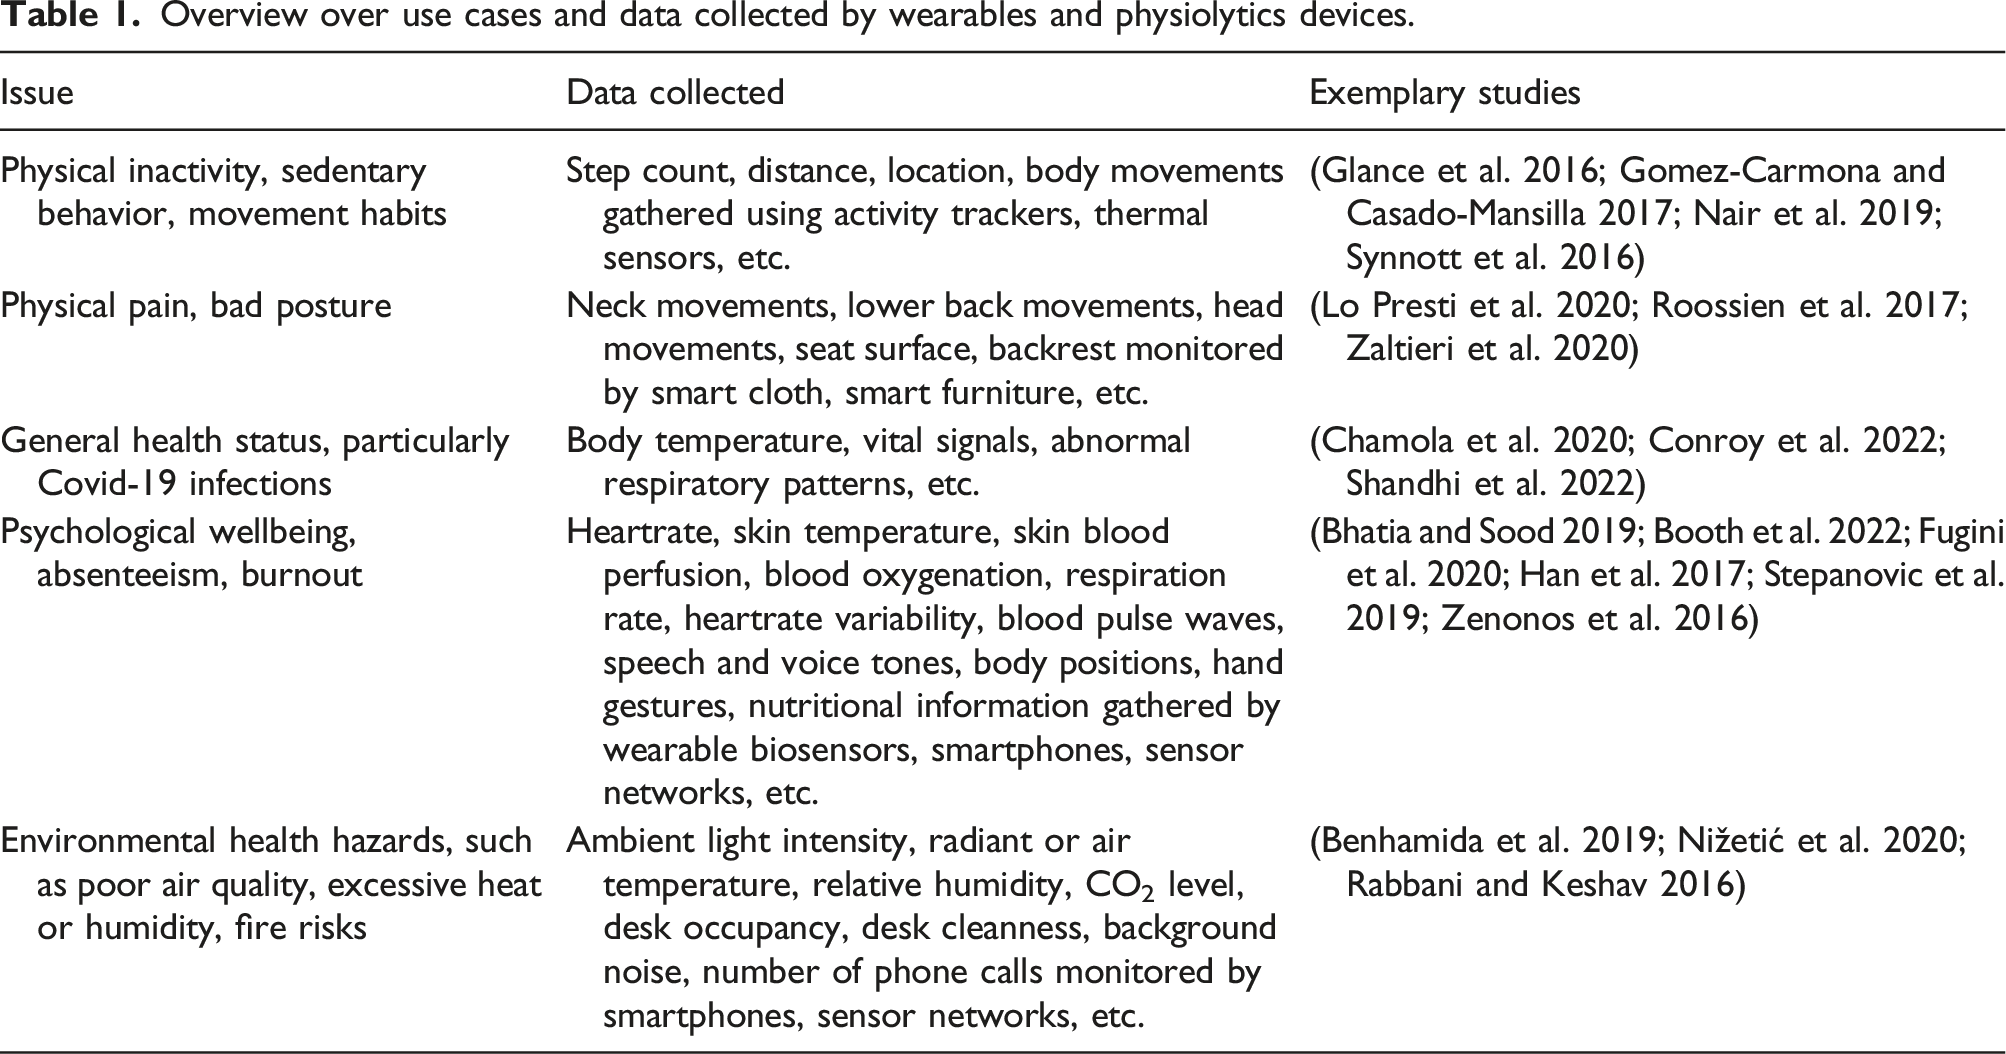
During the Covid-19 pandemic, wearables and physiolytics devices turned out to be especially useful, as they allowed organizations to monitor both the physical locations and the health statuses of their workforce (Trang et al. 2020). Contact tracing applications that track user proximities and locations through GPS and tokens were used worldwide—also by businesses, administrations, and schools—for providing accountability to limit the spread of the virus. Chamola et al. (2020) report on the key roles of wearables during the pandemic in detecting temperature, vital signs, and abnormal respiratory patterns. In just a few months, tech companies that had focused primarily on the consumer market sensed opportunities to expand their areas of business. FitBit, known for its fitness trackers and sports equipment, launched a new service called Ready for work to promising employers to tackle the unprecedented challenge of monitoring employees’ health status for safe returns to the workplace using its devices (FitBit 2023). BioIntelliSense’s BioButton, until then mainly used in the clinical research context, opened another foothold in the particularly troubled tourism industry by offering a solution that helped track tourists and hotel personnel. 2 Similarly, companies such as Microsoft, also seized the opportunity to expand (or adapt) their product lines to add an offering for the monitoring and tracking of the employees’ health (Microsoft 2023). In the course of the Covid-19 pandemic, the wearable tech market increased from $22 billion in 2018 to an estimated $54.4 billion in 2023 (GlobalData 2023).
The need to nudge employees to use connected devices
Even before the pandemic, organizations saw themselves as being in a constant battle to motivate employees to participate in occupational health and wellbeing initiatives (Hamblen 2015). Particularly in the U.S., where health insurance coverage is tied to an employment contract, employees expressed heightened concerns about loss of privacy, autonomy, and dignity resulting from the use of company-sponsored wearables and physiolytics devices (Schall Jr et al. 2018). However, organizations seem successful at allaying initial concerns, either by reaffirming that there is no repurposing of data for purposes other than work-related issues or by considerably exerting pressure (Moore and Piwek 2017). Several studies nonetheless report a growing dissatisfaction and resentment among employees, ultimately leading to different workarounds and undesired outcomes in the long run (Canhoto and Arp 2017; Mettler and Wulf 2020). It is not uncommon that employees develop strategies for neutralizing or subverting an employer’s excessive collection of personal information, such as avoidance, piggybacking, or distorting moves (Ferneley and Sobreperez 2006). Organizations have therefore designed nudge strategies as a countermeasure to ensure the long-term use of connected devices, to prevent workarounds, or simply to achieve the outcomes that they consider desirable (Davidson et al. 2022; Haki et al. 2023; Kretzer and Maedche 2018; Tarafdar et al. 2022).
Beyond the case we examine in this paper, developing and implementing nudges that help organizations to promote important corporate or societal goals has received much attention. For instance, nudges have been introduced—by the UK Government (2023) and other countries—to boost organ donation rates by having a country’s citizens automatically registered as organ donors but giving them the possibility to opt out. In the IS research, the design and implementation of nudges has centered on and has often been limited to digital choice environments (Weinmann et al. 2016). Considering that decisions are increasingly made online (i.e., on-screen of or with the help of a digital device), nudging in this context specializes in subtle design, information, and interaction elements to guide user behaviors in digital environments (Caraban et al. 2019; Meske and Potthoff 2017). Digital nudging has been applied, for instance, to influence users’ privacy preferences (Balebako et al. 2011; Kroll and Stieglitz 2019), password settings (Kankane et al. 2018), mitigation of online security risks (Yevseyeva et al. 2014), or in e-commerce for multichannel choices of digital services (Hummel et al. 2017), increasing engagement with banking applications (Wijland et al. 2016), and crowdfunding (Simons et al. 2017). During the pandemic, digital nudging has found particular application in motivating the use of contact tracing apps (Riemer et al. 2020; Saw et al. 2021; Sideri and Prainsack 2022). But since the boundaries between digital and analog are becoming increasingly porous, several studies point to the importance to also foresee social nudges outside digital choice environments to achieve desired outcomes (Feng et al. 2019; Kretzer and Maedche 2018; Zimmermann and Renaud 2021). 3
Whether the environment is digital or analog, the driving force behind nudges is to systematically “exploit” persons’ cognitive biases, so that they act in their best-defined self-interest and/or in society’s best interests (Sunstein and Thaler 2008; Sunstein 2014). Based on dual process theory (Kahneman and Egan 2011; Sloman 1996; Sun 2002), researchers from fields as diverse as economics (Sunstein 2014), psychology (Viale 2019), public policy (Banerjee and John 2021), or IS (Ferratt et al. 2018) have observed two essential functioning modes to do so (see Figure 1). Considered more effective but non-educative (Sunstein 2016), system 1 nudges systematically target the manipulation of behaviors and, in doing so, benefit from persons’ automatic processing of information. Forcing a user to take action, a graphical warning shown in the user interface can be a way to implement a system 1 digital nudge. Taking advantage of people’s inertia, automatic enrolment in an organization’s IT-enabled occupational health and wellbeing program could be a way to implement a system 1 social nudge. In contrast to manipulating behavior, by manipulating choice, system 2 nudges seek to harness persons’ deliberative processing of information (Hansen and Jespersen 2013). According to Sunstein (2016), system 2 nudges should be preferred, as they respect individual autonomy and dignity more and promote individual agency. While system 1 nudges are often deceptive, system 2 nudges can be understood as channels that provide information, signals, and notices to ultimately lead to reflective thinking about an action (Ferratt et al. 2018; Jung and Mellers 2016). In a digital environment, for instance, a system 2 nudge could be implemented by providing detailed information on the terms and conditions of the organization’s occupational health and wellbeing program as well as about its data collection and processing methods. Designating a team member as instructor, reminder, or key contact person in case of questions and doubts could be a system 2 social nudge. Functioning and Environment of Nudges.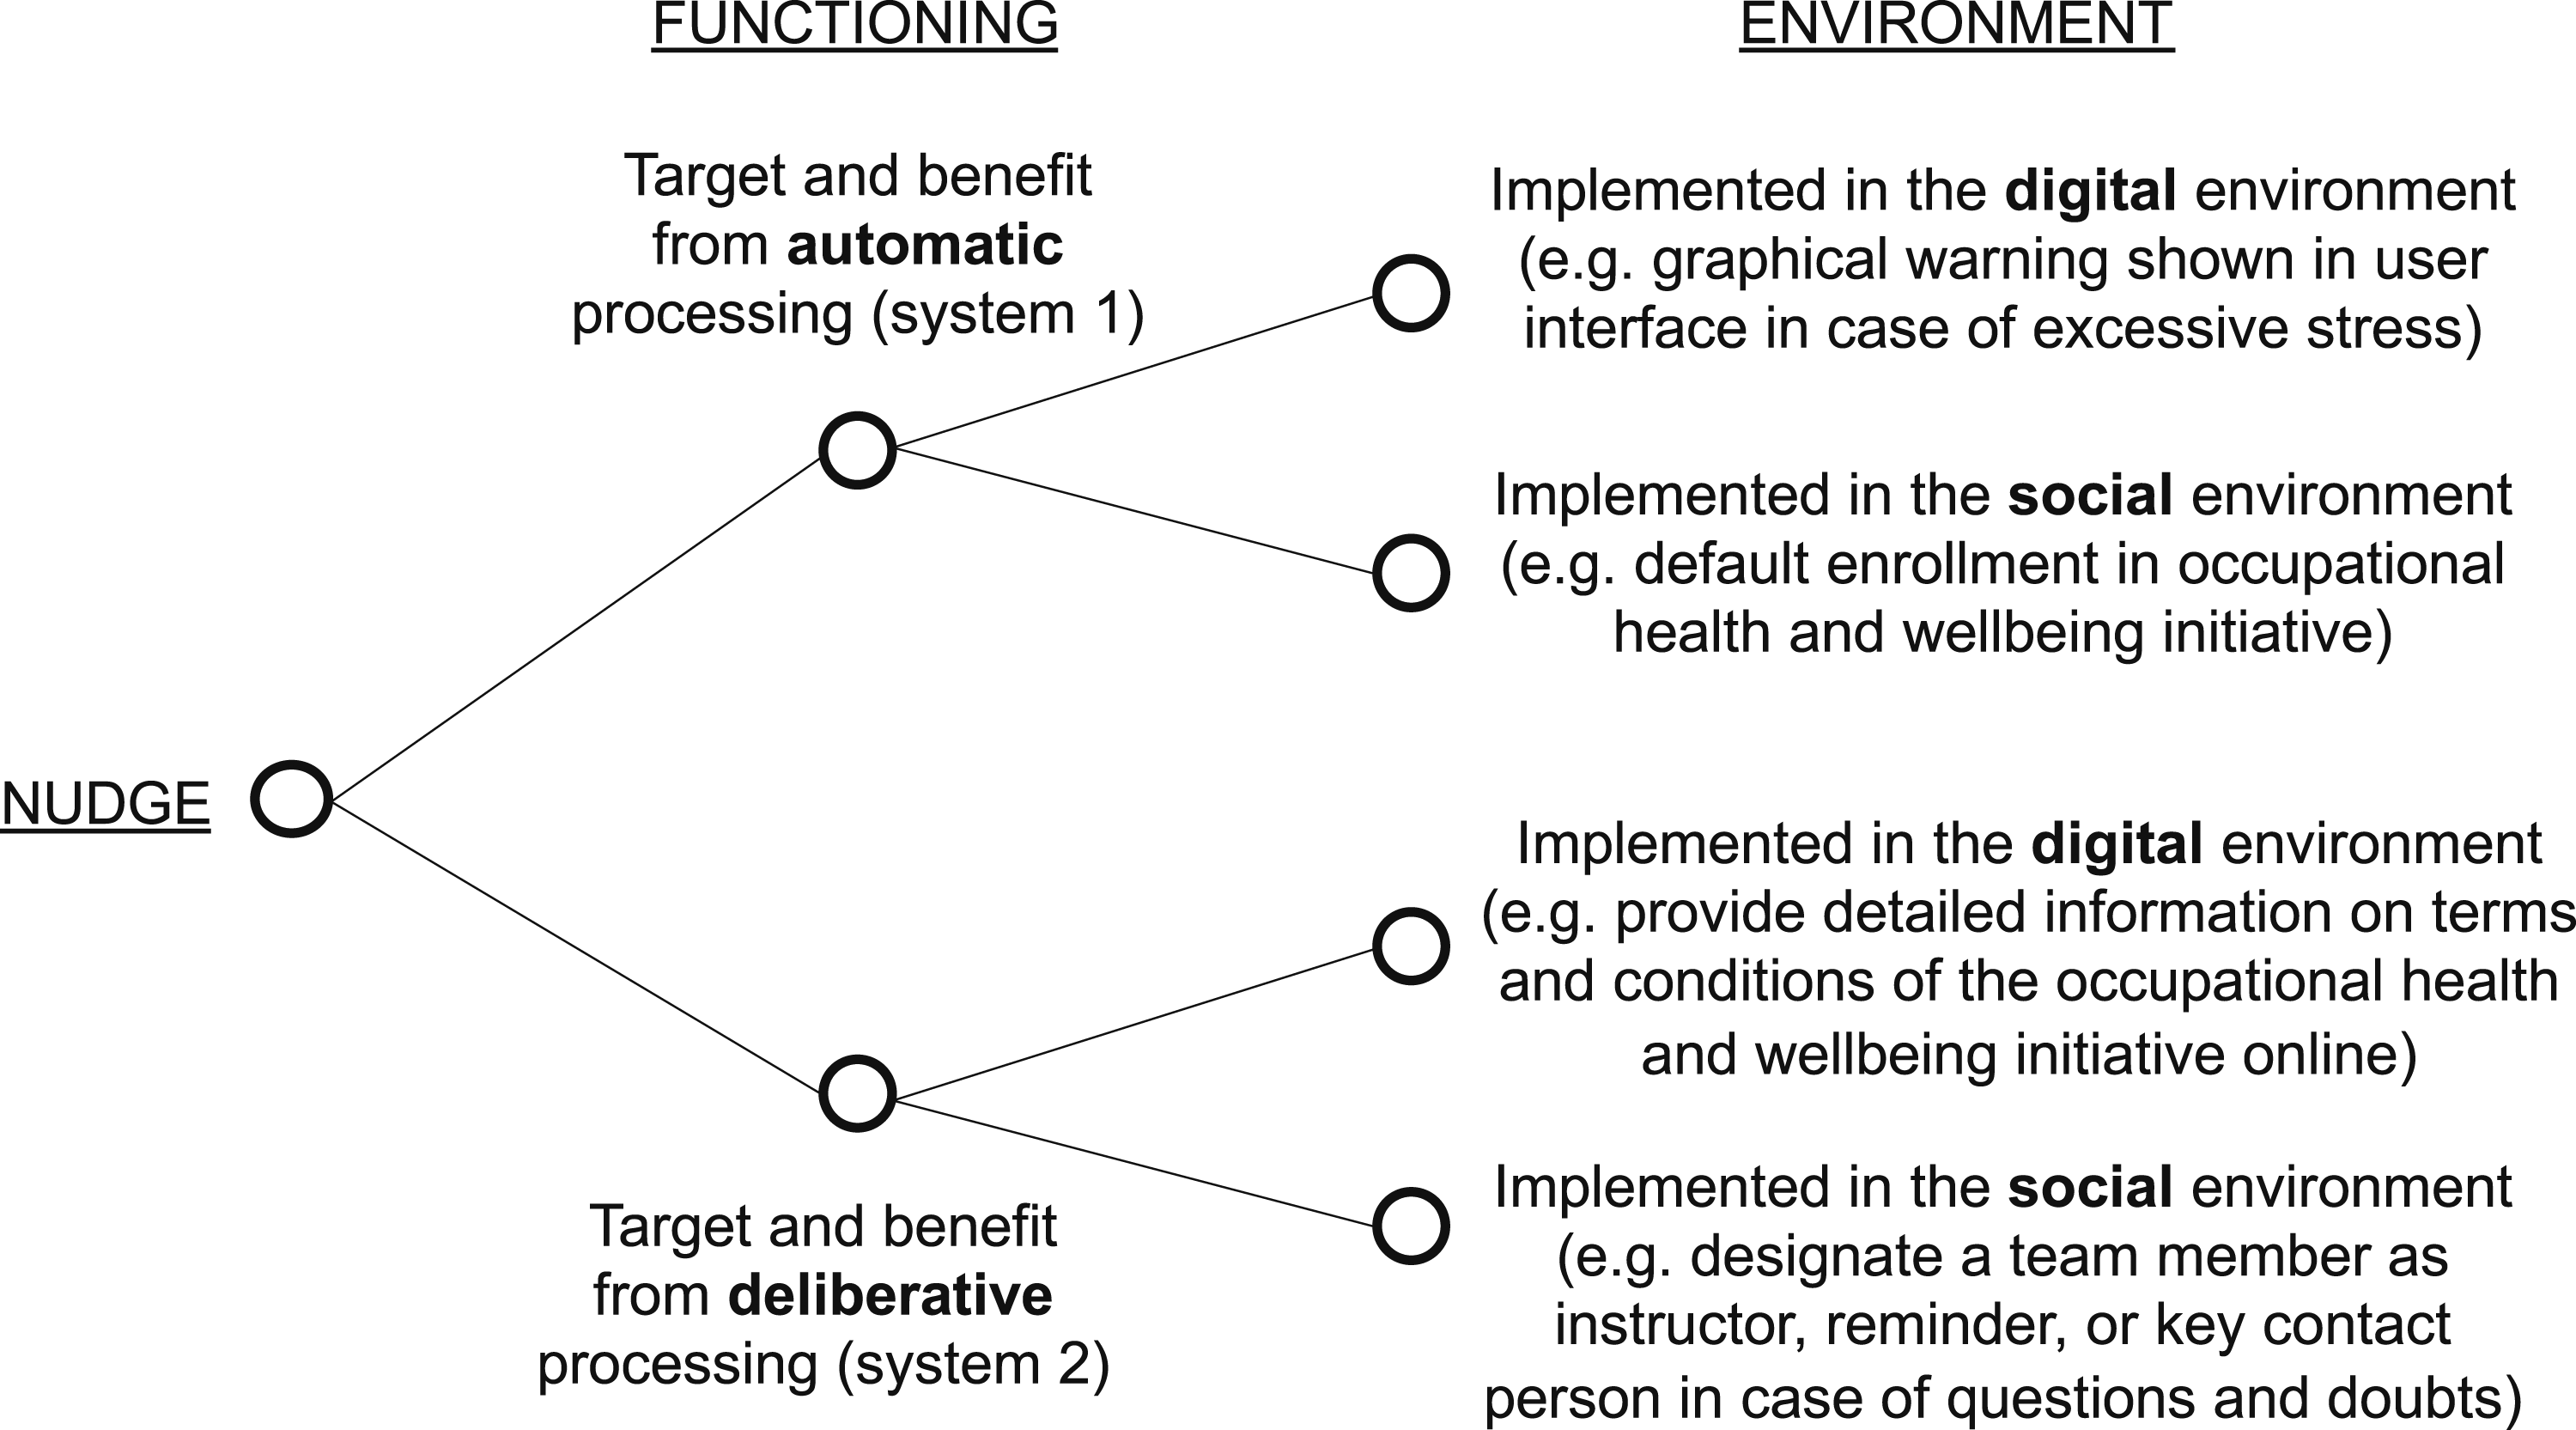
A possible way to identify nudges that are acceptable to employees
Even if those who develop and implement nudges have a benevolent intention, the very concept of nudging has drawn criticism (Lembcke et al. 2019; Menard 2010; van Gestel et al. 2021), given that system 1 nudges use deception and concealed forms of design, information, and interaction to manipulate behaviors (Ho and Lim 2018; Johnson et al. 2012), or given that the transparency and visibility guidelines for the less malicious system 2 nudges tend to be hard to apply in practice (Hansen and Jespersen 2013). While there are numerous alternative nudge taxonomies (Dolan et al. 2012; Hollands et al. 2013; Johnson et al. 2012; Münscher et al. 2016) or classifications (Broers et al. 2017; Mirsch et al. 2017; Szaszi et al. 2017) in the literature than what we have presented so far, the question who decides on the adequacy of chosen nudges has received little attention, particularly in the IS field, or was hastily formulated in favor of employers. 4
In the broader sociology and ethics literatures, this question is controversial (Conly 2012; Schmidt and Engelen 2020; Selinger and Whyte 2011). Clavien (2018), for instance, suggests that nudges can be ethically acceptable if they help to achieve a desirable outcome, fulfill important values or moral principles, and stem from employers’ good intentions that are shared by those being nudged. On the other hand, opponents of the current form of libertarian paternalism see individuals’ volitional autonomy as being in jeopardy (Rebonato 2014; Whitman and Rizzo 2015). Since nudgers pull strings and employ tricks to get people to do what they want (Hausman and Welch 2010), it is hard to decipher whether the resulting desires and actions are genuinely one’s own, or the result of the nudger’s manipulation. Whitman and Rizzo (2015) add that it is especially problematic when nudgers impose values on people without having a deep understanding of their preferences and conflicts. To find out which nudges are positively received and which are rejected outright by people, Richardson and John (2021) suggest that those developing and implementing nudge strategies set aside (top-down) experimental designs and “let in the messiness and loss of direct control” by applying more engaged (bottom-up) research types that allow nudges to emerge more naturally and with minimal guidance from experts. Advocating an evolutionary co-design process—after having limited success with expert-led designs—they showed that nudges designed in a participatory, iterative, and reflexive way not only improve transparency, but also reduce frustration with and ultimately increase the acceptance of nudges.
A possible way to realize such an evolutionary co-design process is Q-methodology, because it offers a rigorous structure to systematically explore subjectivity by measuring individuals’ mindsets and perspectives (Brown 1993; Stephenson 1986). Although individual viewpoints may change over time according to work contexts and personal circumstances, Q-methodology focuses only on salient viewpoints, which are likely to be more enduring (Lobo et al. 2012). This approach is often employed to frame problems characterized by uncertainty and value conflicts. As a combination of both quantitative and qualitative approaches, Q-methodology combines mathematical rigor (providing numerical measures) and an interpretive component (the numerical results are then interpreted), as we will now discuss.
Methodology
Q-methodology has several steps. It starts with gathering the possible range of transferred opinions on a subject. Next, across these viewpoints, prevailing variations are identified and then connected in a logical and organized way. The relationships are then obtained following an individual rank-ordering of viewpoints that are statistically compiled through an inversion of conventional factor analysis (Kelly et al. 2016; Watts and Stenner 2012). Finally, the assessment of the correlation is done through an interpretative process (rather than a mathematical procedure) to map the results, labeled as factors. These resulting factors represent participants’ subjectivity on a topic and tell specific stories about their beliefs, values, and perceptions, enabling researchers to identify patterns in respondents’ perspectives on these problems, reducing some of the surrounding complexity (Brown 1993; Kelly et al. 2016; Watts and Stenner 2012). Q-methodology offers relative freedom to express opinions and attitudes, since the rank-ordering of viewpoints is done as an individual task and with minimal researcher presence. Thus, no opinion is imposed, and no group dynamics appear, as could be the case during group sessions. The participants may proceed to the classification based on their experience and without embarrassment while taking the time they deem necessary (Hughes 2012; Wint 2013). Only after conducting the analysis do shared viewpoints emerge, allowing one to hear each individual voice and, at the same time, outlining a collective view (Plummer 2012).
In IS research, Q-methodology has been applied for assessing the impacts of and perceptions on a wide variety of technologies (Baker et al. 2014; Bouwman et al. 2012; Klaus et al. 2010; Mettler et al. 2017; Mettler and Wulf 2019; Rahim et al. 2011; Wingreen et al. 2020). For studying the acceptability of nudges, the added value of this approach is its focus of the construction of nudges and not directly the constructors, that is, the people and their characteristics (Stainton Rogers 1995). The objective is not to obtain “truth,” but to collect and investigate persons’ various accounts on what they deem acceptable. Accordingly, it helps to unveil different thought patterns rather than demographic characteristics, which often remain undetected with typical survey-based studies (Mettler and Wulf 2019; Zabala and Pascual 2016). We will now describe the methodological steps in some detail (for a summary, see Figure 2). The Steps in Our Q-methodology Study.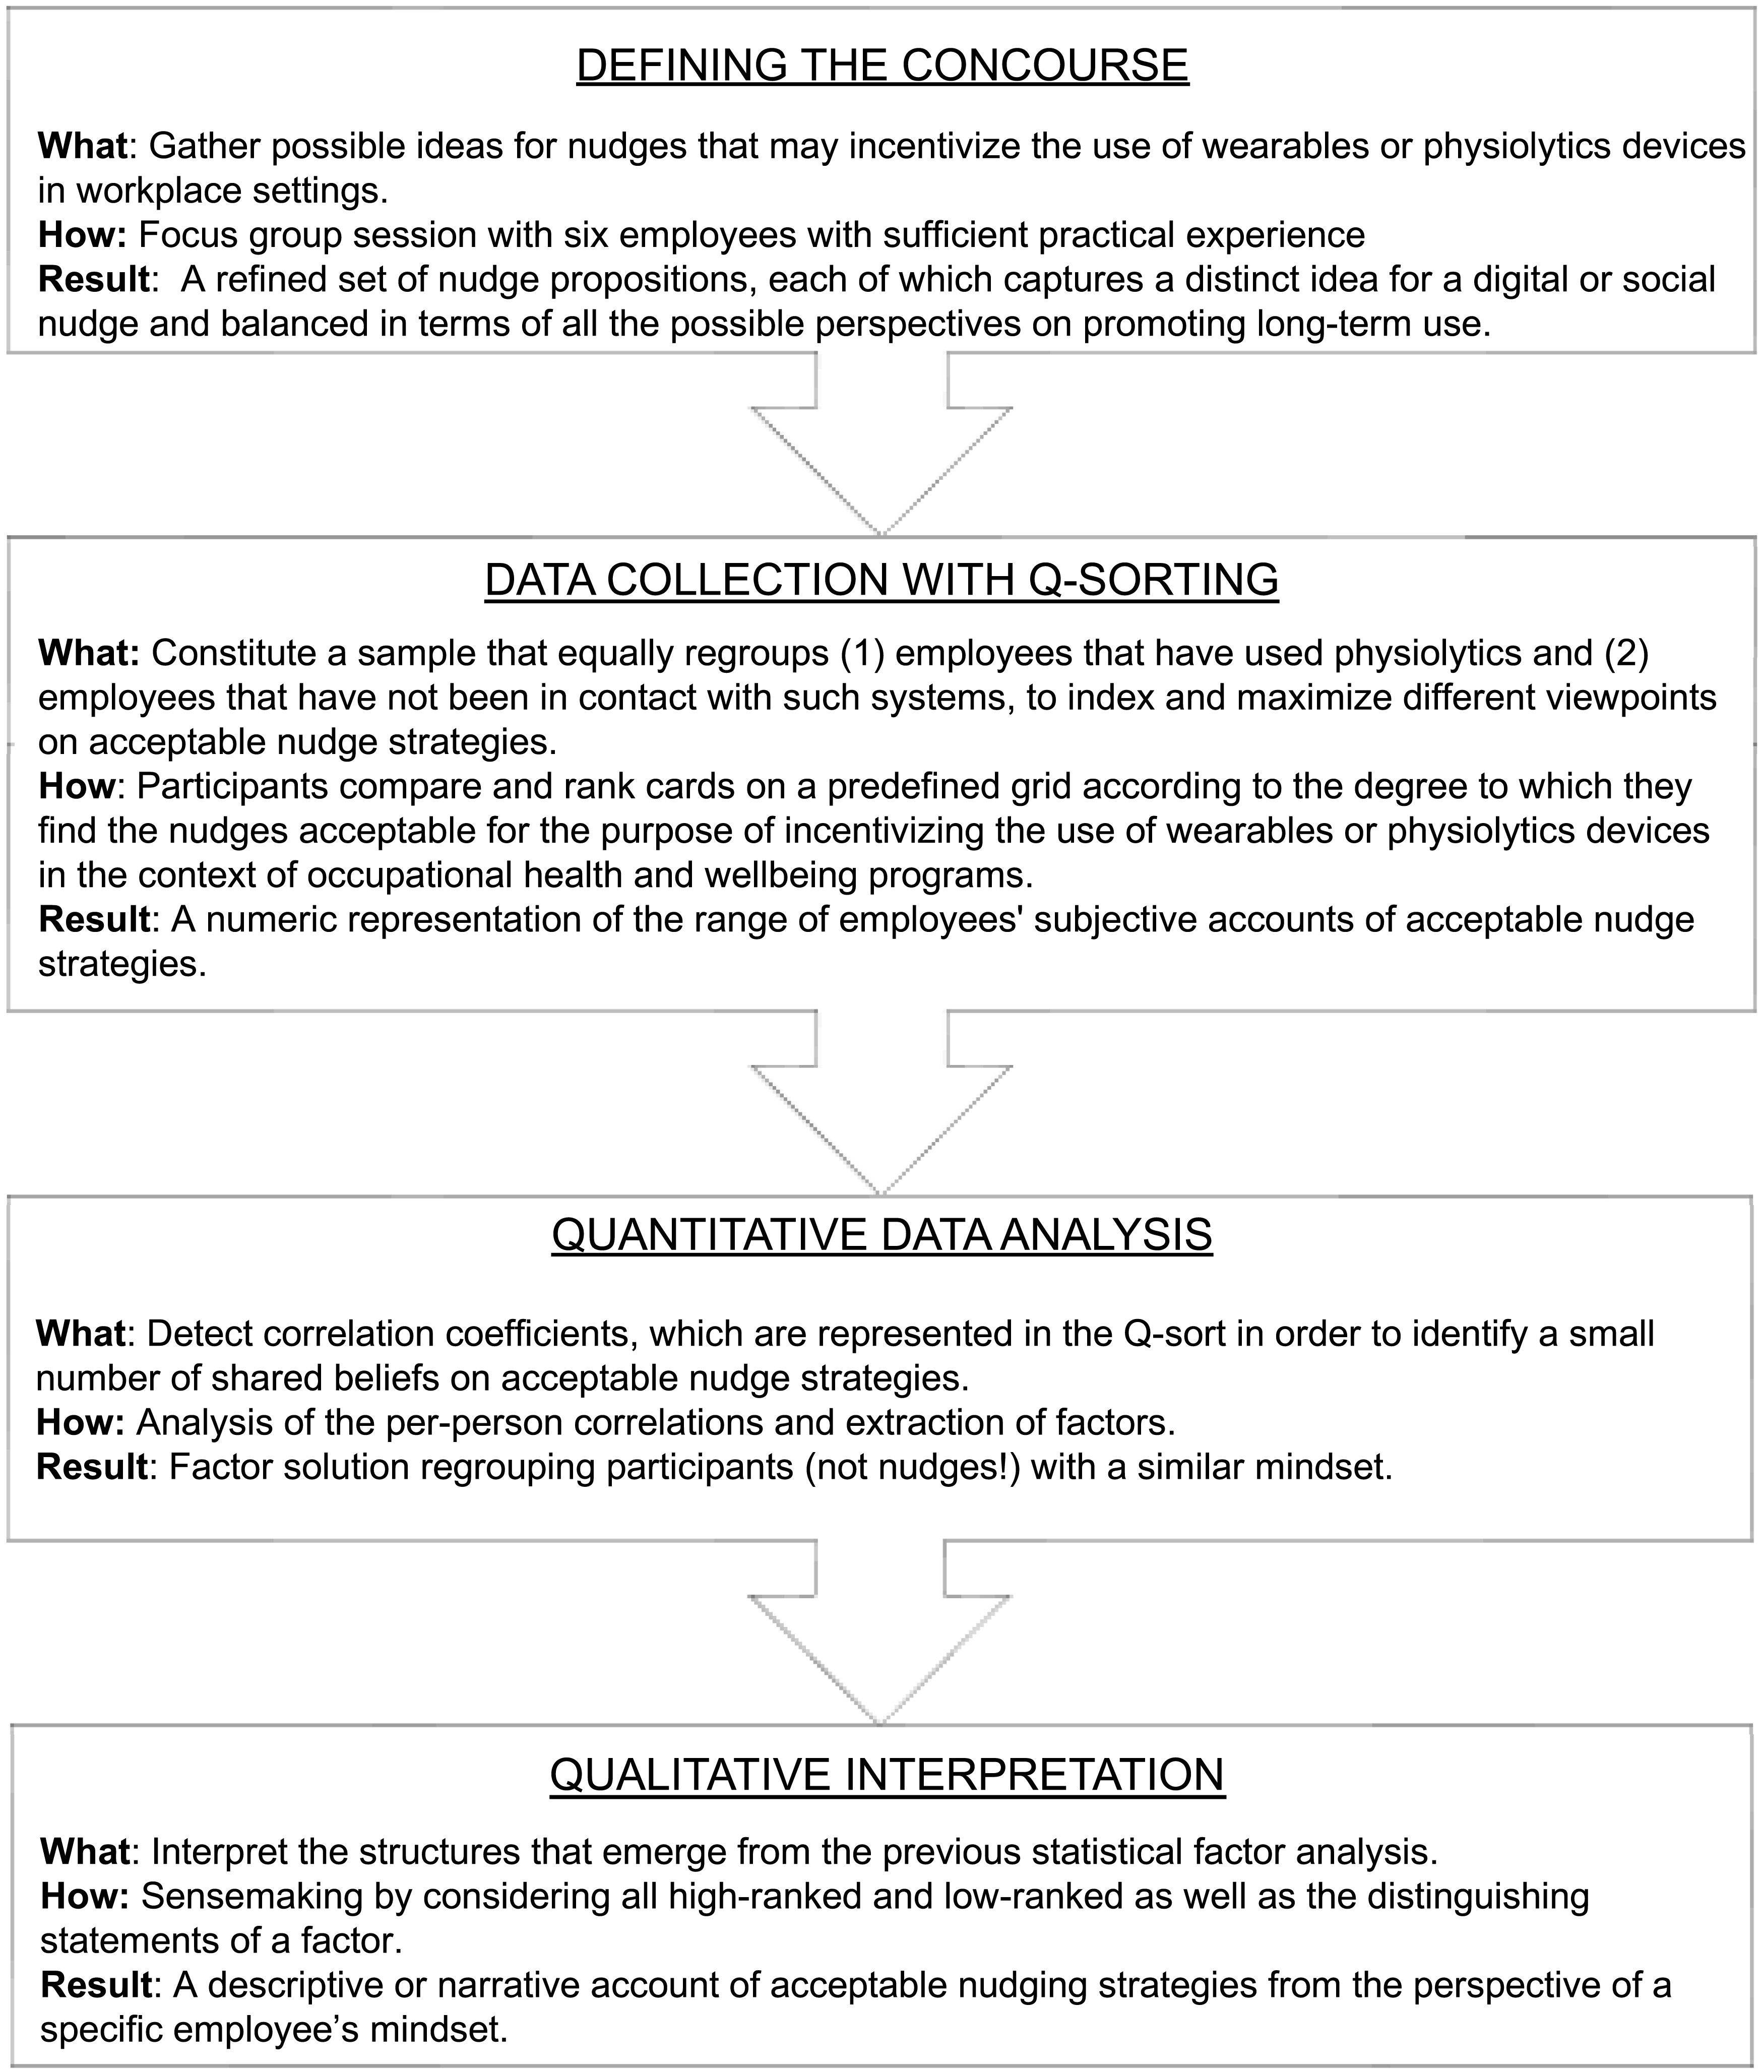
Defining the concourse
The first step in Q-methodology is called concourse, which consists of capturing a comprehensive set of social discussions and relevant discourses about a topic (Brown 1993; Kelly et al. 2016; Nijnik et al. 2014; Stainton Rogers 1995). For this purpose, we convened a focus group session with six employees from a mid-sized organization in Switzerland. Having previously participated in a 6-month pilot study where they could actively sense the (dis)advantages of health monitoring at work, all participants had extensive experience with wearables and physiolytics devices as well as a grounded understanding of the elements, processes, and properties of IT-enabled occupational health and wellbeing programs. In selecting the focus group participants, we paid particular attention to a balanced distribution concerning age, gender, health and activity levels, technical affinity, and a broad representation from the firm’s different departments. Being aware of the paradox that using wearables and physiolytics devices in the context of work may have positive and negative consequences (technology with ambivalent use), we confronted them with the idea of nudges and the current notion of top-down, expert-led design of nudge strategies. After a brief discussion on the ethical ramifications of such a procedure, we asked them to propose nudges for incentivizing the long-term use of wearables or physiolytics devices in the workplace that in their view respected their individual autonomy and dignity. 5 Following Riedl and Young (2006), various creative approaches—such as brainstorming and lateral/critical thinking methods—were used, letting the participants explore, cluster, and refine their propositions. Arriving at an initial set of 40 nudges, we then noted them onto cards to develop our Q-sample, that is, the set of statements used for the subsequent data collection, referred to as Q-sorting (Kelly et al. 2016).
Notably, there is no sole or exact way to produce a Q-sample. According to Q-methodology theorists, the development of the Q-sample must be adapted to the demands of the research question and the requirements of the analysis (Akhtar-Danesh et al. 2011; Brown 1993). While an unstructured approach arguably allows more freedom and flexibility to arrange a series of items into a comprehensible set, the strengths of a theoretical sampling of statements is to balance the variety (not the majority) of viewpoints that the process seeks to capture (Stainton Rogers 1995). The extent to which statements are re-worded in this process is also a matter of judgment for the researchers (Shemmings and Ellingsen 2012). The language used to formulate the statements should be appropriate for the sorters (not the researchers), which is why ambiguities are often inevitable. Different to survey research, where a rewording and a shortening or lengthening of questions are used for improving clarity, there is no problem to include complex and multiple, ambiguous, or two-headed statements into the Q-sample if it helps to capture a phenomenon’s broadness and variety (Shemmings and Ellingsen 2012). We chose to sample the statements (with minimal rewording) along the aforementioned theoretical spectrum to obtain a balanced set of statements that represent digital and social nudges that target and benefit from persons’ automatic (system 1) and deliberative (system 2) information processing. To respect the distributional assumptions of Q-methodology and to speed up the subsequent Q-sort, as we will detail next, we further reduced the Q-sample to 27 statements, out of which 12 cards constitute system 1 nudges and 15 cards system 2 nudges, respectively, 18 social and nine digital nudges (see Appendix A).
Data collection with Q-sorting
The core of Q-methodology consists of arranging the cards based on participants’ subjective understandings, opinions, and perceptions (Donner 2004). We selected the participants—generally known as the P-set (Brown 1993; McKeown and Thomas 2013)—to gather different actors in the area, thereby collecting a broad panel of perspectives. We invited 30 persons to take part in the Q-sorting: half were employees from the same medium-sized organization that recently ran a pilot to test an IT-enabled occupational health and wellbeing program (but have not previously been involved in the development of the Q-sample), while the other half were employees from another organization without previous exposure to a safe return to work initiative based on wearables and physiolytics devices. The sample size had a low determining role, since small samples are appropriate as long as all potential perspectives are covered (Kelly et al. 2016; Watts and Stenner 2012). In fact, Q-methodology seeks to be able to describe typical representations of different viewpoints rather than to find the proportion of individuals with specific viewpoints (Shemmings and Ellingsen 2012).
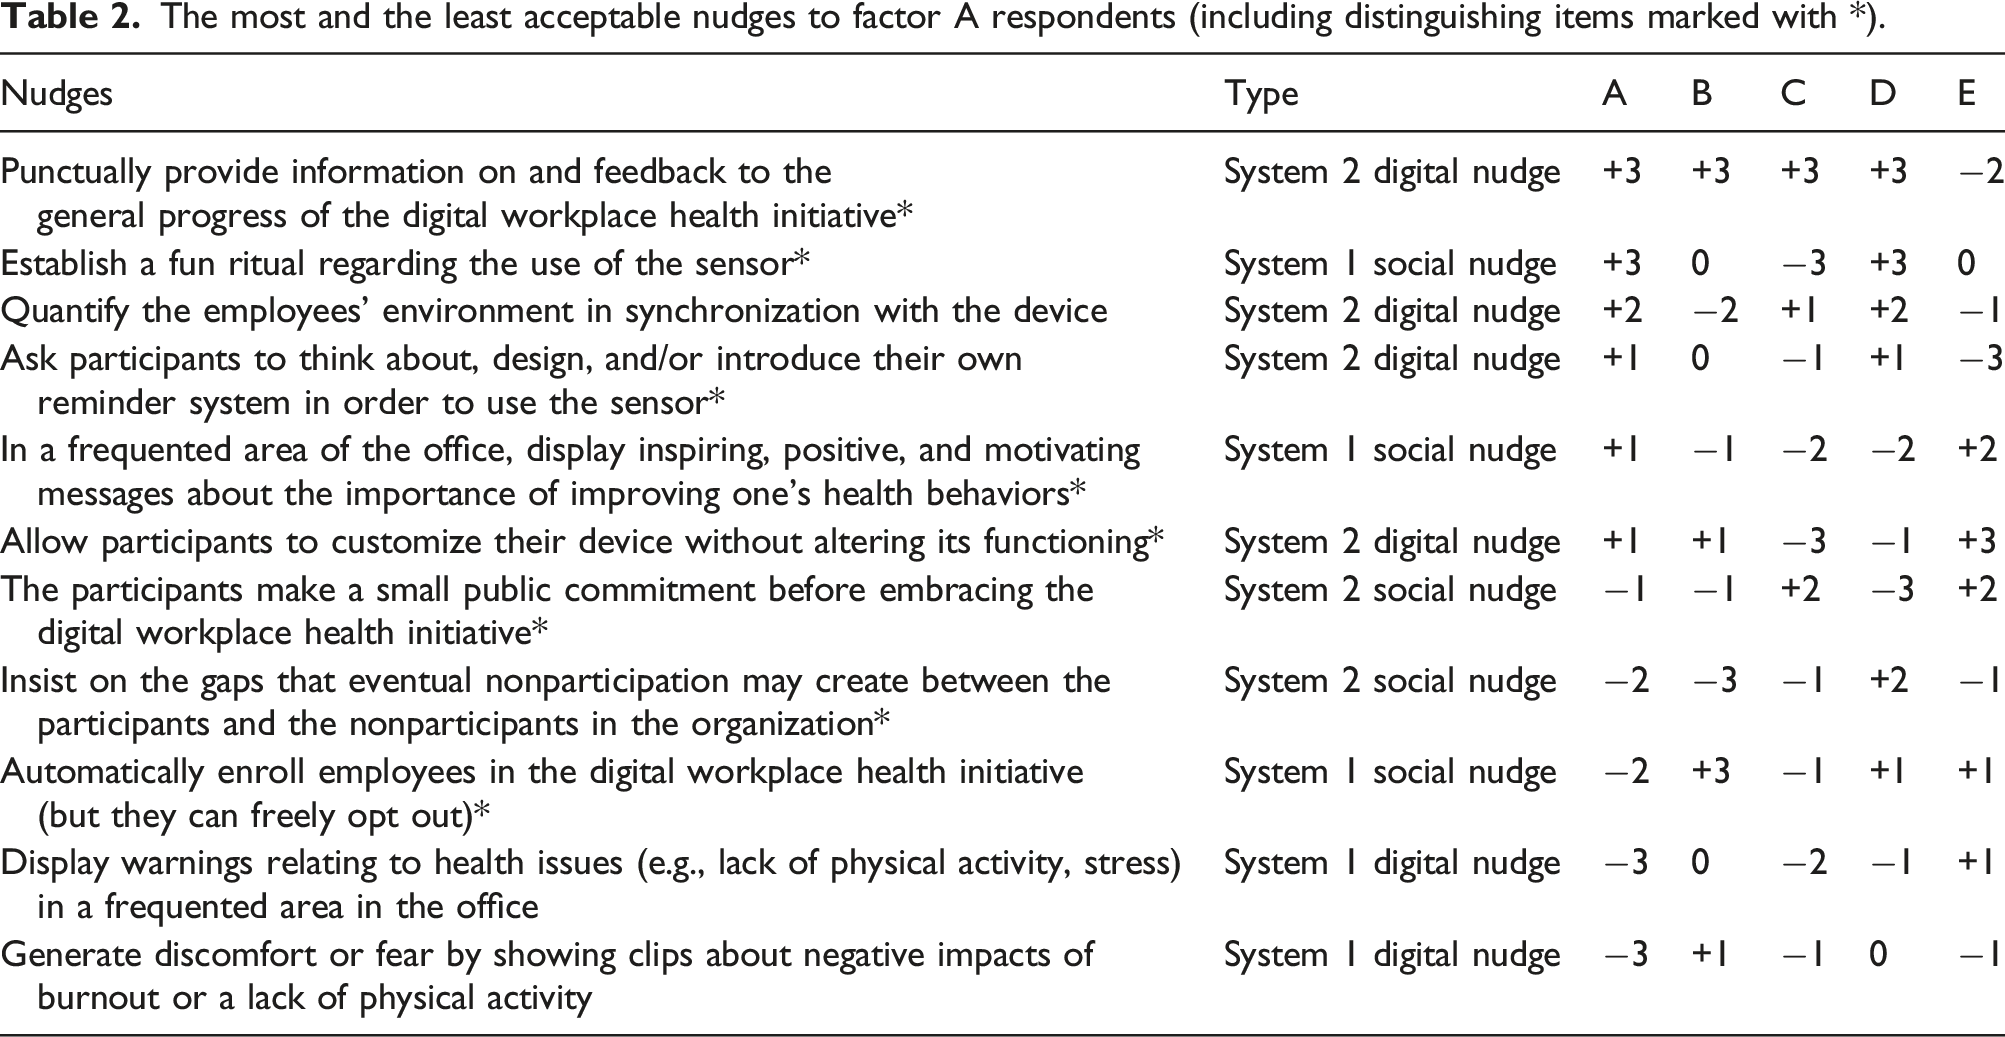
The most and the least acceptable nudges to factor A respondents (including distinguishing items marked with *).
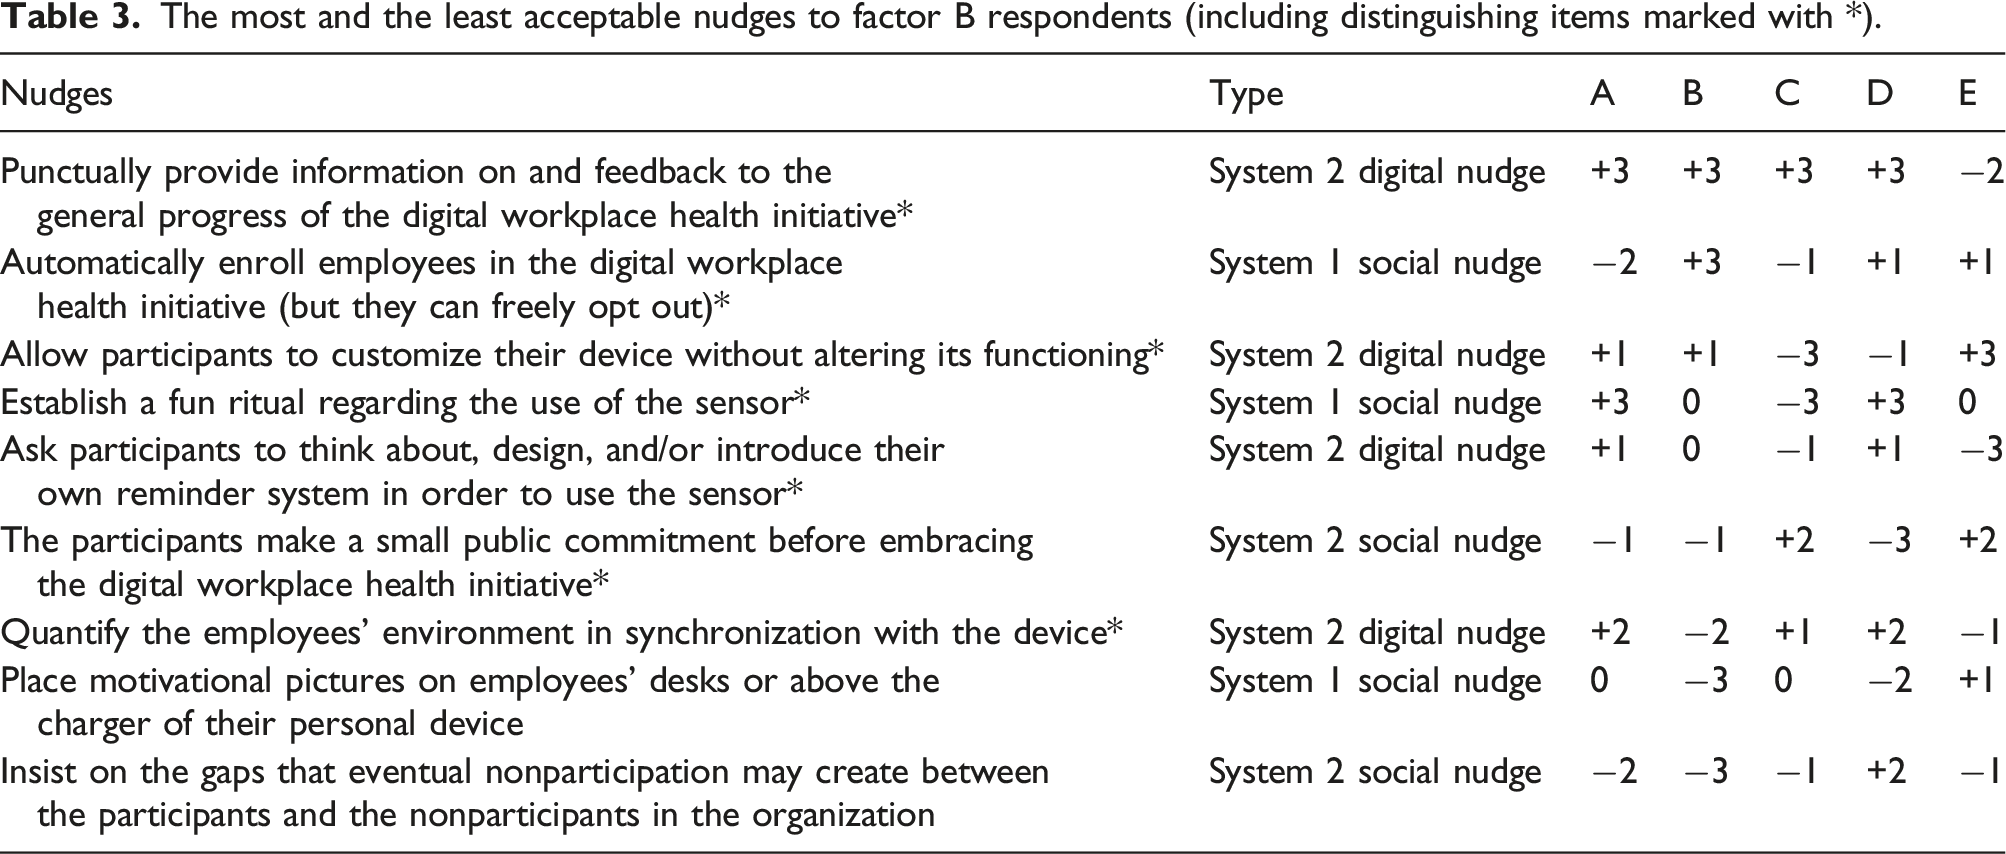
The most and the least acceptable nudges to factor B respondents (including distinguishing items marked with *).
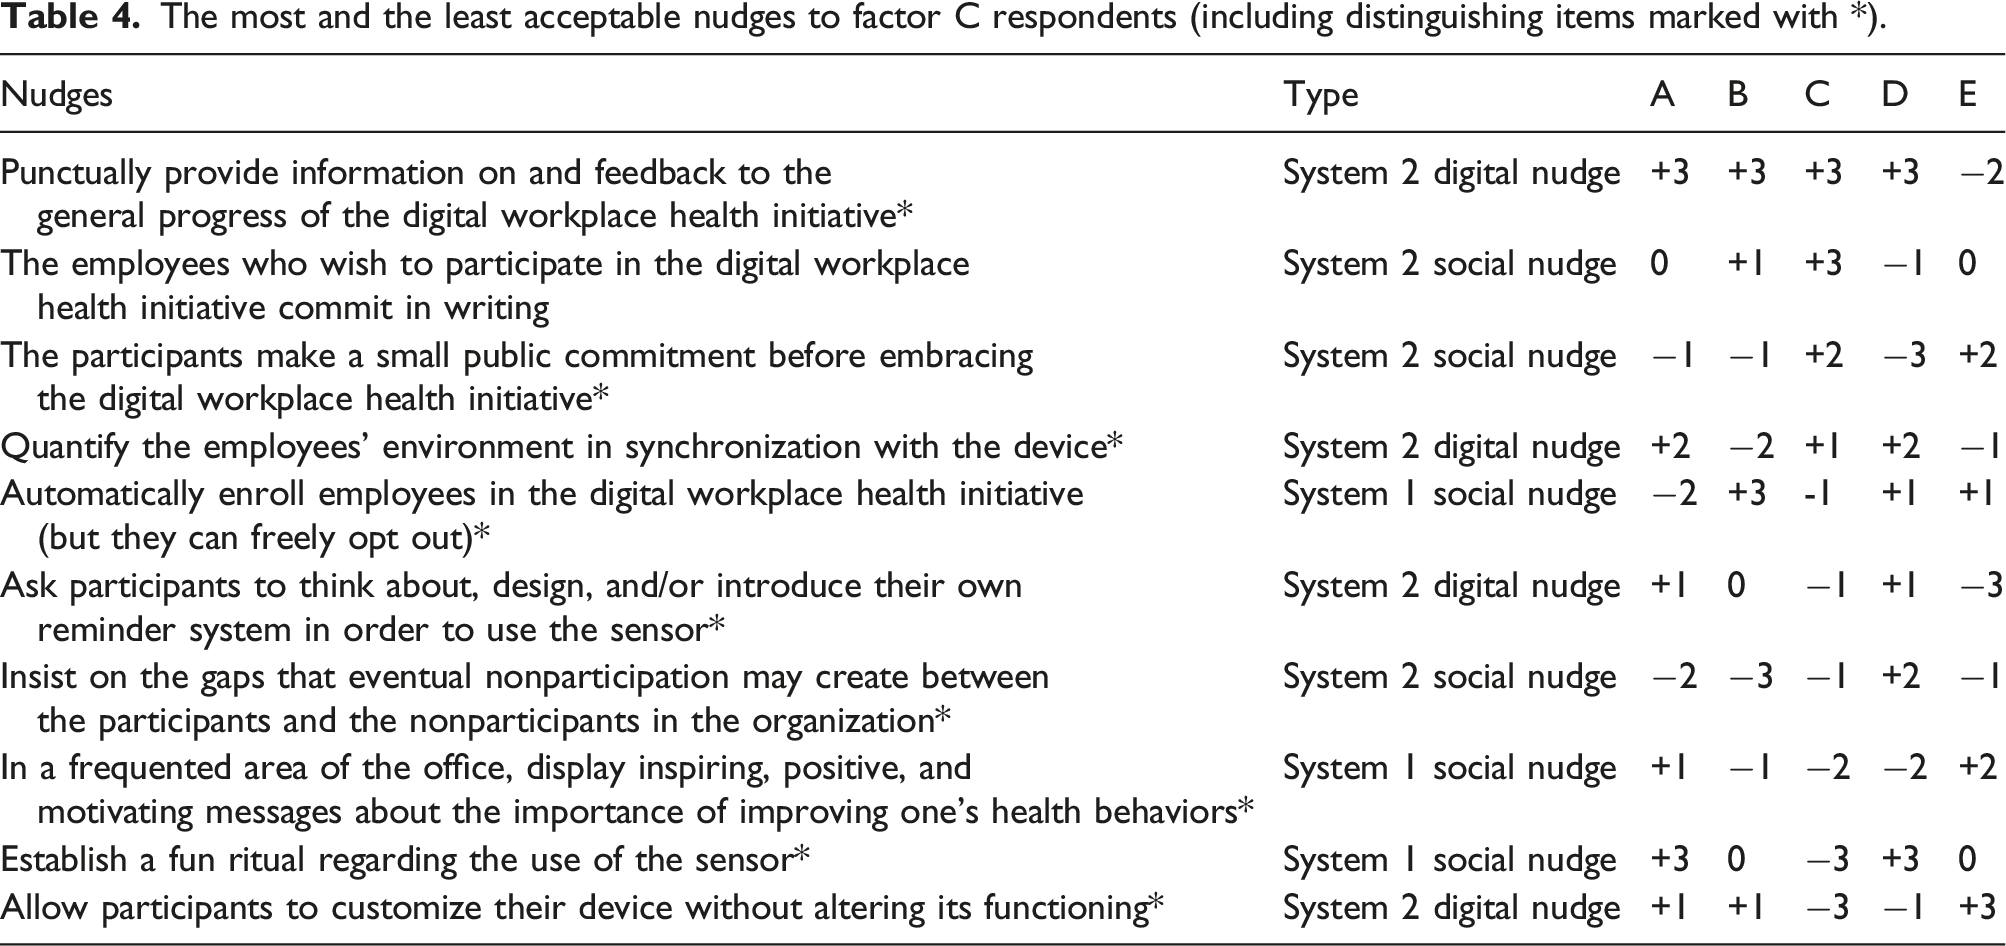
The most and the least acceptable nudges to factor C respondents (including distinguishing items marked with *).
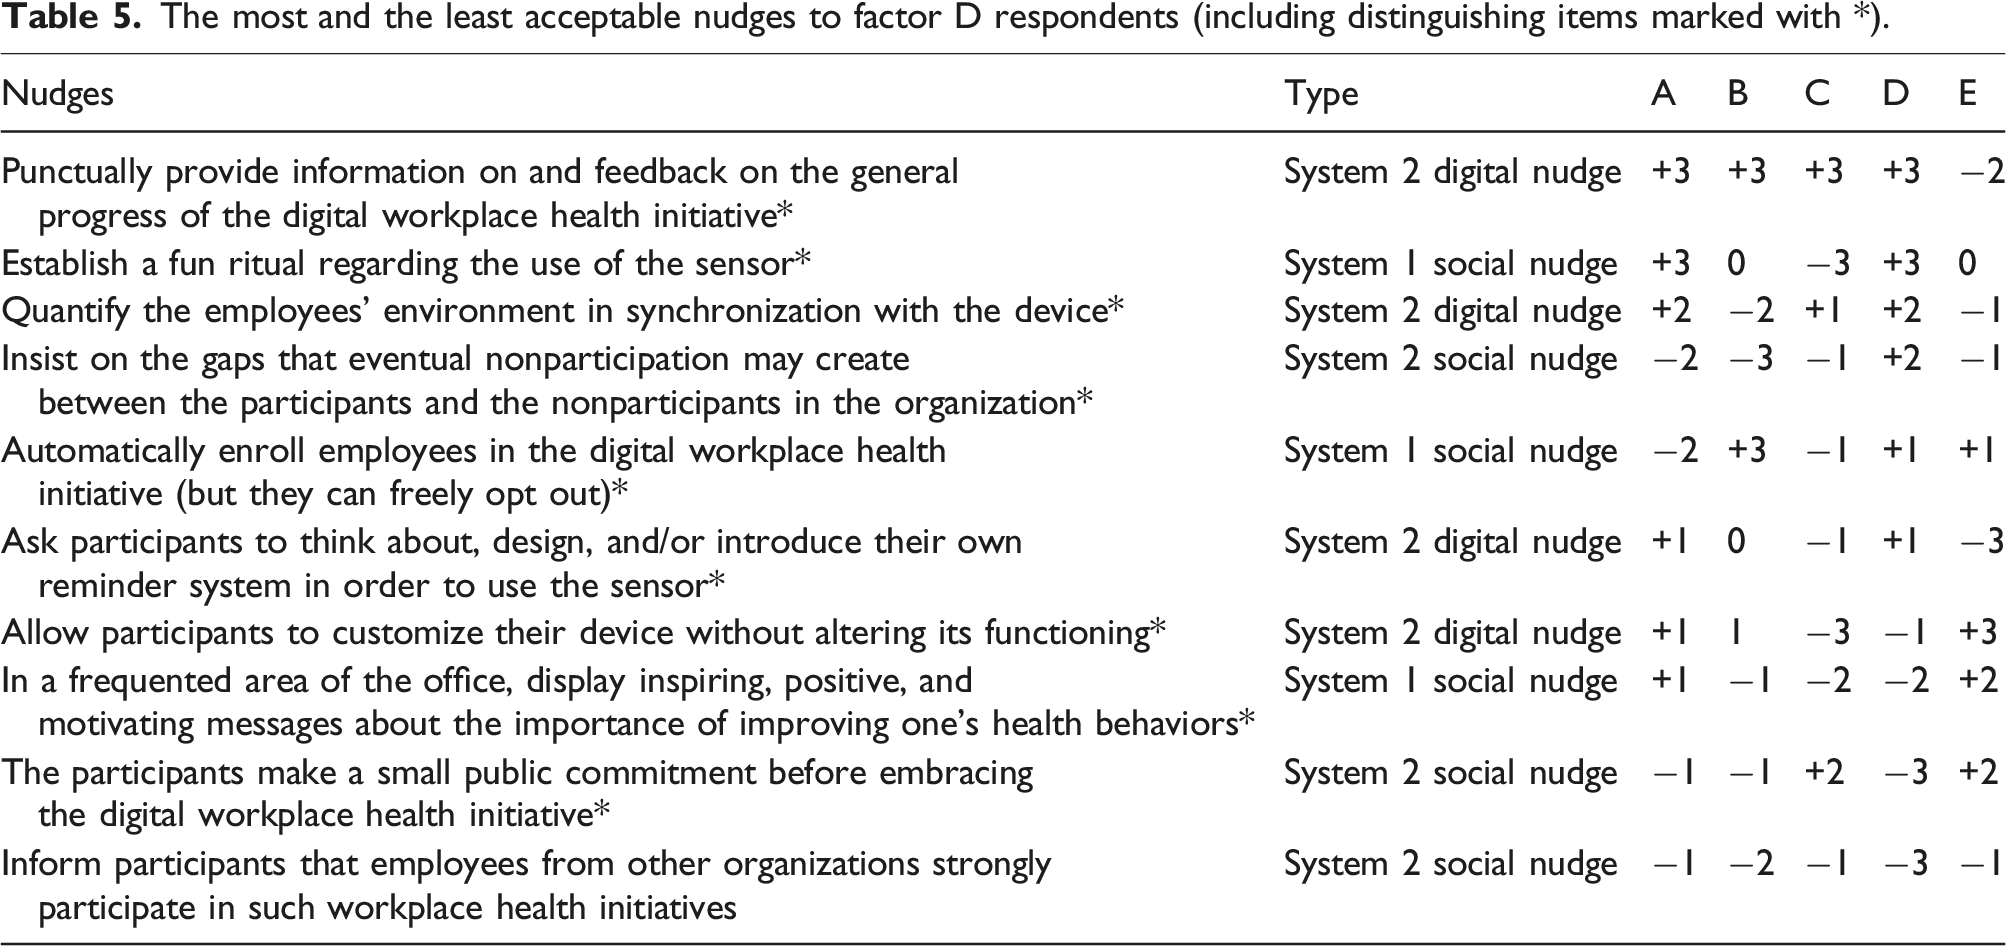
The most and the least acceptable nudges to factor D respondents (including distinguishing items marked with *).
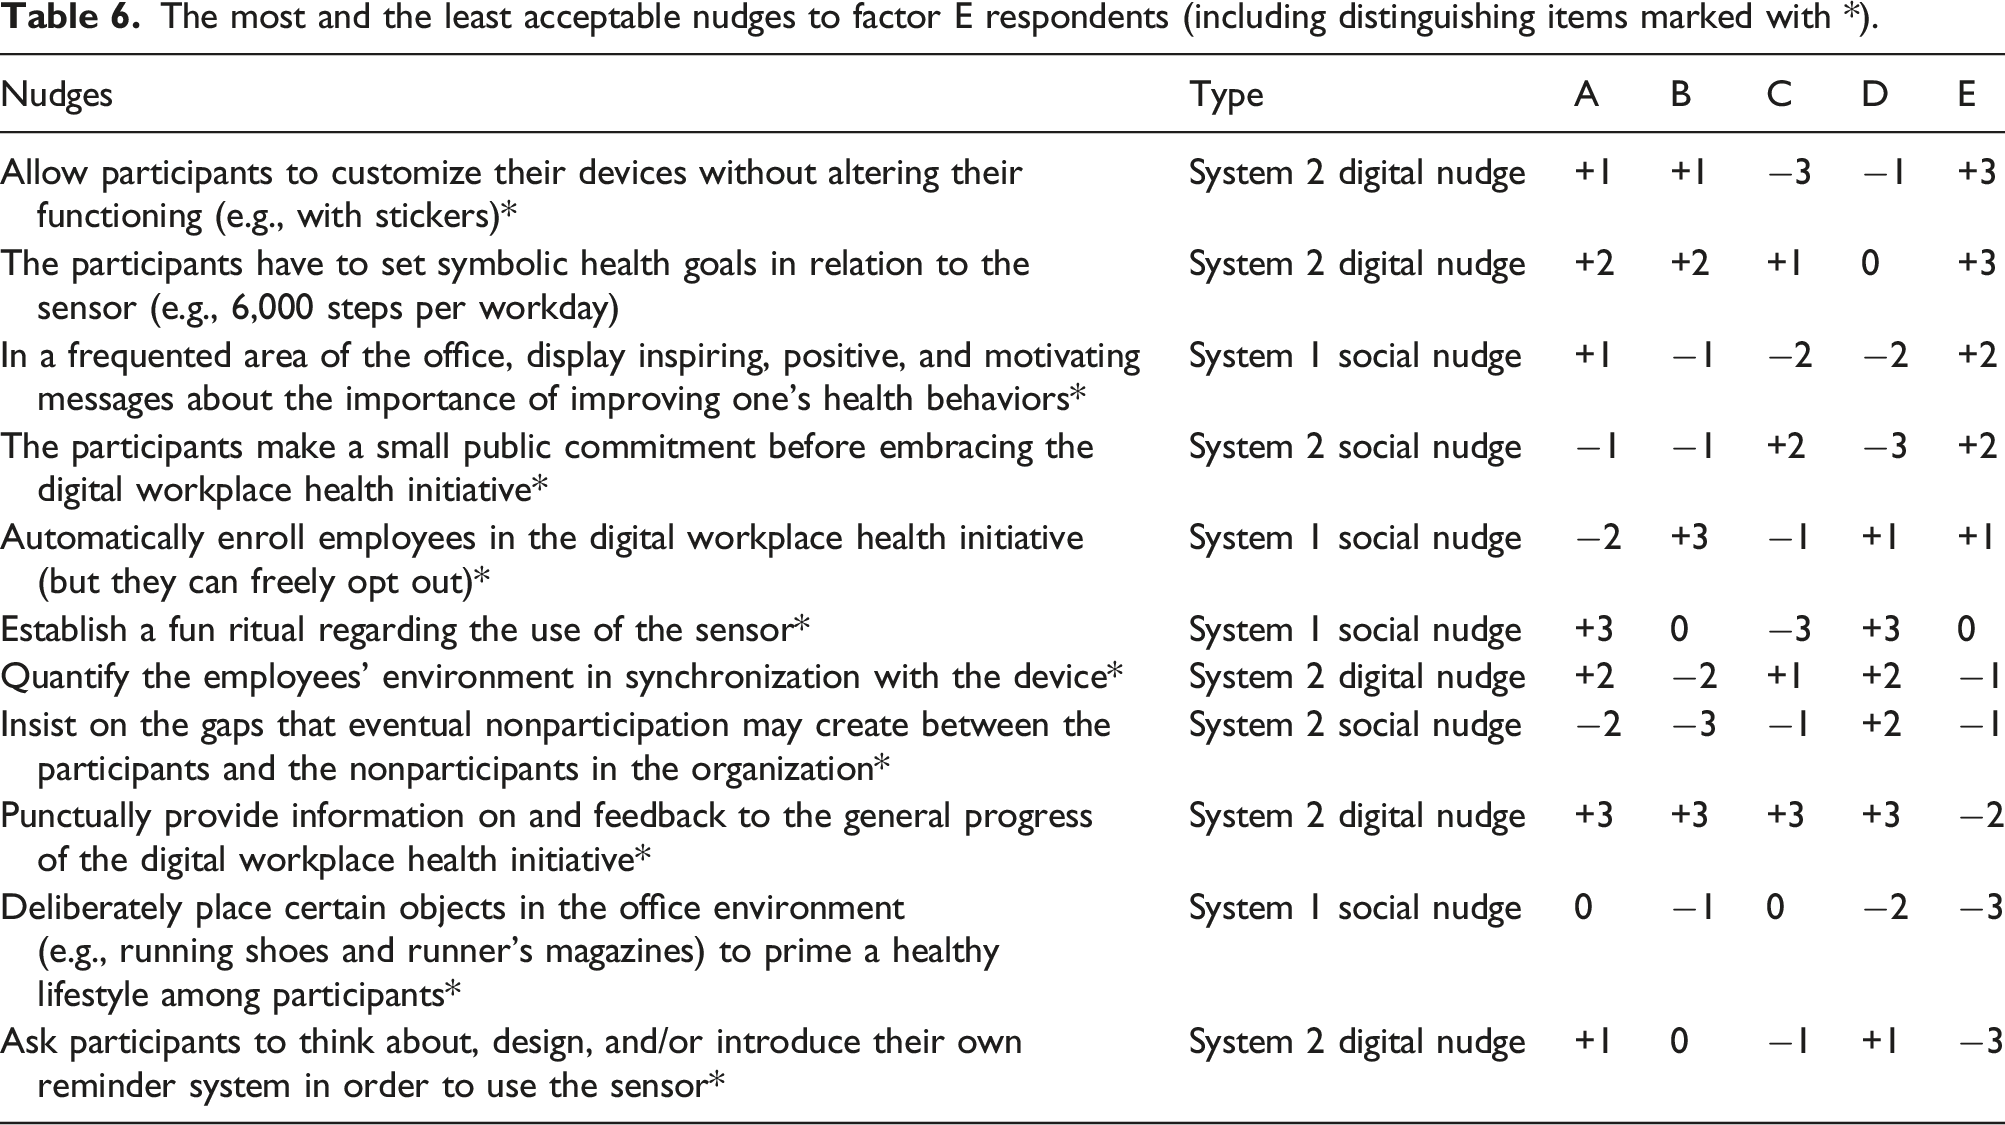
The most and the least acceptable nudges to factor E respondents (including distinguishing items marked with *).
Quantitative data analysis
Once the data are collected, the subsequent step is to analyze the per-person correlation and the factors the respondents loaded on. Q-methodology employs factor analysis, a statistical technique commonly used to reduce numerous individual items into a smaller number of dimensions. However, Q-methodology uses factor analysis differently than typical applications of the technique. Instead of reducing the number of statements based on participants’ responses, Q-methodology employs factor analysis to detect correlation coefficients in the Q-sort with the goal to identify a small number of shared beliefs on a subject (Brown 1993; McKeown and Thomas 2013). To achieve this, Q-methodology uses an inverted matrix for calculations, where items are placed in rows and participants in columns. This differs from traditional factor analysis, where participants’ responses are placed in rows and items in columns. A main assumption of Q-methodology is that respondents who load onto the same factor have fairly similar responses, and by extension that they represent a same attitudinal group or niche (Mettler et al. 2017). Accordingly, individuals who are linked to a specific factor share a common characteristic that distinguishes them from those associated with other factors. Factor loadings indicate the degree to which each participant is connected to each of the identified attitudinal groups. For instance, a factor loading of 0.70 indicates that an individual’s Q-sort is strongly correlated with that particular factor, or in other words, the identified factor can be considered a reliable approximation of a participant’s beliefs.
Watts and Stenner (2012) recommend using PCA with Varimax rotation to calculate these factors and to pursue a rotated solution, which maximizes the amount of variance explained by the extracted factors. The factors are determined with eigenvalue ≥1.00, that is, factors are unlikely to have grouped employees’ opinions by chance. Otherwise, Donner (2004) stated that a factor can be outlined when participants load on a single factor with approximately 0.45 (and greater). In fact, as Iofrida et al. (2018) note, there is not necessarily only one aim or mathematically correct final solution regarding how many factors are determined in this step, since clarity and distinctness should also be considered. Significance at the p < 0.01 level is attained when a factor loads >2.58 times the standard error for the loading, which is calculated as 1/√N, where N is the number of statements (McKeown and Thomas 2013). To realize these statistical analyses, we used STATA software version 13.1. Five factors were extracted based on the mentioned eigenvalue criterion and regrouping participants’ loadings on a factor with 0.45 and greater. Collectively, we arrived to explain 44.09% of the total variance (see Appendix B).
Qualitative interpretation
The last step of the Q-methodology is the interpretation of the factors uncovered by the quantitative analysis. The researcher must assign significance in an a posteriori approach to structures that emerge from statistical procedures (Brown 1993). However, it is important to notice that Q-methodology does not aim to establish population statistics. Analyzing the proportion of individuals with a particular viewpoint or studying various demographic factors to draw conclusions can be problematic due to limited sample sizes. Instead, the objective of Q-methodology is to encompass the diverse mental models of individuals without making assertions about the prevalence of these viewpoints, therefore, also allowing minority perspectives to be accounted for in the research.
A typical approach is to perform a qualitative analysis of each factor. Such a qualitative sensemaking is commonly performed by considering all high-ranked and low-ranked items as well as finding distinguishing statements that help to uncover each factor’s uniqueness (see Appendix C). These distinguishing statements are items with extreme scores on either end of the sorting continuum that represent the largest variance in response across all identified factors. Distinguishing items are used to identify distinct patterns in respondents’ perspectives. Conversely, items with the smallest variance constitute consensus items. Such statements about nudges are similarly perceived across all the attitudinal groups and are therefore less useful to explain the factors’ distinctness.
Our qualitative interpretation first concentrated on analyzing only the data (Berg 2004) so as to arrive at a big picture of the different mindsets. In a second step, we then considered the literature on nudging and connected devices to make sense of our emerging findings. In an iterative procedure that relied on constant comparison, we moved back and forth between the data and the literature in order to challenge (or define alternative explanations) of our descriptive and narrative accounts. To improve our findings’ validity and robustness, we triangulated our interpretation of the factors by involving external researchers experienced with qualitative methods to provide us with their views and ideas (Denzin 2009). We ended the iterative procedure when consensus on the findings was reached, as we will now discuss.
Findings
The quantitative analysis revealed five distinct views on acceptable nudge strategies for incentivizing the use of wearables and physiolytics devices at work. Before we turn to the interpretation of the factors, we will first make a few general remarks that are important for clarifying the statistical analysis. First, the numbers shown in Appendix B represent the factor loadings, which are correlation coefficients that indicate the extent to which each of the 28 individual Q-sorts was (dis)similar to each of the five composite factor arrays. Unlike in conventional factor analyses, where items are reduced, Q-methodology seeks to assign individuals to specific groups. As previously stated, a high factor loading implies a strong correlation between an individual’s Q-sort and a specific factor. This, in turn, suggests that the factor can serve as a reliable representation of the person’s perspective. Second, it is important to mention that if more people load to a specific factor, it does not necessarily mean that there is a proportional distribution among a larger population and that most people think along these lines. Q-methodology seeks to structurally map all opinions. The idea is to create a typology of viewpoints, not to test the typology’s proportional distribution in a wider group (Brown 1993; Valenta and Wigger 1997). Third, there is no standard way to report findings. We used tables that provide an overview over which nudges were perceived as the most and the least acceptable per attitudinal group (most acceptable items = +3, least acceptable items = −3, 0 = a neutral stance) and to which type of nudges they belong to. We further report the distinguishing items, because they help to better understand a factor’s uniqueness. Lastly, we also did a graphical visualization that illustrates each attitudinal group’s preferences, which is extremely helpful in the sensemaking process (see Appendix A).
Nudging through positive reinforcement and fun
Factor A is characterized by a focus on nudges that frame information in positive, simple, and empowering ways. The most prevalent nudges emphasize entertainment and increased access to information, for instance, using feedback loops and data visualizations. Quantifying employees’ environment in synchronization with the systems (e.g., if you use the office’s entrance stairs, you will take X steps…), and symbolic health goals confirm the inclination to provide material for employee self-reinforcement. Thus, we consider this group’s members as particularly open to positive reinforcement. They are skeptical of nudges that employ any form of automaticity, constraint, or limitation. In fact, mechanisms that nudge these users to avoid a negative result are systematically voted down, compared to the other nudges. Thus, this attitudinal group finds levers such as social norms, time limits to create pressure, or displaying warnings to be undesirable.
Nudging by controlling the organizational environment
Automaticity and the establishment of personal reminder cycles seem to be the favored nudging strategies of individuals in factor B. Although the need for information is present, this attitudinal group differs from factor A owing to the presence of mechanisms that specifically help to mitigate inertia. It builds on a more rational approach, in which individuals value decision assistance mechanisms to support the systems’ use. The overall setting is controlled, and employees are pre-set in an environment that nudges them to use the systems and eventually improves their wellbeing.
Another characteristic of this attitudinal group is the prevalence of the individual level of action. The highlighted nudges target each user directly. Nudges involving co-workers or nudges that modified the workplace environment are not acceptable to them. Also, they also disapprove of comparisons, social interactions, and situational cues (i.e., the reliance on specific objects to trigger an automatic action or to make an action easier to remember).
Nudging by personal commitment and self-responsibility
The central element in factor C is the importance of personal commitment. Along the same lines as attitudinal group B, members of factor C exclusively retain nudges that focus on the individual user. However, the dominant driver is the notion of commitment. This group prefers nudges that ask for a personal commitment at the start of the occupational health and wellbeing program as well as nudges that rely on written consent. For employees in this category, the use of wearables and physiolytics devices should be part of a process that is premeditated and thought through. The targets of such occupational health and wellbeing programs should be tailored to each individual, since employees set their own health objectives. Further, this process should result from a personal initiative to be acknowledged. All external stimuli such as warnings, motivating messages, or changes in the environment are strongly disapproved of. Customization and fun elements are less relevant to this group, since the main cue is primarily self-motivated and planned engagement. The fact that the nudge Setting a time limit in which employees can sign up to participate is only present in this attitudinal group reinforces the importance of planning the de facto uses of physiolytics.
Nudging by group effort and collective responsibility
Factor D is relatively similar to factor A: nudges that provide fun and that increase access to information prevail. Yet, in factor D, there is an additional notion of creating a favorable environment for the sustained use of physiolytics. Factor D was the only group that supported the establishment of a situational cue (+2) that connects the use of sensors to a frequent employee task. Likewise, this group’s members were the only ones to positively rate the nudge Insist on the gaps that eventual nonparticipation may create between the participants and the nonparticipants in the organization (+2). They expect such workplace health initiatives to positively integrate the workspace to make use of its specificities so as to increase entertainment and information. They also wish to have a strong collective dynamic in the workplace to successfully support engagement with wearables and physiolytics devices. Individual commitments, comparisons to other organizations, and motivating messages are appreciated less since sustained use is linked to the capability to drive all participating employees in a positive and collective experience to improve their wellbeing.
Nudging by adapting the individual environment
Factor E distinguishes itself by negatively rating the nudge Punctually provide information on and feedback to the general progress of the digital workplace health initiative, compared to other nudges. While this nudge is perceived to be acceptable by all the other attitudinal groups (+3), it is relatively unpopular among members of this category (−2). Situational cues, reminders, and other tools that provide information or support the creation of a routine regarding the system are also not appreciated much. The reordered high values for customization, commitment, and display of motivation messages in the workplace suggest that this group’s members primarily focus on reinforcing self-goals. System use is a matter of individual choice, and we can therefore assume that this group’s members do not accept their management priming IS use. Factor E users who want to change their health behaviors will use a system anyway. Accordingly, keeping one’s volitional autonomy is fundamental to this attitudinal group.
Discussion
To ensure safe returns to the workplace, organizations have made substantial investments in new technologies to comply with the accountability rules set by governments resulting in extended managerial oversight over the workforce. During the Covid-19 pandemic, wearables and physiolytics devices have been key to monitor employees’ health and whereabouts (Chamola et al. 2020). Being of ambivalent use—protecting employees from serious health issues caused by infectious diseases, unhealthy routines, or accidents but also extending the data collection scope beyond purely work-related activities to extremely intimate matters such as one’s health, subjective wellbeing, or feelings (Ball 2021; Kamal 2020)—employees have been hesitant, even dismissive, toward IT-enabled occupational health and wellbeing programs. This is why decision-makers are increasingly relying on nudges as a means to increase the adoption and acceptance, however, often without considering employees’ views, values, or beliefs. Therefore, this article set out to identify different attitudinal groups that exhibit distinct perceptions towards nudge strategies in the workplace, the practical use of which we now explain.
How to make use of our findings
A widespread but often oversimplified way of thinking about nudges is to distinguish between nudges that manipulate behavior (system 1) and those that manipulate choice (system 2) (Hansen and Jespersen 2013; Sunstein and Thaler 2008). This is rooted in dual process theory, particularly research by Kahneman and Egan (2011), who popularized the idea to categorize people into econs (described as reflective, effortful, deliberate, and patient) and humans (typically portrayed as short-sighted, reflexive, and impulsive beings). While econs tend to respond positively to system 2 nudges, since they facilitate the rational process of consideration and problem-solving, regular humans are more inclined to fall for system 1 nudges. If people would be asked which nudges they would prefer, the majority—regardless of whether there are an econ or a regular human—would likely prefer system 2 nudges, because they show more respect for individual autonomy and dignity (Sunstein 2016). 6 However, the views and preferences of potential nudgees has seen little attention in the scientific literature and in practice. This often leads ordinary people to perceive nudging as deceptive and dishonest (Evans 2012), which in turn has led researchers—such as Richardson and John (2021)—to call for more bottom-up, participatory methods for developing nudge strategies.
While a typical IS research article would be concerned with the managerial perspective, we chose to explore what employees consider acceptable nudge strategies to incentivize the use of wearables or physiolytics devices in occupational health and wellbeing programs, on the conviction that initiatives that collect and process intimate and sensitive personal information—as wearables and physiolytics devices do—should integrate employees’ concerns, preferences, and motivations if they are to tolerate it in the long term. Our results showed that there is a wide range of viewpoints on what is considered an acceptable nudge. Thus, one consequence is that developers of nudge strategies need to be aware that, sooner or later, a one-size-fits-all approach will meet resistance. Rather than dividing people into two categories (the rational exceptionalists and the emotional rest of humanity) or supporters of system 1 or system 2 nudges, our study indicates that multiple aspects may influence the acceptance of nudges, that is, that reality is shades of gray rather than black and white. For our problem—how to incentivize employees to use wearables and physiolytics devices in the workplace—we identified nudge strategies of different colors that are more or less acceptable to distinct employee groups. The question arises: to what extent can our Q-methodology examination’s results find practical application in the planning of nudge strategies? To answer this question, let’s imagine the issues a decision-maker faces when planning a nudge strategy (see Figure 3). Decision Tree for Planning a Nudge Strategy to Incentivize the Long-Term Use of Wearables and Physiolytics Devices in Occupational Health and Wellbeing Programs.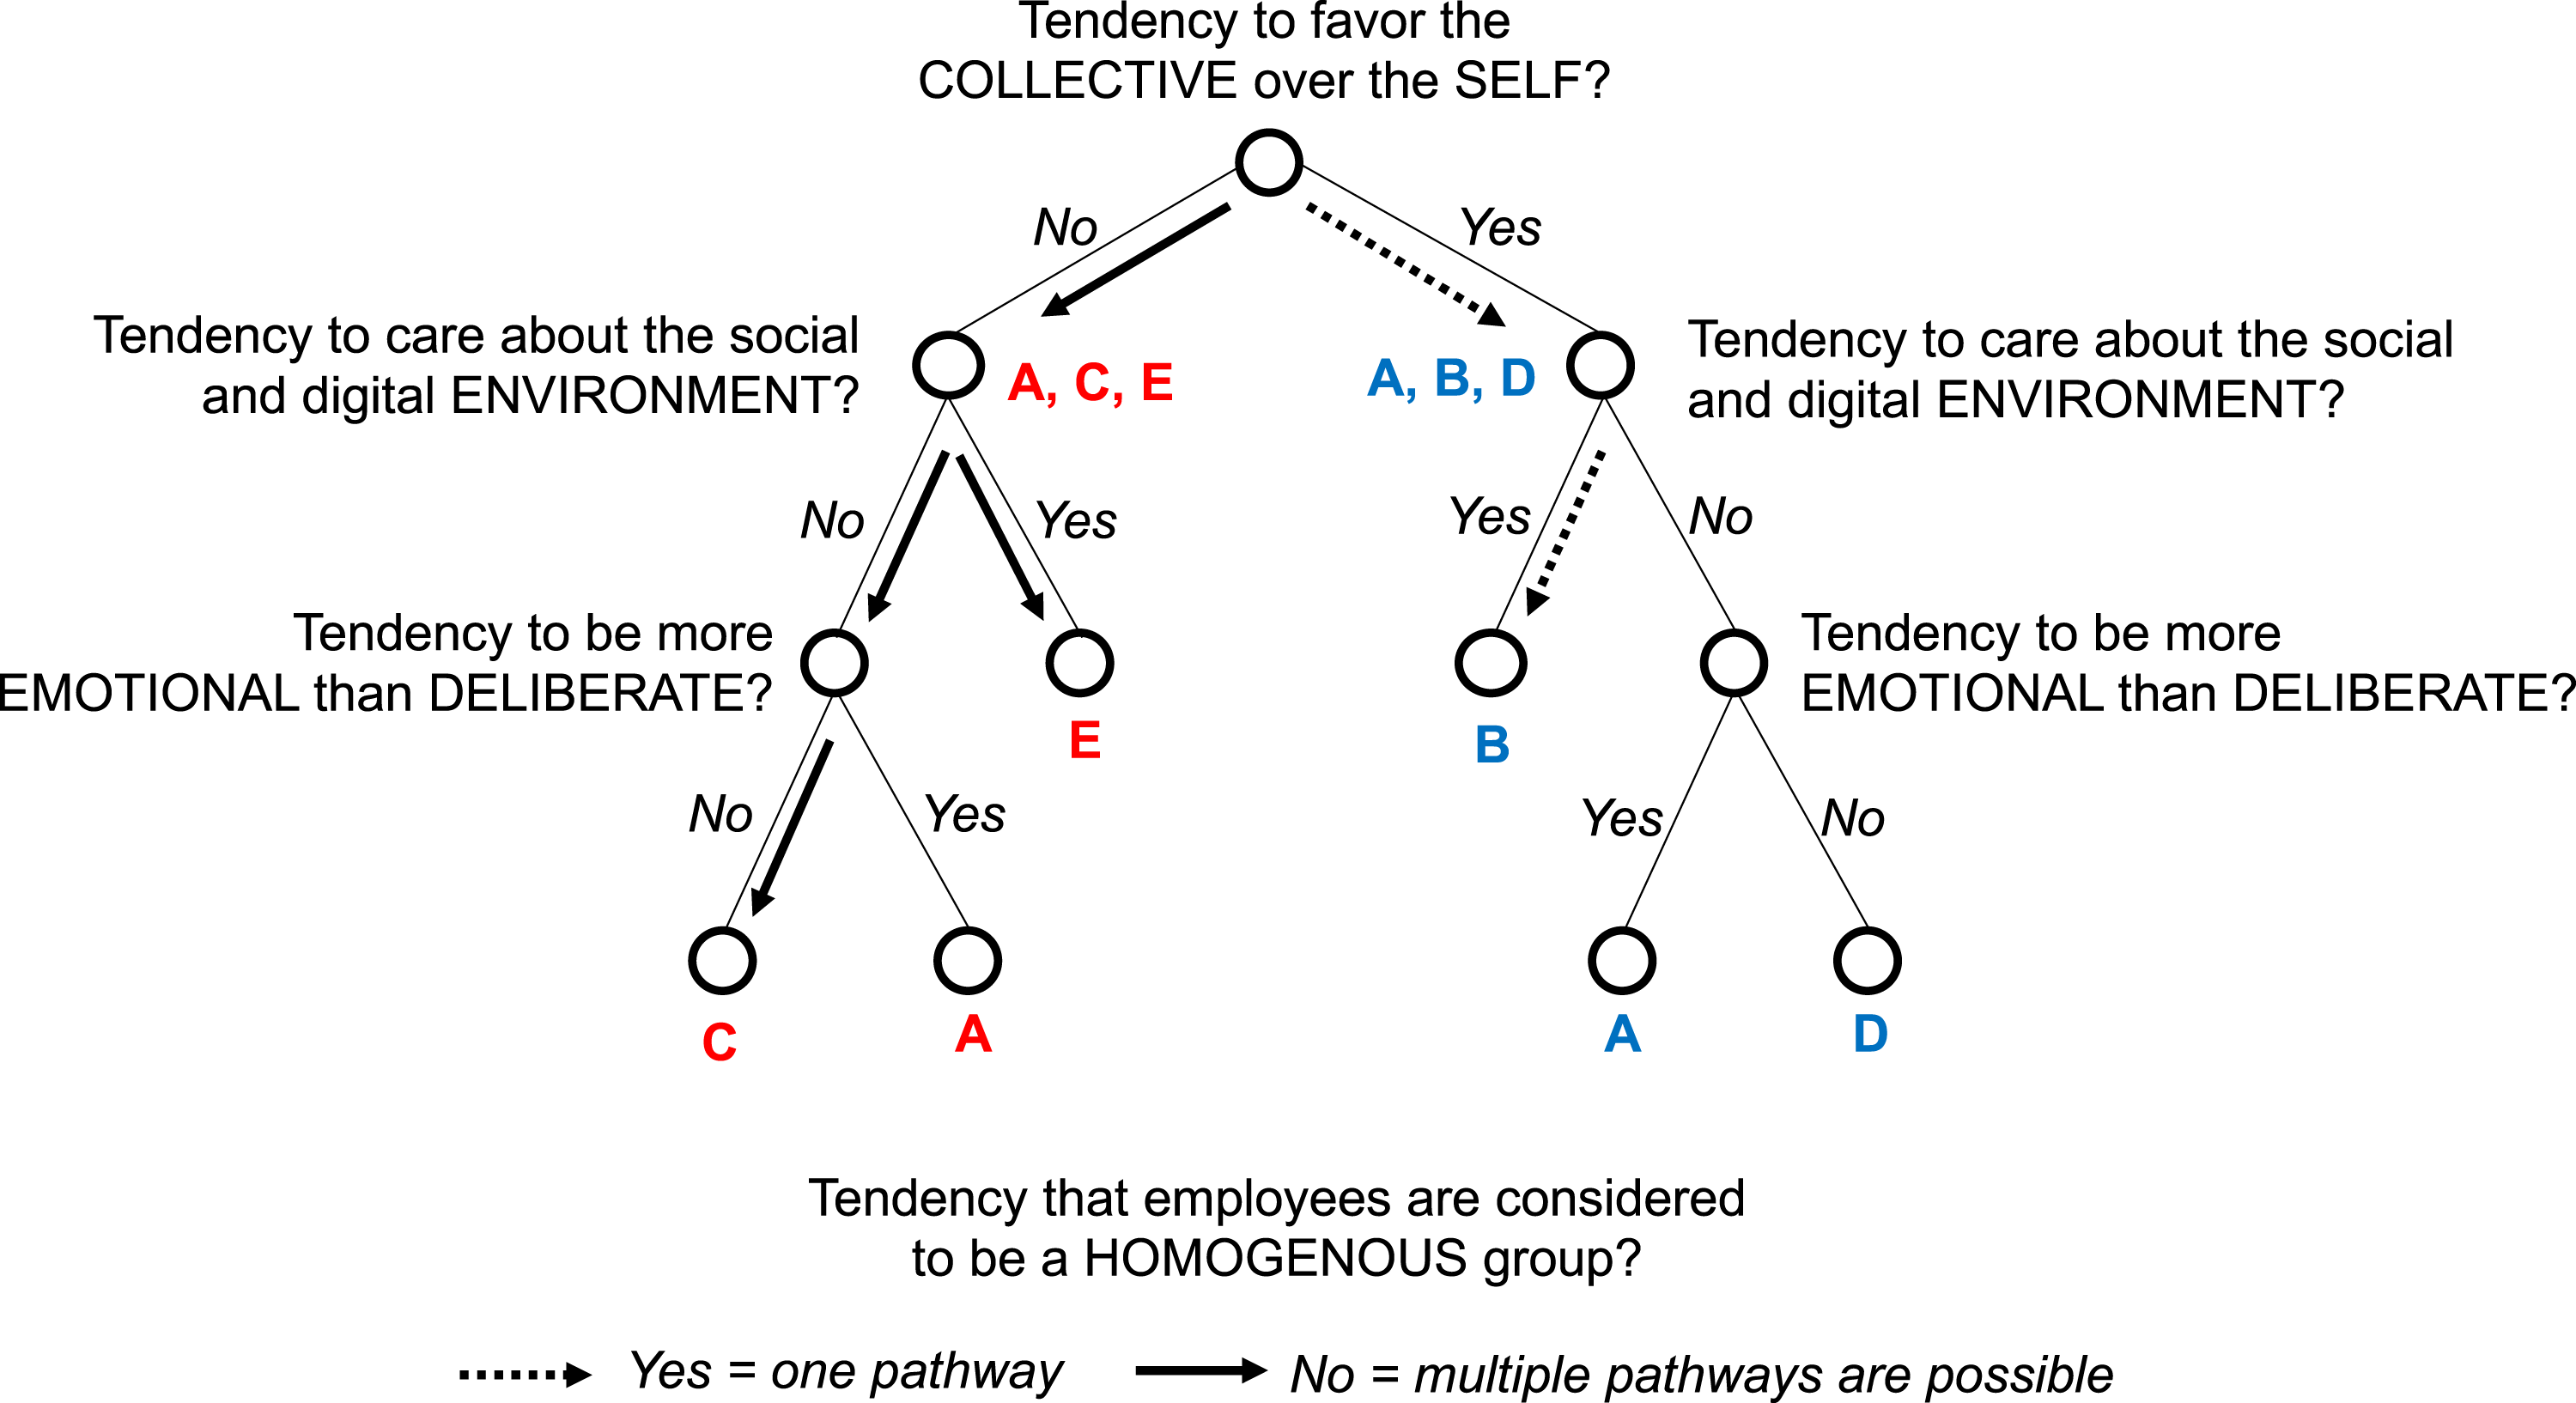
The collective or the self? A first aspect that may prove essential in devising a nudge strategy is to have an understanding whether employees think more as a collective or more as individuals. Collectivists—such as factor B or D employees—prefer nudges that build on social support and seek to create a sense of community around shared goals (Chen and Pu 2014; Santoro et al. 2015). Nudges that build on the dynamics of offline interactions (e.g., group discussions, exchanges, events) or online ones (e.g., posting, liking feeds) and that construct group belonging or shared experiences are perceived to be particularly desirable and motivating of the use of wearables or physiolytics devices (Fiske 2010; Kretzer and Maedche 2018). On the other hand, strongly individually oriented employees—such as those belonging to factor C or E—meet nudges that rely on social norms and group socialization processes with distrust, given that these employees prefer nudges that empower self-responsibility and freedom.
Changemakers or conformists? In addition to the personal lens of whether we view our environment from a more collective or a more individual perspective, another critical aspect in planning a nudge strategy could be the extent to which employees take their social and digital environment for granted or demand opportunities for adaptation and flexibilization. Employees in factor B or E have a particular desire to actively shape their (individual or collective) environment; introducing a nudge aimed at restricting behaviors and/or choices to modify the work environment may trigger negative reactions in them, since they perceive this as an attack on their autonomy (Benner et al. 2021). Conversely, nudges that reveal (hidden) choices or increase salience (Münscher et al. 2016; Santiago Walser et al. 2019), helping them to change (the self or the collective), may prompt positive associations toward an IT-enabled occupational health and wellbeing program.
Shrewd econs or fun-loving humans? The literature is not wrong in emphasizing the roles of persons’ rationality or emotionality. In our view, however, it would be one-sided to say that some employees always make deliberate and reflective decisions, while others always act more reflexively and emotionally. Our results showed that some employees—those in factor A—respond more positively to nudges if they appeal to their emotional side and lead to positive reinforcement and more fun at work. This does not mean that they act irrationally or have stronger preferences for (or tolerance of) automatic (system 1) nudges or despise deliberative tasks, because they find them to be cognitively strenuous (Baldwin 2014). None of the identified profiles consistently favored only deliberative or automatic nudges, arguably suggesting that econs may also sometimes fall into the trap of system 1 nudges and other humans appreciate system 2 nudges, which stimulate their thinking and help them to better navigate subjective tradeoffs and scenarios that involve weighing possibly conflicting considerations (Acquisti et al. 2017).
A uniform or heterogeneous bunch? Lastly, another important aspect to explore is whether employees reason and behave mostly in the same way, or whether we can assume the presence of more than one of the outlined mindsets. As it focuses on the exploration of subjectivity (as mentioned), Q-methodology does not allow us to determine which viewpoint is dominant and which is more incidental. This is where conventional (objective) data collection methods that sample representativeness along deterministic variables—such as age, sex, and marital status (Koo 2017)—could come in.
Key implications of our study
As with many IS phenomena, the research on nudge strategies for wearables and physiolytics devices is still nascent, with little evidence of their lasting impacts and roles in workplaces (Mettler and Wulf 2019; Moore and Piwek 2017). Developing nudges that engender some decisions that may benefit an employer more than an employee may create tension in the relationships between technology, users, and organizations. Also, it creates ethical challenges, as top-down, expert-led approaches to developing nudges often compromise employees’ volitional autonomy and dignity (Rebonato 2014; Sunstein 2016). We trust that we have helped increase IS researchers’ awareness of this issue, especially the question who decides whether chosen nudges are acceptable and what acceptability ultimately means. In our view, having a deep understanding of which nudge strategies people accept and which they reject is an important first step in reflecting more profoundly on dedicated nudges that target the manipulation of behaviors or choices.
With Q-methodology, we present a way forward to implement a bottom-up, evolutionary co-design process—as called for in the literature (Richardson and John 2021). We promote a transparent and equal dialogue between those designing nudges and potential nudgees, an issue that has been neglected in the IS research (Meske and Amojo 2019), given that most empirical studies have explored the capacity of nudges to achieve specific targets or goals. While persons’ preferences before decision-making and acting on their choices has only been casually considered (Mirsch et al. 2017), understanding, acknowledging, and respecting employees’ views is—in our view—a fundamental aspect if nudging is to be ethical. Nudges must not only remain transparent and legitimate in the ways they exploit employees’ cognitive biases and must provide benefits to them (Lembcke et al. 2019), but must also respect their volitional autonomy and dignity as much as possible (Leidner and Tona 2021; Rebonato 2014). An evolutionary co-design of nudges could offer a way out and could potentially help minimize the risks of resistant behaviors and the need for the usual reactive attempts to address eventual concerns and to improve organizational culture in hindsight (Bakewell et al. 2018; McAfee et al. 2012; Wingreen and Blanton 2007).
Besides designing and implementing nudges that target digital environments or user interface design elements (Bammert et al. 2020; Caraban et al. 2019; Weinmann et al. 2016), we have also stressed the possibility of considering the social and spatial environment as additional sphere for intervention. This is rooted in the assumption that social nudges create new windows of opportunity and offer different stimuli, such that more favorable attitudes and behaviors may flourish (Stephan et al. 2016; Wu and Paluck 2018). In our view, this is crucial when introducing technologies that blur the boundaries between the digital and the physical world—in this case, wearables and physiolytics devices. Extending choice options for adapting the (physical) IT artifact and/or (digital) activity sharing structures, combined with the (social) routinization by enjoyable rituals (Vyas et al. 2015), will not fundamentally change (if this is possible at all) employees’ concerns around the introduction of IT-enabled occupational health and wellbeing programs; but it could at least work for a certain group of employees, which brings us to our study’s limitations.
Limitations of our study
As previously stated, the focus of our study has been on examining the acceptability of nudge strategies rather than their effectiveness. Therefore, we are unable to determine whether the nudges suggested by employees result in behavioral changes or which types of nudges are more effective than others. While this is a contentious issue in the current academic debate (Sunstein 2016), it was secondary in our study. Instead, we endeavored to comprehensively and systematically gather diverse opinions, perspectives, and attitudes towards acceptable nudges, assuming that having a better understanding of what employees find acceptable would facilitate the planning of nudge strategies. We must acknowledge, however, that the assumption that acceptance of particular nudges leads to general acceptance of nudging per se may be an oversimplification. The basic attitude toward nudges can still be negative, even if certain nudges were rated better than others.
This leads us to our next point, that is, our study has focused exclusively on the positive effects of nudges, namely, their ability to influence behavior in a desired direction. However, recent research has shed light on the negative aspects of nudges, including instances where they can elicit a negative psychological response known as reactance (Brehm 1989; Sunstein 2017). Reactance is characterized by individuals resisting persuasion attempts they perceive as coercive, and this may result in fundamental changes in their attitudes, causing even initially benevolent employees to become harsh critics of nudges (Hardin et al. 2017; Lee and Lee 2009; Lowry and Moody 2015; Tucker 2014). Our study provides limited insight into which nudges can trigger such strong reactions (or nudges that “backfire”), as we solely asked participants about their potential acceptance of specific nudges. Therefore, it is difficult to conclude that poorly rated nudges are equivalent to nudges that cause reactance. While poorly rated nudges may be perceived as less acceptable, they may not necessarily lead to tension when applied.
Our study has also methodological limitations. In Q-methodology, we found an approach that helped us to grasp the various mindsets, yet it also restricted us in certain respects. While a large sample size is not a prerequisite for a Q-methodology procedure’s success, the low number of employees in the Q-sort does not allow for further statistical tests to assess the relationships between demographic variables (e.g., age, profession, literacy, experience with the technology) and belonging to a specific attitudinal group or niche, nor to detail the structure and causality that led to such groups’ formation (Akhtar-Danesh et al. 2011; Brown 1993; McKeown and Thomas 2013). Representativeness and causality are not among a Q-methodology study’s goals (Brown 1993; Stephenson 1986). To find out which mindsets are present and dominant in an organization, conventional (objective) data collection methods must be applied.
Another limitation may also stem from the interpretative component inherent in Q-methodology. As with any qualitative interpretation of data, it largely depends on the investigators’ frame of reference, experience, and intuition. Researchers using Q-methodology must therefore be careful to not introduce biases when making sense of numbers and aggregated data if they are to derive sensible hypotheses and testable propositions (Cross 2004). The same is true of the concourse. Our subliminal conviction to rather see the positive side of the application of wearables and physiolytics devices in occupational health and wellbeing programs may have indirectly influenced the focus group session participants who—unlike existing studies would suggest (Mettler and Wulf 2019; Selander and Henfridsson 2012)—have restrained themselves from expressing cynical comments or views. However, this does not mean that there cannot be doubts, concerns, questions, or cynicism among employees. Our concourse may have made it hard for them to vent their displeasure.
Future research directions
There are various avenues to expand upon our research. Based on the results of this study, one possible direction for future research is to design experiments that translate the preferences of the identified attitudinal groups into specific, testable interventions to conduct more behavioral (e.g., Qu et al. 2022) or design-oriented (e.g., Barev et al. 2020) investigations. This approach would address the methodological issue encountered with Q-methodology, which does not allow for causal inferences to be made about how people respond to different types of nudges and why they develop favorable or unfavorable attitudes toward specific nudge strategies. However, this can only be achieved through multifactorial experimental designs. There is a possibility that, in the interest of simplification (e.g., to reduce the number of participants required for control and test groups), these experiments may again be limited to a binary categorization of employees (e.g., those who prefer system 1 or system 2 nudges). Given that the notion of personalized nudging, as our study propagates, has not been extensively explored (Bergram et al. 2022; Darlecke and Karlsen 2020; Mills 2022; Schöning et al. 2019), it is crucial to integrate it into the experimental design despite the consequent heightened complexity.
As previously mentioned, another limitation of our study is that it solely presents a spectrum of opinions without indicating which perspectives are dominant or more prevalent. Non-experimental quantitative studies that use alternative methods for eliciting user preferences, such as best-worst scaling (Schöbel et al., 2020) or choice-based conjoint analysis (Ebbers et al., 2021), and that operate on large-scale and randomized samples could effectively tackle the issue of generalizability to specific populations. This would result in an accurate and representative estimation of distributional preferences which, in turn, would aid in prioritizing the implementation of specific nudge strategies. Such empirical studies could equally provide valuable insights into previously unexplored areas of our work, including reactance, resistance, and workaround behavior caused by nudge interventions. However, it is important to note that survey-based methods may still be susceptible to response bias, resulting in a gap between reported responses and actual behavior. As such, we recommend complementing survey-based approaches with case-based research designs to investigate the negative or unintended (“counter-nudging”) effects of nudge strategies. These designs allow for a more in-depth exploration of how users perceive and respond to nudges in real-world contexts and provide a richer and nuanced understanding of the mechanisms underlying the observed effects.
One notable characteristic of our study is its emphasis on extending nudges to cyber-physical spaces. At present, the field is heavily focused on the design of digital nudges (Kretzer and Maedche 2018), largely due to the discipline-specific (over)emphasis of technology in IS and partly also because of the relative ease of controlling the environment for conducting research. However, with the advent of low-cost datification and sensorization, new possibilities arise for the integration of nudges for both digital and analog worlds. As a result, we suggest that future work on nudge strategies should pay more attention not only to users’ preferences, daily routines, subjective wellbeing, and sentiments, but also to the hybrid nature of the environment where people interact. The current emphasis on digital nudges is somewhat unbalanced and fails to acknowledge the crucial role that physical and social cues play in shaping human behavior. For nudge strategies to reach its full potential, it is therefore important to examine more closely the combination, interplay, and outcomes of different nudge types in different environments that users engage with. This may entail adopting a multidisciplinary approach that goes beyond a pure IS (or closely related human-computer-interaction) perspective and draw insights from other fields, including urban, industrial, architectural and other forms of design, or kinesiology and ergonomics, to create a more holistic and comprehensive approach to nudge design.
Finally, we also see significant potential for further qualitative research that examines the critical, sensitive, and controversial aspects of nudging. Our structured approach to explore subjective opinions did not provide participants with the opportunity to express cynicism, sarcasm, fear, or other strong emotions. However, the subliminal emotional dimension of nudges is a largely underexplored issue across fields (Mettler and Wulf, 2019). The few existing studies on cynicism suggest that passive resistance can quickly escalate into active forms of resistance (Lapointe and Rivard, 2005; Selander and Henfridsson, 2012). By providing more detailed and contextually grounded descriptions and observations of people’s actions in real-world situations, additional qualitative inquiries could extend the possible findings of suggested experimental and non-experimental quantitative studies. Such studies could help to uncover the underlying or unspoken reasons why individuals who previously supported nudging may ultimately reject it, as well as provide a more accurate understanding of the proportion of people who actually find intentional manipulation by corporations, governments, or employers acceptable.
Conclusion
We sought to explore what employees consider acceptable nudge strategies in occupational health and wellbeing programs to incentivize the use of wearables or physiolytics devices. Building on an evolutionary co-design process that facilitates an equal exchange of ideas between those designing nudges and potential nudgees, we identified five mindsets toward accepted nudging strategies: (a) positive reinforcement and fun, (b) controlling the organizational environment, (c) self-responsibility, (d) collective responsibility, and (e) adapting the individual environment.
The recent trend of organizations repurposing or rebranding surveillance technologies originally used for health monitoring and tracing during the pandemic will undoubtedly raise new ethical concerns about nudging. This shift may also prompt IS researchers to adopt a new approach, one that not only prioritizes organizational effectiveness and managerial needs, but also places greater emphasis on the development of critical theories and practical solutions that safeguard our autonomy and dignity from potentially imbalanced or unethical paternalistic interventions.
Footnotes
Declaration of conflicting interests
The author(s) declared no potential conflicts of interest with respect to the research, authorship, and/or publication of this article.
Funding
This research has been supported by the Swiss National Science Foundation (grant no. 187429).
Notes
Appendix
No.
Description
Func.
Env.
Identified factors
1
Provide every employee with detailed information about the digital workplace health initiative.
System 2
Digital
2
Automatically enroll employees in the digital workplace health initiative (but they can freely opt out).
System 1
Social
3
Ask participants to define a situational cue, that is, connect the use of the sensor to a task they frequently perform (e.g., I first put my sensor before opening my mailbox).
System 2
Social
4
Display warnings (large fonts, bold letters, and bright colors) relating to health issues (e.g., a lack of physical activity, stress) in a frequented area of the office.
System 1
Digital
5
Establish a fun ritual regarding the use of the sensor.
System 1
Social
6
The employees who wish to participate in the digital workplace health initiative commit in writing (e.g., sign a document).
System 2
Social
7
In a frequented area of the office, display inspiring, positive, and motivating messages (large fonts, bold letters, and bright colors) about the importance of improving one’s health behaviors.
System 1
Social
8
Generate discomfort or fear by showing clips about negative impacts of burnout and a lack of physical activity.
System 1
Digital
9
The participants make a small public commitment before embracing the digital workplace health initiative (e.g., oral commitment during a group session).
System 2
Social
10
Deliberately place certain objects in the office environment (e.g., running shoes and runner’s magazines) to prime a healthy lifestyle among participants.
System 1
Social
11
Allow participants to customize their device without altering its functioning.
System 2
Digital
12
The participants have to set symbolic health goals in relation to the sensor (e.g., 6,000 steps per workday).
System 2
Digital
13
Place motivational pictures (e.g., a person running) on employees’ desks or above their personal device’s charger.
System 1
Social
14
Ask participants at the start of the digital workplace health initiative how well they think they will perform (e.g., in terms of increased number of steps).
System 2
Social
15
Establish a reminder cycle regarding the use of the sensor (e.g., via e-mail, SMS).
System 1
Digital
16
Health buddy: a peer (an employee) is in charge of providing information to the group (after being instructed).
System 2
Social
17
Insist on the gaps (e.g., in terms of health, experience, etc.) that eventual nonparticipation may create between the participants and the nonparticipants in the organization.
System 2
Social
18
Ask participants to think about, design, and/or introduce their own reminder system in order to use the sensor.
System 2
Digital
19
At the first meeting with the employees, introduce the presenter who will deliver instructions and/or will be in charge of the digital workplace health initiative as a health specialist (e.g., a practitioner).
System 2
Social
20
Ask employees about their future conduct, such as: Do you plan to reduce your work stress? (e.g., via a questionnaire, interviews).
System 2
Social
21
Designate a volunteer among the participants to be in charge of reminding others to use the sensors.
System 1
Social
22
Inform the participants that employees from other organizations strongly participate in such digital workplace health initiatives.
System 2
Social
23
Define a time limit within which employees can sign up to participate in the digital workplace health initiative.
System 1
Social
24
Divide participants into pairs or small groups as part of the digital workplace health initiative so as to create a positive drive.
System 1
Social
25
Quantify the employees’ environment in synchronization with the device (e.g., if you walk to this shop for lunch, you will take X steps, burn X calories; if you use the office entrance stairs, you will take X steps…).
System 2
Digital
26
Place high expectations on people and quantify objectives (regarding participation in the digital workplace health initiative). For instance: I know you can achieve this objective by the end of this month.
System 1
Social
27
Punctually provide information on and feedback to (e.g., visualizations) the general progress of the digital workplace health initiative.
System 2
Digital
Notes: The matrix of the factor loadings. * = factor loadings that are significant when SE = 1/√N, with SE = the standard error and N = the number of Q-sort statements (Brown, 1993). Here, the standard error = 0.180 (SE = 1/√28) = 1/5.29 = 0.18). Correlations are considered to be statistically significant at the 0.01 level when they >2.58 standard errors (irrespective of sign), that is, 2.58 (0.18) = 0.46. How to read this table: Factor loadings can range from −1.00 through 0 to +1.00. A factor loading of 0.70 indicates that an individual’s Q-set is strongly correlated with a particular factor. A negative factor loading indicates opposition with the factor. Conversely, a factor can be considered a reliable approximation of a participant’s beliefs, if the Q-sort statements given by a person significantly load on this factor, which in our case should be at least 0.46.
P-set group
A
B
C
D
E
Familiar with physiolytics
0.81*
−0.05
0.02
−0.02
0.08
Familiar with physiolytics
0.80*
0.01
0.08
0.17
−0.12
No contact with physiolytics
0.76*
0.19
0.08
0.04
−0.15
No contact with physiolytics
0.75*
0.21
−0.32
−0.02
−0.17
Familiar with physiolytics
0.71*
−0.27
−0.06
0.18
−0.14
No contact with physiolytics
0.67*
0.06
0.14
−0.19
−0.29
No contact with physiolytics
0.62*
−0.15
0.26
0.18
0.02
No contact with physiolytics
0.61*
−0.02
−0.13
0.09
0.27
Familiar with physiolytics
0.58*
0.37
0.20
0.33
−0.01
No contact with physiolytics
0.58*
0.27
0.14
−0.16
0.06
No contact with physiolytics
0.55*
0.49*
0.47*
0.07
−0.03
Familiar with physiolytics
0.49*
0.10
0.14
0.32
0.31
Familiar with physiolytics
0.48*
0.27
−0.45
0.05
−0.27
No contact with physiolytics
0.27
0.77*
−0.05
0.03
−0.20
Familiar with physiolytics
0.01
0.74*
−0.03
0.24
0.19
No contact with physiolytics
−0.37
0.71*
0.10
0.22
0.08
No contact with physiolytics
0.13
0.56*
−0.02
−0.14
0.34
Familiar with physiolytics
−0.12
0.05
0.79*
0.02
0.27
No contact with physiolytics
0.08
0.40
0.65*
0.13
−0.19
Familiar with physiolytics
−0.12
0.03
0.61*
0.40
0.14
Familiar with physiolytics
0.35
−0.27
0.57*
−0.08
−0.10
Familiar with physiolytics
−0.15
0.00
−0.13
0.84*
−0.28
No contact with physiolytics
0.54
0.14
−0.03
0.67*
−0.19
No contact with physiolytics
0.29
0.21
−0.04
0.62*
0.36
Familiar with physiolytics
0.27
0.34
0.48*
0.55*
0.02
Familiar with physiolytics
0.04
0.03
−0.12
−0.17
0.74*
Familiar with physiolytics
−0.10
0.21
0.02
−0.01
0.59*
No contact with physiolytics
0.28
0.17
−0.36
−0.15
0.58*
Eigenvalues
5.59
1.95
1.74
1.84
1.23
Percentage of variance explained (%)
19.96%
6.96%
6.21%
6.57%
4.39%
Appendix C: Heat Map along the degrees of consensus and disagreement.