
Abstract
Background
During cardiopulmonary bypass (CPB), goal-directed perfusion (GDP) seeks to match oxygen delivery to metabolic demand, but the dynamics of oxygen extraction and intraoperative oxygen demand remain poorly understood, especially in paediatric populations. Existing models rely on limited data and assume, for example, a linear relationship between log oxygen demand and temperature.
Methods
We developed GARIX (Global AutoRegressive Integrated model with eXogenous variables and an equilibrium force) to predict minute-by-minute changes in oxygen extraction ratio (OER) using high-resolution intraoperative data. GARIX combines: (1) an autoregressive term group (ATG) encoding memory of past OER; (2) an exogenous term group (XTG) incorporating recent and planned changes in cardiac index (CI), haemoglobin (Hb), SaO2, and temperature; and (3) an equilibrium term group (ETG) that aligns oxygen consumption with demand via nonlinear temperature and patient-specific terms (log age, log weight, and interaction). A baseline model (bGARIX) used a linear temperature term and no patient-specific covariates. We trained on 20,443 min from 293 paediatric CPB procedures and evaluated performance through repeated K-fold cross-validation, simulations, and bootstrap confidence intervals.
Results
GARIX reproduced physiologically plausible OER dynamics. Lagged coefficients captured adaptive responses to CI, Hb, SaO2, and temperature. Equilibrium analysis estimated a Q10 of 2.5 with bGARIX, matching textbook values (2.4–2.7). Likelihood ratio tests confirmed GARIX’s improved fit, revealing age- and weight-related heterogeneity and nonlinearity in temperature dependence. Variable importance showed ATG and XTG dominated predictive accuracy, underscoring the role of system dynamics. Simulations indicated slow OER response to CI and Hb and faster adaptation to temperature.
Conclusions
GARIX offers an interpretable, physiology-aligned model of oxygenation dynamics in paediatric CPB, enabling estimation of dynamic responses and latent demand. It provides a foundation for clinical insights and future real-time monitoring and intelligent perfusion control.
Keywords
Introduction
During cardiopulmonary bypass (CPB), the heart-lung machine (HLM) temporarily assumes the perfusion functions of maintaining oxygenation and circulation. Balancing oxygen supply and demand is the key objective in goal-directed perfusion (GDP) during CPB. Oxygen supply is determined by cardiac index (CI), haemoglobin concentration (Hb), oxygen saturation of arterial haemoglobin (SaO2) and partial pressure of oxygen in arterial blood (PaO2), while oxygen demand is dictated by the metabolic rate which is primarily a function of body temperature (Temp) during CPB. Effective GDP thus hinges on two key questions: (1) What is the body’s oxygen demand at any given time? (2) How does oxygen extraction respond to changes in oxygen supply and demand?
While CI, Hb, SaO2, PaO2, and Temp are reasonably controlled by the perfusionist, the oxygen extracted by the body is endogenous and cannot be directly manipulated. The assumption of ‘supply-independent consumption’ 1 – that the body consumes only what it needs regardless of excess supply – may not hold during CPB due to frequent – and sometimes abrupt – changes in perfusion parameters. For example, pump flow (and hence CI) may be reduced during surgical manoeuvres, or Hb levels may change due to haemodilution or transfusions. It is unreasonable to presume the body instantaneously adapts to such changes and maintains perfect oxygen balance during CPB.
Existing models that relate temperature to oxygen demand, such as the van’t Hoff and Arrhenius equations, 2 rely on a limited mix of human and animal data dating back many decades, with human experiments unlikely to be updated due to ethical constraints. Notably, an often-cited model in Kirklin et al.’s cardiac surgery textbook 2 is based on two temperature points: one at 20°C in humans 3 and one at 37°C in animals.4–6 These experiments were conducted during the 1950s to early 1980s.
High-resolution observational data, collected by modern equipment during CPB, present novel opportunities to study oxygenation dynamics, but also pose challenges. Traditional studies often assume the body is in equilibrium – a condition not met during standard CPB. Therefore, advanced statistical and machine-learning techniques are necessary to analyse such data accurately, accounting for system dynamics while attempting to infer the body’s latent oxygen demand.
In this study, we introduce GARIX – a Global autoRegressive Integrated time-series model with eXogenous variables and an equilibrium term – to characterise minute-by-minute changes in the oxygen extraction ratio (OER) during paediatric CPB. GARIX integrates three physiologically motivated components or ‘term groups’ (TGs): (1) an autoregressive term group (ATG) that encodes memory of past OER changes; (2) an exogenous term group (XTG) representing the effects – including past changes and intended actions – of controllable variables, namely CI, Hb, SaO2, and Temp; and (3) an equilibrium term group (ETG) that represents a force for aligning oxygen consumption with an internally estimated target that represents the oxygen ‘demand’. Together, these components allow GARIX to represent both dynamic adaptations and latent equilibrium targets in oxygenation.
A defining feature of GARIX is the ETG, which aligns indexed oxygen consumption (VO2i) with a model of metabolic demand (‘target’ VO2i or tVO2i) based on temperature, age, and weight of the patient. For benchmarking purposes, we also introduce a baseline version of GARIX – the bGARIX model – that retains the same autoregressive (ATG) and exogenous (XTG) terms but uses a simplified ETG. Specifically, bGARIX assumes a constant-Q10 temperature dependence of oxygen demand and excludes patient-specific modifiers such as age and weight. (Q10 is the multiplicative increase in oxygen demand for every 10°C increase in body temperature, which is assumed constant under the van’t Hoff specification 2 ).
By contrast, GARIX extends ETG in two ways: (1) it incorporates age, weight, and their interaction to capture developmental and size-related heterogeneity in baseline demand, and (2) it models temperature effects using a spline, enabling nonlinear scaling of log-demand with temperature across the clinical range. In this manuscript, which is Part 1 of a two-part series, we describe the methodological framework for GARIX and evaluate its performance and physiological plausibility, using bGARIX as a baseline to highlight the benefits of GARIX enhancements. Part 2 of the series builds on the foundation laid in Part 1 to examine the clinical implications of GARIX across age groups, temperature regimes, and dynamic oxygenation states.
For a list of nonstandard abbreviations and acronyms used in this manuscript, see Supplemental Material A.
Methods
Data description
This study is a retrospective analysis of high-resolution intraoperative CPB data collected at the Great Ormond Street Hospital for Children between 2019 and 2021. The cohort includes all patients younger than 18 years of age - the maximum age treated at the institution - who underwent CPB procedures during this period.
Clinical data were collected as part of routine care and were de-identified prior to analysis. Ethical approval for this study was granted under audit number 3045, with data use falling within the scope of an existing research database approval (REC reference: 17/LO/0008). Due to the retrospective and anonymised nature of the dataset, individual patient consent was not required.
Continuous minute-by-minute measurements were obtained from the HLM and anaesthetic monitors, including CI, Hb, SaO2, venous oxygen saturation (SvO2), and Temp. Data collection systems and validation protocols - including device calibration procedures and data filtering criteria - are described in detail in Supplemental Material B.
To ensure that the estimated parameters of GARIX reflect normative physiological dynamics, patients who developed postoperative acute kidney injury (AKI) were excluded from model training. AKI was defined as a score of one or more, using the Kidney Disease: Improving Global Outcomes (KDIGO) definition. 7 This exclusion yielded a primary training set consisting of 286 patients undergoing 293 CPB procedures, totalling 20,443 min of valid intraoperative data.
Age and weight were treated as key patient-level covariates for stratified analyses and model extension. For subgroup analysis, we categorised age into four groups: neonates (<1 month), infants (1–6 months), toddlers (6 months–3 years), and children (>3 years). The maximum age in the dataset is 18.23 years.
A more detailed account of patient characteristics is provided in Supplemental Material C.
GARIX and bGARIX models
We developed the GARIX model to predict minute-by-minute changes in the logit-transformed OER, where logit (OER) = log [OER / (1 - OER)]. The model assumes that changes in this quantity follow a generalised additive form,
8
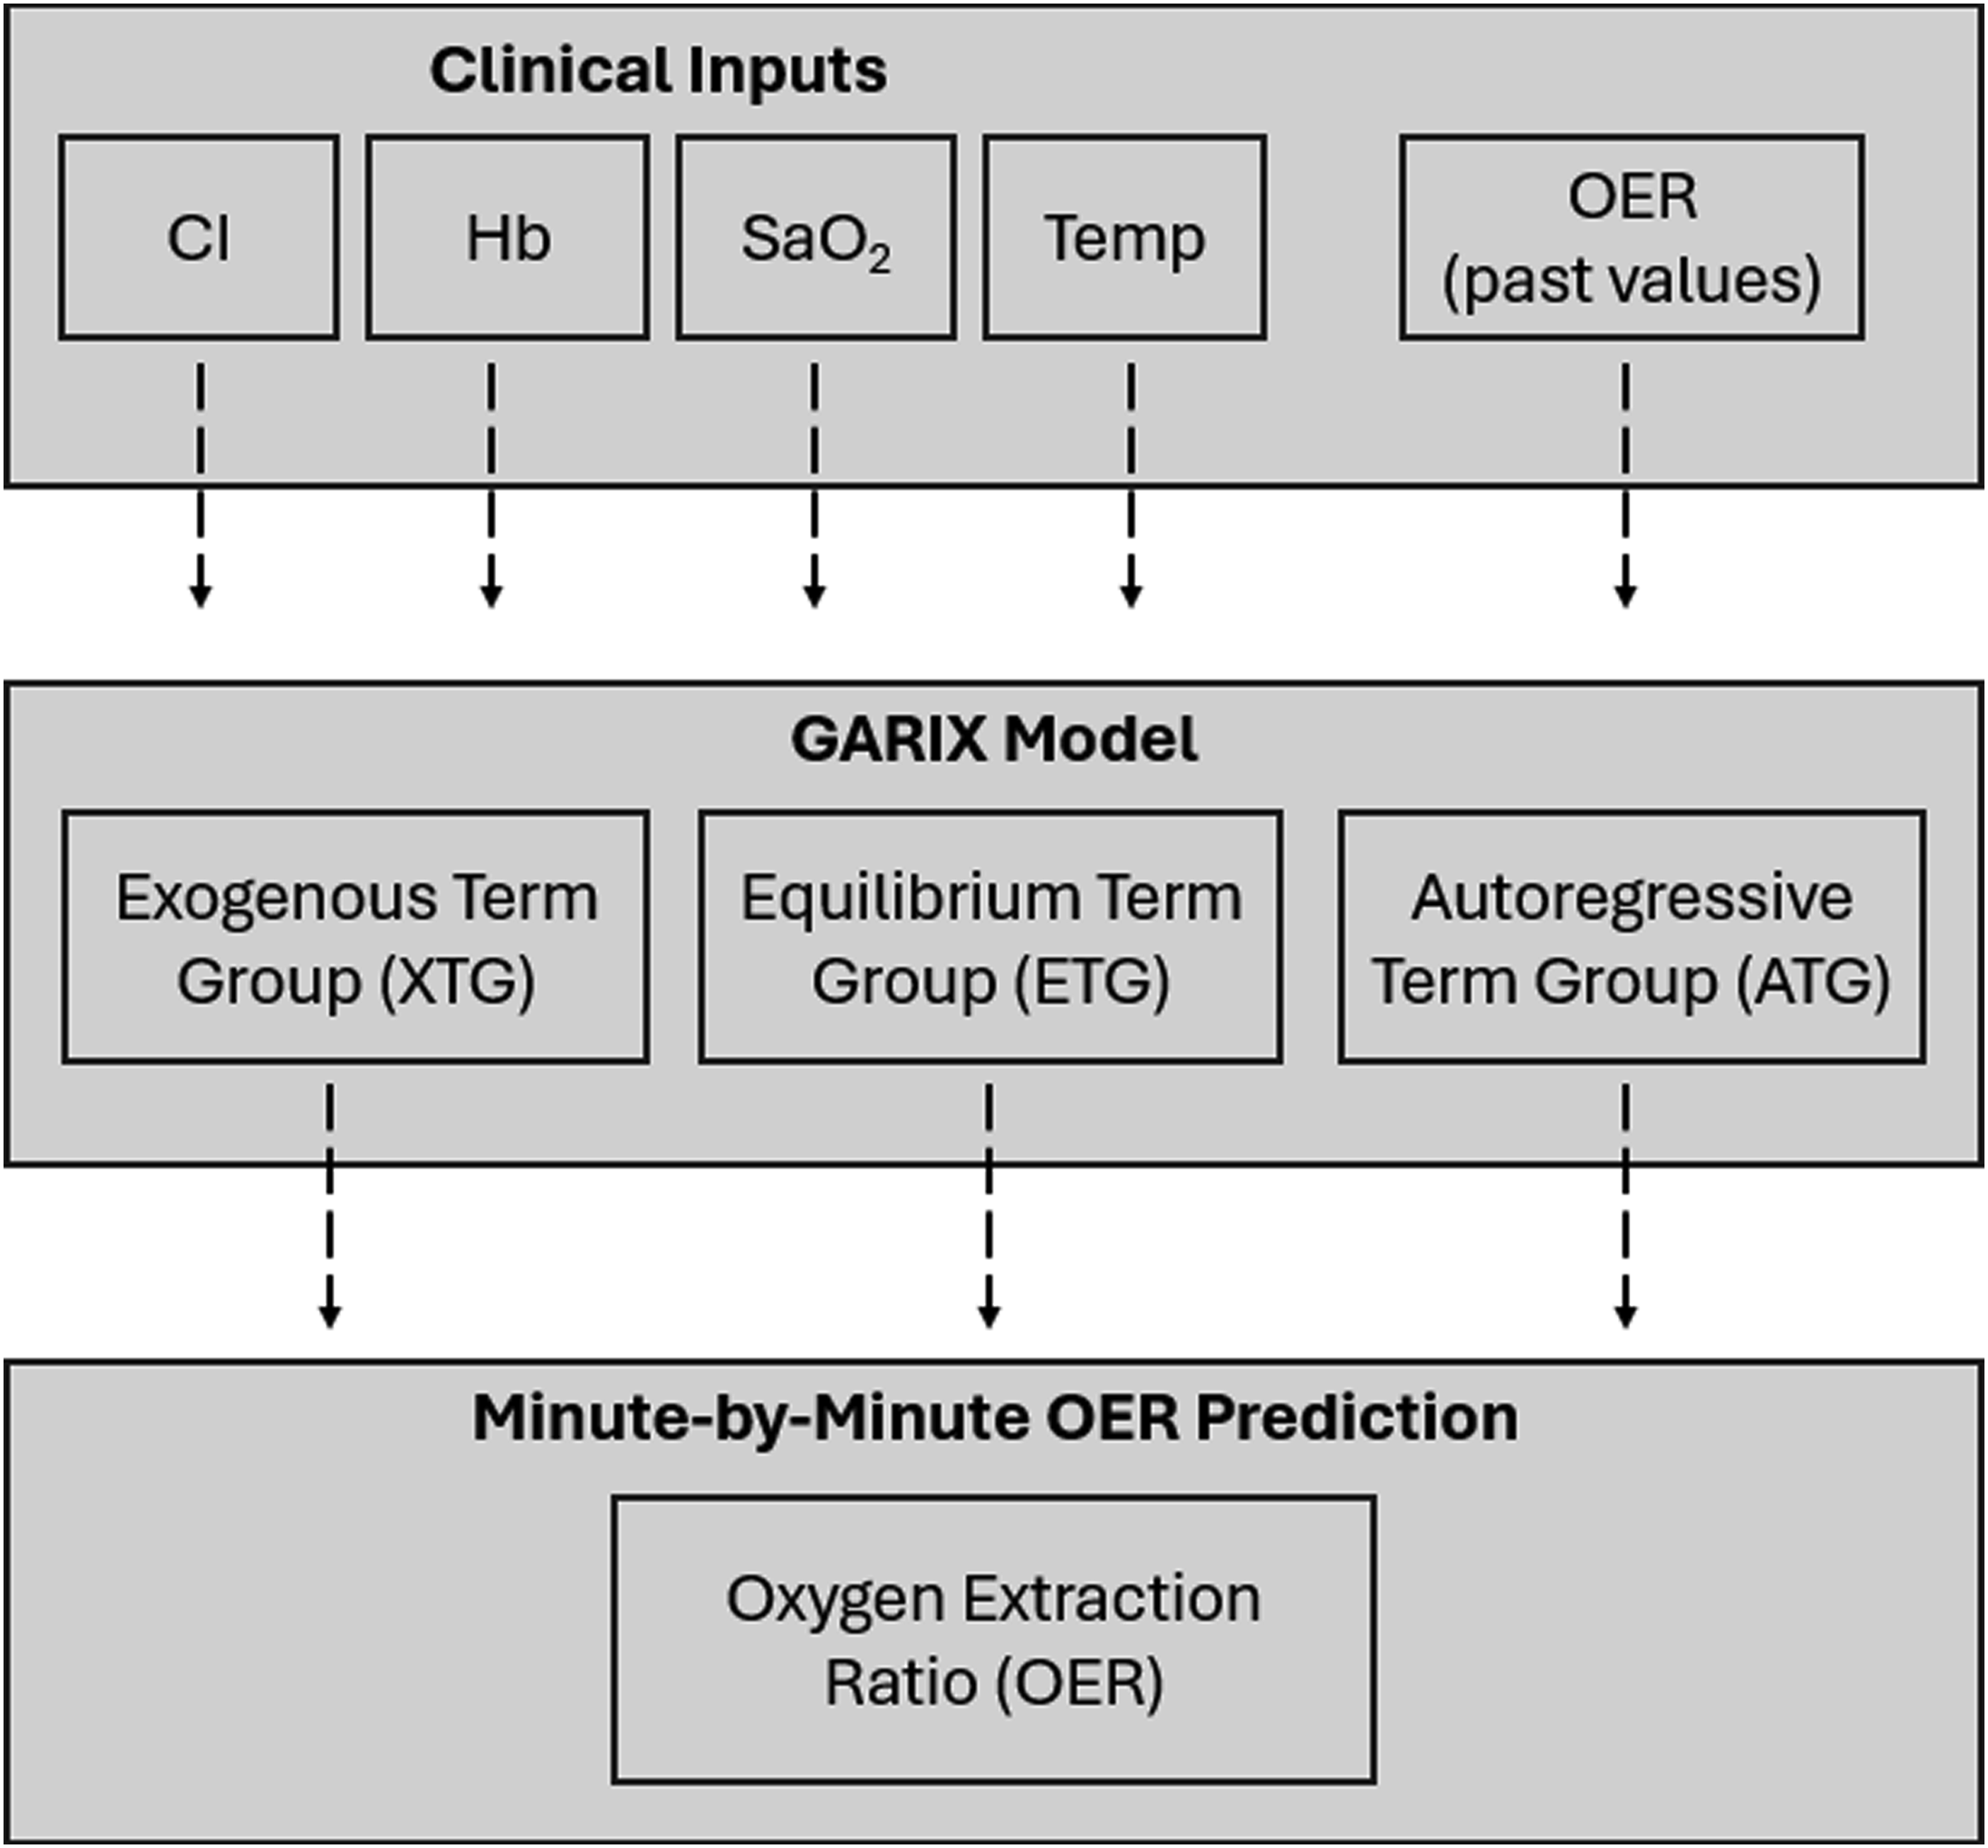
with three TGs: (1) an equilibrium TG (ETG), representing a corrective mechanism that aligns oxygen consumption with temperature- and patient-specific metabolic demand; (2) an autoregressive TG (ATG), capturing delayed responses to past OER changes; and (3) an exogenous TG (XTG), reflecting the influence of recent and planned changes in controllable inputs, namely CI, Hb, SaO2, and Temp. Figure 1 provides a conceptual summary of the GARIX model. In mathematical terms, we have and Conceptual summary of GARIX. Conceptual Summary of the GARIX Model: Clinical inputs controlled by the perfusionist (CI, Hb, SaO2, and Temp), as well as past values of OER, feed into the GARIX model. The model decomposes minute-by-minute changes in OER into three intuitive components: (1) Autoregressive Term Group (ATG) encoding memory of past OER changes; (2) Exogenous Term Group (XTG) capturing immediate and lagged effects of clinical actions; and (3) Equilibrium Term Group (ETG) driving the system towards alignment between oxygen consumption and patient-specific oxygen demand. The combined effects of these components yield dynamic predictions of OER throughout CPB.


Focusing on the ETG:

Indexing, in this context, means dividing oxygen consumption or demand by the patient’s body surface area (BSA). Thus
When the system is in perfect equilibrium, i.e., when oxygen consumption matches oxygen demand, ETG must be zero at all times, which means VO2i must equal tVO2i according to equation (2). This, in turn, means that tVO2i can be interpreted as oxygen demand. (See Supplemental Material D for further details on equilibrium analysis).
To understand tVO2i representation in ETG, it is helpful to begin with bGARIX, which assumes that the logarithm of tVO2i is a linear function of Temp:
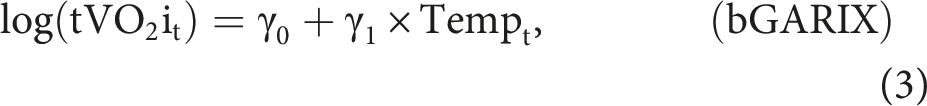
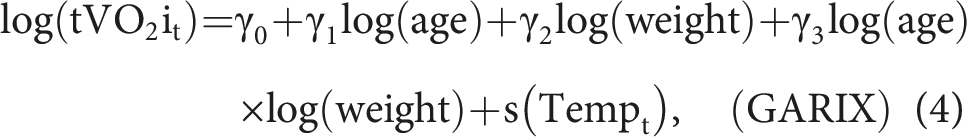
The GARIX model improves bGARIX by making two key modifications. First, the intercept of the relationship between temperature and the logarithm of oxygen demand is modelled as a linear function of patient-level covariates: the logarithm of age, the logarithm of weight, and their interaction (or product). This allows the model to reflect physiological heterogeneity across the paediatric population, capturing differences in baseline metabolic demand as a function of size and developmental stage. Second, the linear temperature term in bGARIX is replaced by a natural spline, enabling GARIX to capture nonlinear effects of temperature on oxygen demand. This flexible specification accommodates deviations from the constant-Q10 assumption, allowing the estimated Q10 to vary across temperature regimes. Together, these enhancements make GARIX more physiologically expressive and better suited to modelling real-world data in which both age-related and temperature-dependent effects are complex and nonlinear. Mathematically, we have
An alternative but complementary interpretation of GARIX is to frame it in terms of past, present, and future influences on OER. In this perspective, the model decomposes the expected change in logit (OER) into three conceptual components: system memory (past), current deviation from equilibrium (present), and intended clinical interventions (future). The past is represented by a history term group (HTG) that captures lagged changes in OER and exogenous variables, reflecting delayed physiological adaptations. The present is captured by the equilibrium term group (ETG), introduced earlier, which compares current oxygen consumption to a target demand derived from temperature, age, and weight. The future corresponds to a planned intervention (or future) term group (FTG), which includes intended changes in CI, Hb, SaO2, and Temp that are likely to affect OER in the next time step. The sum of ATG and XTG is mathematically equivalent to the sum of HTG and FTG, with ETG shared across both perspectives.
For further mathematical details on GARIX including the definitions of ATG and XTG, see Supplemental Material D, including the ‘model card’ for GARIX in Figure D 1.
Model estimation and validation
Model parameters for GARIX – including the oxygen demand parameters of equation 4 – were estimated using the backfitting algorithm for generalised additive models (GAMs), 8 implemented in the gam R package. 9 The response variable was the first difference of the logit-transformed OER, computed minute by minute. CI, Hb and SaO2 were log-transformed before calculating lagged differences, also at the 1-min resolution.
The model’s ‘length of history’ or ‘maximum lag’ (N), defined as the number of lagged time points included for each dynamic term, was treated as a hyperparameter and tuned using 10-times repeated, 5-fold cross-validation (CV), with out-of-sample (OOS) R-squared as tuning metric. For comparability, when comparing different values of N, we held the training dataset fixed by restricting it to the subset of observations valid for the longest history (N = 20). We use GARIX(N) to refer to a GARIX model trained with a length-of-history parameter of N. Throughout the manuscript, when we drop N and refer to the model as GARIX, it should be assumed that N = 5, i.e., we are referring to GARIX (5).
Residuals were assessed for autocorrelation and heteroscedasticity using pooled autocorrelation plots of residuals and absolute values of residuals (Supplemental Material E). These plots were compared to similar plots where model residuals were replaced with the ‘gold standard’ residuals, i.e., independent draws from a normal distribution with fixed variance.
To assess the relative contribution of each TG to predictive performance, we conducted permutation-based variable importance (PVI) analysis. Within a 10-fold CV framework, each term group – ATG, XTG, or ETG – was permuted by randomly shuffling the rows in the corresponding columns of the design matrix. The decline in model performance (OOS R-squared) caused by the shuffling – averaged over 100 shuffles within each held-out fold before feeding into the outer CV algorithm – provided a measure of the group’s predictive contribution. Confidence intervals for PVI numbers are based on the standard deviations calculated across 100 shuffles.
Simulation studies
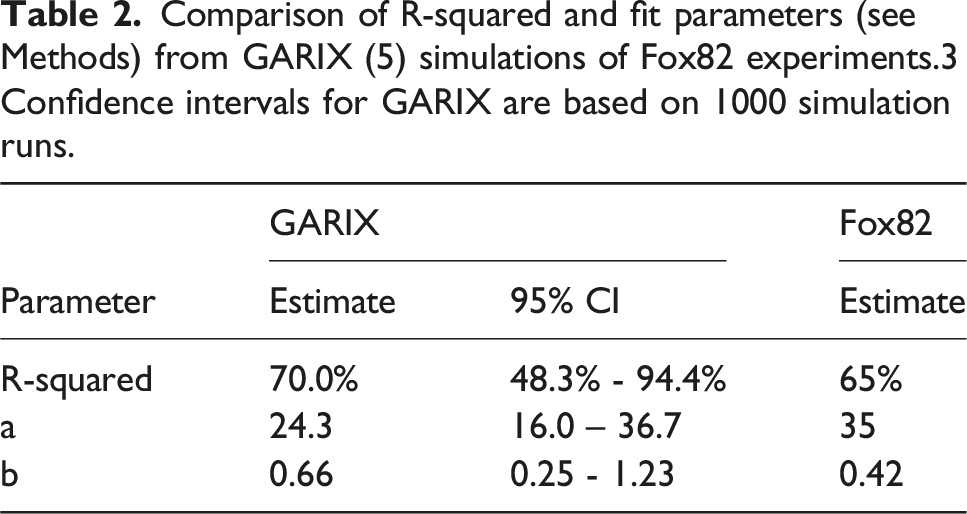
Deterministic simulations were used to generate the OER trajectories shown in Results. GARIX was trained on non-AKI patients. Equilibrium baseline values were defined by (1) taking the median of the observed log (CI), log (Hb), log (SaO2) and Temp, and (2) solving the equilibrium equation for the implied OER. For each input variable (CI, Hb, Temp), a final value was selected such that the new equilibrium OER would be 0.17, down 0.05 from the calculated baseline value of 0.22. Each trajectory was initialised with an equilibrium history of baseline values and then perturbed at t = 0 by modifying the target input variable (CI, Hb or Temp) while holding others – including SaO2 – constant. Simulations were run for 200 min in deterministic mode – i.e., with noise turned off – and minute-by-minute OER values were computed and stored. Timescale of Adaptations Timescale of OER Adaptations. Panel A: OER trajectory – using deterministic simulations - following step changes in CI, Hb, and Temp at t = 0. Prior to step change, system is in equilibrium, i.e., oxygen consumption equals oxygen demand with log (CI) = 1.00, log (Hb) = 2.31, log (SaO2) = 4.60, Temp = 33.1°C, resulting in OER = 0.22. Size of each step change is such that the new, equilibrium OER equals 0.17. Panel B: Comparison of VO2i-vs-CI curves, produced by GARIX (using stochastic simulations) and the hyperbolic model of Fox82 (human experiments). Light blue ‘o’ marks show results of a sample stochastic simulation using GARIX (5), with settings that closely match Fox82 (see Methods), including 17 subjects and a 10-min wait after each step change to the CI. Light blue curve is the hyperbolic fit to simulated data. Blue ‘x’ marks are GARIX (5) stochastic simulations using wait times of 100 min. The blue curve shows the hyperbolic fit to that data. The dark blue, piecewise linear line shows the results for infinite wait time and averaging over an infinite pool of (simulated) subjects. Dotted red curve is the hyperbolic fit of Fox82 to their human experiments.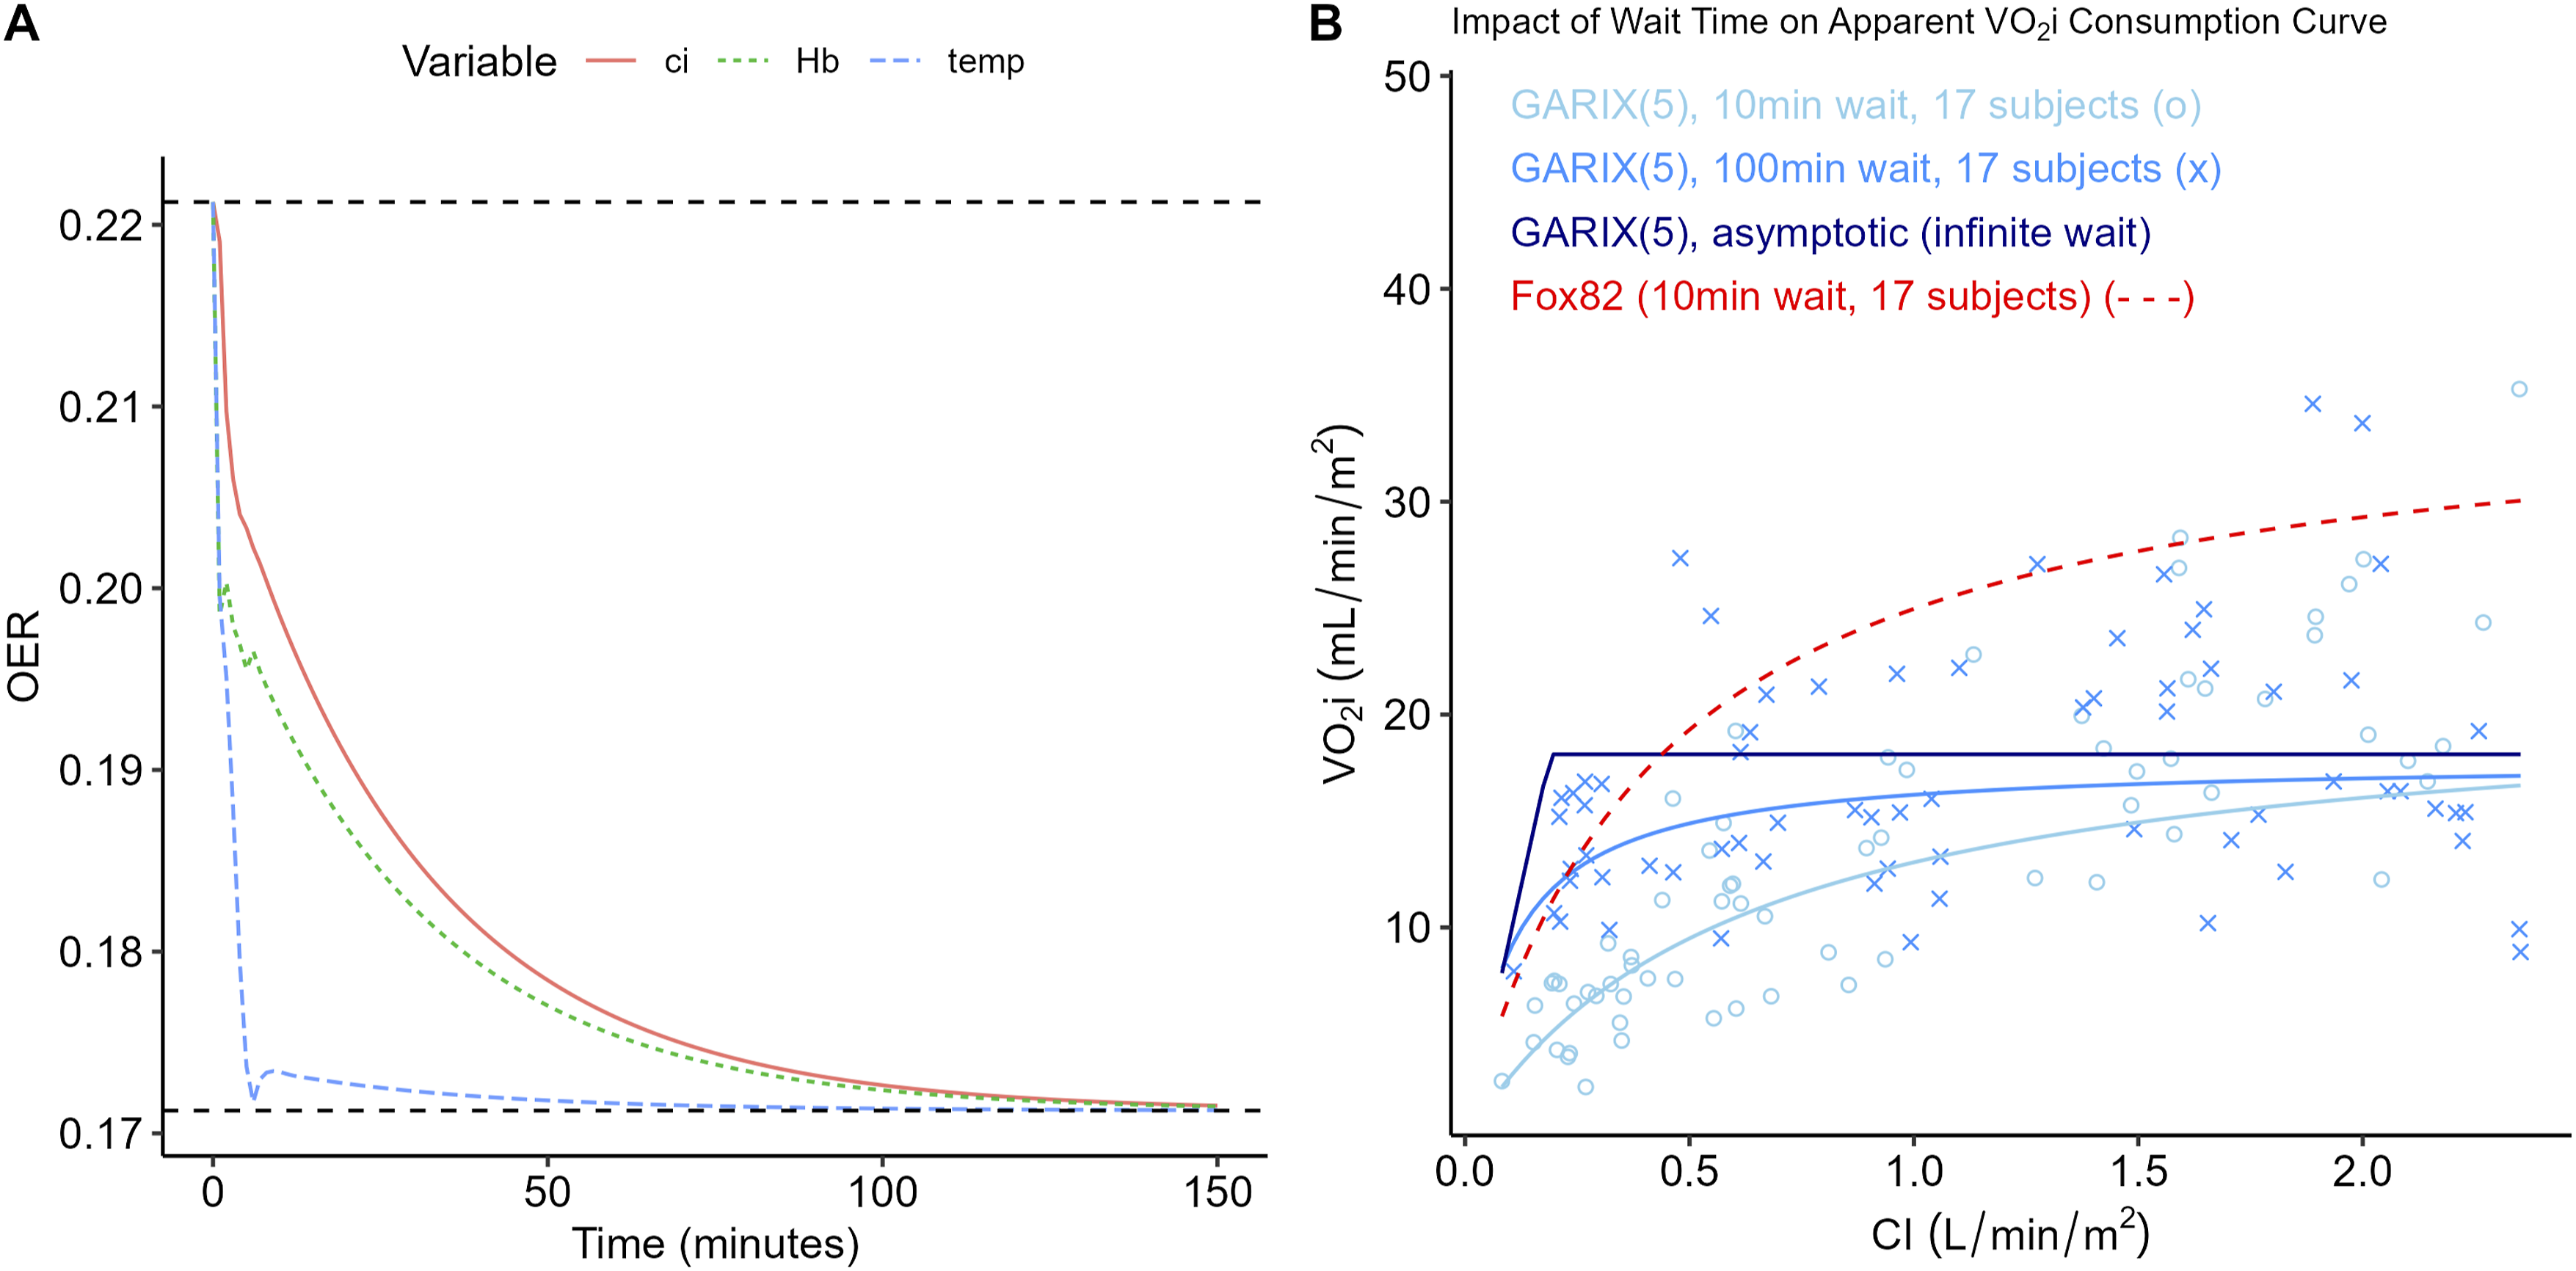
Stochastic simulations were used to replicate the experimental protocol of Fox et al. 3 (hereafter referred to as ‘Fox82’ for brevity) and investigate how equilibration time influences the apparent VO2i-CI relationship. We first trained GARIX on the AKI-free patients, as before. Using the trained GARIX model, synthetic trials were initialised to match Fox82 conditions as closely as possible (Temp = 20°C, SaO2 = 99 %, Hb = 7.1 g dL−1, CI = 2.2 L min−1 m−2), and 17 virtual subjects were exposed to five randomly ordered CI plateaus for 10 min each, with Gaussian noise calculated based on GARIX model residuals. CI plateaus were drawn from normal distributions constructed to match the reported figures in Fox82. Simulations were repeated with a longer 100-min waiting period to assess the effect of dynamic equilibration. For each subject and CI level, VO2i was recorded at the final minute of the plateau. A hyperbolic function of the form, VO2i = a · CI / (b + CI), was fit to the pooled VO2i-CI pairs via linear regression on the reciprocals of CI and VO2i. In addition to fits from the 10-min and 100-min simulations, an asymptotic VO2i curve was derived by computing the minimum of tVO2i and DO2i for each CI value, representing the limit after infinite waiting time. More details on the settings of Fox82 experiments can be found in Supplemental Material H.
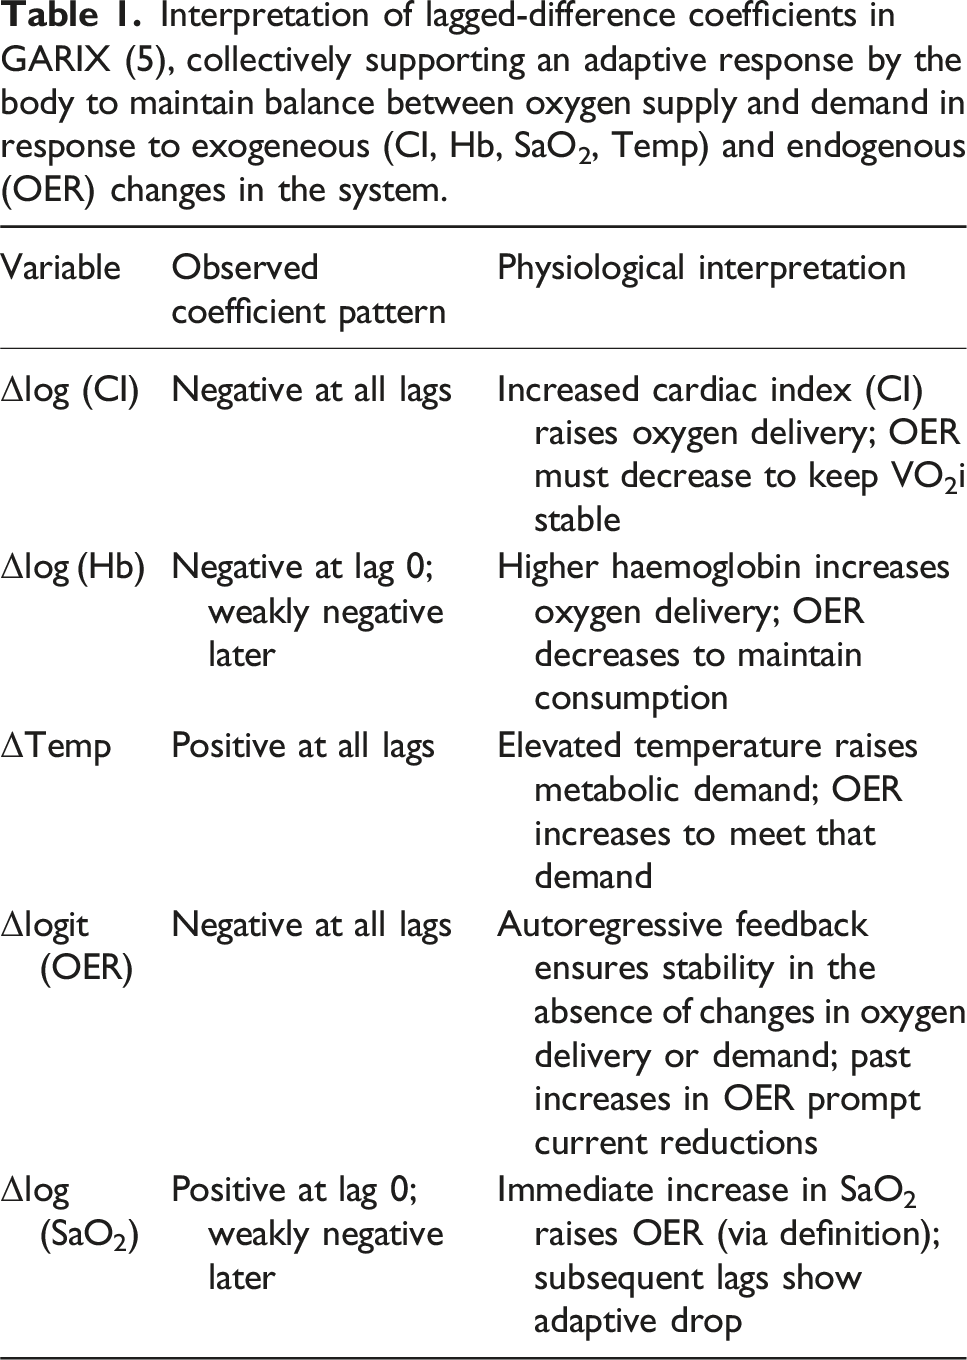
Interpretation of lagged-difference coefficients in GARIX (5), collectively supporting an adaptive response by the body to maintain balance between oxygen supply and demand in response to exogeneous (CI, Hb, SaO2, Temp) and endogenous (OER) changes in the system.
Conceptual and technical details on system simulations using GARIX can be found in Supplemental Material D.
Results
Key data characteristics
The CPB intraoperative dataset contains substantial variability in the key exogenous inputs to oxygen delivery: CI, Hb, and Temp. As illustrated in Figure 2, individual operations often contain large, abrupt changes in CI – including near-zero values during surgical pauses – alongside gradual or stepwise shifts in Hb and Temp. These fluctuations occur over minutes and reflect both intentional clinical actions and underlying physiological responses. Sample time-series in GARIX training data Time series of CI, Hb, and Temp for a single CPB operation used in training of GARIX. Each point represents an ‘exogenous variable’ – in GARIX terminology – recorded at 1-min intervals. Gaps in time-series reflects periods where recordings of one or more variables were deemed invalid (see Supplemental Material B).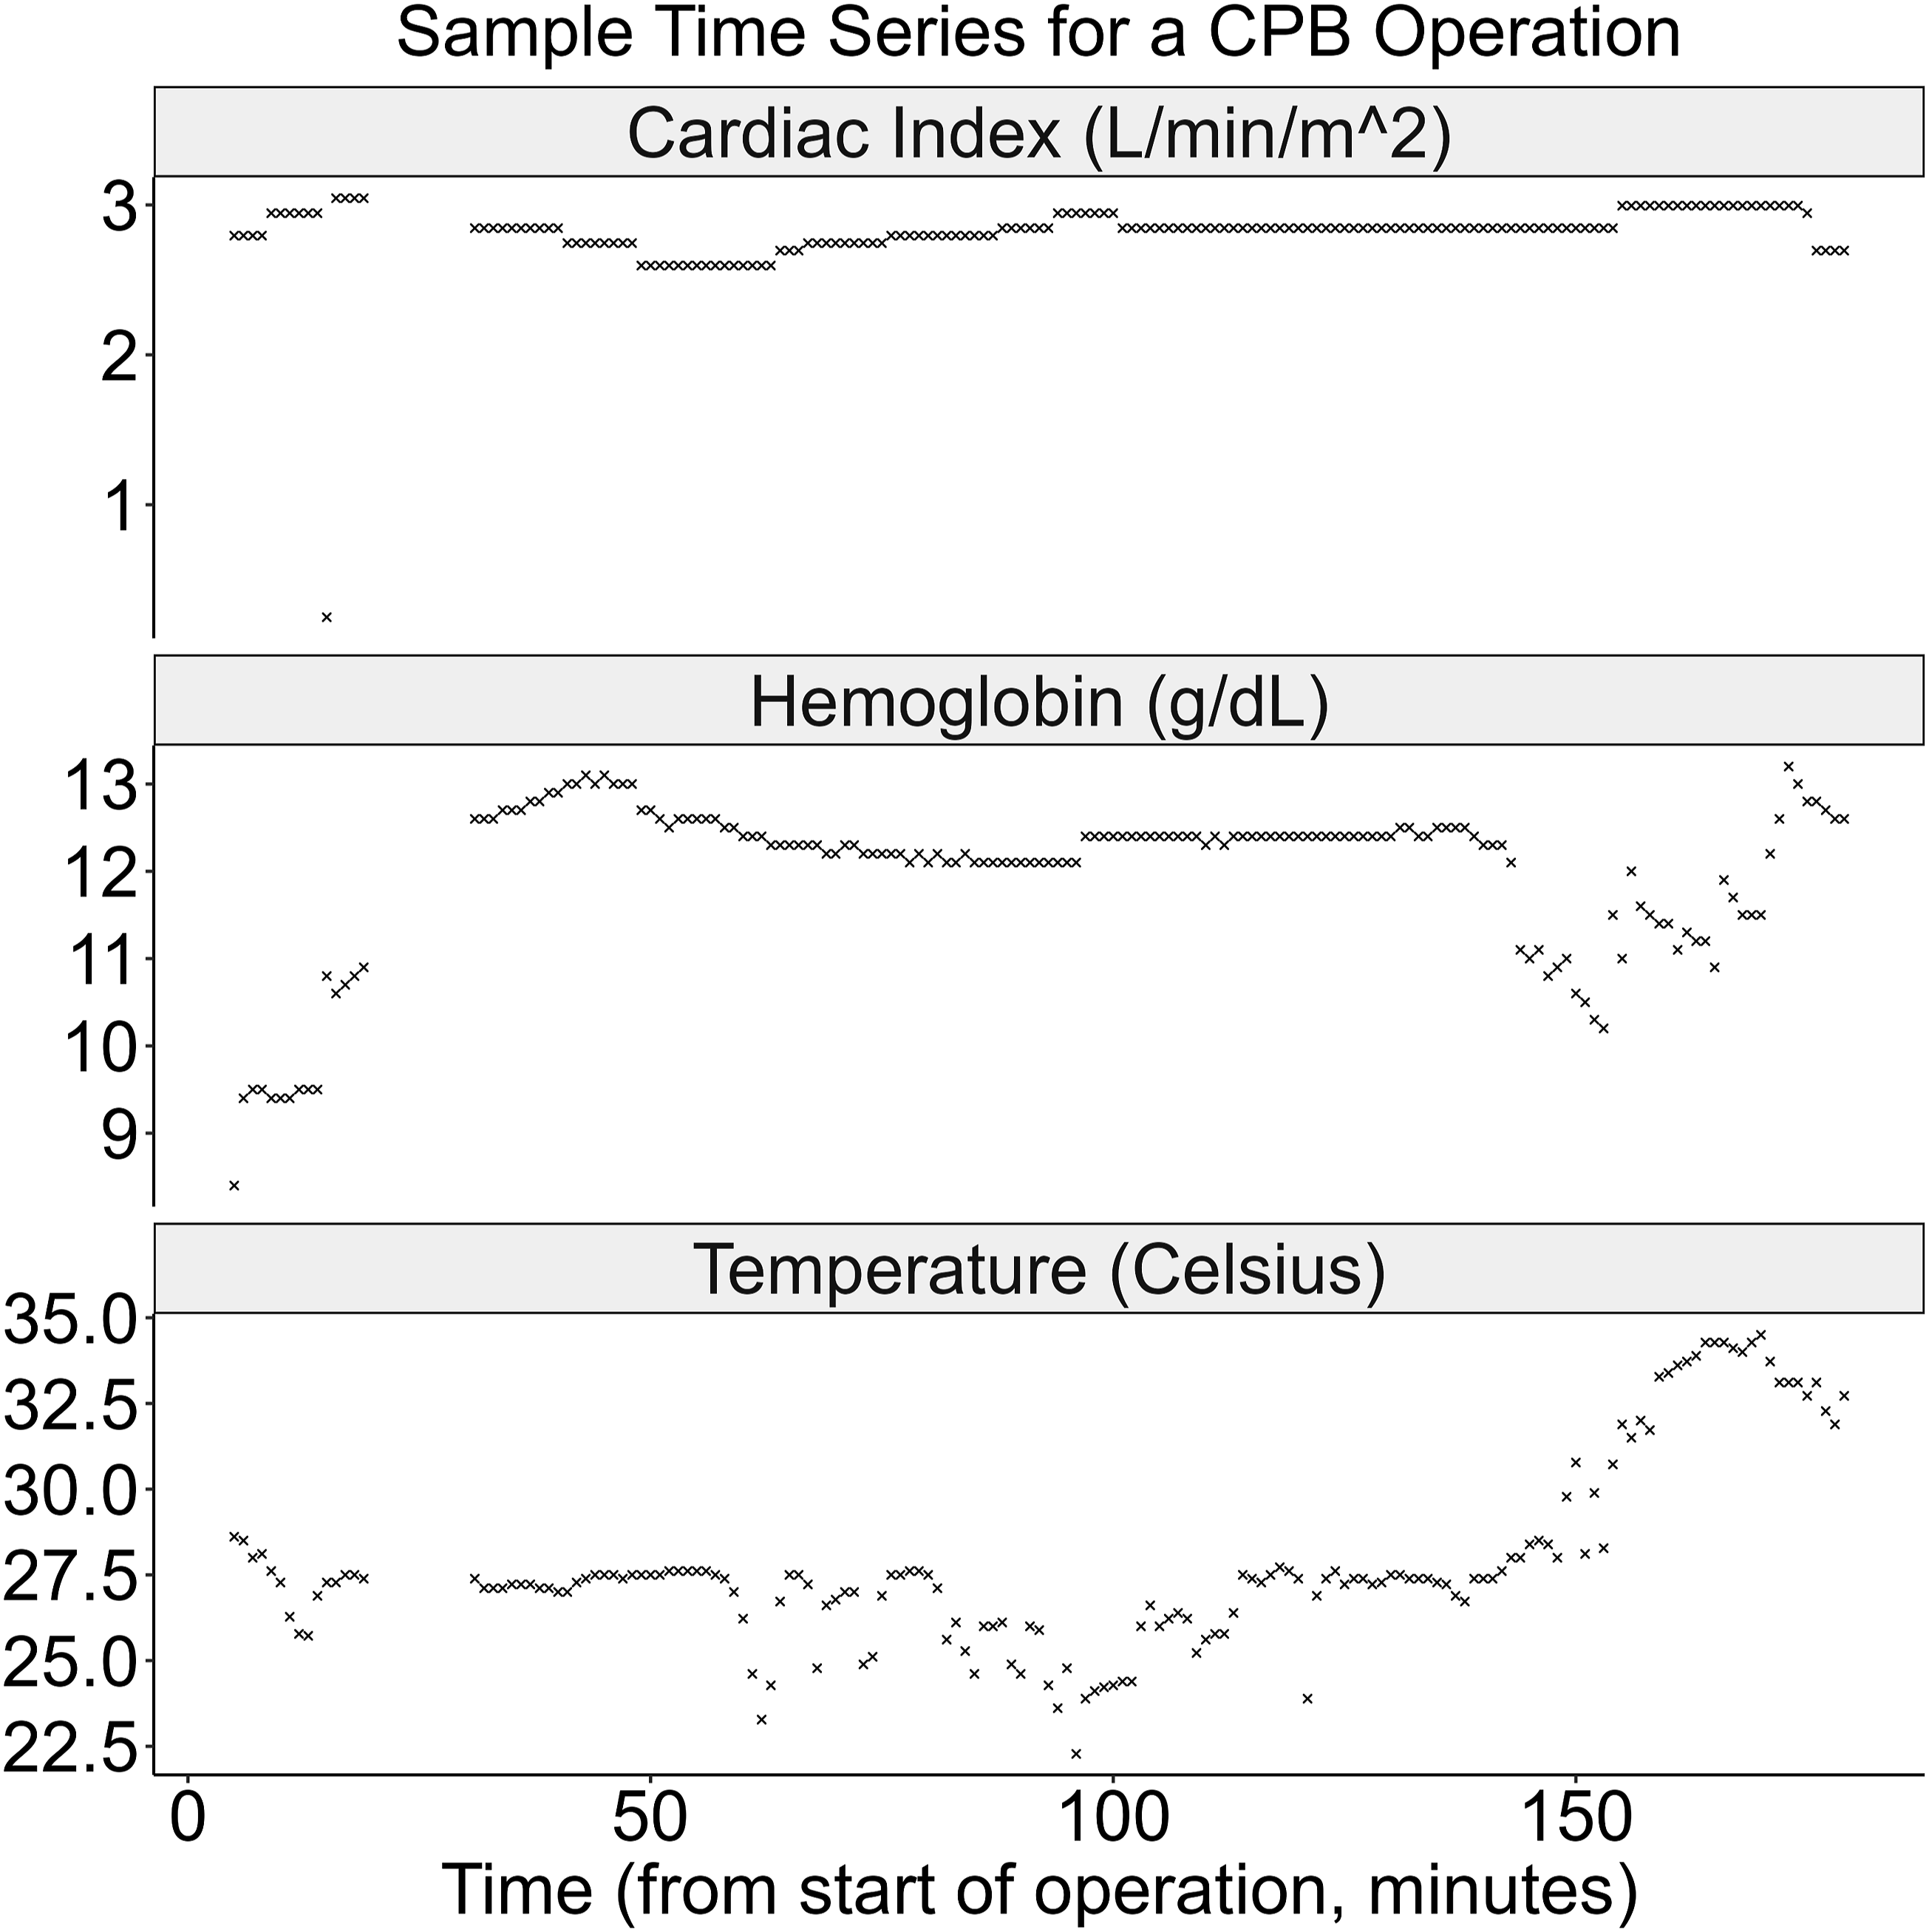
Figure 3 summarises the distributional characteristics of key variables in GARIX. Patient age spans from neonates to adolescents, covering a broad developmental spectrum within the age limit of 18 years. Temperature ranges from approximately 16°C to 37°C, with a strong concentration in the mild hypothermia range, consistent with standard CPB protocols. CI exhibits a bimodal distribution, with a primary peak near normative values and a secondary peak at low flows. (Periods of zero flow were excluded due to measurement unreliability.) OER is centred near 22%, with perfusionists actively avoiding extreme values. (Rare values above 60% were excluded based on clinical review of measurement validity). Data distribution. Distribution of data used in training GARIX. A: Age of patient at operation time; B: Intraoperative temperature; C: Intraoperative CI; D: Intraoperative OER; E: Oxygen consumption versus temperature; F: Oxygen consumption versus oxygen delivery within temperature range of 31°C−33°C. For panels E and F, a random sample of 1000 points are displayed to avoid clutter.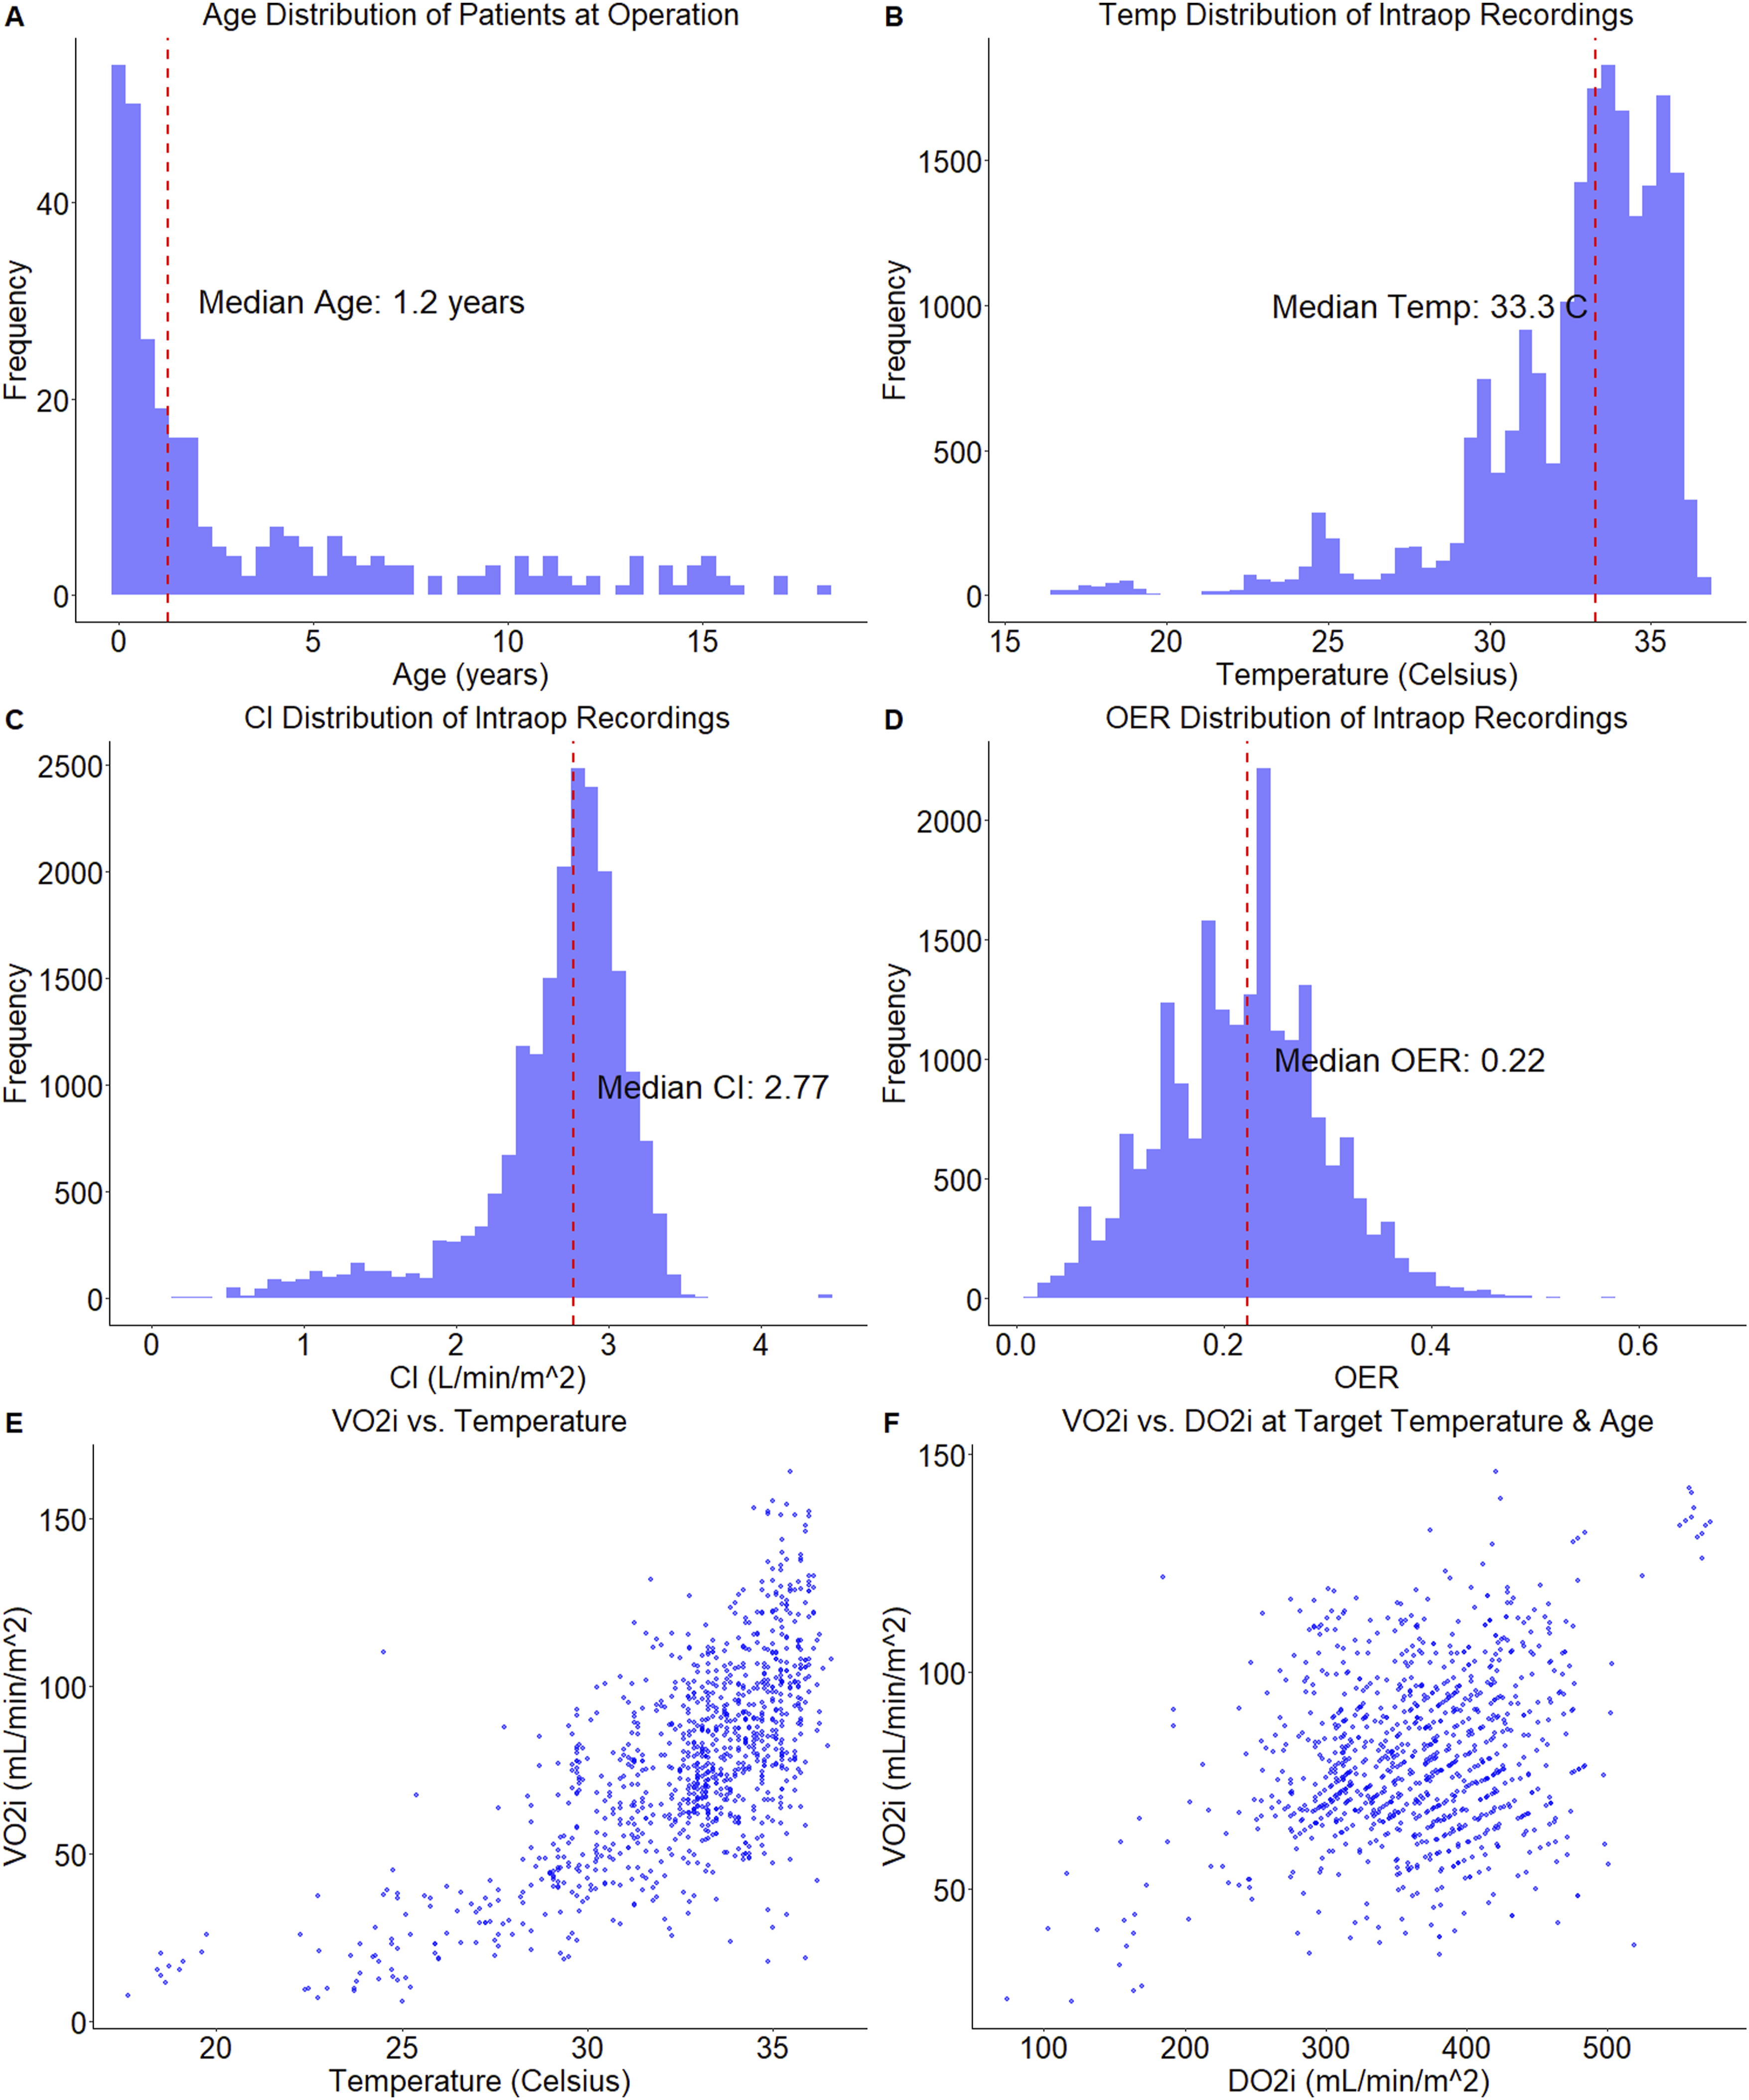
Two additional panels in Figure 3 provide insight into system behaviour. The VO2i-temperature panel confirms the expected increase in oxygen consumption with rising temperature, though the relationship is nonlinear and noisy. More intriguingly, the VO2i–DO2i panel – here restricted to temperatures near 33°C – shows no visual evidence of a supply-independent regime, despite OER values remaining well below physiological ceilings of 0.5–0.7. This apparent contradiction will be explained by GARIX, which incorporates system dynamics and delayed adaptation, offering a more faithful explanation of observed consumption patterns (see Figure 6B).
Model performance versus length of history
Panel A of Figure 4 shows OOS R-squared versus length of history (N) for GARIX(N). The best performance occurs at N = 5, which motivates our choice of GARIX (5) for all remaining analyses and simulation in this manuscript as well as Part 2. This choice preserves a healthy observations-to-parameters ratio and mitigates overfitting, without implying that perturbations at time t have no physiological effect beyond t + 5 – rather, it indicates that changes in ‘exogenous’ variables at time t do not have a ‘direct’ impact on OER beyond t + 5, though the indirect impact – via ATG and ETG – can last longer. Adaptive OER response Length of history versus model coefficients and performance. Panel A shows OOS R-squared versus N (or maximum lag) in GARIX(N). Panels B–F show the coefficients of lagged-difference terms for different state variables versus the lag order. Error bars represent 95% confidence intervals for each coefficient. Note that for logit (OER), there is no coefficient at lag = 0.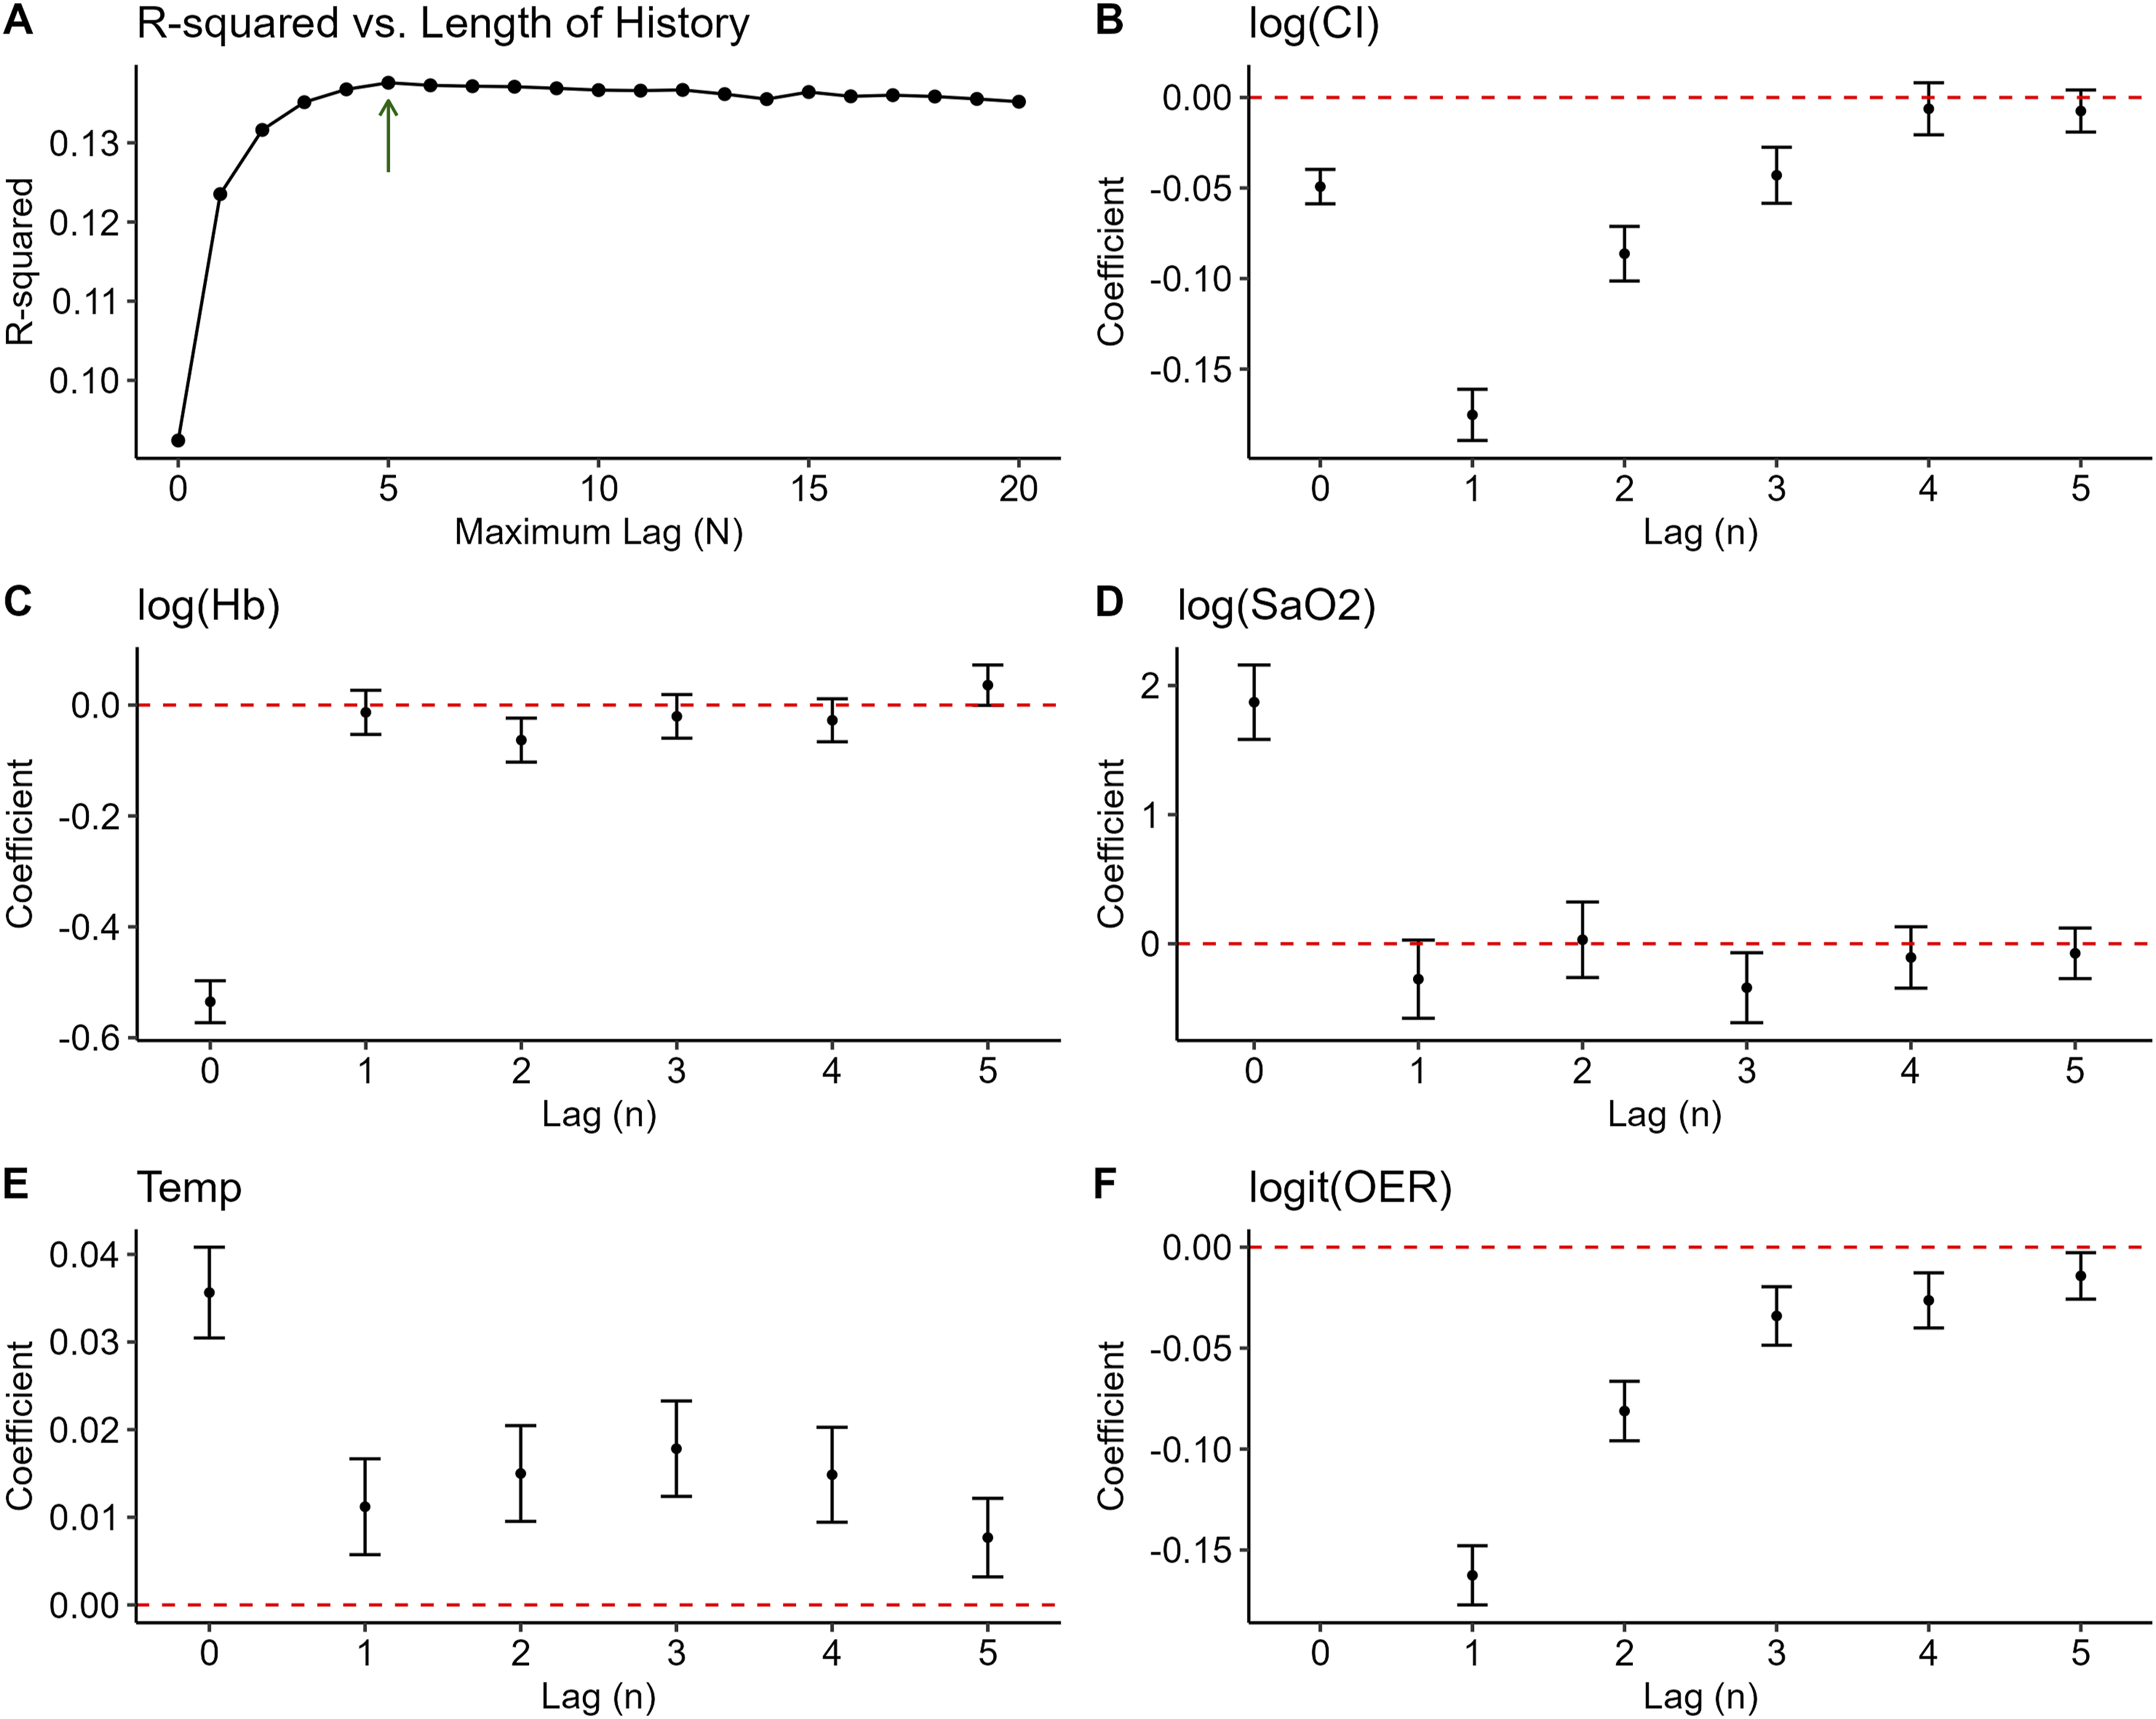
Autoregressive and exogenous terms
Comparison of R-squared and fit parameters (see Methods) from GARIX (5) simulations of Fox82 experiments.3 Confidence intervals for GARIX are based on 1000 simulation runs.
Equilibrium term
The ETG in GARIX is designed to represent a homeostatic correction mechanism: when oxygen consumption (VO2i) deviates from its temperature-dependent target value (tVO2i), the system responds by adjusting the OER to restore balance. Mathematically, this corresponds to a term proportional to the difference between log (VO2i) and log (tVO2i), with coefficient k (Supplemental Material D, equation D.6). For the ETG to serve as a true corrective force, k must be negative, ensuring that the direction of OER change counteracts the deviation. For example, if consumption exceeds demand, a negative k reduces OER to restore equilibrium. Model estimation yielded a statistically significant negative value of k = −0.05 (p-value: 2e-190), consistent with an adaptive control mechanism.
bGARIX versus GARIX
Likelihood ratio tests (Figure 5) confirm that both of the following improved model fit, regardless of the order in which they are added: (1) adding age and weight to the intercept of the (log) oxygen demand model (p-value: 1e-9), and (2) replacing temperature with a spline term (p-value: 9e-11). Overall, GARIX is statistically superior to bGARIX (p-value: 2e-19). Furthermore, bGARIX itself is a significant improvement over a standard time-series model that does not include the ETG (p-value: 2e-46), confirming the meaningful contribution of the equilibrium force in explaining OER dynamics. Likelihood ratio tests – bGARIX versus GARIX Conceptual steps in transitioning from a standard time-series model to bGARIX and GARIX. For each step, the p-value of the likelihood ratio test between the two models is reported. All p-values are highly significant.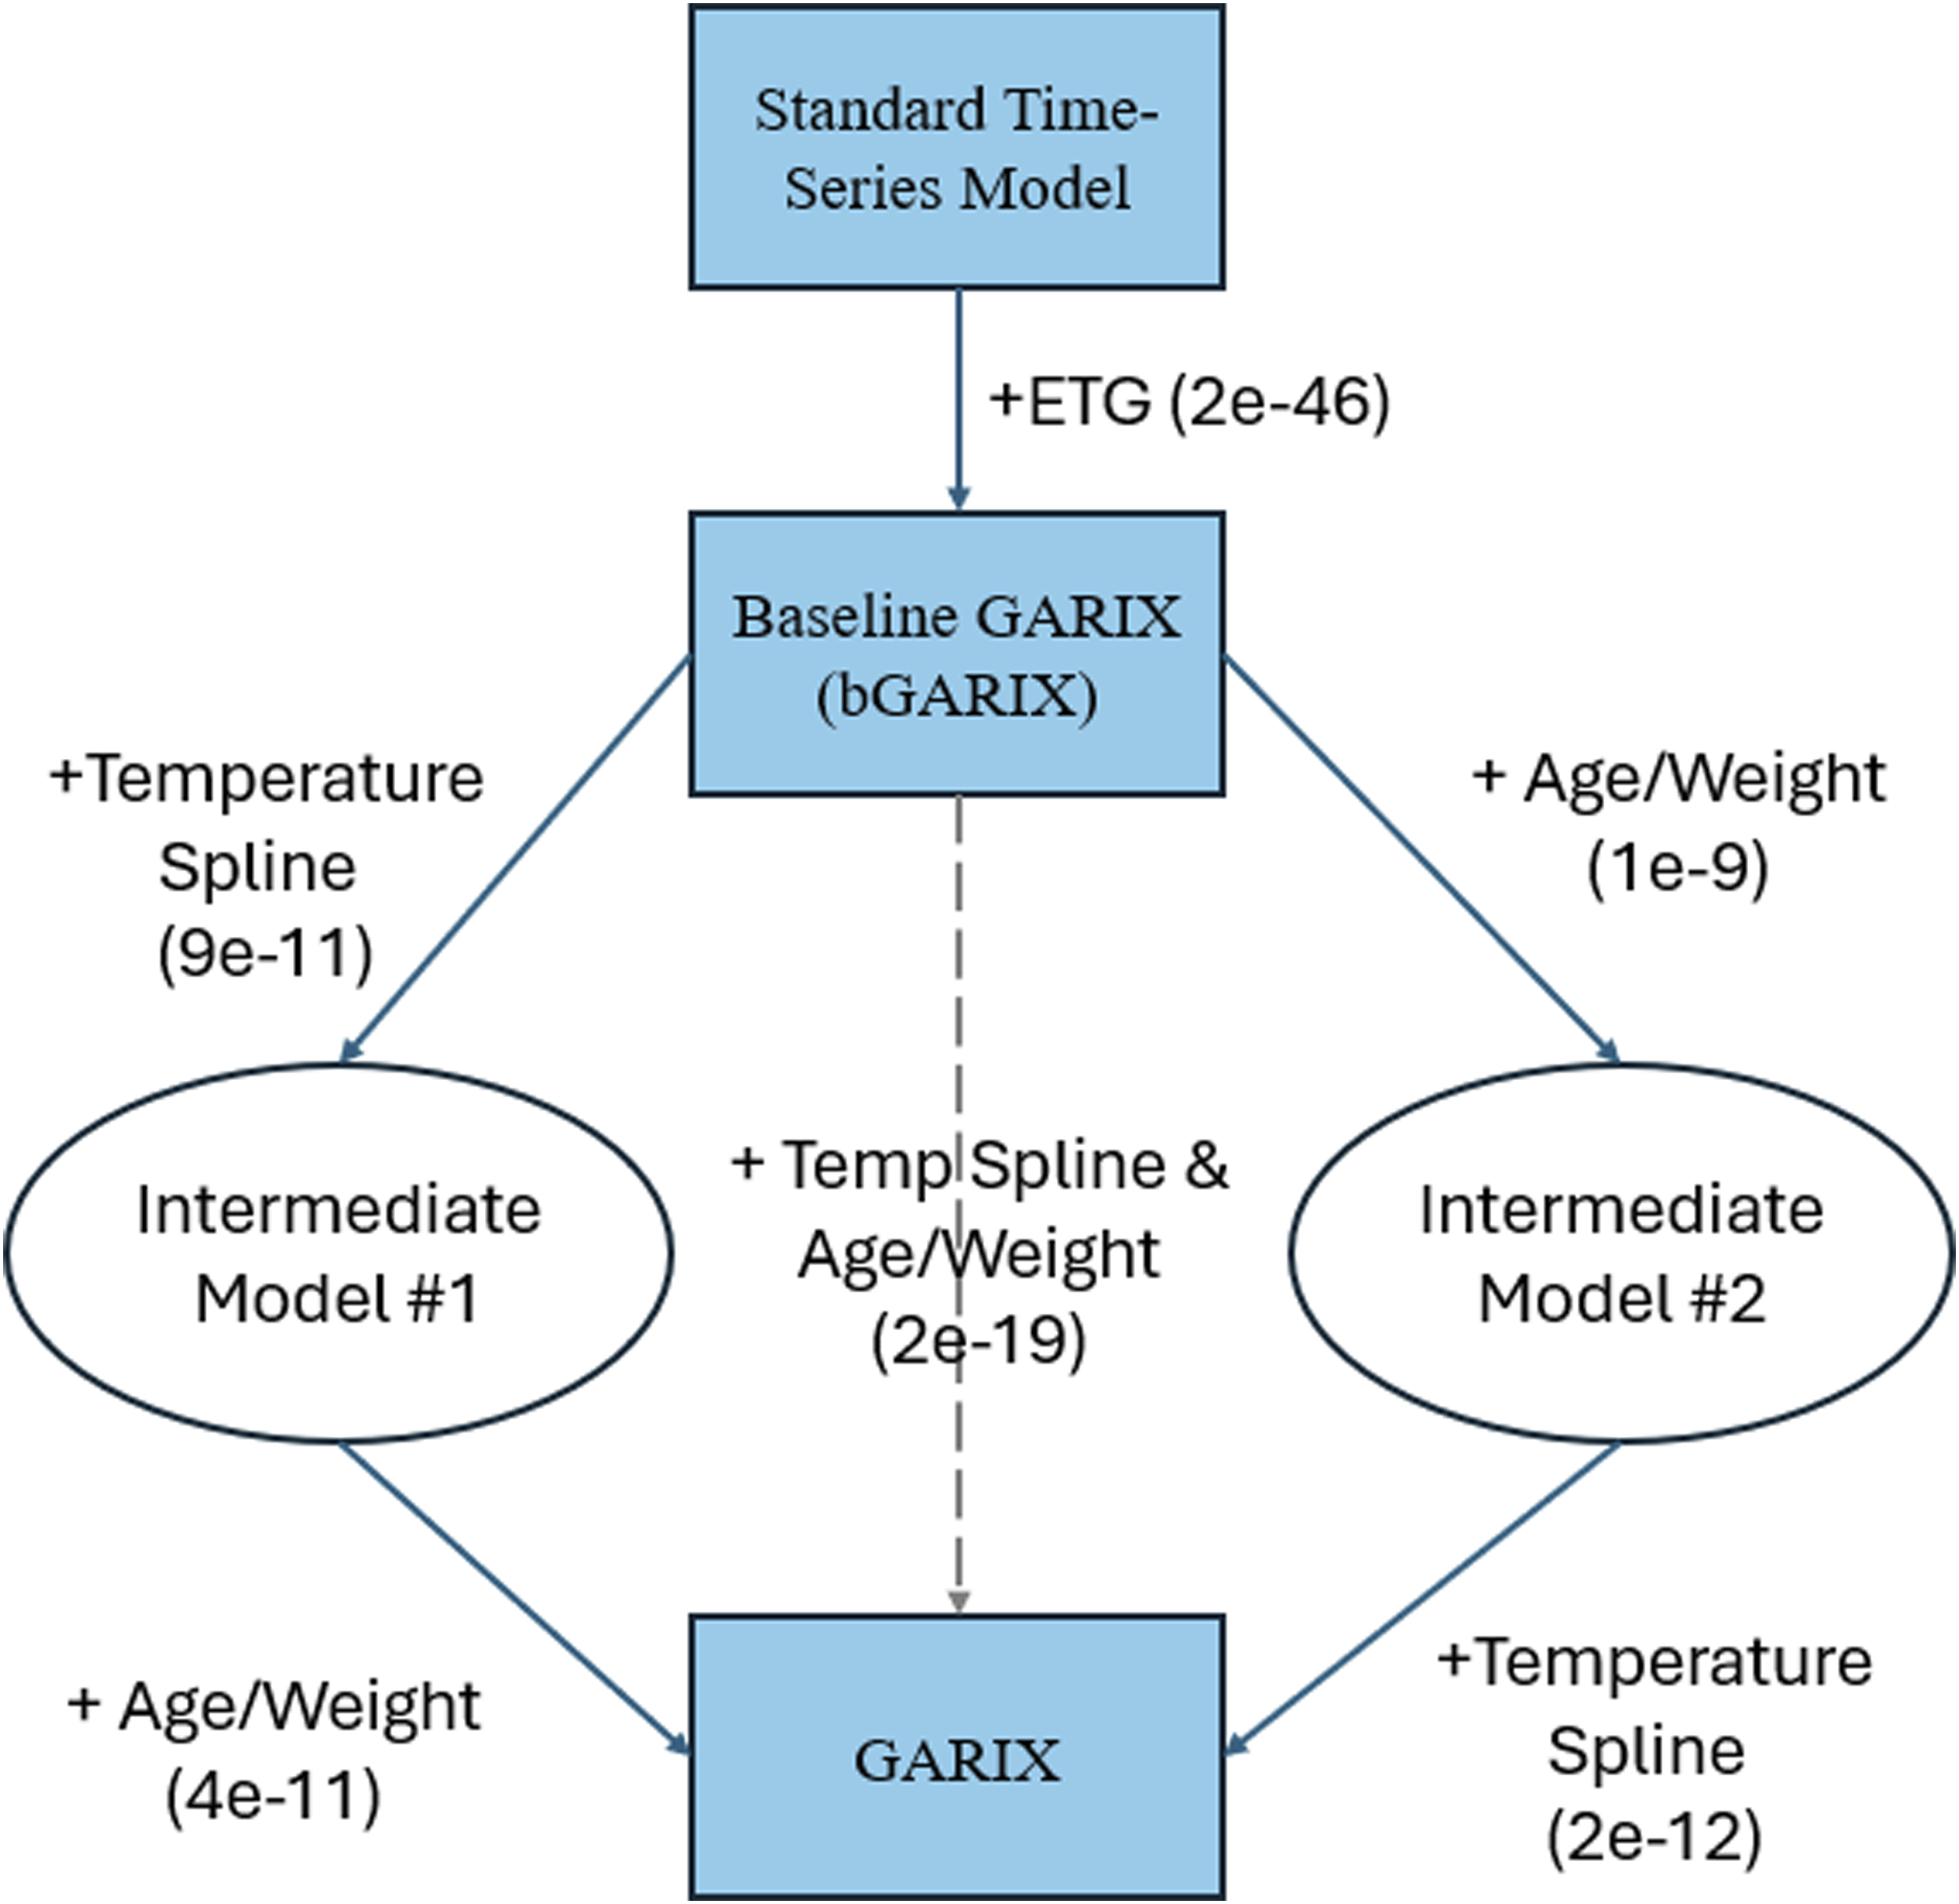
It is worth noting that adding gender to the oxygen demand model (as an intercept modifier, similar to age and weight in GARIX) did not improve either bGARIX (p = 0.8) or GARIX (p = 0.5), suggesting that important gender differences are absorbed into the indexing operation, where oxygen delivery (DO2i), consumption (VO2i) and demand (tVO2i) are normalised by the body surface area (BSA) (Supplemental Material B).
Variable importance analysis
PVI for history, future and equilibrium term groups are 5.9% +/− 0.4%, 5.8% +/− 0.3% and 1.4% +/− 0.1%, respectively. ETG makes the smallest contribution of the three to the overall predictive power of GARIX, though this contribution is still statistically significant based on the bootstrapped confidence interval, as well as the likelihood ratio test (Figure 5).
Timescale of adaptations
Figure 6A shows the predicted OER trajectories – using deterministic simulations – following step changes in CI, Hb, and Temp, each designed to shift the steady-state OER from 0.22 to 0.17. (We excluded SaO2 from this analysis, since its final value would have to be above 100%, which is invalid.) These simulations reveal clear differences in the timescale of adaptation: temperature-induced changes in OER are rapid and approach the new equilibrium within minutes, whereas responses to changes in CI and Hb evolve more slowly, requiring tens of minutes to stabilise.
Figure 6B extends this analysis by comparing GARIX-based stochastic simulations to Fox82. 3 When using the Fox82 protocol with only 10 min between CI transitions, the simulated VO2i–CI curve fits a hyperbolic form closely resembling the original experimental results. (Table 2 compares the parameter fits between Fox82 experiments and GARIX simulations, indicating good agreement despite differences in age cohorts). Increasing the equilibration period to 100 min in GARIX simulations produces a sharper inflection, approaching the piecewise-linear shape expected under the assumption of supply-independent consumption at high flows. An asymptotic curve, constructed by computing steady-state VO2i at each CI level, provides an upper envelope corresponding to complete equilibration. These findings explain an apparent contradiction highlighted in Figure 3 (panels D and F): although most OER values in the dataset are well below saturation levels (panel D), the VO2i–DO2i (panel F) shows no plateau or evidence of a supply-independent regime. GARIX resolves this by showing that short-term OER dynamics – governed by autoregressive and delivery-driven terms – can obscure the underlying demand unless sufficient time is allowed for equilibration. Thus, the absence of a plateau in observed data does not imply unlimited consumption but rather reflects the dominance of dynamic adaptation within typical clinical timescales.
Comment
Summary of contributions
This work introduces and validates the GARIX model for inferring oxygen extraction dynamics and latent oxygen demand from high-resolution CPB data. Variable importance analysis confirms that dynamic terms, i.e., lagged changes in OER and exogenous variables (CI, Hb, SaO2 and Temp) as well as intended changes in the latter, account for most of the model’s predictive power.
ETG, which encodes the body’s effort to restore balance between oxygen consumption and demand, is akin to a cointegration or error-correction mechanism 10 : the model presumes the existence of a long-run equilibrium relationship (between VO2i and temperature-dependent tVO2i), and introduces a corrective term that nudges the system back to this equilibrium when deviations occur. The presence of a statistically significant equilibrium coefficient supports this interpretation, affirming the plausibility of GARIX as both a physiological and mathematical construct. Also, the fact that ETG contributes significantly less to predictive performance than ATG and XTG highlights the criticality of a large, high-resolution dataset such as ours for reliable estimation of oxygen demand parameters from intraoperative data.
The statistically significant improvement in model fit from bGARIX to GARIX represents a two-step improvement in the modelling of oxygen demand. First, while bGARIX adopts a classical van’t Hoff specification with constant Q10, GARIX replaces the linear dependence on temperature with a spline, allowing for non-constant Q10 values that vary across the observed temperature range. Second, the intercept of the oxygen demand function is allowed to vary with patient age and weight (both on a logarithmic scale), and their interaction, thus capturing known physiological heterogeneity across the paediatric population. These refinements are grounded in empirical necessity: the constant-Q10 model is derived from sparse experimental data; for instance, Fox et al’s estimate of 2.4 for Q10 3 is based on only two temperature points, one at 20°C (human experiments) and one at 37°C (animal experiments).4–6 Textbook models also do not account for the developmental differences in metabolic rate throughout childhood. Likelihood ratio tests confirmed that both the spline and the age-weight interaction terms significantly improve model fit.
The physiological plausibility of the GARIX model is reinforced by several findings. The signs and decay patterns of lagged coefficients are plausible as components of an adaptive mechanism: Increases in oxygen delivery (via CI or Hb) yield compensatory reductions in OER, and autoregressive terms exhibit negative feedback consistent with system stabilisation. The spline-estimated oxygen demand rises monotonically with temperature, and the Q10 estimate from bGARIX (2.5) is close to the textbook values of 2.4–2.7. 2 Together, these results suggest that the GARIX model is a physiologically plausible framework for understanding, predicting and influencing paediatric oxygenation during CPB.
The markedly faster OER adaptation to shifts in body‐temperature versus CI and Hb (Figure 6A) likely reflects a demand-side mechanism: metabolic rate follows Q10 kinetics almost instantaneously, so extraction must adjust in lock-step. By contrast, CI and Hb perturbations act on the supply side; they require detection of change in the partial pressure of oxygen is the tissue, release of vasodilators, and capillary recruitment before extraction can change, introducing delays of several minutes.
Assumptions and limitations
Several assumptions underlie GARIX. First, it adopts a generalised additive framework with selective nonlinearities. A temperature spline term was used in the ETG for flexible modelling of the dependence of the logarithm of oxygen demand on temperature. Interaction term between age and weight improved flexibility of modelling the changes during developmental stages. We also used log and logit transformation to better align variable distributions with the underlying assumption of a linear model.
The choice of a – mostly – linear model was deliberate, prioritising transparency and interpretability in a clinical context. While non-linear models may improve predictive accuracy, they often obscure the explainability afforded by a linear formulation. However, linearity may limit the model’s ability to capture more complex or threshold-based physiological responses.
A particular example is OER itself. Although the logit transformation in GARIX moderates the rate at which predicted OER approaches its extreme bounds of 0 or 1, no additional physiological constraints are imposed within the model. In clinical physiology, there is evidence that OER rarely exceeds a critical threshold – often cited around 0.5–0.7 – beyond which tissue hypoxia and organ injury become likely. 11 We chose not to hard-code such a constraint in GARIX because most of our data lay well within the safe operating range (Figure 3D), and the model therefore lacked sufficient examples in the high-OER regime to reliably learn or validate behaviour near this physiological limit.
Second, we assume homoscedasticity – that the variance of residuals remains constant across the range of fitted values. In reality, physiological variability is likely state-dependent. Our residual diagnostics reveal some heteroscedasticity (Supplemental Material E), with residual variance influenced by past changes in state variables, particularly OER itself. Additionally, the residuals may exhibit correlation due to the hierarchical structure in the data: multiple observations are nested within operations, which are in turn nested within patients (undergoing multiple CPB operations). Such grouping induces intra-operation and intra-patient dependencies that violate the assumption of independent errors. While our inclusion of patient attributes in ETG partially addresses these correlations, a more rigorous approach could involve multilevel or mixed-effects modelling, which would allow for random intercepts or slopes at the operation and patient levels. Incorporating such structure could yield more accurate uncertainty estimates and further improve model generalisability across patient populations.
Third, the GARIX model does not account for the contribution of dissolved oxygen to total arterial oxygen content. This simplification is reasonable in most clinical scenarios, as dissolved oxygen constitutes only a small fraction of the total oxygen content of blood (approximately 1.6% in our dataset). However, its omission may affect accuracy at high PaO2 levels.
Fourth, this is a single-centre retrospective study, conducted using data from the Great Ormond Street Hospital for Children. Although this ensures consistency in data acquisition and clinical practice, it may limit generalisability to other institutions with different perfusion protocols or patient demographics.
Fifth, the model treats key exogenous variables - Hb, CI, SaO2, and Temp - as fully and instantaneously controllable by the perfusionist. In practice, these variables are only partially exogenous. For instance, SaO2 can be influenced by prior changes in PaO2 or tissue oxygenation, and haemoglobin is influenced via transfusions and haemodilution. Although the assumption of perfect exogeneity is a useful abstraction for minute-level modelling, future versions – especially if used in perfusion control – should incorporate more realistic assumptions.
Finally, as with all parametric models, GARIX is vulnerable to extrapolation risk, e.g. when system variables lie outside the training distribution or approach the low-density areas (Figure 3). Moreover, the fitted coefficients reflect average responses in the observed data range and may not generalise to rare or extreme clinical states, such as deep hypothermic circulatory arrest. Caution is therefore warranted when applying GARIX predictions in unobserved regions of the covariate space.
Future work
This study lays the foundation for several future directions, spanning clinical investigation, data enhancement, methodological development, and practical implementation.
First, the GARIX framework opens the door to deeper clinical analyses, which are the focus of Part 2 of this series. That manuscript explores how oxygen demand varies across age and weight, how temperature affects metabolism beyond the constant-Q10 assumption, and how OER adaptation to dynamic changes in perfusion varies across age groups. These insights point to the need for more individualised perfusion strategies, informed by both developmental stage and temperature regime.
Second, the GARIX model may serve as a quantitative tool for exploring the relationship between intraoperative oxygenation dynamics and postoperative outcomes such as acute kidney injury (AKI). By comparing observed oxygen consumption to GARIX-predicted demand trajectories, one could identify periods of over- or under-oxygenation and evaluate their prognostic value in outcome prediction frameworks.
Third, future datasets should aim to expand the scope of GARIX beyond the present single-centre, paediatric context. Applying the model to adult populations and incorporating data from multiple institutions would help validate generalisability and assess performance across diverse surgical practices. Adding measurements of dissolved oxygen content (e.g., via PaO2 and PvO2) would improve fidelity in high-oxygen regimes and enable more complete modelling of oxygen transport dynamics.
Fourth, methodological improvements could further strengthen the GARIX framework. Addressing heteroscedasticity, as noted earlier, would allow the model to better reflect variable physiological noise levels across different perfusion states as well heterogeneity of intraoperative recordings across patients and operations. More flexible modelling approaches, such as machine learning-based time-series models, could uncover nonlinear interactions or latent patterns that a linear specification may miss, though at the expense of interpretability.
Finally, there is potential to transition from prediction to real-time control. GARIX could be embedded within perfusion monitoring systems to flag emerging imbalances between oxygen supply and demand. With additional development, it may serve as the foundation for a reinforcement learning-based perfusion controller that proposes incremental adjustments to flow, temperature, or transfusion strategy. Realising this vision would require a more nuanced treatment of exogenous variables such as Hb and SaO2, incorporating their partial controllability and time-lagged responses to intervention. The model’s internal structure supports this direction: variable importance analysis shows that historical terms (system memory) account for the largest share of predictive power, closely followed by planned interventions. This confirms that OER dynamics are governed not only by the delayed effects of past states but also by immediate clinical actions, highlighting the need for control strategies that account for both lagged adaptation and future-oriented planning. Such dual emphasis aligns with clinical practice and could be formalised in an intelligent control architecture. In this way, GARIX can evolve from a descriptive model of oxygenation into an engine for individualised, real-time decision support and adaptive perfusion control.
Conclusion
In this study, we developed and validated the GARIX model, a physiologically informed time-series framework for predicting changes in OER during CPB. By integrating autoregressive memory, exogenous clinical variables, and an equilibrium force linking oxygen consumption to metabolic demand, GARIX offers a principled and interpretable representation of oxygenation dynamics. Compared to the baseline GARIX (bGARIX) model, GARIX introduces key refinements: non-linear temperature effects and individualised metabolic demand functions based on age and weight. These enhancements yield statistically superior fits and align with established physiological expectations. Our work underscores the value of high-resolution intraoperative data and suggests that latent metabolic demand can be robustly estimated even in dynamic, non-equilibrium settings. This mathematical foundation enables the clinical insights explored in Part 2 and sets the stage for predictive, diagnostic, and potentially even prescriptive applications in GDP.
Supplemental Material
Supplemental Material - Towards goal-directed perfusion – Part I: Developing physiology-inspired mathematical framework using high-resolution paediatric CPB data
Supplemental Material for Towards goal-directed perfusion – Part I: Developing physiology-inspired mathematical framework using high-resolution paediatric CPB data by Mansour T. A. Sharabiani, Alireza S. Mahani, Richard W. Issitt, Yadav Srinivasan, Alex Bottle, Serban Stoica in Perfusion
Footnotes
Declaration of conflicting interests
The authors declared no potential conflicts of interest with respect to the research, authorship, and/or publication of this article.
Funding
RWI was funded by the NIHR GOSH BRC (23HL18).
Supplemental Material
Supplemental material for this article is available online.
References
Supplementary Material
Please find the following supplemental material available below.
For Open Access articles published under a Creative Commons License, all supplemental material carries the same license as the article it is associated with.
For non-Open Access articles published, all supplemental material carries a non-exclusive license, and permission requests for re-use of supplemental material or any part of supplemental material shall be sent directly to the copyright owner as specified in the copyright notice associated with the article.