
Abstract
Introduction
Left ventricular distension is a major concern with postcardiotomy veno-arterial extracorporeal membrane oxygenation (VA-ECMO) supporting a critical heart failure after cardiac surgery. This porcine study evaluates the effects of left ventricular venting on cardiac function during ECMO-supported circulation and after weaning from ECMO.
Methods
Twenty anaesthetised open-chest pigs were put on cardiopulmonary bypass with aortic cross-clamping and suboptimal cardioplegic arrest for 40 min. After declamping and defibrillation, the animals were supported by VA-ECMO for 180 min either with or without additional left ventricular venting. Continuous haemodynamic evaluations were performed at baseline and at cardiac arrest, during VA-ECMO and for 120 min after weaning from circulatory support. Left ventricular perfusion and function were evaluated with microspheres, pressure-volume loops and epicardial echocardiography at baseline and after 1 and 2 h with unsupported circulation.
Results
In vented animals both mean aortic and left ventricular peak systolic pressure increased at the end of the ECMO-supported period compared to those not vented and remained increased also after weaning. Both at 60 min and 120 min after weaning from circulatory support, left ventricular stroke work and pressure-volume area were increased in vented compared to not vented animals. At 120 min left ventricular stroke volume was increased in vented compared to not vented animals, myocardial perfusion did not differ. The left ventricular mechanical efficiency, defined as the ratio between pressure volume area and myocardial perfusion, was increased (53.2 ± 5 vs 36.2 ± 2.1 J/mL/g, p = 0.011) in vented- compared to not vented hearts.
Conclusion
This experimental study demonstrate that left ventricular venting during post-cardiotomy veno-arterial ECMO for 3 h attenuates deterioration of left ventricular function and haemodynamics early after weaning from circulatory support.
Keywords
Introduction
Veno-arterial extracorporeal membrane oxygenation (VA-ECMO) is used as mechanical circulatory support in critical heart failure and circulatory collapse, including after cardiac surgery with cardiopulmonary bypass (CPB) and cardioplegic arrest. 1 In a poorly contracting left ventricle (LV) an increase in afterload generated by the ECMO circuit may generate high filling pressures and/or distension and cause myocardial injury. Decompression of the LV by a left ventricular vent catheter connected to the venous line of the ECMO circuit may prevent the buildup of high filling pressures.2–5 Experimentally it is demonstrated that LV distention does not always occur in the early hours during postcardiotomy ECMO, even in the presence of a severe ischemic/reperfusion injury and a very poorly contracting myocardium. 6 It has been suggested that prophylactic venting of the LV during VA-ECMO may be of benefit to the heart, even in the absence of visible distension.7,8 In the present acute porcine study of post-cardiotomy heart failure, the early haemodynamic and cardiac effects of LV venting during 3 h of ECMO-supported circulation and in the early hours after weaning are evaluated.
Methods
The experiments were approved by the Norwegian State Commission for Laboratory Animals (Project: 201710294) and conducted in accordance with the European Communities Council Directive of 2010 (63/EU). Twenty young pigs (NOROC) of either gender, weighing 56 ± 8 kg (SD), were premedicated and anaesthetized as earlier described (see online supplement for details). 9
Instrumentation
A pulse oximeter was applied to the tail, and temperature monitored by a rectal thermometer. A urinary catheter was introduced via a cystotomy measuring diuresis. The right external iliac artery and the left external iliac vein were cannulated (6 Fr Radifocus Introducer II, Terumo Europe, Leuven, Belgium), and Heparin 125 IU/kg administered IV to prevent clotting of catheters. Median sternotomy and pericardiotomy were performed. A pressure catheter (MPC-500, Millar Instruments, Houston, TX, United States) was inserted into the proximal aorta through the left internal mammary artery. A continuous cardiac output catheter (CCO/EDV 177HF75, Edwards Lifesciences Inc, Irwin, CA, United States) was introduced through the left internal mammary vein and floated into the pulmonary artery, for monitoring of cardiac output (CO), central venous- (CVP) and pulmonary artery pressures (PAP) (Vigilance II® and TruWave®, Edwards Life Sciences Inc). A pressure-conductance catheter (CA71083-PL, CD Leycom, Hengelo, The Netherlands) was introduced into the left ventricle (LV) via the apex and connected to a Sigma-M signal conditioner (CD Leycom). A tourniquet around the inferior vena cava allowed brief dynamic preload reductions. An infant feeding tube was inserted into the left atrium via the auricle for microsphere injections, and a transit-time flowmeter (CM4000, Medistim, Oslo, Norway) measured blood flow rate in the proximal left anterior descending coronary artery (LAD) with a 3 mm perivascular probe. Continuous recording, digitising and analysis of haemodynamic data was performed using Ponemah ACQ-7700 and Physiology Platform v.5.41 (Data Sciences International, St Paul, MN, United States).
Experimental protocol
After stabilization, baseline haemodynamic variables were obtained, in addition to arterial blood gases (OPTI CCA-TS2, OPTI Medical Systems, Atlanta, GA, United States), serum troponin-T (Troponin-T hs, Roche Diagnostics GmbH, Mannheim, Germany) and the first injection of 15 μm fluorescent microspheres (Dye-Trak ‘F’; Triton Technology Inc, San Diego, CA, United States). After pre-oxygenation (100% oxygen flow on the respirator) followed by respirator shut-off in the end-inspirium, LV pressure-volume loops were registered prior to and during a short period of inferior vena cava occlusion. In addition, pressure-volume loops were recorded three times during bolus injection of 5 mL of hypertonic saline (10%) into the pulmonary artery, for calculation of parallel conductance. 10 Epicardial speckle tracking echocardiographic (STE) recordings in the four chamber (4-Ch) long axis and the short axis (SAX) views were obtained and average peak systolic strain analysed (EchoPAC BT203, GE Vingmed Ultrasound) (see online supplemental description).
After baseline registrations, systemic IV Heparin 250 IU/kg was administered. The right external iliac vein and the left external iliac artery were cannulated with heparin-coated 23 Fr venous and 17 Fr arterial ECMO cannulas (HLS™, Maquet Cardiopulmonary GmbH, Rastatt, Germany). The cannulas were connected to a heparin-coated ECMO circuit (PLS Advanced 5.0, Maquet Cardiopulmonary GmbH), primed with Ringer’s acetate and driven by a Maquet Rotaflow ECMO unit (Maquet Cardiopulmonary GmbH). A 16 Fr vent catheter (LivaNova, London, United Kingdom) was introduced into the LV via a second tunnel through the apex, secured with a tourniquet and connected to the venous side of the ECMO circuit with a Y-connector.
After cannulation and introduction of the LV vent, the ECMO unit was used for normo-thermic cardiopulmonary bypass (CPB) with pump flow set to 90 mL/kg/min. The aorta was cross-clamped, and the heart arrested by 500 mL semi-cold crystalloid cardioplegia (St Thomas’ Hospital No. 2) infused into the aortic root. The LV vent catheter was kept clamped during infusion of cardioplegia and throughout 40 min of aortic cross-clamping in all animals. By block randomization in five groups of four animals, the LV vent was opened at aortic declamping in 10 animals (Vented) and remained clamped in 10 (Not vented). At reperfusion electroconversion of ventricular fibrillation was necessary in 19 out of 20 hearts. At regain of spontaneous rhythm, ECMO flow was reduced to 72 mL/kg/min (80% of calculated “full bypass”), as in a realistic clinical ECMO run. 11 The animals were given an additional infusion of Ringer’s acetate with 10 mL/kg/h in addition to bolus doses of 60 mL Ringer’s acetate at signs of imminent suck-down. After 90 min on ECMO, a repeat dose of Heparin 125 IU/kg was given. Arterial blood gases were obtained at start and at 90 and 175 min on ECMO, serum for troponin-T at 175 min. The animals were kept on ECMO for 180 min and weaned. After weaning, Ringer’s acetate was allowed into the venous side of the ECMO circuit, allowing remaining blood to be returned to the animal. With unsupported circulation, arterial blood gases, troponin-T samples, microsphere injections, pressure-volume loops and echocardiographic recordings were obtained after 60 and 120 min. At heart rate above 200 beats/min (supraventricular tachycardia) synchronized electroconversion was performed.
Myocardial, pulmonary and renal tissue samples
The animals were euthanized at 2 h post ECMO with intracardiac saturated KCl. Tissue samples were procured from the subendo-, mid- and subepicardium of the anterior, posterior and septal wall of the LV, from the right ventricle, and from both kidneys. These samples, along with reference blood samples, were weighted, hydrolysed and microspheres filtered. Colours were dissolved from spheres and subsequently quantified by fluorospectrophotometry (RF-5301PC; Shimadzu, Kyoto, Japan). 12 Separate tissue samples of myocardium, kidneys and lung were weighed, dried at 60°C for 3 weeks, reweighed and water content calculated as a fraction of wet weight.
Statistical analysis
Data analysis was performed using SPSS v. 27 (IBM Corp., Armonk, NY, United States) and SigmaPlot v. 14.5 (Systat Software, San Jose, CA, United States). Values are given as mean ± SEM (standard error of the mean) or median (first quartile; third quartile) for variables with normal or skewed distribution, unless otherwise noted. The two groups were compared at Baseline by two-sample Student’s t-test or Wilcoxon-Mann-Whitney test on ranks. Haemodynamic variables during ECMO and after weaning were compared using two-way analysis of variance for repeated measures (RM-ANOVA) (see Supplemental file for details).
Results
One animal in the vented group could not be weaned from ECMO. The myocardial tissue blood flow results analyzed later demonstrated that a severe regional ischaemia had occurred during the baseline evaluation with microspheres. The results are therefore reported for nine animals in the vented group and 10 animals in the non-vented group.
Characteristics at baseline and during CPB with aortic cross-clamp
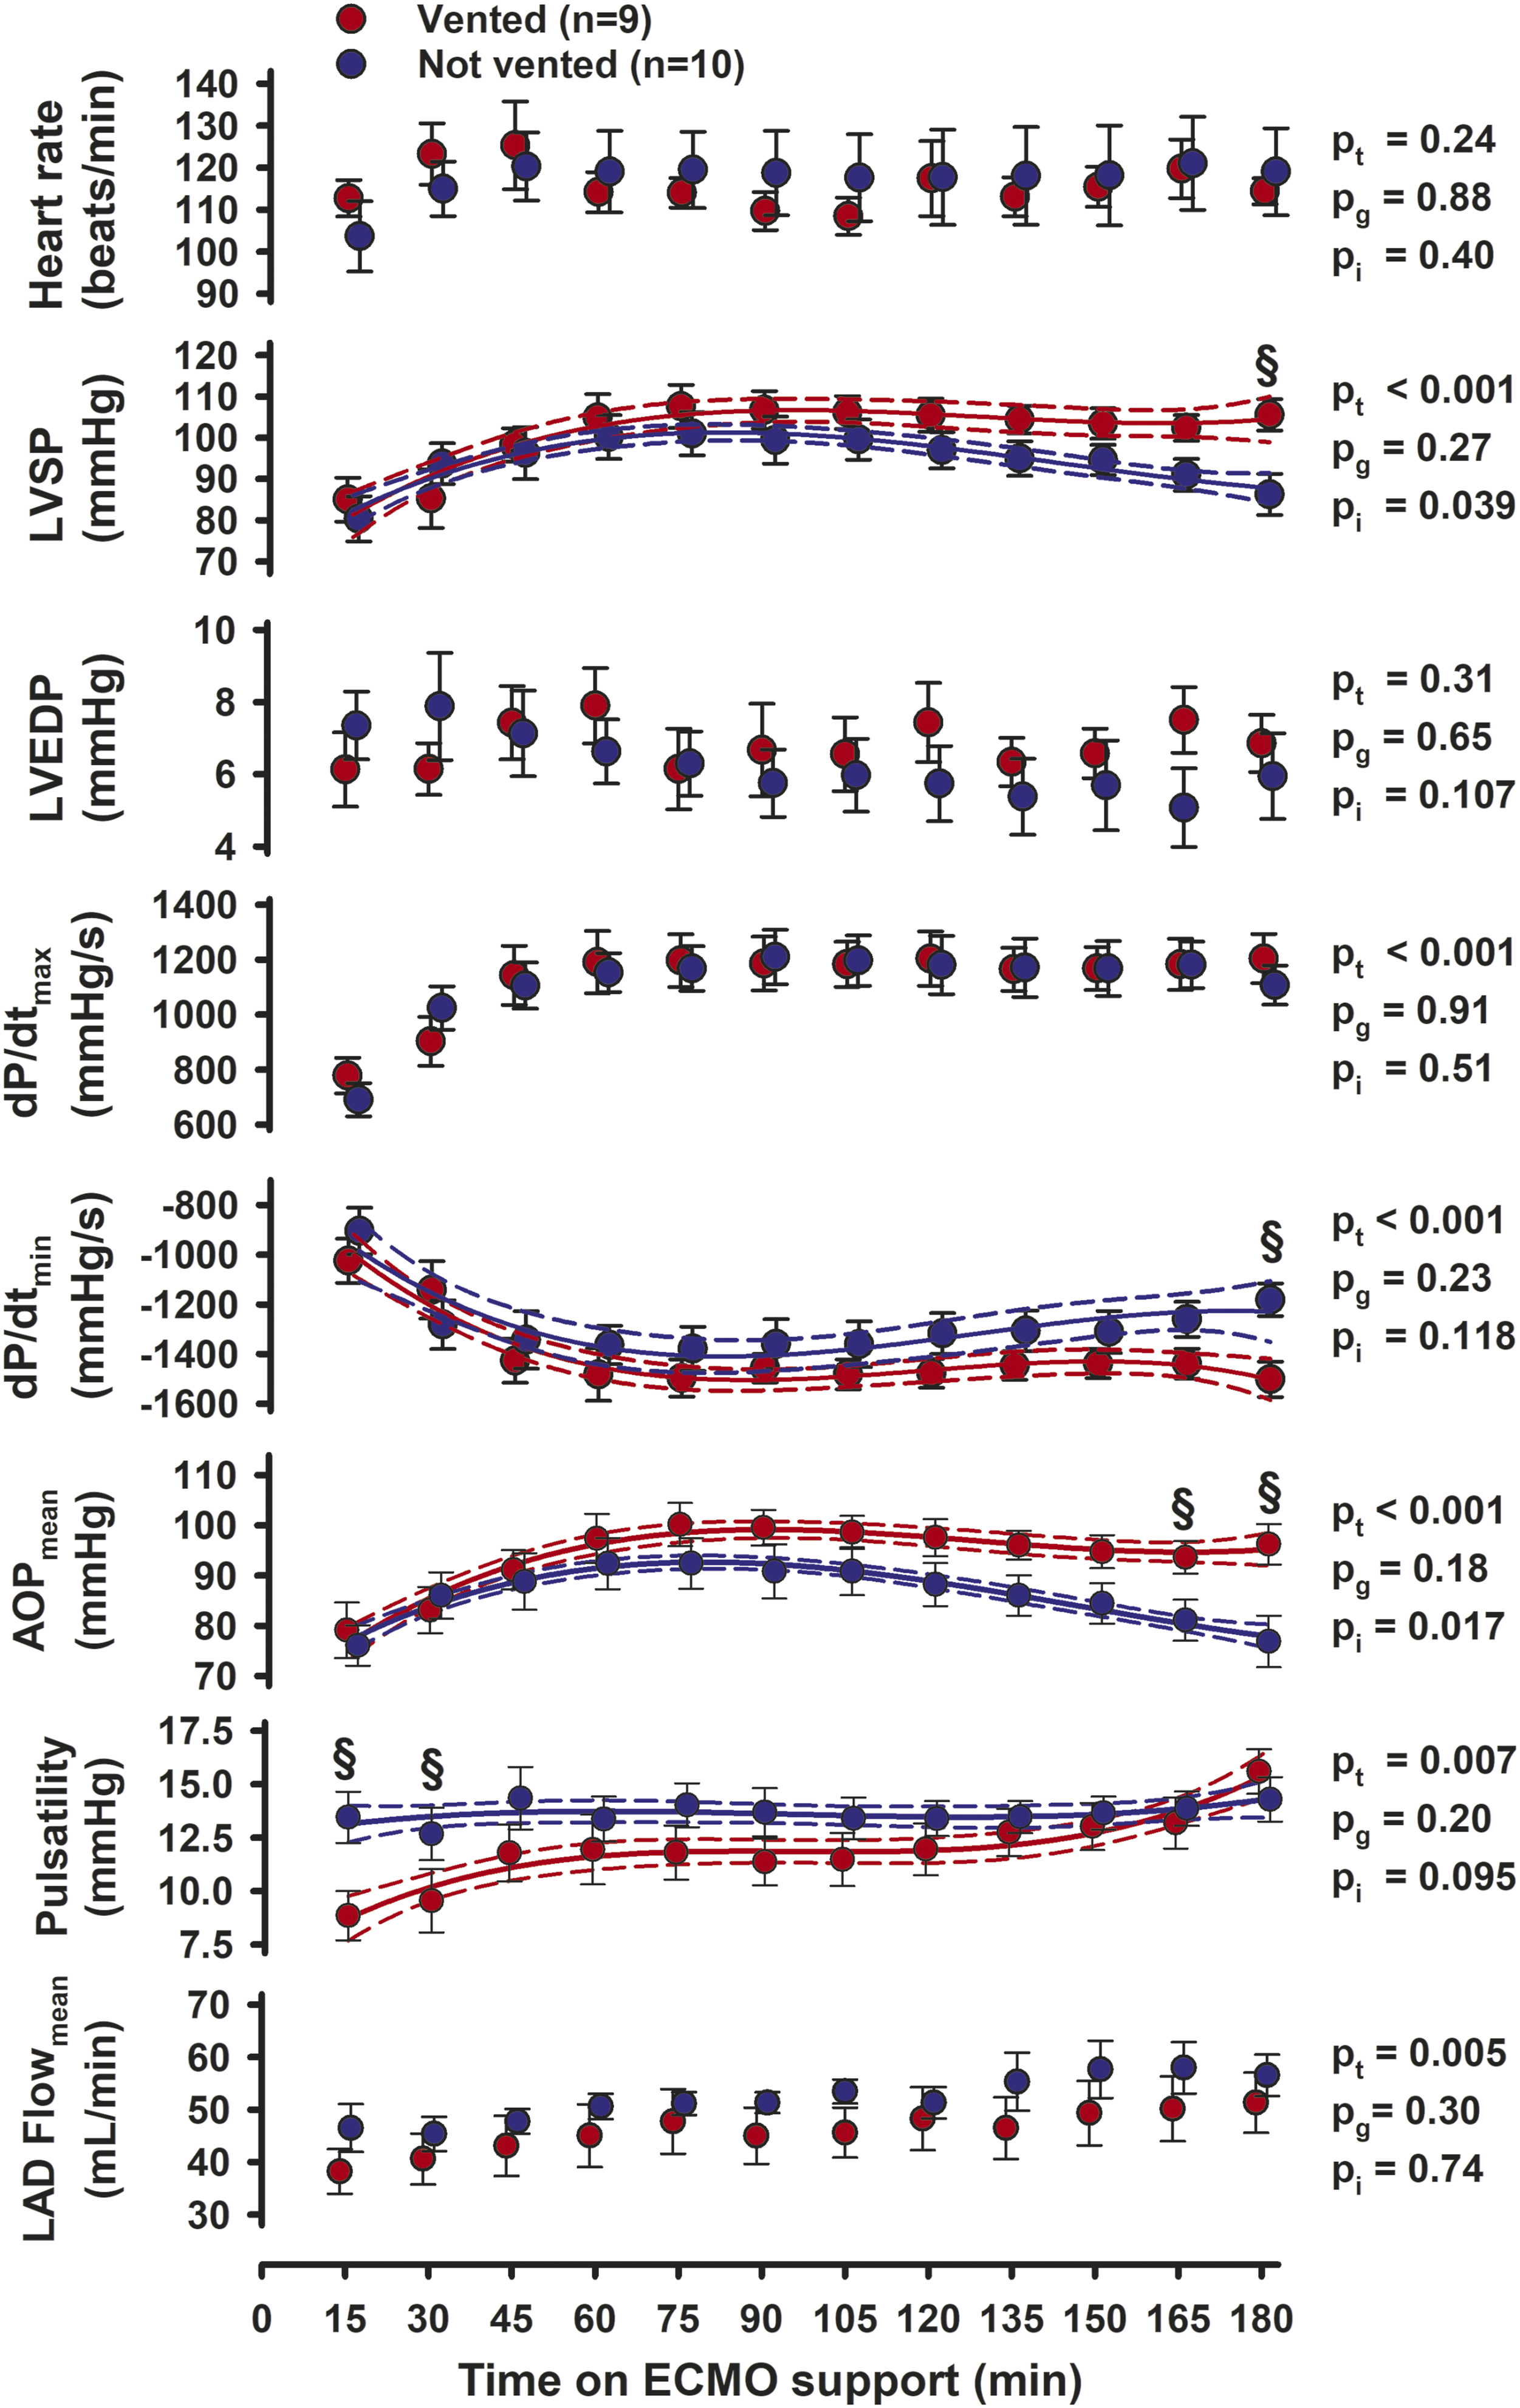
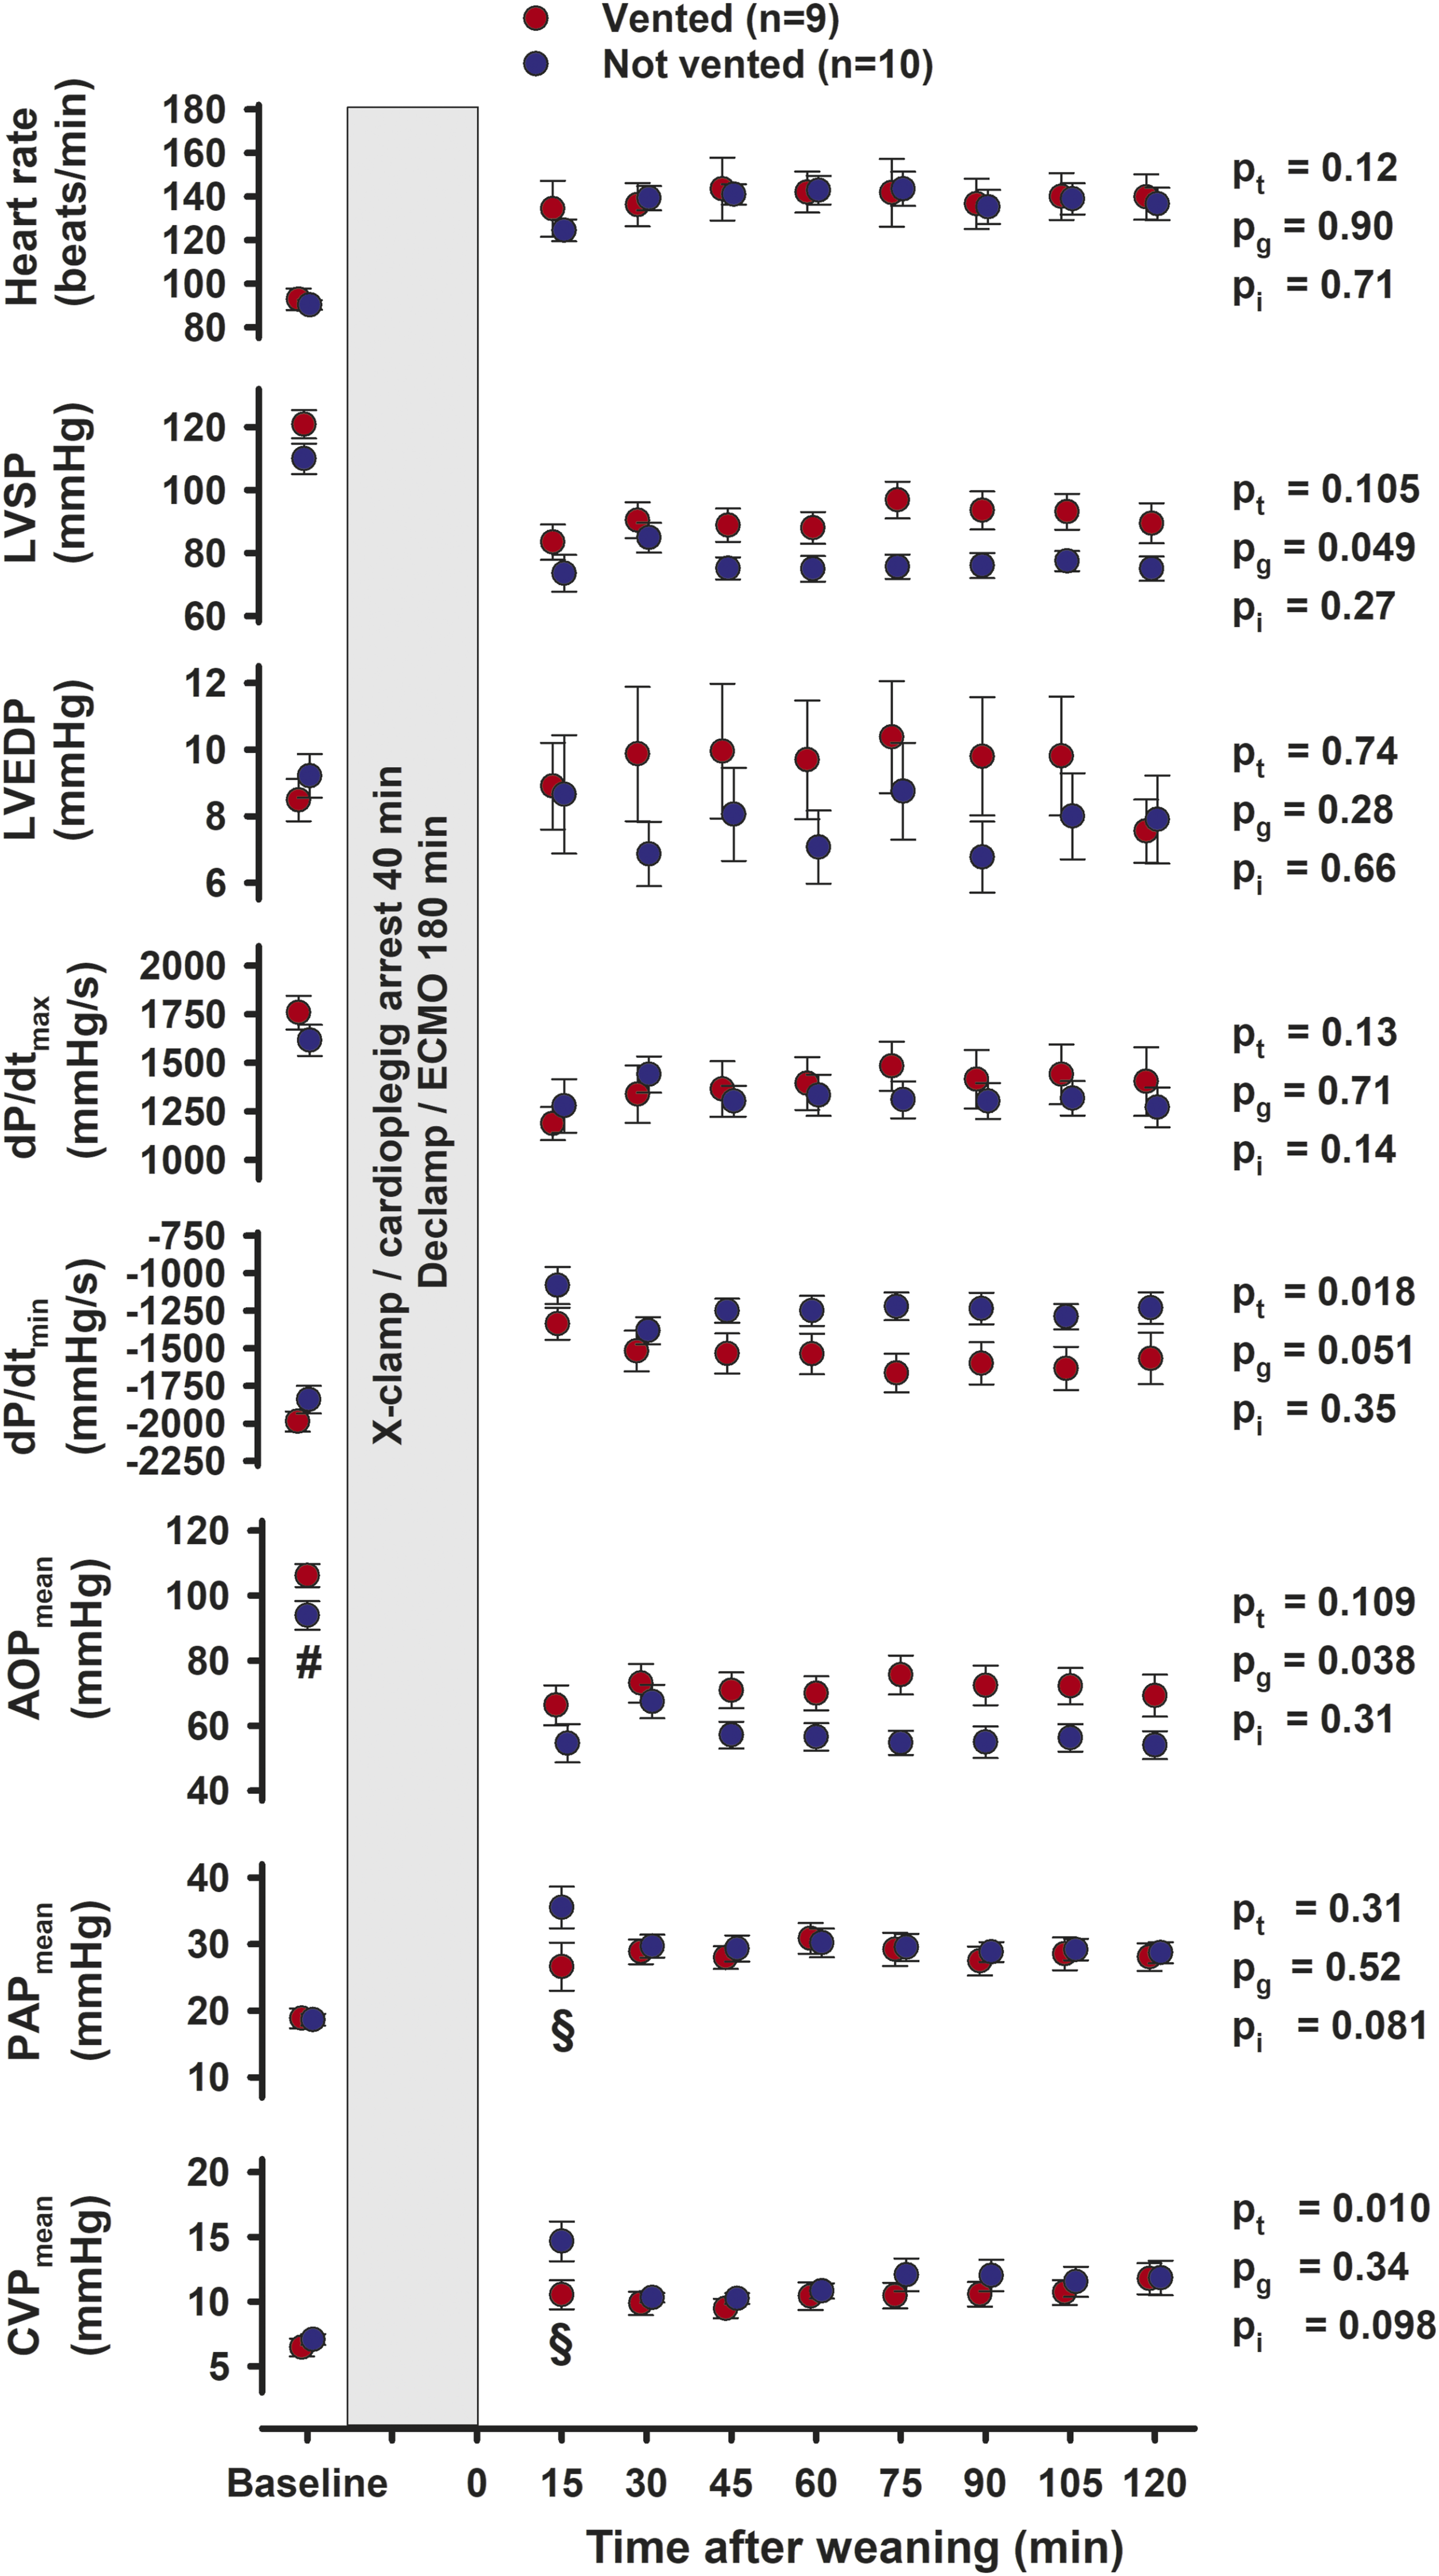
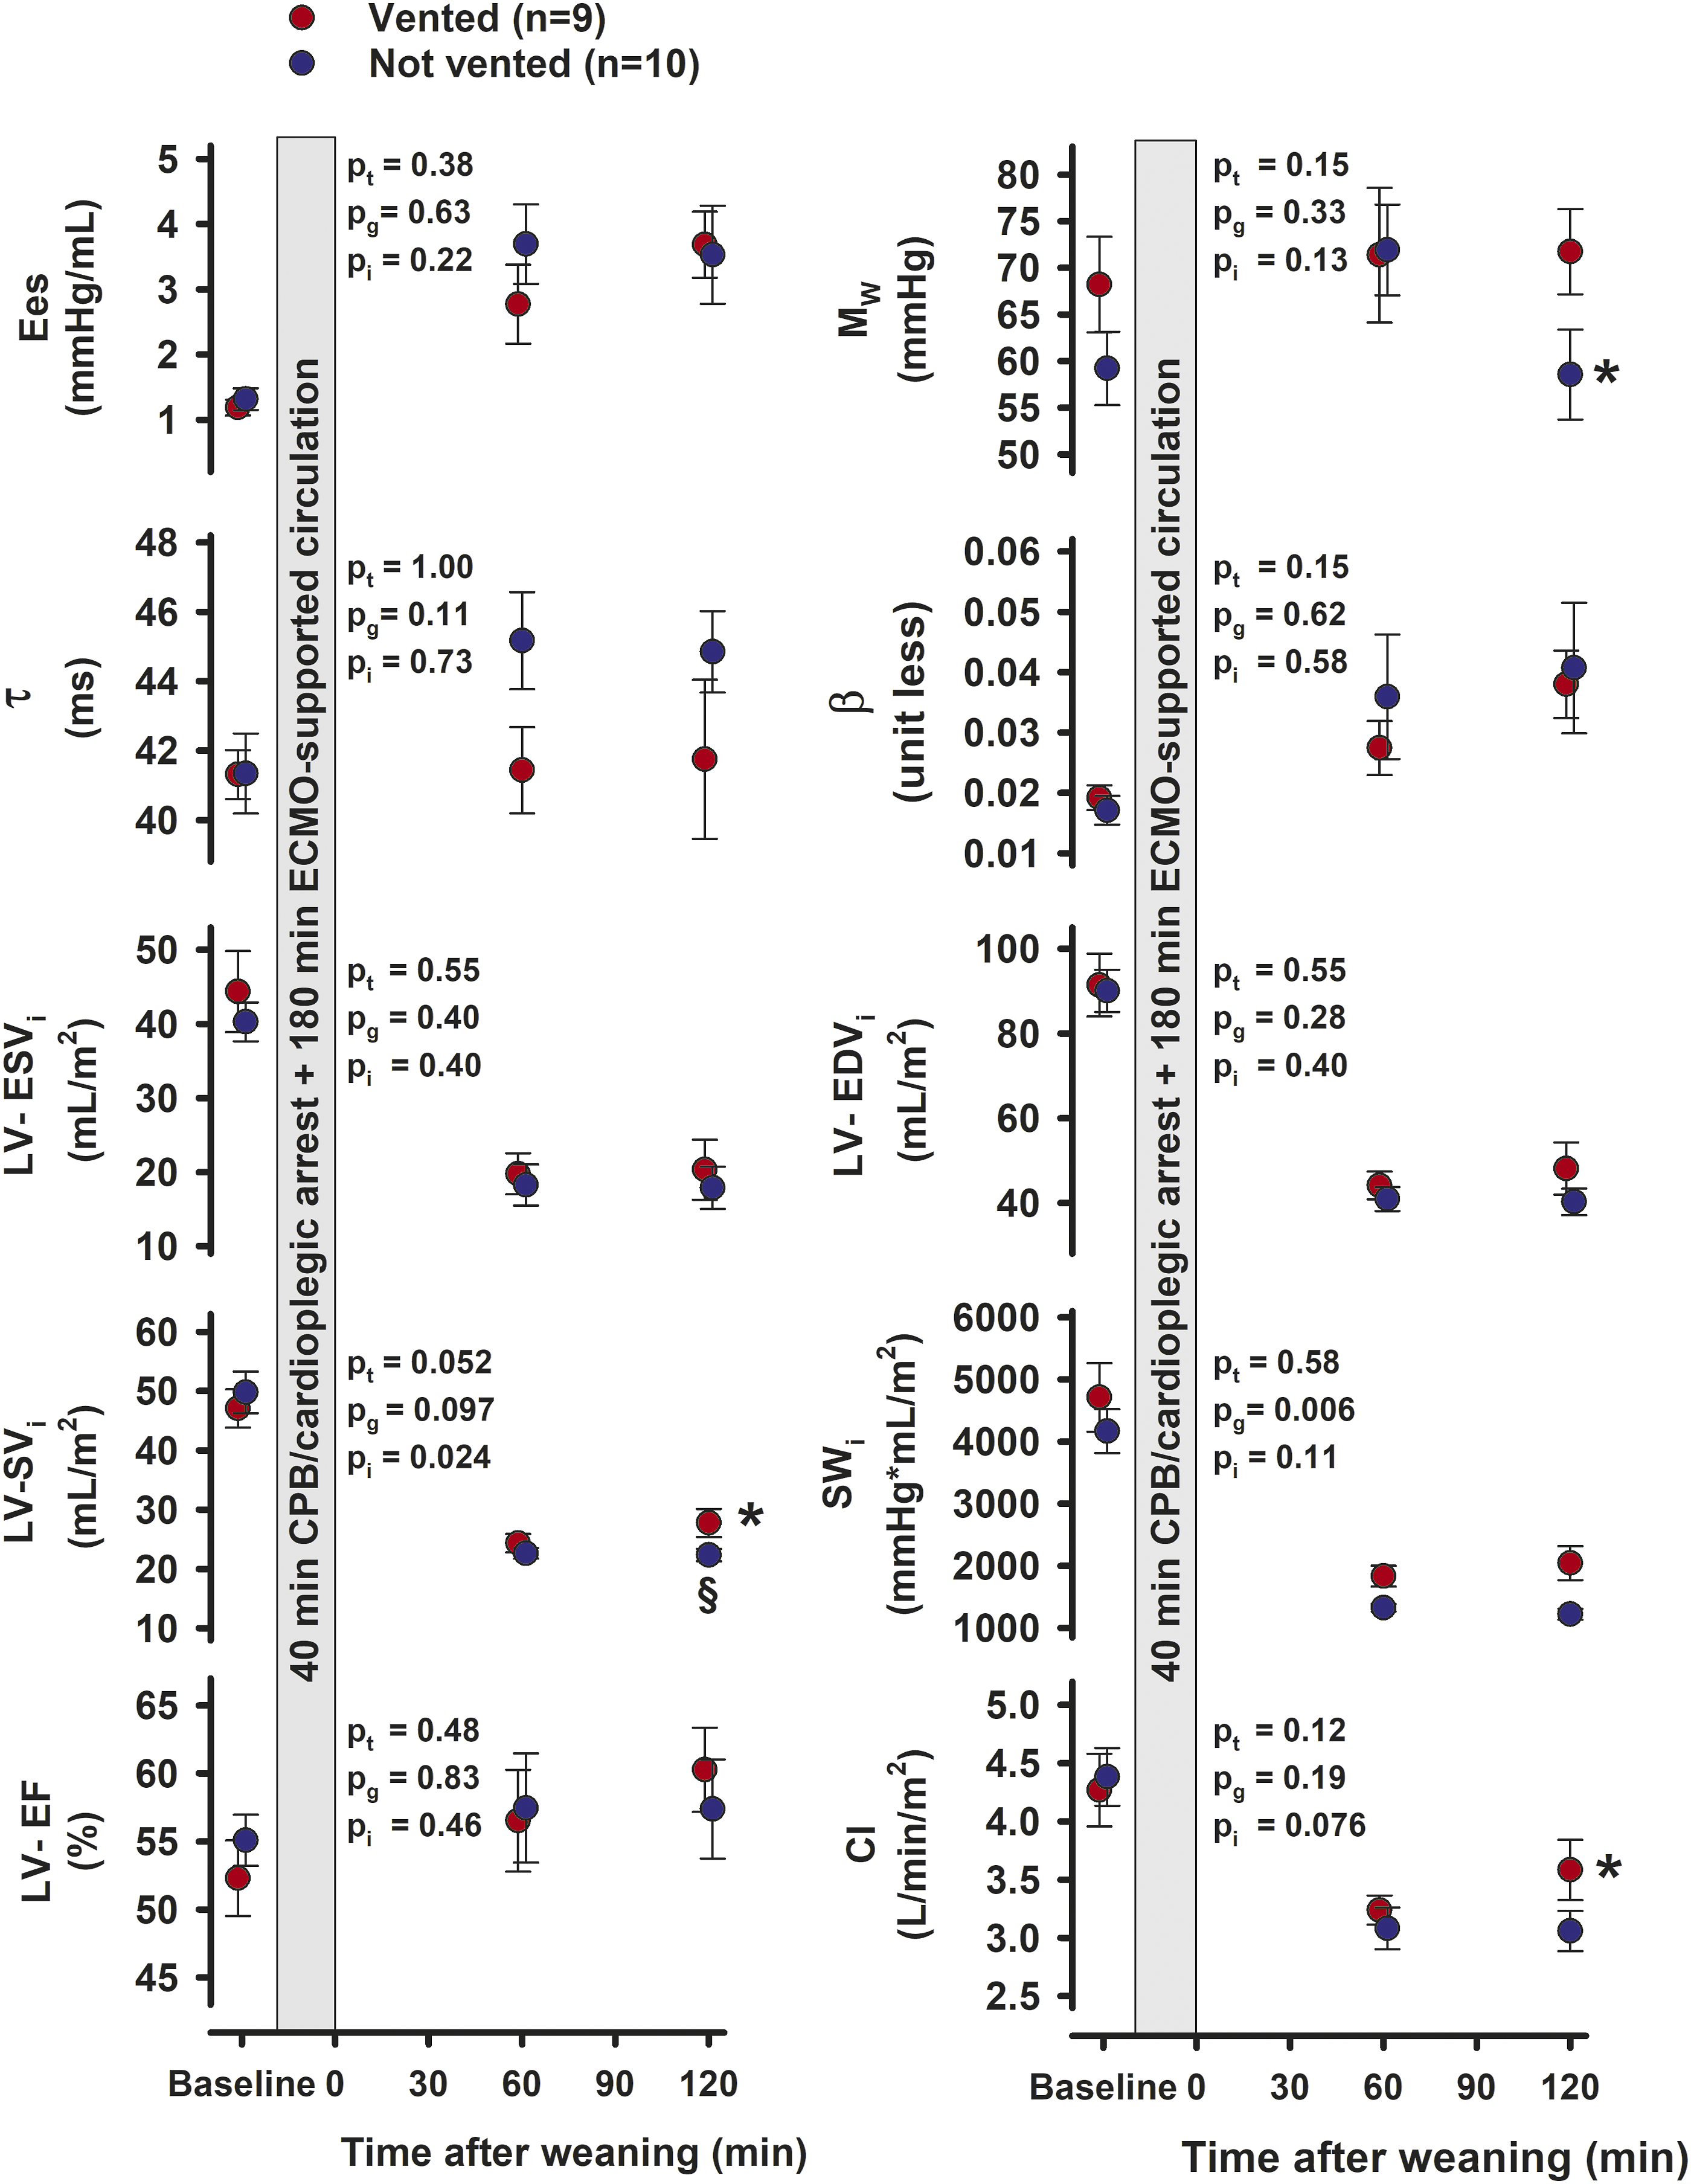
At baseline, the vented group had slightly higher mean aortic pressure (AOPmean), 106 ± 4 mmHg, compared to 94 ± 4 mmHg (p = 0.047) in the not vented group (Figure 3), the rectal temperature was slightly lower. Otherwise, the groups were similar with respect to general haemodynamics, LV function, tissue blood flow rate, blood gases and troponin-T levels (See Figures 3–5 and Supplement Tables C and D). During CPB with aortic cross clamping, the difference in temperature remained (p = 0.046), whereas the difference in AOPmean subsided (Figure 1). Haemodynamic variables during 40 min of aortic crossclamping (X-clamp) and cardioplegic arrest, the left ventricular vent closed in both groups. Values are mean, bars are ± SEM. pt, pg, pi = probabilities for time, group, and interaction by two-way repeated measurement ANOVA; AOP, CVP and PAP = aortic-, central venous- and pulmonary artery pressures; Temprect = rectal temperature. Left ventricular and haemodynamic variables during 180 min of ECMO-supported circulation in 9 pigs with open and 10 pigs with closed left ventricular vent. Values are mean, bars are ± SEM. Polynomial regression line with 95% confidence belts. pt, pg, pi = probabilities for time, group, and interaction by two-way repeated measurement ANOVA. § = significant difference between groups at the same point in time; LVSP and LVEDP = left ventricular peak systolic- and end-diastolic pressure; dP/dtmax and dP/dtmin = peak positive and peak negative first derivative of left ventricular pressure; AOP = aortic pressure; LAD Flow = blood flow rate in the left ventricular descending coronary artery. Left ventricular and haemodynamic variables at Baseline and during 120 min of unsupported cardiac function after weaning from ECMO and removal of left ventricular vent. Values are mean, bars are ± SEM. pt, pg, pi = probabilities for time, group, and interaction by two-way repeated measurement ANOVA. # = significantly difference between groups at Baseline; § = significantly different between groups at the same point in time; LVSP and LVEDP = left ventricular peak systolic- and end-diastolic pressure; dP/dtmax and dP/dtmin = peak positive and peak negative first derivative of left ventricular pressure; AOP, PAP and CVP = aortic-, pulmonary artery and central venous pressures. Left ventricular variables at Baseline and at 60 and 120 min of unsupported cardiac function after weaning from ECMO. Values are mean, bars are ± SEM. pt , pg, pi = probabilities for time, group, and interaction by two-way repeated measurement ANOVA after weaning. * = significantly different from 60 min within the same group; § = significantly different between groups at the same point in time Ees = slope of the end-systolic pressure-volume relation; MW = slope of the stroke work and end-diastolic volume relation; τ = left ventricular relaxation constant; β = the logarithmic end-diastolic pressure-volume relation; LV = left ventricle; i = values indexed by body surface area; ESV and EDV = end-systolic and end-diastolic volume; SV = stroke volume; SW = stroke work; EF = Ejection fraction; CI = Cardiac Index.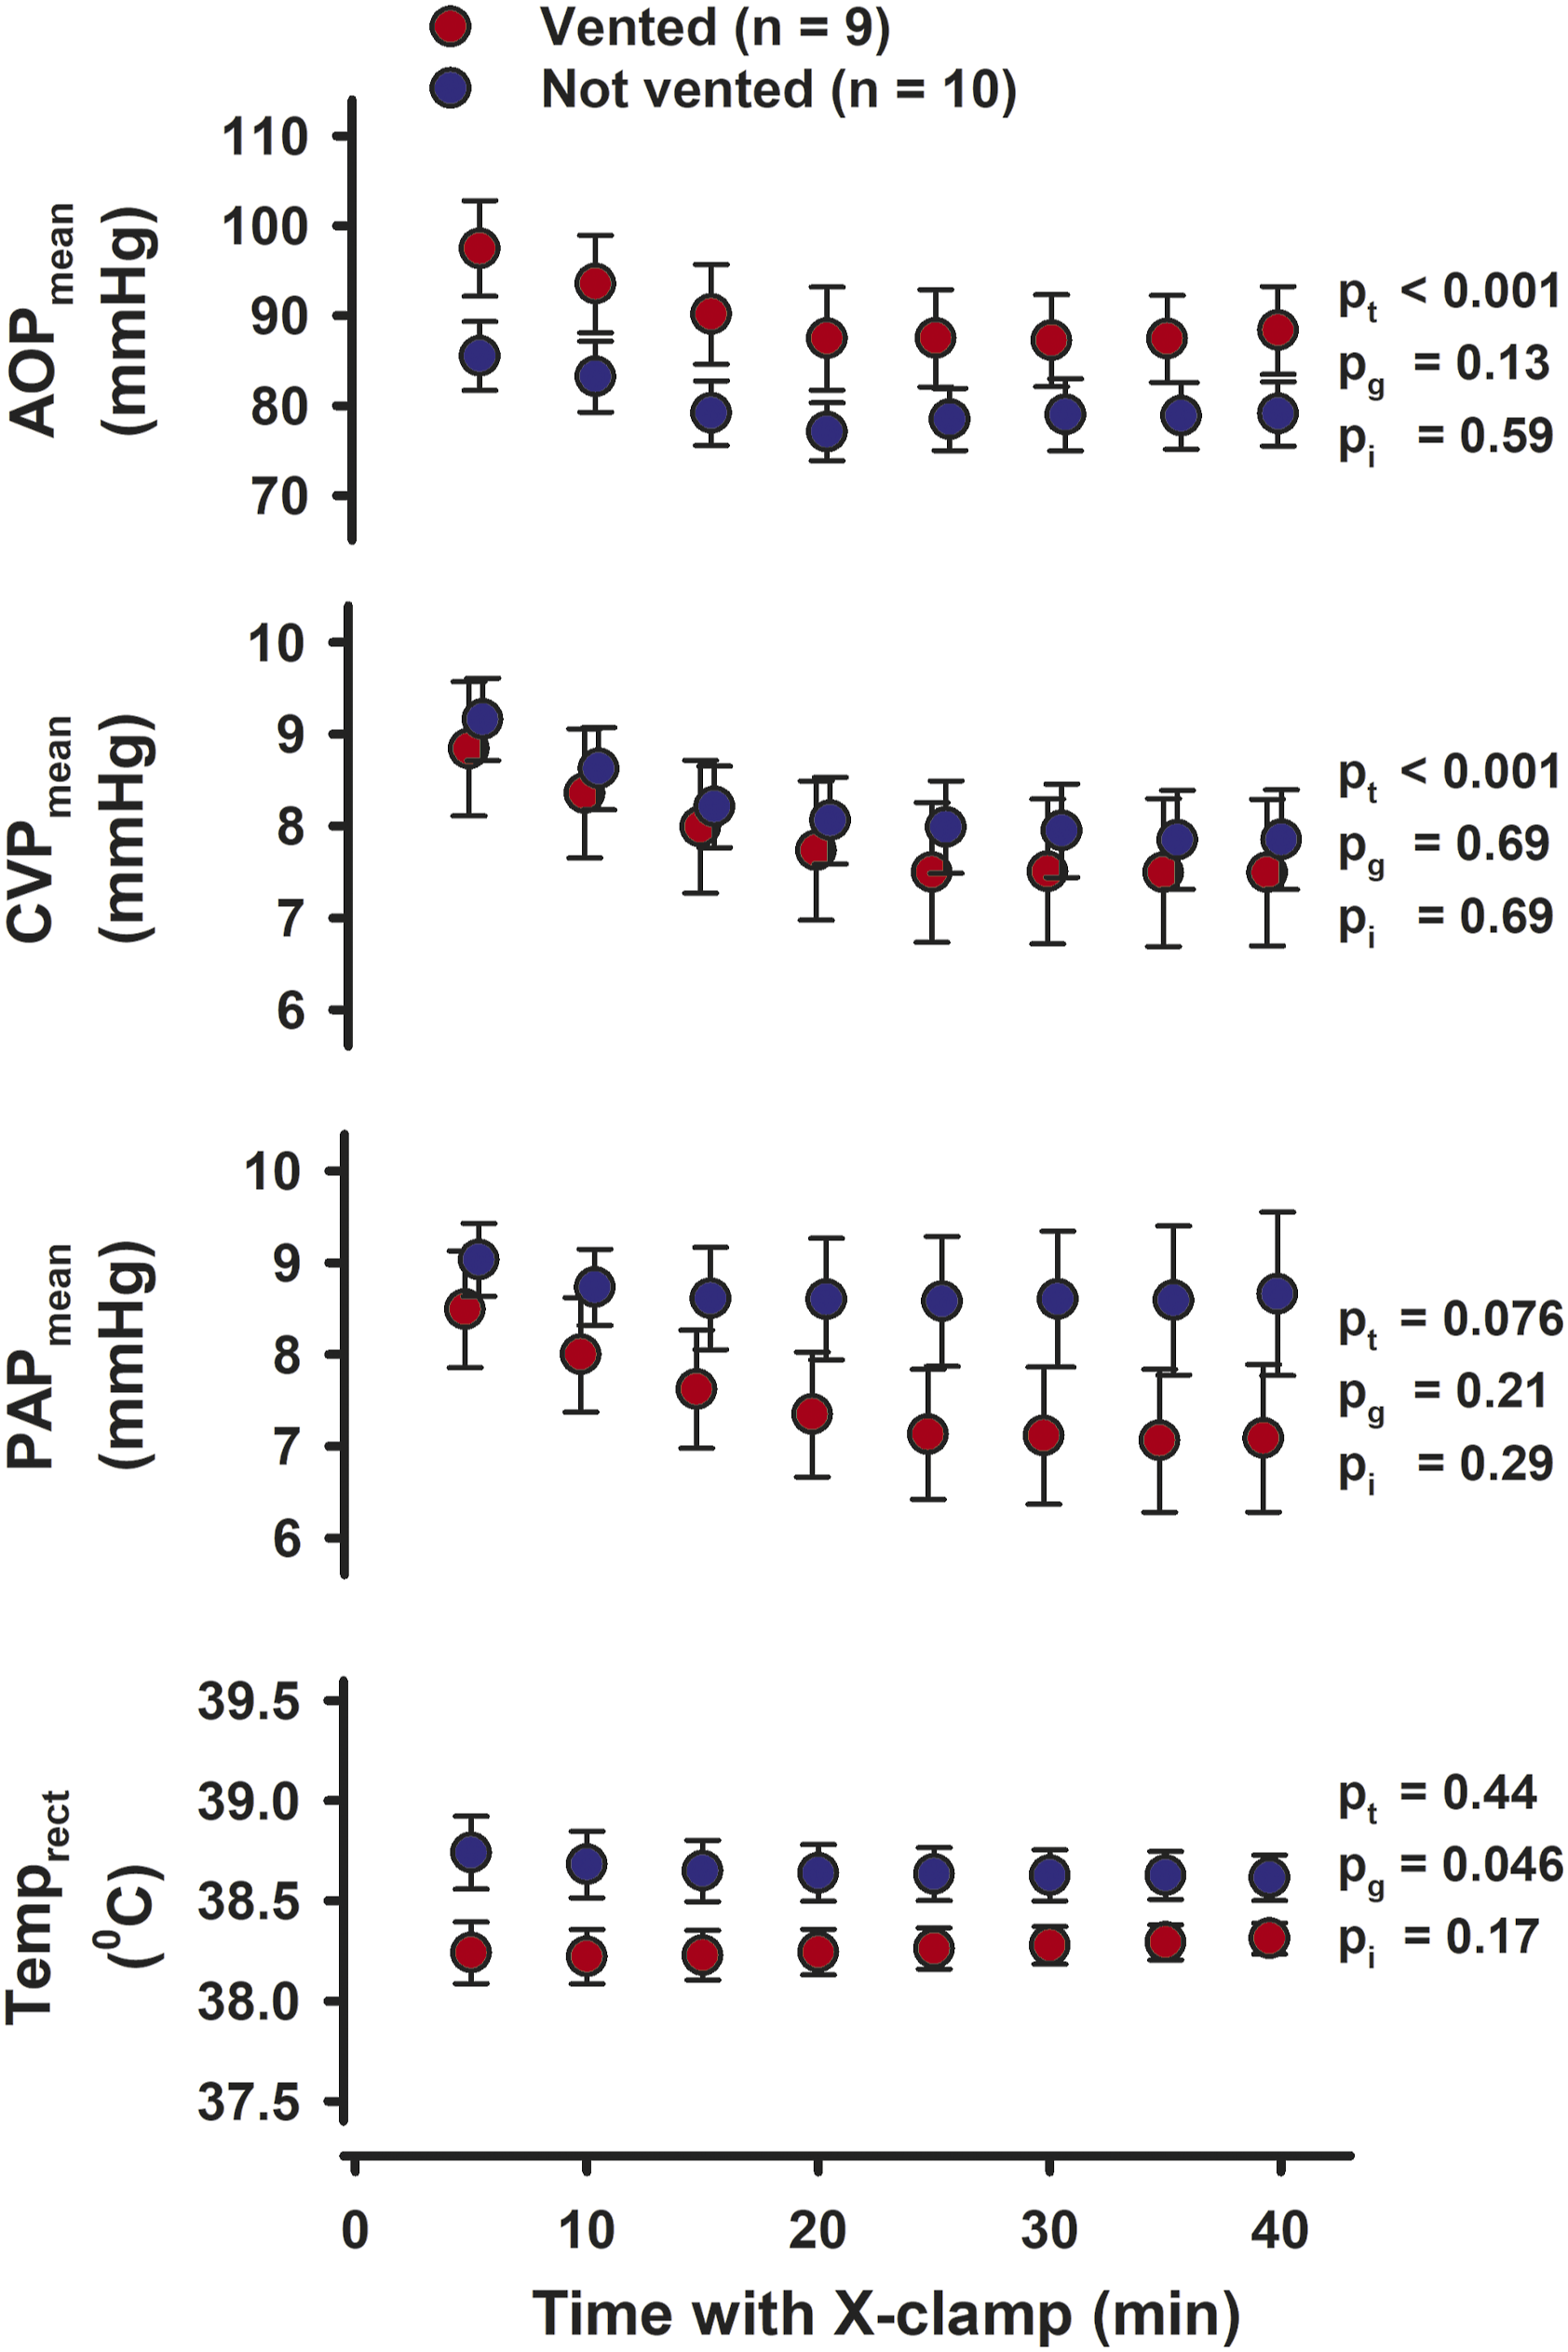
Haemodynamic and cardiac variables on ECMO
The heart rate was increased when on ECMO support compared to baseline with a grand mean of 116 ± 5 beats/min and no significant differences over time (pt = 0.24) or between groups (pg = 0.88) during the 3 h on ECMO (Figure 2). At 90 min on ECMO, the indexed LV end-diastolic- (EDVi) and end-systolic (ESVi) volumes were reduced in vented compared to not vented hearts; for EDVi 58 ± 6 versus 75 ± 3 mL/m2 (p = 0.021) and for ESVi 47 ± 4 versus 62 ± 3 mL/m2 (p = 0.018) (see Supplement Table A for details). The left ventricular systolic pressure (LVSP) and AOPmean, gradually increased in both groups during the first 90 min on ECMO. In the vented group pressures remained stable, but gradually decreased with time from 90 min on ECMO and onwards in the not vented group. Compared to the vented animals, LVSP was significantly reduced in the not vented group after 180 min on ECMO (p < 0.005). Correspondingly, AOPmean was decreased both after 165 min (p < 0.05) and after 180 min (p < 0.005) (Figure 2). LV-dP/dtmax gradually increased over the first 60 min on ECMO with no difference between the groups and remained stable thereafter. LV-dP/dtmin decreased in both groups during the first hour on ECMO and was more negative in vented hearts at 180 min (Figure 2). The aortic pulsatility was significantly lower in the vented group (p < 0.005 and <0.05) after 15 and 30 min on ECMO, but gradually increased with time reaching levels not different from levels in the not vented group. The LAD flow rate increased over time in both groups. Average left ventricular peak systolic STE strain in the longitudinal, circumferential, and radial direction at Baseline and 60 and 120 min of unsupported cardiac function after weaning from ECMO. Values are mean, bars are ± SEM. 4-Ch and SAX = four-chamber- and short-axis views; pt, pg, pi = probabilities for time, group, and interaction by two-way repeated measurement ANOVA after weaning; § = significant difference between groups at the same point in time.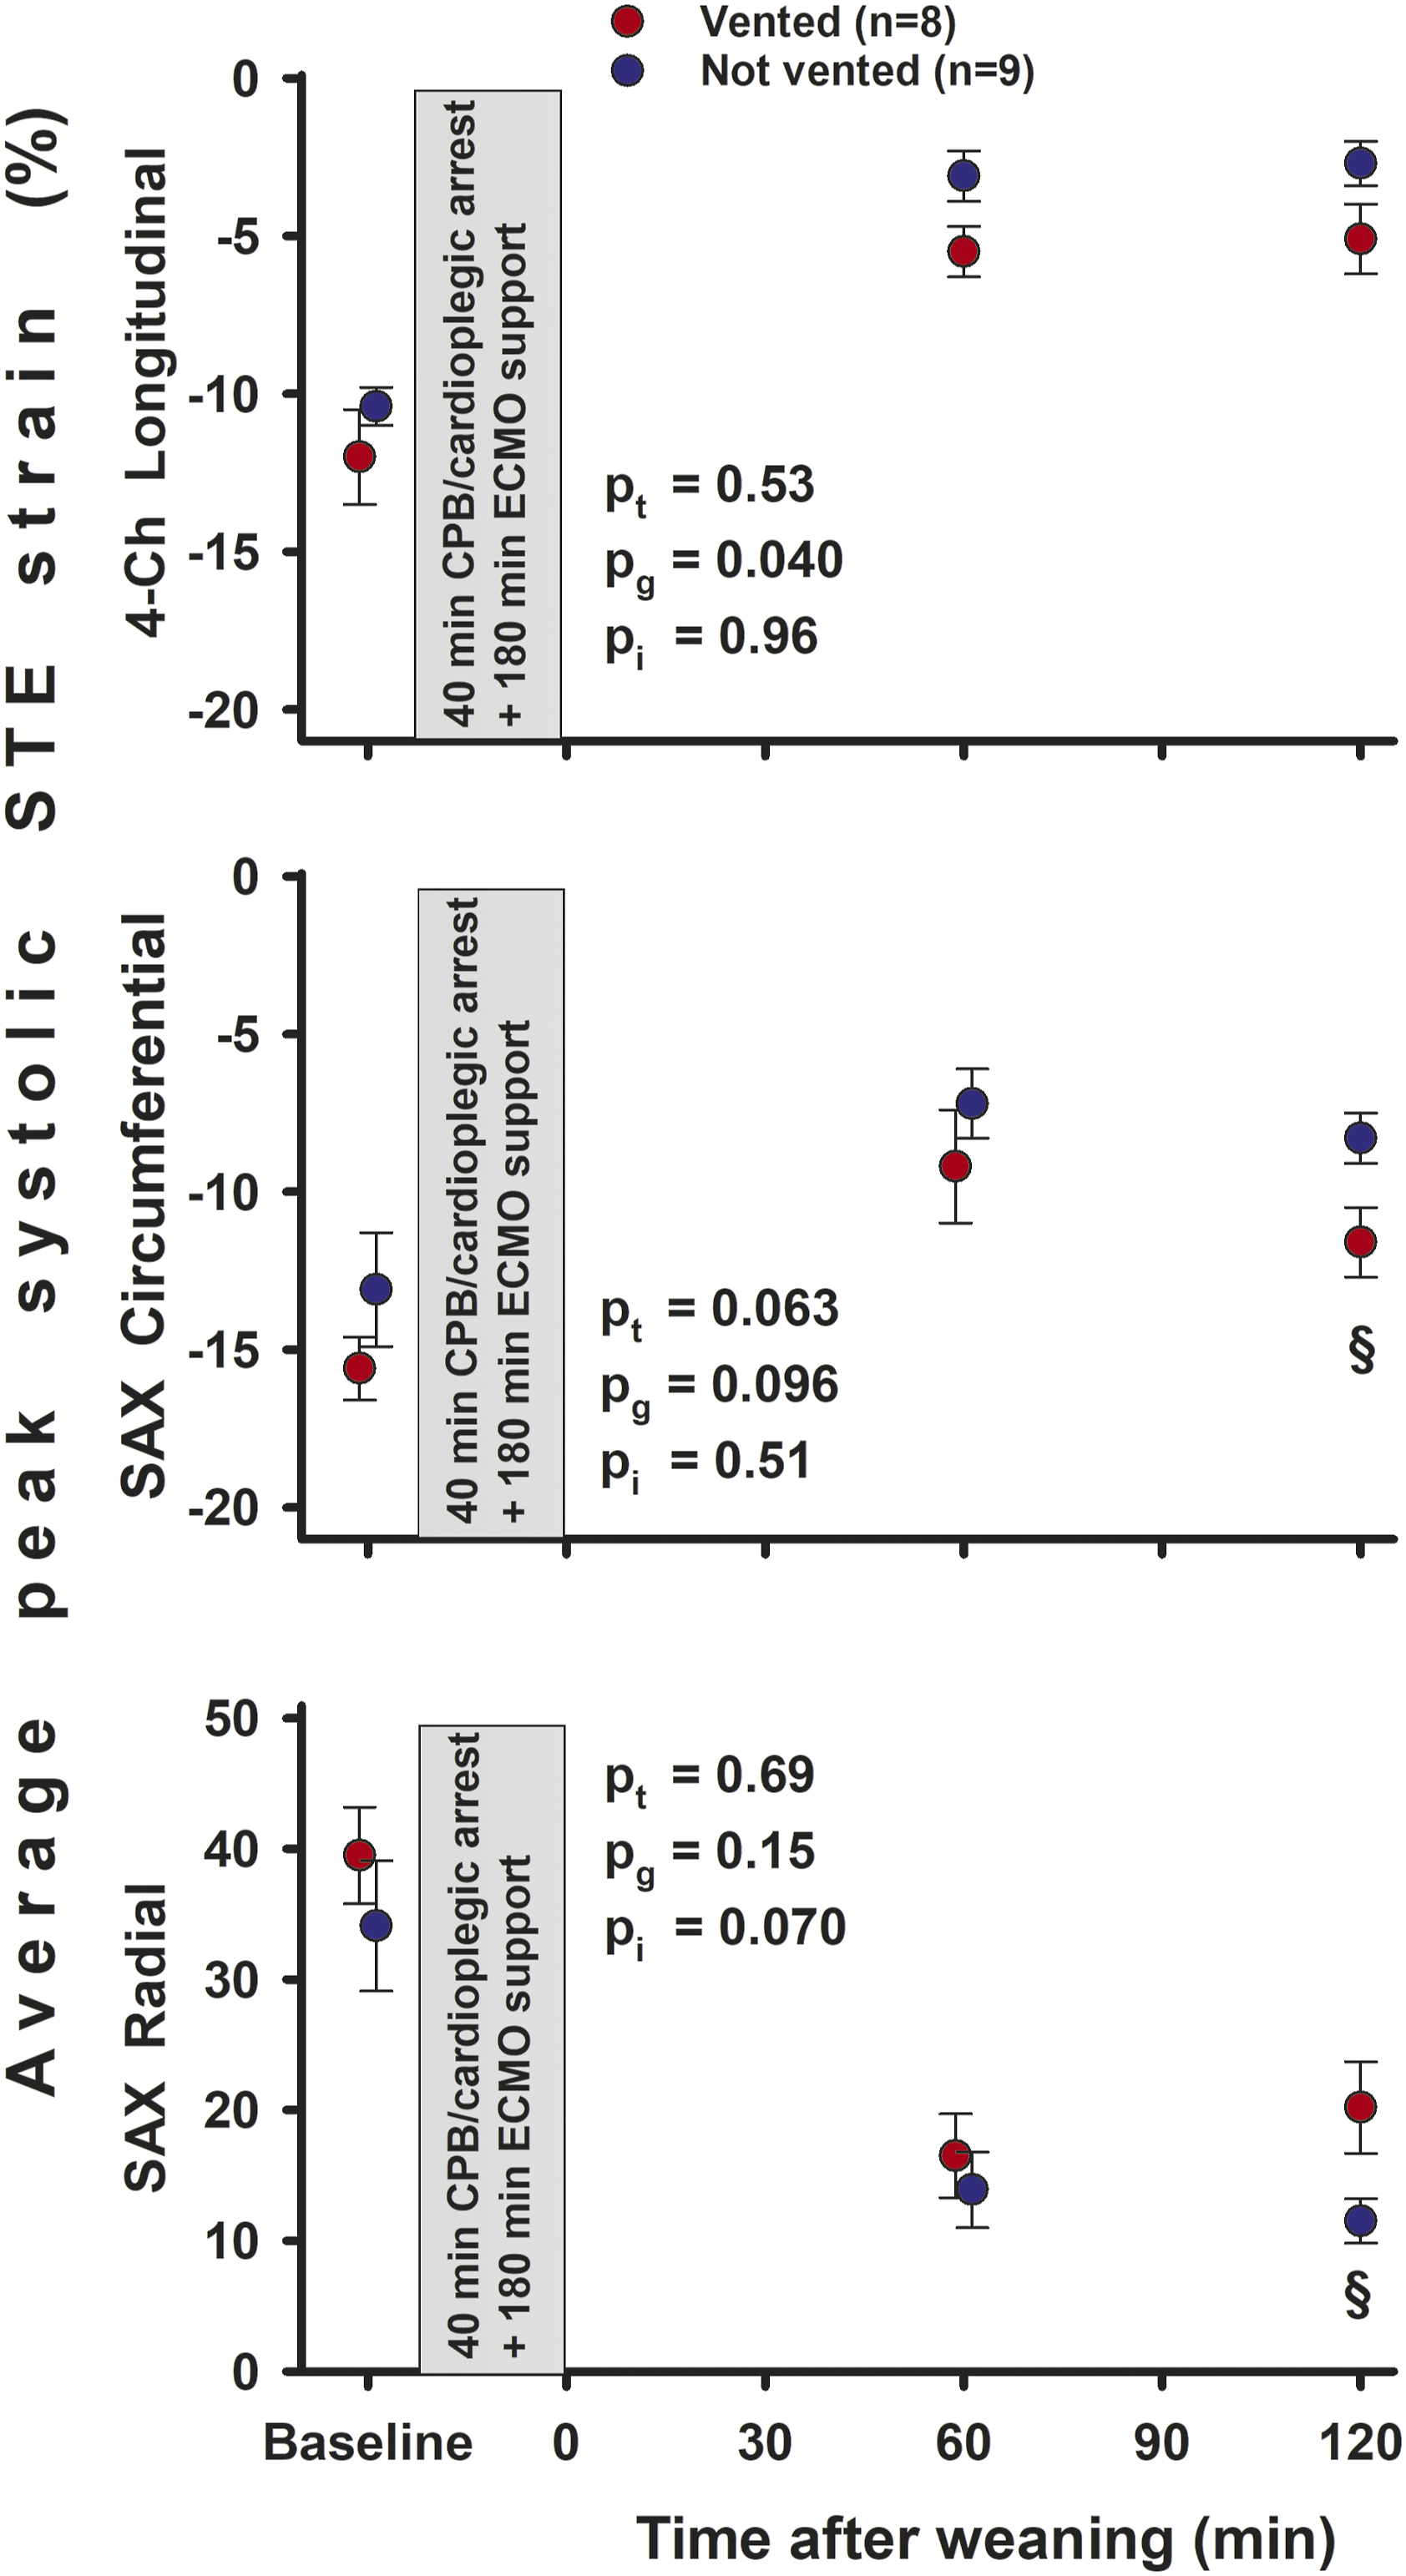
Haemodynamic and cardiac variables after weaning
After weaning from ECMO, both LVSP and AOPmean was increased (pg = 0.049 and pg = 0.038) in the vented compared to the not vented group (Figure 3). The dP/dtmax was stable and unchanged after weaning and with no group difference. However, dP/dtmin became more negative over time (pt = 0.018) and tended to be more negative in vented compared to not vented animals (pg = 0.051).
The load independent variables of LV contractility Ees (the slope of the end-systolic pressure-volume relationship ESPVR) and MW (the slope of the stroke work end-diastolic volume relationship PRSW) did not differ significantly with time and between groups after weaning from ECMO (Figure 4). However, MW decreased from 60 to 120 min after weaning in not vented animals (p = 0.035), with a borderline reduction (p = 0.065) compared to vented animals at 2 h after weaning. Neither the isovolumic relaxation time constant τ (ad modum Glantz) nor the load independent logarithmic end-diastolic pressure-volume relationship β differed between groups and over time. Whereas indexed systolic and end-diastolic volumes (ESVi and EDVi) and ejection fraction (EF) did not differ between groups, a moderate increase in the LV stroke volume was observed in vented animals after 120 min. The indexed stroke work (SWi) was increased in vented animals both at 60 and 120 min after weaning (pg = 0.006). For Cardiac Index there was a borderline increase at 2 h after weaning (p = 0.050) in vented compared to not vented animals.
Echocardiography
In the epicardial 4-Ch view peak systolic global STE longitudinal strain was more negative in vented compared to not vented animals at 60 and 120 min after weaning from ECMO (Figure 5). In the SAX view circumferential strain was more negative and radial strain was increased at 120 min after weaning.
Myocardial blood flow and mechanical efficiency
The left ventricular pressure volume area (LV-PVA), the sum of the area defined by stroke work (SW) and potential energy (PE), was increased in vented compared to not vented animals both at 60 and 120 min after weaning from ECMO (Figure 6). The LV myocardial blood flow rate, based on tissue samples obtained from nine different regions of the left ventricle, did not differ significantly between groups neither at 60 nor at 120 min after weaning from ECMO (for details see Supplemental Table B). The ratio between the energy generated by the left ventricle (PVA x HR) and blood flow rate did not differ between groups 60 min after weaning from ECMO. This ratio decreased from 60 to 120 min in the not vented group (p = 0.025) to a level significantly lower than in animals that were vented during ECMO (p = 0.011). Left ventricular variables at Baseline and 60 and 120 min of unsupported cardiac function after weaning from ECMO. Values are mean, bars are ± SEM. pt, pg, pi = probabilities for time, group, and interaction by two-way repeated measurement ANOVA after weaning. LV = left ventricle; PVA = pressure-volume area; * = significant difference from 60 min within the same group; § = significant difference between groups at the same point in time.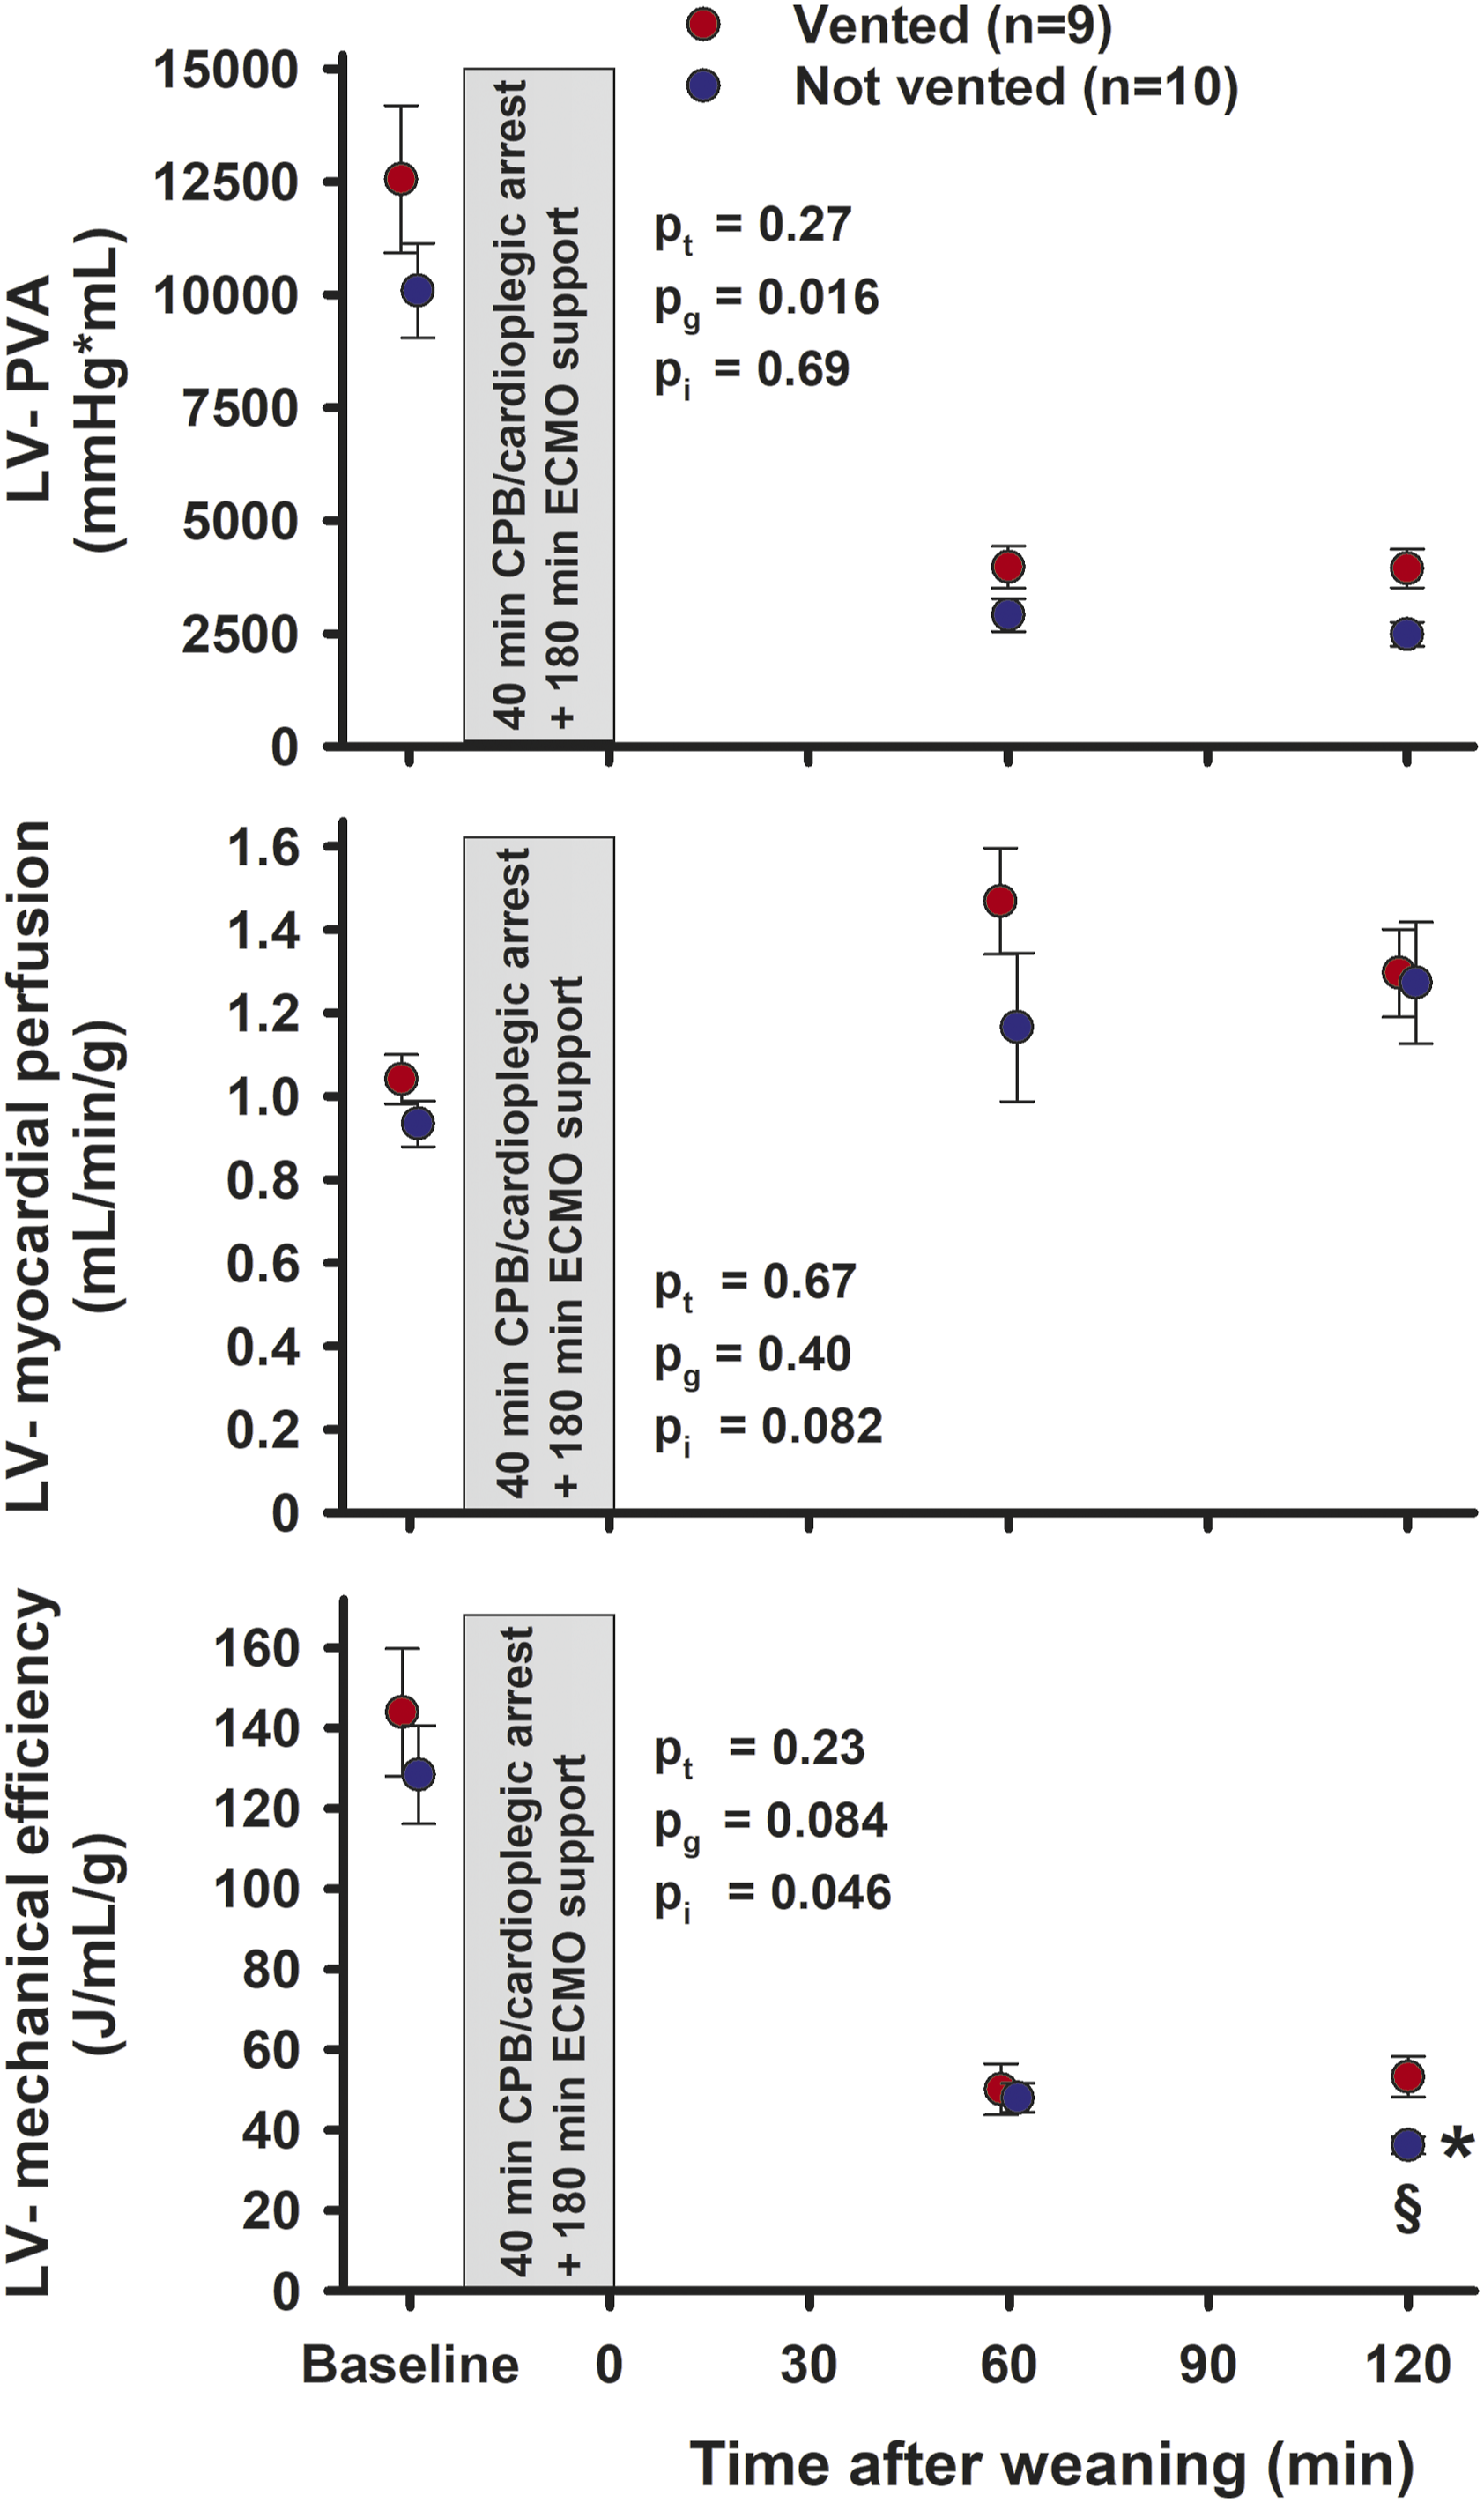
Discussion
This experimental study focusing on left ventricular postcardiotomy failure provides evidence that active LV venting from the onset of VA-ECMO improves the haemodynamic function both during ECMO and in the early hours after weaning from ECMO. Two hours after weaning the mechanical efficiency of the left ventricle was better preserved in vented compared to not vented animals (Figure 6).
The retrograde ECMO flow in the aorta can result in LV distention and dysfunction, compromised myocardial perfusion and pulmonary oedema. Concomitant left ventricular venting may prevent this.4,5 With postcardiotomy heart failure after CPB and cardioplegic arrest, LV venting with a catheter connected to the venous part of the ECMO circuit is an option.
The ECMO output was kept unaltered at 72 mL/kg/min and cannot explain why LVSP and AOPmean increased towards the end of the ECMO period in vented versus not vented animals (Figure 2). No signs of recruitment of the Frank-Starling mechanism were observed. The LV end-diastolic pressure (LVEDP), the gold standard for detecting LV distension, 3 did not differ between groups during the ECMO (Figure 2). Aortic pulsatility was above 10 mmHg, except during the first 30 min in vented animals, probably explained by an early and more complete drainage of the left ventricle.
After weaning from ECMO, LVSP and AOPmean were increased in vented compared to the not vented animals (Figure 3), indicating a less deteriorated systolic function due to venting. An increase in stroke volume and a borderline significant increase in Cardiac Index 120 min after weaning together with the improvement in longitudinal, circumferential and radial peak systolic STE strain demonstrates a better-preserved systolic LV function caused by venting during ECMO. The load independent contractility variable MW decreased from 71.9 mmHg at 60 min after weaning to 58.5 mmHg (p = 0.043) after 120 min in not vented, and was unchanged in vented hearts (Figure 4). Thus, in vented animals a borderline significantly (p = 0.064) improved contractility 120 min after weaning was observed.
Heart rate did not differ between groups after weaning from ECMO. The increase in left ventricular stroke work in vented compared to not vented hearts at 60 and 120 min after weaning is explained mainly by the concomitant increase in LVSP (Figures 3 and 4). This increase in workload and in afterload (AOPmean) after weaning from ECMO is not reflected in an increase in myocardial blood flow rate (see Supplement Table C) in animals vented during ECMO.
The pressure-volume area (PVA) of a cardiac cycle constitutes the sum of the potential energy and the external mechanical work for a given heartbeat. 13 The myocardial oxygen consumption (MVO2) is linearly related to the PVA.14,15 In the present study the myocardial perfusion evaluated from pooled data from nine different regions of the left ventricle is used as a substitute for direct measurement of myocardial oxygen consumption. In the young pig hearts, the myocardial perfusion is not hampered by coronary pathology and regional perfusion differences. Based on these assumptions, the left ventricular efficiency was calculated as PVA∙HR/myocardial blood flow rate. Compared to Baseline levels, the calculated left ventricular efficiency was clearly reduced after weaning from cardioplegic arrest and ECMO supported circulation (Figure 6), a difference explained mainly by an ischemic-reperfusion injury and increase in heart rate following cardioplegic arrest but partly also by reduced haemoglobin levels (see Supplement Table D for details). However, neither arterial pO2, SaO2 nor haemoglobin levels differ between groups at 60 and 120 min of unsupported circulation. Thus, the left ventricular efficiency is better maintained in vented compared to not vented animals 120 min after weaning from ECMO.
After an ischaemia/reperfusion trauma without irreversible myocardial injury, a discrepancy between myocardial function and perfusion can be interpreted as myocardial stunning.16–18 To interpret the improved energy efficiency and haemodynamic function in vented animals as less developed stunning caused by venting during ECMO should be done with great care, as the short observation time in the present study does not allow us to conclude that the LV dysfunction is fully reversible. Furthermore, it is not possible to exclude an alternative interpretation that venting delays the onset of LV dysfunction.
Limitations
This is an in vivo study of young pigs with healthy hearts, and both the time on ECMO-supported circulation and the observation time with unsupported circulation are short compared to a clinical situation. However, a strict but relevant animal experimental protocol combining preclinical and clinical evaluation methods can reveal knowledge that might be of importance also for clinical medicine.
Conclusion
In this experimental pig model left ventricular venting during postcardiotomy ECMO sustains LV systolic function and myocardial efficiency up to 2 h after weaning.
Supplemental Material
Supplemental Material - Left Ventricular Venting During Extracorporeal Membrane Oxygenation; the Effects on Cardiac Performance in a Porcine Model of Critical Post-cardiotomy Failure
Supplemental Material for Left Ventricular Venting During Extracorporeal Membrane Oxygenation; the Effects on Cardiac Performance in a Porcine Model of Critical Post-cardiotomy Failure by Atle Solholm, Pirjo-Riitta Salminen, Lodve Stangeland, Geir Olav Dahle, Arve Mongstad, Bård Svenheim, Liqun Zhang, Rune Haaverstad and Ketil Grong in Perfusion
Footnotes
Acknowledgements
The technical assistance from Cato Johnsen, Kjersti Milde, Gry-Hilde Nilsen and the staff at the Vivarium, University of Bergen is greatly appreciated.
Declaration of Conflicting Interests
The author(s) declared no potential conflicts of interest with respect to the research, authorship, and/or publication of this article.
Funding
The author(s) disclosed receipt of the following financial support for the research, authorship, and/or publication of this article: Financial support was received from Western Norway Regional Health Authority and The University of Bergen Heart Fund.
Supplemental Material
Supplemental material for this article is available online.
References
Supplementary Material
Please find the following supplemental material available below.
For Open Access articles published under a Creative Commons License, all supplemental material carries the same license as the article it is associated with.
For non-Open Access articles published, all supplemental material carries a non-exclusive license, and permission requests for re-use of supplemental material or any part of supplemental material shall be sent directly to the copyright owner as specified in the copyright notice associated with the article.