
Abstract
Background
Isolated limb perfusion (ILP) is a regional surgical treatment for localized metastatic disease. High doses of chemotherapeutic agents are administered within an extracorporeal circulated isolated extremity, treating the metastasis, while systemic toxicity is avoided. To our knowledge, indexed oxygen supply/demand relationship during ILP has not previously been described. Our aim was to measure and describe oxygen metabolism, specifically oxygen delivery, consumption, and extraction, in an isolated leg/arm during ILP. Also investigate whether invasive oxygenation measurement during ILP correlates and can be used interchangeable with the non-invasive method, near infrared spectroscopy (NIRS).
Methods:
Data from 40 patients scheduled for ILP were included. At six time points blood samples were drawn during the procedure. DO2, VO2, and O2ER were calculated according to standard formulas. NIRS and hemodynamics were recorded every 10 min.
Results:
For all observations, the mean of DO2 was 190±59 ml/min/m2, VO2 was 35±8 ml/min/m2, and O2ER was 21±8%. VO2 was significantly higher in legs compared to arms (38±8 vs. 29±7 ml/min/m2, p=0.02). Repeated measures showed a significant decrease in DO2 in legs (209±65 to 180±66 ml/min/m2, p=<0.01) and in arms (252±72 to 150±57 ml/min/m2, p=<0.01). Significant increase in O2ER in arms was also found (p=0.03). Significant correlation was detected between NIRS and venous extremity oxygen saturation (SveO2) (rrm=0.568, p=<. 001, 95% CI 0.397–0.701). When comparing SveO2 and NIRS using a Bland–Altman analysis, the mean difference (bias) was 8.26±13.03 (p=<. 001) and the limit of agreement was − 17.28–33.09, with an error of 32.5%.
Conclusion:
DO2 above 170 ml/min/m2 during ILP kept O2ER below 30% for all observations. NIRS correlates significant to SveO2; however, the two methods do not agree sufficiently to work interchangeable. Clinical Trial Registration URL: https://www.clinicaltrials.gov. Unique identifier: NCT04460053 and NCT03073304.
Keywords
Introduction
Isolated limb perfusion (ILP) is a regional treatment for malignancies of the extremity. 1 A heart and lung machine (HLM) is connected to a surgically isolated extremity, which enables oxygenation, perfusion, hyperthermia, and delivery of high doses of chemotherapeutic agents within the extremity while systemic toxicity is avoided.2,3 The drug is perfused trough the limb during 60–90 min. Before re-establishing the system circulation, the extremity is irrigated with crystalloid to remove the chemotherapeutic agents. 4 The method has been refined over time, and the current overall response rate for patients with in-transit metastasis of melanoma is ranging between 65 and 100%, with a complete response rate between 25 and 76%.4,5
The primary goal of the cardio-respiratory system is to deliver adequate amount of oxygen to the tissues to meet their metabolic requirements. The adequacy of tissue oxygenation is determined by the balance between the rate of oxygen transport to the tissues (DO2) and the rate at which the oxygen is used by the tissues (VO2), also known as the oxygen supply/demand relationship. 6
During extracorporeal circulation (ECC), DO2 is foremost dependent on blood flow, oxygen saturation, and hemoglobin concentration. If either of these factors decreases, the oxygen extraction ratio (O2ER) in organs increases to meet metabolic needs. In case DO2 falls below critical levels and O2ER exceeds 40%–50%, VO2 gradually decrease in proportion to the decrease in DO2 and a pathologic supply dependency arises as evidence of O2 debt. Cells enter an anaerobic metabolism phase and an increase in lactate levels occurs.7–9
Substantial amount of research has been conducted regarding the nadir level of oxygen delivery. In an anesthetized patient (34–36°C) undergoing open heart surgery on cardiopulmonary bypass (CPB), the sufficient amount of DO2 appears to be 265–300 ml/min/m2,8,10–17 and a safe upper limit for O2ER seems to be 39%. 18 The perfusion flowrate commonly used during cardiac surgery for whole body perfusion is 2.2–2.5 L/min/m2, which approximates the patients’ cardiac index based on patient’s body surface area (BSA).15,19 A newer form of flowrate setting is goal-directed perfusion, where DO2 is continuously measured during CPB, with the aim to stay above nadir values of DO2 through the perfusion.11,13,16,17 Effective DO2 during CPB can continuously be monitored by VO2 and O2ER. 20 During ILP only one extremity is perfused, compared to a total body perfusion during open heart surgery, where all vital organs must be optimally perfused. Approximately 25% of the cardiac output (generally 5–6 L/min at-rest) 21 is destined to skeletal muscles. 22 According to the Wallace Rule of Nines, a leg constitutes approximately 18% of the BSA and an arm approximately 9% of total BSA. 23 Perfusion of one leg would then require a cardiac output of approximately 1.0 L/min and 0.5 L/min for an arm.
In 1977, Jöbsis 24 described for the first time the potential in using infrared (IR) spectroscopy as a real-time, non-invasive, continuously measuring tool for tissue oxygen saturation (rSO2). 24 Near-infrared spectroscopy (NIRS) devices measure mean tissue oxygen saturation reflecting hemoglobin saturation in a mixture of venous, capillary, and arterial blood. Average tissue hemoglobin is distributed in a biologic variation in an arterial/venous ratio of approximately 25:75, which is similar during normoxia, hypoxia, and hypocapnia.25,26 Thus, the NIRS signal is to a great extent reflecting tissue venous oxygen saturation. Research has demonstrated that NIRS, beside cerebral oxygenation monitoring, may be used as a non-invasive way of measuring muscular oxygenation, that is, the muscular oxygen supply/demand relationship, detecting skeletal muscle ischemia in the human leg as well as other peripheral tissues.27–31
The overall aim of the study was to measure and describe oxygen metabolism, specifically oxygen delivery, consumption, and extraction, in an isolated leg/arm during ILP. Our hypothesis was that no changes in oxygen supply/demand relationship will occur over time in the ECC-perfused extremity during ILP. Furthermore, we also examined if there was a correlation and agreement between non-invasive NIRS and invasive muscular oxygenation measurement during ILP.
Patients and methods
Patients
Forty patients derived from two prosepective clinical studies of ILP (Corderfeldt et al.32 and ClinicalTrials.gov, identifier: NCT04460053) was included after written informed consent was obtained. The exclusion criteria were leakage >0 ml blood from the system circulation to the isolated extremity, and a leakage of >10% chemotherapeutic agents from the extremity to the system circulation. 19 patients were excluded due to exceeding the waste limitation of 0 mL and one patient was excluded due to leakage of chemotherapeutic agents to the patient of >10%. The final analysis contained 20 patients. Ethical approval was issued by the Swedish ethical board (Dnr. 1145-16 and Dnr. 2019-01046). The study was registered in ClinicalTrials.gov (Identifier: NCT04460053 and NCT03073304).
Clinical management
In all patients, anesthesia was induced with propofol (1.5–2.5 mg/kg), fentanyl (1.0–3 μg/kg), rocuronium (0.6 mg/kg), and maintained with sevoflurane. The ECC circuit was primed with 500 mL of Ringer-Acetate (Fresenius Kabi AB, Uppsala, Sweden), 100 mL Tribonat (Fresenius Kabi AB), 100 mL Albumin 200 g/L (Baxalta, Illinois City, USA), and 2500 IU heparin (LEO Pharma, Ballerup, Denmark) for leg perfusion. The priming solution for arm perfusion was the same as for the leg except for 1 unit of packed red cells (250 mL) which was added together with only 250 mL of Ringer-Acetate. The difference in prime regime between extremities is due to potential hemodilution anemia in arms related to large prime volume/low surface area in arms compared to legs. The ILP technique, ECC assembling, leakage monitoring, and temperature measurements were performed according to clinical routine as described by Corderfeldt et al. 32
Measurements
Blood was sampled at six different time points during the procedure: 1. After induction (arterial cannula). 2. Pre-perfusion (only O2ER and SveO2) (arterial cannula and punction from femoral vein). 3. ECC start (arterial- and venous blood sampled from ECC). 4. After chemotherapeutic infusion (arterial- and venous blood sampled from ECC). 5. At the end of perfusion, before rinsing (arterial- and venous blood sampled from ECC). 6. 10 min after release of the isolation when system circulation is re-established (arterial cannula and punction from femoral vein).
An NIRS monitoring, INVOS® 5100c Cerebral/Somatic Oximetry Adult Sensor (Medtronic, Minneapolis, USA) was used for measuring rSO2. The sensors were placed on the leg/arm (bilateral) on the tibialis-/brachioradialis muscle. NIRS and hemodynamics were recorded every 10 min.
Oxygen calculations
The oxygen content of the arterial blood (CaO2) and venous blood (CvO2), DO2, VO2, O2ER, and pump flow (Q) were calculated according to standard formulas.10,12,14,33 CaO2 = (1.36 × Hb (g/dL)) x (SaO2 (%) x 0.01) + (0.023 × PaO2 (kPa)) CvO2 = (1.36 × Hb (g/dL)) x (SvO2 (%) x 0.01) + (0.023 × PaO2 (kPa)) DO2 indexed = Q (L/min) x CaO2/BSAextremity VO2 indexed = Q x (CaO2-CvO2)/BSAextremity O2ER = VO2/DO2
To be able to compare DO2, VO2, and O2ER between patients with various limb sizes, we indexed these parameters to extremity surface area instead of total body surface area. The patient’s limb circumference was measured every 5 cm, the mean circumference was then multiplied with the length of the extremity. The individually adjusted chemotherapy doses are also based on these measurements and are performed routinely prior ILP.
Statistical evaluation
Data are presented as mean ± standard deviation (SD) unless otherwise stated. Variables were tested for normality with Shapiro–Wilk test. Treatment characteristics on ECC were analyzed with independent-samples T Test. One-way repeated measures ANOVA was used to detect changes in mean over time during perfusion and a paired-sample T test for significant ANOVA parameters. A probability level (p-value) of less than 0.05 was considered statistically significant. To calculate the relationship between several, repeated measurement points for NIRS and invasive muscular oxygenation (extremity venous oxygen saturation [SveO2], partial pressure of oxygen [PaO2], and arterial oxygen saturation [SaO2]) in one individual, we used repeated-measures correlation analyses. 34 The repeated-measures correlation coefficients (rrm), representing the strength of the linear association between the variables, were calculated. The agreement between two methods was assessed according to Bland and Altman.35,36 The mean difference between the methods (bias) and the error (double standard deviation of the difference divided by the mean of the measurements from the two methods) and the limits of agreement (mean difference ±2 standard deviations) were calculated. The differences between the two methods are normally distributed (Shapiro–Wilk, p=0.33). A priori we defined an acceptable between-method error to be 30% or less according to Critchley and Critchley and Odor et al.37,38 Data was analyzed using SPSS version 27 (IBM, Armonk, NY) and R stats version 3.6.3 and rmcorr version 0.4.3 (Vienna, Austria).
RESULTS
20 patients were included in the final analysis, 15 males (75%) and 5 females (25%). The most common diagnosis was melanoma (75%). 14 patients underwent ILP of a leg and six patients underwent ILP of an arm (Table 1).
Baseline patient characteristics for total observations, leg, and arm.
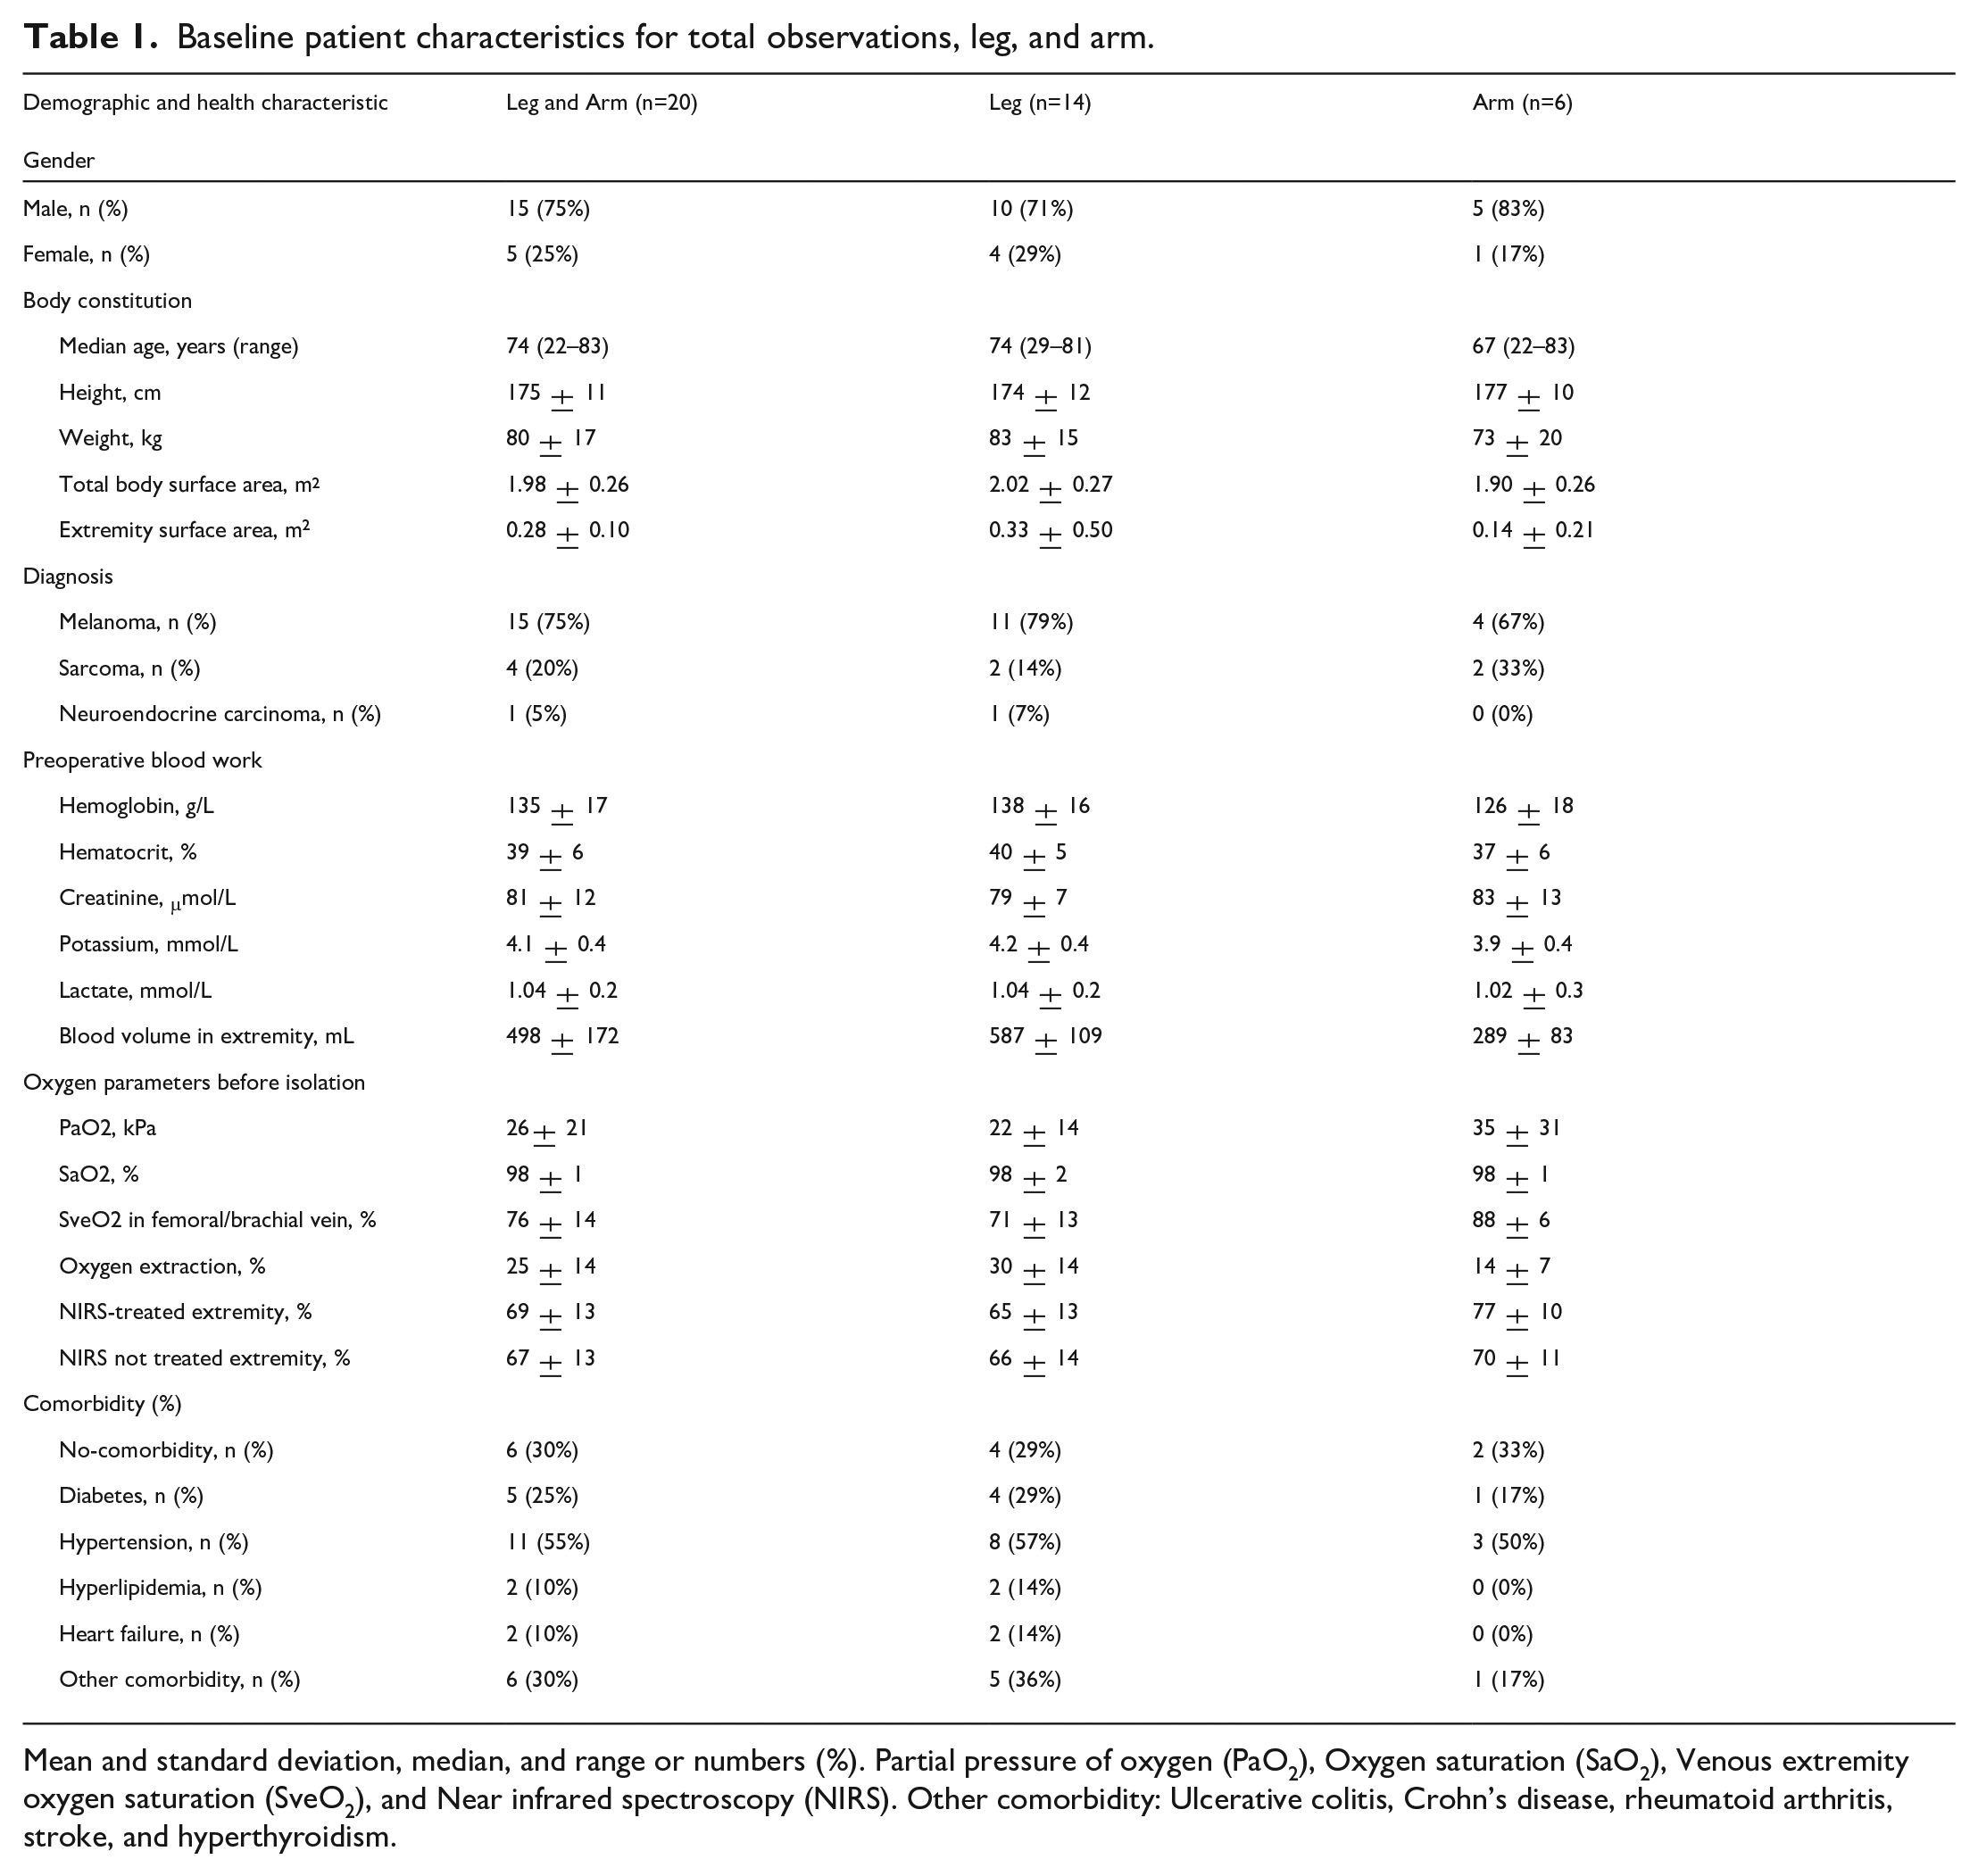
Mean and standard deviation, median, and range or numbers (%). Partial pressure of oxygen (PaO2), Oxygen saturation (SaO2), Venous extremity oxygen saturation (SveO2), and Near infrared spectroscopy (NIRS). Other comorbidity: Ulcerative colitis, Crohn’s disease, rheumatoid arthritis, stroke, and hyperthyroidism.
Oxygen measurement during ECC
The mean ECC time was 101±9 min, with a mean pump flow of 0.53±0.2 L/min (0.64±0.12 L/min for legs and 0.28±0.07 L/min for arms, p=<. 001). The mean SaO2 was 99±1%, PaO2 was 32±3 kPa, and hemoglobin was 68±15 g/L on ECC. This resulted in a mean DO2 of 190±59 ml/min/m2, VO2 of 35±8 ml/min/m2, and O2ER of 21±8% for all observations. There was a significant difference in VO2 between legs and arms (38±8 vs 29±7 ml/min/m2, p=. 02) (Table 2).
Treatment characteristics for total observations, leg, and arm.
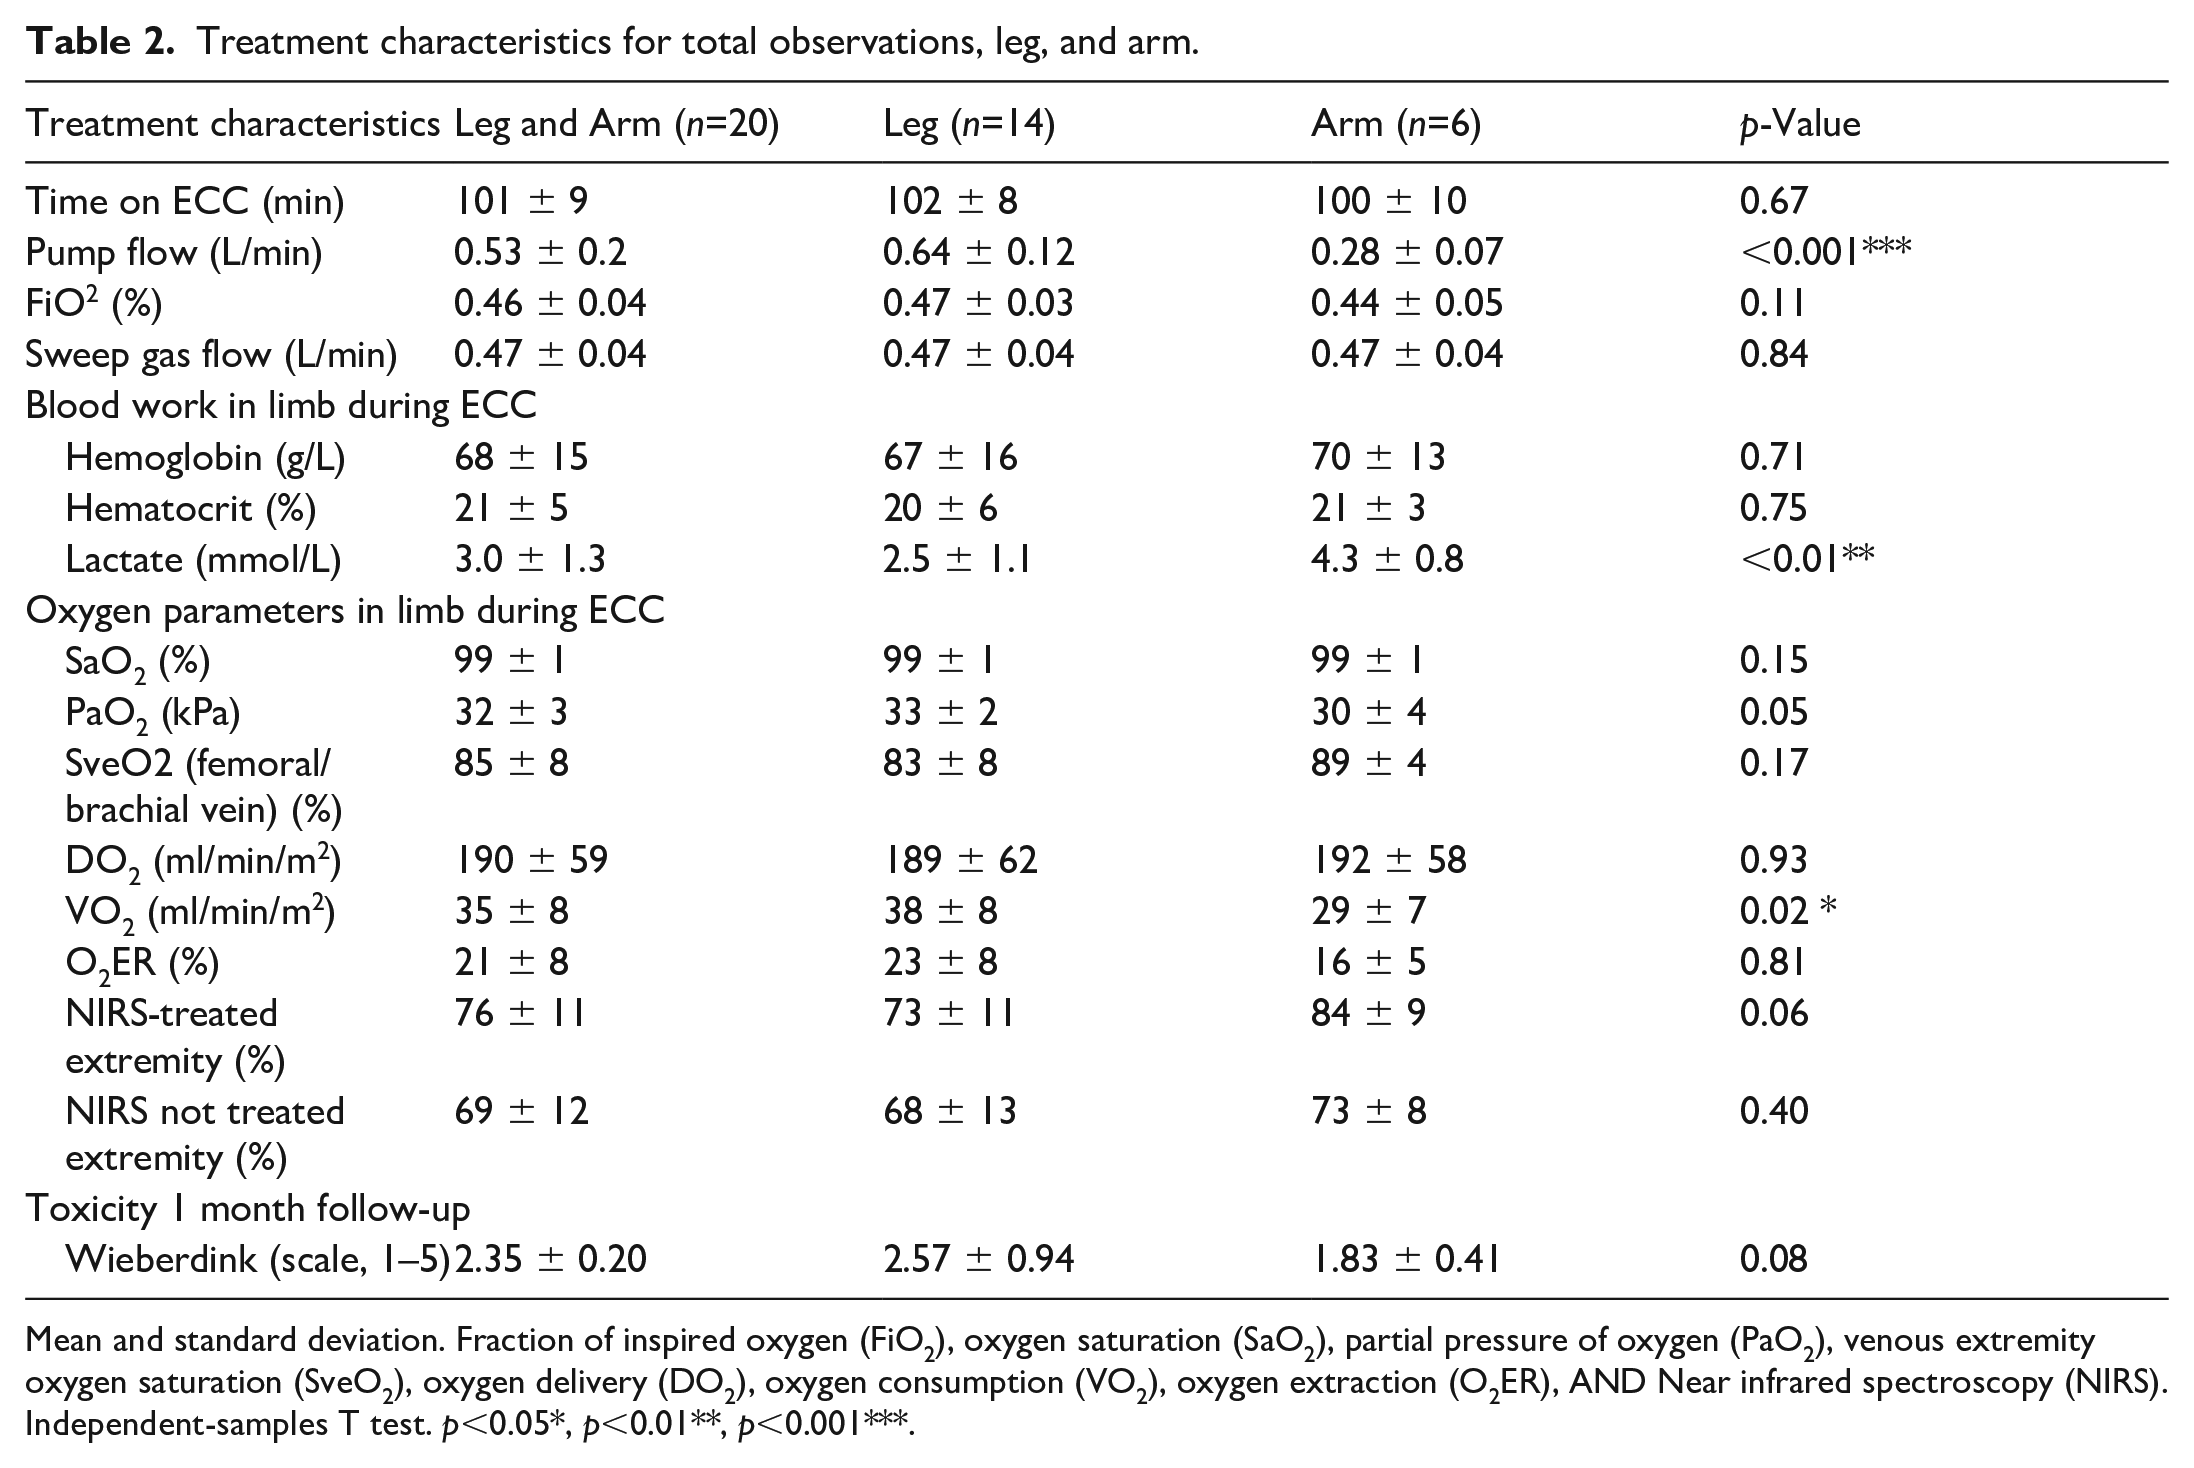
Mean and standard deviation. Fraction of inspired oxygen (FiO2), oxygen saturation (SaO2), partial pressure of oxygen (PaO2), venous extremity oxygen saturation (SveO2), oxygen delivery (DO2), oxygen consumption (VO2), oxygen extraction (O2ER), AND Near infrared spectroscopy (NIRS). Independent-samples T test. p<0.05*, p<0.01**, p<0.001***.
When studying the parameters repeatedly for changes over time and for each extremity separately, there was a significant change in pO2, SaO2, hemoglobin, pump flowrate, CaO2, CvO2, DO2, O2ER, and SveO2 while VO2 remained unchanged. The pump flowrate decreased significantly during the perfusion in both extremities (p=<. 001) and hemoglobin decreased (legs p=<. 001, arms p=<. 01). This resulted in a significant decrease of DO2 over time (in legs from 209±65 to 180±66 ml/min/m2, p=<. 01 and in arms from 252±72 to 150±57 ml/min/m2, p=<. 01) (Table 3). O2ER increased significantly in arms during perfusion, with the highest value of 18% (p=. 03). The SveO2 increased and changed significantly during perfusion in legs (p=0.01), with the lowest value of 71±13% before initiating ECC (Table 3). The result showed that a DO2 above 170 ml/min/m2 kept the oxygen extraction below 30% for all observations (Figure 1).
Characteristics during ILP. One way ANOVA repeated measure (“Before isolation” through “System circulation resumed”).
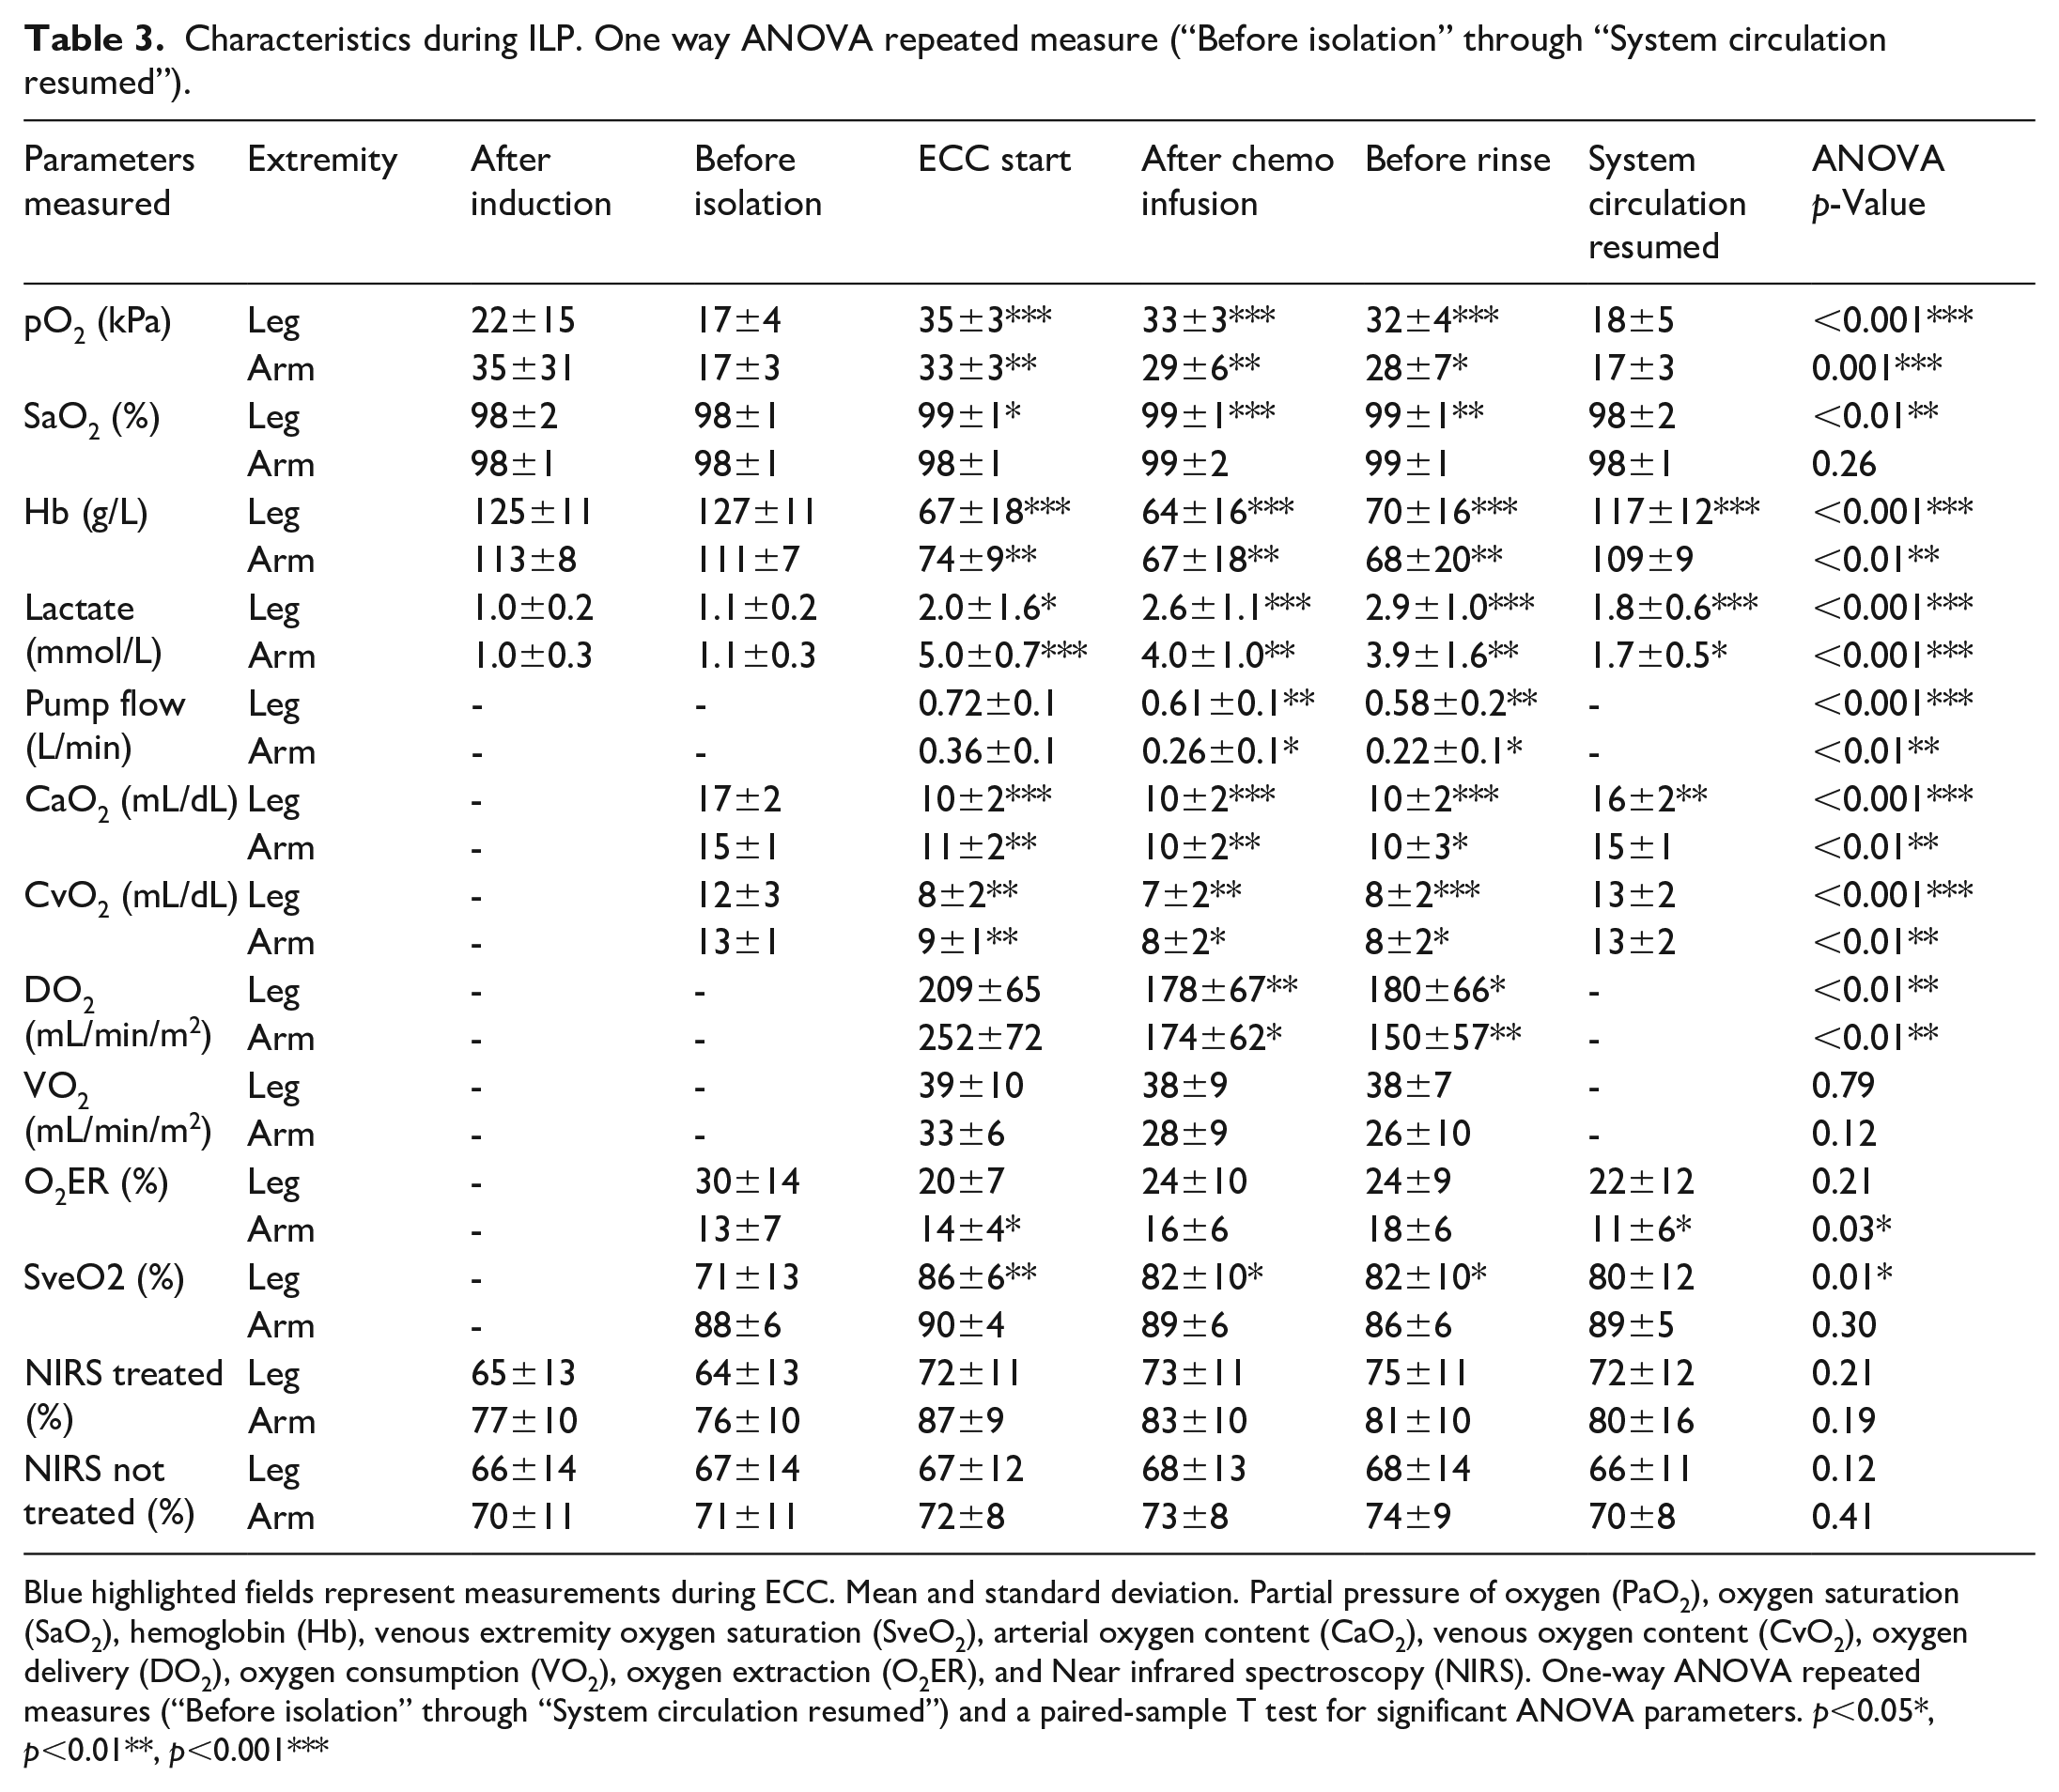
Blue highlighted fields represent measurements during ECC. Mean and standard deviation. Partial pressure of oxygen (PaO2), oxygen saturation (SaO2), hemoglobin (Hb), venous extremity oxygen saturation (SveO2), arterial oxygen content (CaO2), venous oxygen content (CvO2), oxygen delivery (DO2), oxygen consumption (VO2), oxygen extraction (O2ER), and Near infrared spectroscopy (NIRS). One-way ANOVA repeated measures (“Before isolation” through “System circulation resumed”) and a paired-sample T test for significant ANOVA parameters. p<0.05*, p<0.01**, p<0.001***
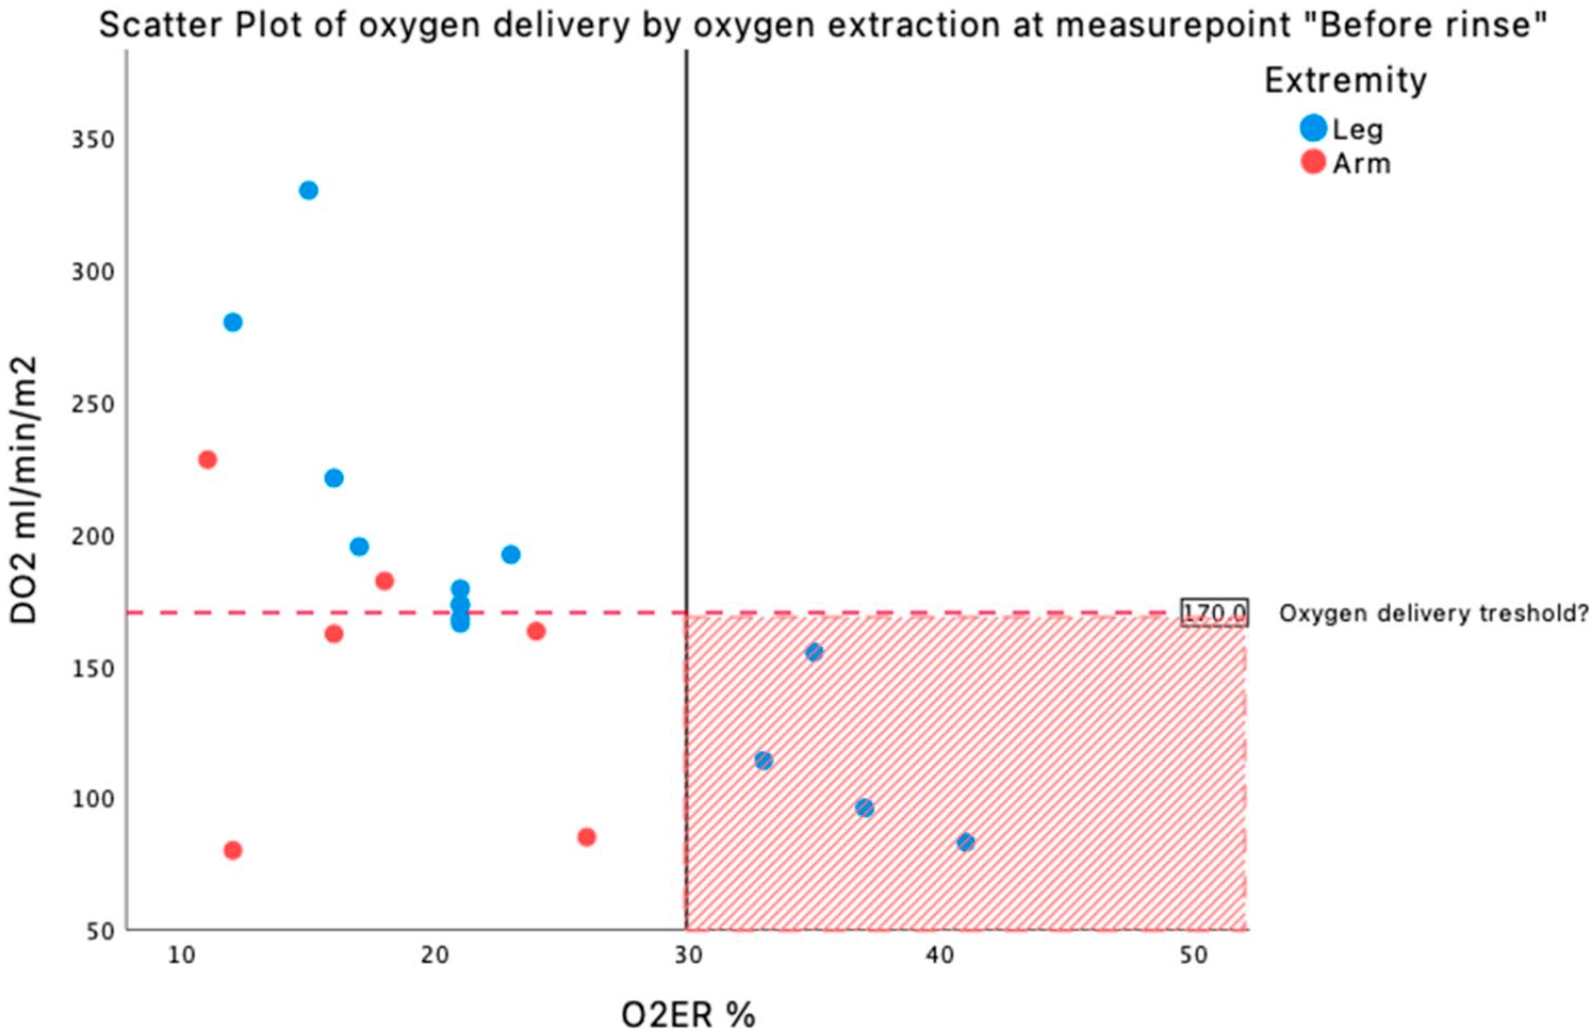
Scatter plot over oxygen delivery by oxygen extraction at the end of perfusion. Red marked area shows perfusions in this study which are above 30% of O2ER and below DO2 of 170 ml/min/m2, all legs.
Lactate measurements during ECC
Mean lactate on ECC was significantly higher in arms compared to legs (4.3±0.8 vs 2.51±1.1 mmol/L, p=0.01) (Table 2). Over time, lactate changed significantly during perfusion in both extremities (p=<. 001). In arms, lactate decreased during perfusion (5.0±0.7 at the start of ECC vs. 3.9±1.6 mmol/L at the end of ECC) but in legs lactate increased (2.0±1.6 mmol/L at the start of ECC vs. 2.9±1.0 mmol/L at the end of ECC). After perfusion, when system circulation was resumed, the lactate was 1.8±0.6 mmol/L in legs and 1.7±0.5 mmol/L in arms (Table 3).
NIRS measurements during ECC
Both arms and legs on ECC had higher NIRS values throughout the perfusion compared to the systemically perfused extremity. There was no significant change in NIRS values over time during ECC (in legs p=0.21 on ECC and p=0.12 on system circulation, in arms p=0.19 on ECC and p=0.41 on system circulation) (Table 3). Significant correlation could only be detected in the individuals’ measurements between the NIRS values and SveO2, rrm=0.568 (p<. 001, 95% CI 0.397–0.701) (Figure 2). There was no correlation in the individuals’ measurements between the NIRS values and PaO2, rrm = 0.078 (p=0.49, 95% CI -0.145–0.294) and SaO2, rrm=0.165 (p=0.14, 95% CI -0.058–0.373). The Bland–Altman plot showed a mean of 80.13±9.0, a mean bias between SveO2 and NIRS was 8.26±13.0 and the, limit of agreement was −17.28–33.09, with an error of 32.5% between the two methods (Figure 3).
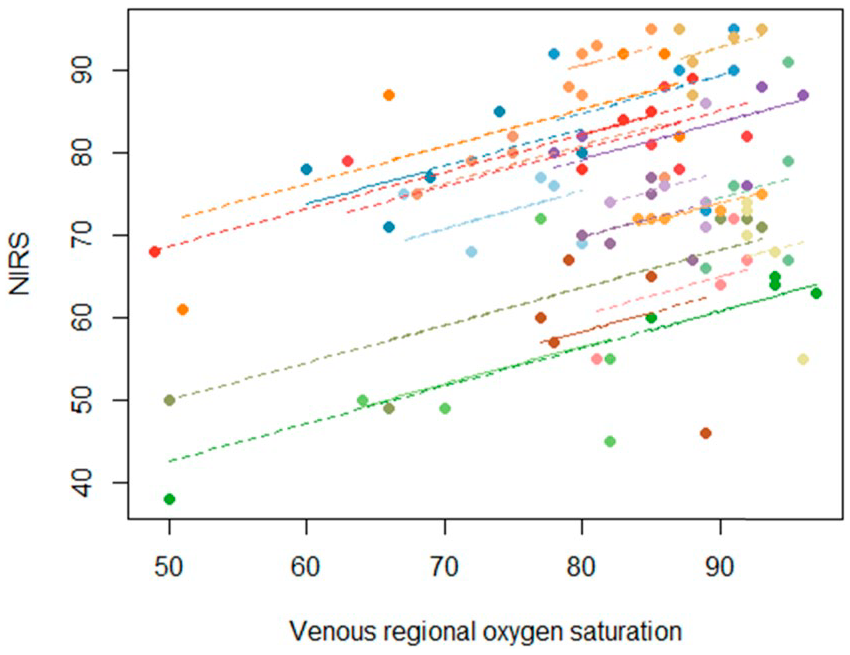
Repeated-measures correlation coefficient between SveO2 and rSO2 by NIRS. The repeated-measures correlation coefficients (rrmCorr), representing the strength of the linear association between SveO2 and NIRS. The inclinations between subjects are the same due to repeated measure total correlation coefficient 0.568 and length of the line represents the range for each individual three measures.
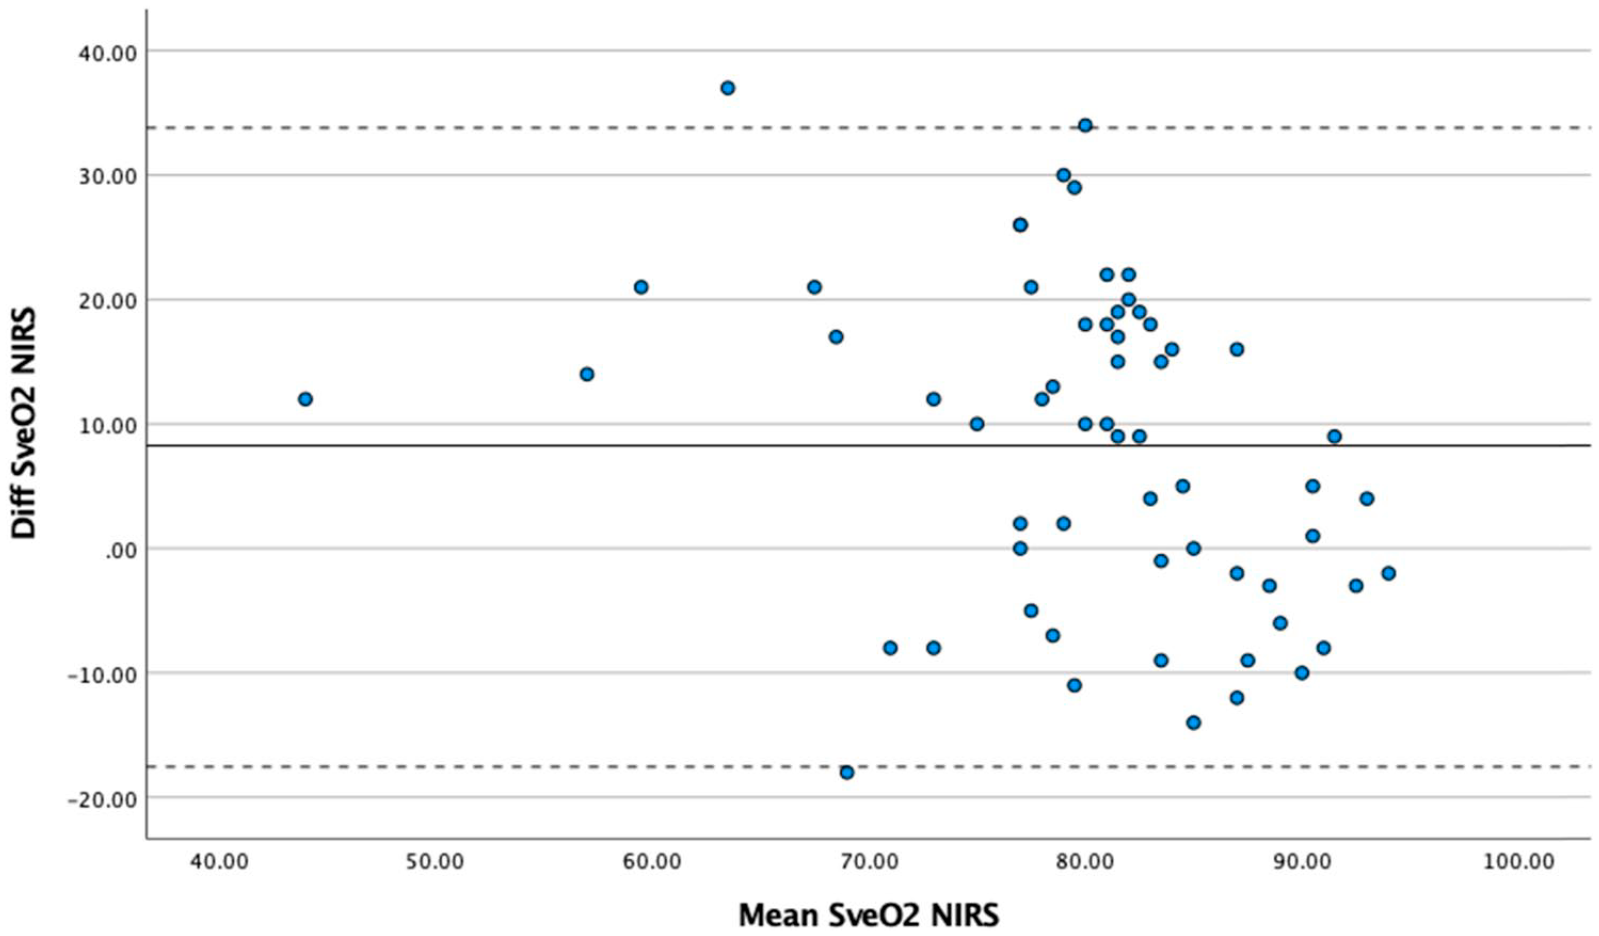
Bland–Altman plot. Agreement between SveO2 and rSO2 by NIRS. Bland–Altman plotting the agreement between venous regional oxygen saturation (SveO2) and near infrared spectroscopy (NIRS). All time points were included. Solid line indicates mean difference, and dotted lines indicate 95% limits of agreement.
DISCUSSION
In this study, the overall aim was to measure and describe oxygen metabolism in an isolated extremity during ILP, and to investigate whether rSO2 assessed by NIRS technique correlates and can be used interchangeable with invasive measurements of muscular oxygenation during ILP. The main finding was that DO2 above 170 ml/min/m2 kept the O2ER below 30% for all observations. Furthermore, a significant correlation was detected between rSO2 values and SveO2 with a moderate agreement between the two methods.
This is to our knowledge the first report on extremity-indexed oxygen supply/demand relationship in an isolated extremity during ILP. Perfusion research has to a great degree been focused on total body oxygen delivery with the aim to determine nadir values for preventing acute kidney injury after cardiac surgery.8,10–15 The results from this study however add an overview and certain comprehension of an extremity’s oxygen need, and provide the possibility for goal-directed delivery of sufficient amount of oxygen to the extremity tissue. Our results show that DO2 is nearly the same for both arms and legs during perfusion. The O2ER and VO2, however, are lower in arms compared to legs (Tables 2 and 3), which suggests that the metabolic need is lower in an arm than in a leg, probably due to different ratios between muscle/adipose tissue and bone. This was also shown in a study by Bevier et al. 39 where correlation between muscle strength and VO2 max was found significant. 39
Elevated lactate values may be an indication of inadequate oxygen delivery, a hypoperfusion, and a mismatch in the supply/demand relationship. 40 Our result shows a higher level of lactate in arms compared to legs throughout the perfusion (Table 3). An explanation for this is most likely the addition of bank blood erythrocytes in the prime solution for arms, as bank blood contains a lactate level of around 8 mmol/L. 32 During perfusion, the lactate value in arms decreases over time. The legs, however, have a significant rise in lactate during perfusion and might strengthen the above cogitation that legs require a higher amount of delivered oxygen per m2 than an arm to fulfill its metabolic need. If this relatively small lactate elevation during perfusion has any clinical impact on patients undergoing ILP is unknown. It is, however, known that when treating patients with isolated limb infusion (ILI), an established treatment similar to ILP but without perfusion and oxygenation, a progressive hypoxia, and acidosis is accepted. 41 During perfusion, a significant decrease of pump flow in both extremities was seen. Obviously, this might be one explanation to the significant decrease of DO2 seen in arms and potentially also an explanation for the increased lactate values seen in legs during perfusion. This flow rate adjustment, often seen during ILP, is an important element of the procedure, where frequent alteration of the pump flow generates direct changes in the perfusion pressure of the extremity preventing leakage to and from the extremity, which is essential since leakage of chemotherapeutic agents from the extremity to the system circulation is potentially lethal for the patient. 42 An attempt to keep DO2 at adequate levels despite a decreasing pump flow could be to elevate hematocrit and/or pO2, which to a certain extent can aid maintaining adequate DO2 levels and lactate levels.10,12,14,33
Even though DO2 of 170 ml/min/m2 in this study seems to be the lower DO2 limit to keep the O2ER at safe values (<30%), we found five patients (four arms and one leg) receiving a DO2 below 170 ml/min/m2 and keeping O2ER below 30%. Individual differences in tolerating lower range of DO2 values might be one explanation. O2ER over 30% was seen only in legs, as shown in Figure 1.
The study showed a statistically significant positive correlation between the NIRS values and SveO2 (rrm = 0.568, p <. 001, CI 95% = 0.397–0.701). This finding supports former studies of the beneficial use of NIRS monitoring as a non-invasive way of measuring muscular oxygenation for detecting skeletal muscle ischemia.27–31 We measured NIRS values on both extremities during perfusion, which enabled us to compare oxygenation in the ECC perfused extremity to the extremity perfused by the system circulation. This guided us in what NIRS values not to go below to ensure a perfusion comparable to the patients’ native oximetry values in the systemically perfused extremity. The result shows that the ECC perfused extremities have higher NIRS values during perfusion compared to the systemic perfused extremity throughout the perfusion. Even though we found that NIRS was significantly correlated with SveO2, the Bland–Altman analysis showed a borderline agreement (error 32.5%) between the two methods.37,38 In this study, our acceptable error was set to 30% based on former studies.37,38 Our recommendation is therefore, considering the wide limit of agreement and an error of 32.5% that NIRS could be used as a complement to invasive measurements. Also, for comparing the ECC-perfused extremity against the extremity perfused by the systemic circulation, but not as a substitute for SveO2.
There are no vital organs in an isolated extremity, DO2 and VO2 should therefore be less than for total body oxygen consumption. But on the other hand, the temperature during ILP is approximately 40°C in the extremity. Oxygen affinity during these circumstances is decreased. 43 This could be one explanation to the significant elevation of O2ER and lactate shown in legs in this study, even though NIRS values indicate that the extremities on ECC are better saturated than their own systemically provided extremity.
The main limitation of this study is the mix of prime solution between arms and legs. Another limitation is that our sample size is relatively small, but our measurements are within subjects and compared to initial values, which despite the small sample size and mix of prime solution make the findings valuable.
In summary, this study is to our knowledge the first study to measure and describe extremity indexed DO2, VO2, and O2ER in an isolated extremity during ILP. It seems that DO2 above 170 ml/min/m2 sufficiently supplies the extremity with its oxygen demand and keeps O2ER below 30%, which is below the considered upper safe limit for O2ER. 18 Furthermore, invasive measurements of SveO2 cannot immediately be replaced by rSO2 values from the non-invasive NIRS technique, due to only moderate agreement between the two methods.
Footnotes
Declaration of conflicting interests
The author(s) declared no potential conflicts of interest with respect to the research, authorship, and/or publication of this article.
Funding
The author(s) received no financial support for the research, authorship, and/or publication of this article.