
Abstract
While plenty of research has provided important insights into the uses of the Internet by politicians during elections, a relatively scarce amount of work has looked into these uses outside of such parliamentary events. This article seeks to remedy this lack of research by presenting a study on the ‘routine’ uses of two of the currently most popular social media services – Facebook and Twitter. Focusing on politicians elected to the national parliaments of Norway and Sweden, the article employs novel methodologies for data collection and statistical analyses in order to provide an overarching, structural view of the day-to-day social media practices of Scandinavian politicians. Findings indicate that use levels are rather low for both services – the median amount of tweets sent and messages posted on Facebook is close to one per day. Further analyses reveal that the most active politicians could be labelled as ‘underdogs’, as they are more likely to be younger, in opposition and out of the political limelight.
Introduction
Ever since the mid-1990s, claims have been made regarding the role of emerging online technologies when it comes to processes related to political activity. Indeed, the assertion by Druckman et al. in 2007 that ‘it has become virtually mandatory for candidates to have a campaign site’ (p. 426) seems equally valid some 6 years later. While the Internet has indeed provided important tools of engagement, information and mobilisation at the hands of both politically inclined citizens as well as for politicians on the campaign trail, the veritable hype surrounding the online and its heralded role in revitalising parliamentary processes throughout the Western world have, more often than not, been largely disproven by empirical research (e.g. Hermans and Vergeer, 2012; Larsson, 2011, 2013a; Lilleker et al., 2011). Indeed, it would appear that the ‘cyber-optimist’ (Shane, 2004; Wright, 2011) or ‘E-ruption’ (Kalnes, 2009; Pascu et al., 2007) views on these developments need to be if not replaced, but definitely complemented with more empirically founded perspectives of ‘normalization’ (e.g. Gibson et al., 2008; Margolis and Resnick, 2000; Schweitzer, 2008, 2009) – suggesting that ‘patterns of socioeconomic and political relationships on-line come to resemble those of the real world’ (Margolis et al., 1999: 26).
Nevertheless, the early suggestion by Barnett (1997) that ‘new technology offers great potential for expanding the horizons of political communication’ (p. 193) appears to still hold strong among academics, consultants and political pundits alike. Particularly in the aftermath of the 2008 Obama US presidential campaign (e.g. Tumasjan et al., 2010; Vergeer, 2012), the apparently successful employment of online features associated with the ‘Web 2.0’ dictum for Web design have provided inspiration also to political parties in other countries (e.g. Karlsen, 2012). As politicians strive to make their messages come across in ever-more complex media systems (Chadwick, 2013), social media services seem to increase in popularity among political representatives, as platforms such as Facebook and Twitter supposedly eliminate media gatekeepers, offering coveted direct contact with potential supporters.
While the bulk of research on the use of the Internet by political representatives have been performed during election campaigns, effectively providing us with periodically skewed data, the influx of novel online services has also brought with it suggestions of ‘permanent’ (Jackson and Lilleker, 2004) or ‘postmodern’ (Vaccari, 2008a) campaigning – indicating the need to gauge these activities beyond election season. This is what this study seeks to do. Presenting a study of social media use by members of the Swedish and Norwegian parliaments, the article provides an overarching, structural analysis of the degree to which officials elected to serve in the parliaments of the two specified countries make use of Facebook and Twitter. The study employs statistical analysis in an attempt to gauge what factors pertaining to the politicians under scrutiny appear to hold influence on their utilisation of the aforementioned social media platforms. As such, the overarching research question pursued here is stated as follows: What factors appear to influence the adoption and continued use of social media by the members of the Swedish and Norwegian parliaments?
As previously mentioned, scholars of online political communication have, to a large extent, focused on studying election campaigns. Inspired by a ‘most-similar’ research design approach, the article provides a comparative study of political activity in two similar countries, one of which (Norway) undertook parliamentary elections during the year of data collection. As such, we will be able to gauge the influence – if any – of such reoccurring parliamentary events. In so doing, we scrutinise whether the normalisation hypothesis, suggesting that the use of any technology within politics merely reflects existing power relationships (Lilleker et al., 2011), is supported when assessing the utilisation of social media tools among Scandinavian politicians. The study is motivated by the need to study these issues outside of a US context (e.g. Hermans and Vergeer, 2012; Lilleker and Malagón, 2010). Specifically, the argument is made that as both Sweden and Norway are characterised by high levels of Internet use among citizens and elected officials (e.g. Gustafsson, 2012; Haug, 2008), and our proposed research focus will provide unique insights into the ‘routine’ uses of social media at the hands of members of politicians.
Research approach
Providing a structural overview of social media practices by politicians in Sweden and Norway, this article follows the suggestion by Strandberg (2013) and differentiates between adoption and continued use of social media. While the former refers to the starting of an account on the services, the latter denotes the degree to which the political actors under scrutiny actually make use of their Facebook and Twitter accounts, respectively. In order to accommodate this perspective, this article makes use of both primary and secondary data, subjected to a series of statistical analyses. The adopted approach, inspired by and expanding on advances reported in previous research (e.g. Larsson, 2011, 2013a; Lilleker et al., 2011; Schweitzer, 2005, 2008; Tenscher, 2013; Vaccari, 2008a, 2008b), is described below.
First, in order to assess the adoption of as well as the degree to which Swedish and Norwegian politicians make use of Twitter and Facebook, data were gathered based on publicly available listings of politicians from the parliamentary websites in both countries. In sum, our sample included a total of 570 politicians − 193 from Norway and 377 from Sweden.
While some of the politicians provided links to their social media profile pages on their parliamentary websites, the names of every politician were also used as search terms on each respective service. For Twitter, we included each politician with an account, while our focus on Facebook laid on Pages rather than personal profiles. Given the specialised features made available by the Pages feature (through the Facebook Insights service), our argument was that this delimitation would give us some indication of the degree of professionalisation evident among Swedish and Norwegian politicians when dealing with social media (e.g. Vaccari and Nielsen, 2012).
Following the identification of politicians holding accounts on Twitter and Facebook, their degree of activity was gauged in different ways for each service. With regard to the former, the Twitter application program interface (API) was queried employing the account names of each identified politician. From this procedure, we then extracted the starting date for each account as well as the number of tweets sent from each profile since that date. For the latter, the Facebook page of each politician was gauged for the number of posts by the hosting user as well as the creation date of the page. Given that similar data – regarding registration date as well as number of tweets and posts – were collected from both services, we constructed an activity index (inspired by Schweitzer, 2005, 2008) by dividing the number of posts or tweets written by each politician by the number of days that he or she had maintained a profile. The data collection procedure was finished within the first week of May 2013, which could be considered a rapid time period (as suggested by McMillan, 2000). In sum, then, our approach involves analysing adoption rates as well as activity as measured through the aforementioned index.
Second, a series of secondary data sources were gauged in order to construct variables suggested by previous research to have impact on the online behaviour of politicians. Inspired by Vergeer et al. (2012), the identified variables deal with both individual and contextual themes and are discussed in the subsequent section.
Individual variables
Age
While both Sweden and Norway continually report high percentages of Internet use among a majority of age groups, the use of social media is primarily related to younger cohorts. As such, we make the assumption that the age of a politician would have influence on how he or she approaches social media – where a younger representative would supposedly engage more frequently online in this way. Indeed, tendencies indicating a ‘youth effect’ can be discerned in some of the previous work available assessing political Twitter use in the Scandinavian countries, where high-end users have usually been identified as relatively younger (e.g. Enjolras et al., 2013; Larsson and Moe, 2012, 2013; Moe and Larsson, 2012), as well as in work on online political communication in general (e.g. Bronstein, 2013; Carlson and Strandberg, 2008; Strandberg, 2009).
For our purposes, information regarding the ages of the identified politicians was readily available on the websites of the Norwegian Stortinget (http://www.stortinget.no/en/In-English/) and the Swedish Riksdag (http://www.riksdagen.se/en/).
Gender
While earlier studies similar to the one presented here have tended to include a measure gauging the effect of gender on campaigning practices, finding differences between men and women (e.g. Carlson, 2007; Kahn, 1996; Puopolo, 2001), later works have reported decreasing differences between the sexes (e.g. Vergeer et al., 2012). While the bulk of this earlier work has dealt with campaigning, we chose to include a dichotomous variable in order to test for the effect of gender also during non-campaign periods.
As with the age variable, data regarding the gender of representatives were gathered from the aforementioned parliamentary websites.
Incumbency
Williams and Gulati (2012) focus on US congressional elections and point out that ‘incumbents have more capacity to generate the content that constitutes or creates usage’ (p. 65), a suggestion that seems at least partially valid also in other contexts (e.g. Strandberg, 2009). While the resources that typically come with incumbency status could be expected to have influence over the online activities of those fortunate enough to enjoy such means, researchers have also suggested that given the comparably low cost of social media use, such novelties might help ‘redress the balance’ (Jackson and Lilleker, 2009: 241) between challengers and incumbents (see also Druckman et al., 2007).
A variable indicating parliamentary incumbency or challenger status was constructed using information from the two previously mentioned parliamentary websites.
Key position
In an effort to take intra-party activity into account, we included a variable singling out those politicians in our sample who hold what we call key positions – essentially, those members of parliament holding high-profile positions, such as incumbent or non-incumbent party leaders, secretaries or ministers. In combination with the previously discussed incumbency variable, this design allows us to provide further insights into the roles that various forms of privilege appear to have on the communicative practices of politicians.
Much as for the variables previously discussed, data regarding the key position variable were collected from the aforementioned official websites.
Contextual variables
Ideology
The suggestion that right- and left-wing parties would employ different rationales to online campaigning and other activity on the net has been discussed, proven as well as disproven throughout the last two decades of online political communication research. While comparably early research efforts tended to report left-leaning politicians and parties as generally more internet-savvy than their right-wing counterparts (e.g. Gibson, 2004; Lilleker and Malagón, 2010; Vaccari, 2008a), the effects of ideology appear to have decreased in more recent years (e.g. Lilleker et al., 2011; Vergeer et al., 2012) – perhaps as a result of the general trend towards professionalisation of parliamentary activity (for an overview of this research, see Lisi, 2013). Nevertheless, in an attempt to trace the influences of ideology also in a non-campaigning context, a variable gauging these issues was included.
As the dichotomy of right wing and left wing makes sense in the way that political parties collaborate and take to governmental practices in both the Norwegian and the Swedish contexts, a variable was constructed accordingly.
Vote percentage
Although ideology might not be as powerful a predictor as it used to be, party size has similarly been suggested as being ‘highly influential on candidates’ web campaign presence’ (Strandberg, 2009: 851). This is particularly relevant in our case countries, as the share of votes received has influence on the amount of governmental support received. However, there are some indications that this advantage at the hands of sizeable political parties could be largely related to the pre-social media era, where larger amounts of resources were arguably needed to create sophisticated Web presences. Nevertheless, while Facebook and Twitter provide the platforms necessary for free, the successful or at least continuous operation of such services still demands assets, both in terms of finance and of manpower. Regardless of such financial demands, suggestions have been made that minor parties appear to be more ardent in taking to these new platforms (e.g. Gibson et al., 2008; Williams and Gulati, 2012). In order to gauge the influence of party size, a variable was included providing information of vote percentage for each party from the last national parliamentary election at the time of data collection – 2009 for Norway, 2010 for Sweden.
Size of constituency
While Norway and Sweden tend to consistently score high on various measurements gauging Internet use, there is some variation pertaining to regions within each country – variations that can be understood along a centre–periphery continuum (e.g. Haug, 2008; Polat, 2005). This suggests that politicians with electoral bases in larger regions or cities might have more tech-savvy voters to cater to than their colleagues from comparably rural areas (e.g. Jouet et al., 2011; Larsson, 2013a). As such, the size of the constituency being catered to by the politicians studied might have some influence over their respective social media activity.
With this in mind, a variable measuring constituency size was constructed using official data regarding the number of citizens in the representative region of each included politician.
By using our collected primary data as dependent variables and employing the secondary data as independent variables, the next section outlines the results of our analyses, shedding light on how individual and contextual factors appear to influence the adoption and continued use of social media services among Norwegian and Swedish politicians.
Results
Distinguishing between results from Norway and Sweden respectively, this section starts out by presenting our findings regarding adoption of social media, utilising descriptive statistics. Moving on, our focus shifts towards gauging factors having influence over the continued use of such media channels, employing a series of logistic regression analyses.
First, Figure 1 details the adoption rates for the services studied.
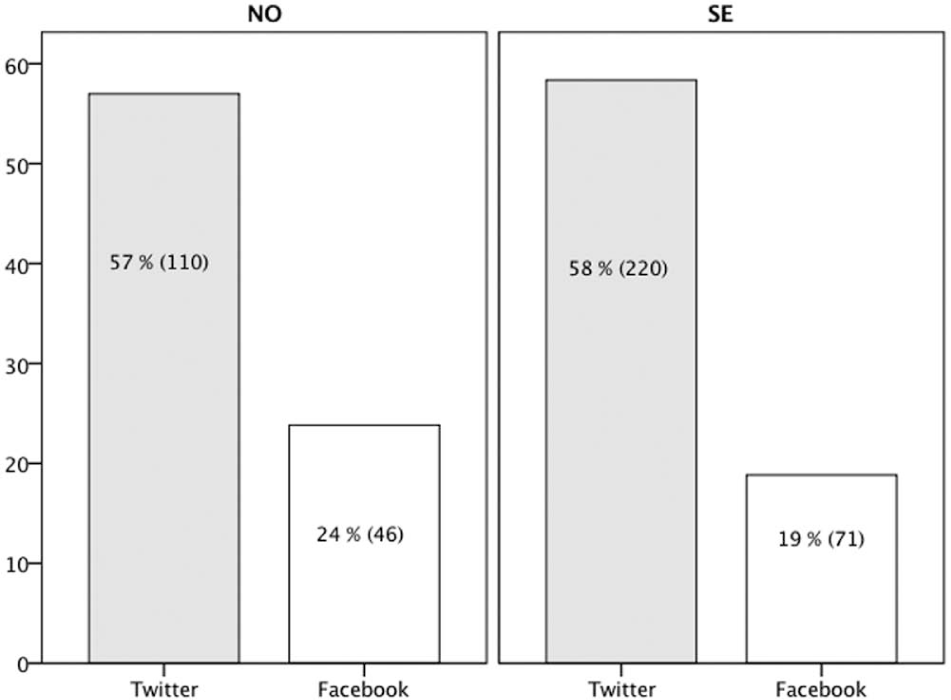
Adoption rates of Twitter (grey) and Facebook Pages (white) among Norwegian and Swedish politicians (% (N)).
While the fact that the Swedish parliament seats more members than its Norwegian counterpart has influence on the numbers presented in Figure 1, the difference of scale is adjusted for when discussing these issues in terms of percentages. While Norwegian politicians have apparently adopted Facebook Pages to a slightly higher degree compared to their Swedish colleagues (24% of Norwegian politicians had adopted Facebook Pages at the time of data collection, compared to 19% in Sweden), the differential when looking at Twitter is minimal (57% for Norway, 58% for Sweden).
Evaluating these observations more closely by means of statistical analyses, no significant relation could be found between country and Twitter adoption (Cramer’s V = .13, p > .05), nor between country and Facebook Page adoption (Cramer’s V = .06, p > .05). As such, we conclude that if there is a difference to be found regarding how politicians in our two case countries make use of social media, it cannot be found when assessing their adoption rates.
Our next step is to look more closely at the degree to which these uses can be described as continuous or ongoing. This provide more insights into whether or not politicians have indeed implemented what was referred to in the introduction as permanent modes of campaigning using these tools. Utilising the previously discussed activity index, Figure 2 features a series of box-and-whiskers plots providing descriptive statistics for Twitter and Facebook Page use by politicians in our two case countries.
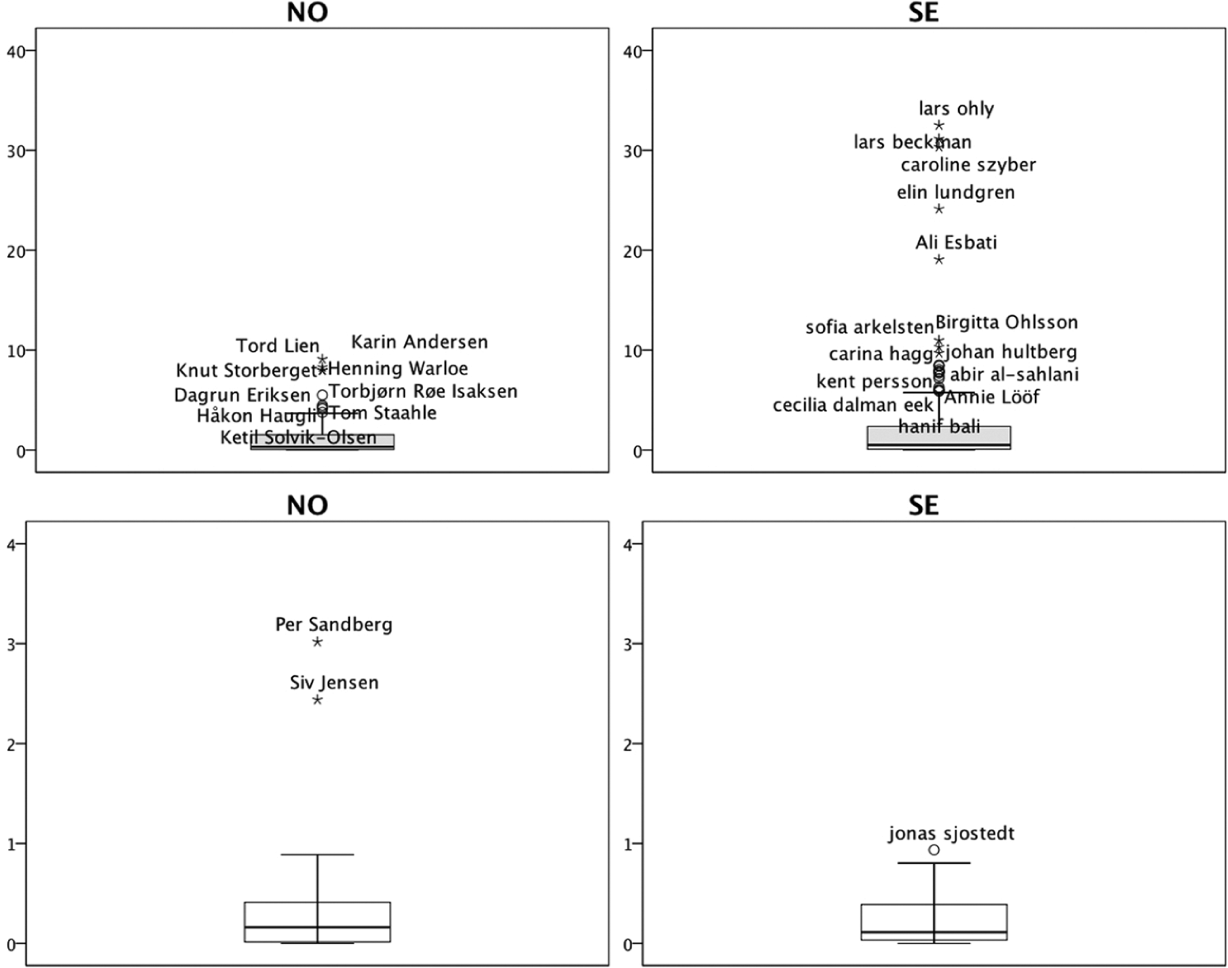
Box-and-whiskers plots depicting distributions of tweets (upper row, grey boxes) and Facebook Page posts (lower row, white boxes) per day for Norwegian (NO) and Swedish (SE) politicians.
To begin with, here is a note on interpretation. Box-and-whiskers plots provide a visual overview of the distribution of specified numeric variables. First, the ‘whiskers’ inform us about the spread of the data – indicating the lowest and highest data points. Any case found outside the whiskers is considered an outlier – in this case, a politician who stands out in his or her comparably extreme high-frequent use of social media. Second, for the ‘boxes’, the lines visible within them indicate the median of the distribution. Given the nonparametric distribution of the data, the median was determined as a suitable statistic for interpretation. The areas in-between the whiskers, the box edges and the median line altogether allow us to discern the quartiles of each distribution – which, in turn, is helpful when assessing the skew of the analysed data.
With these guidelines for analysis in place, a few results stand out from Figure 2. First, for Twitter (upper row of Figure 2, grey boxes), the median values for both countries indicate that the politicians under scrutiny sent out under one tweet per day (NO = .60 tweets, .95 tweets in Sweden). Compared to the means of tweets per day, these are considerably higher in both countries (NO = 1.01, SE = 2.85), suggesting a highly skewed distribution where comparably few politicians account for a large amount of tweets being sent. The same tendency can also be discerned when noting the slight upward skew of the boxes representing each country. Particularly for Sweden, this upward skew, indicating the activity of high-end users, is complemented by a series of outlier values – politicians who, due to their frequent use of the service at hand, appear to be literally ‘off the charts’ when compared to their colleagues. For both Sweden and Norway, these politicians could be described as ‘mid-level’ with regard to their respective roles in parliament – while there are exceptions, particularly in the Swedish case (such as Ministers Annie Lööf and Birgitta Ohlsson), these outliers can largely be identified as Members of Parliament without specified ministerial duties or other similar tasks ascribed to them.
Second, for Facebook data (lower row of Figure 2, white boxes), the difference in scale as detailed on the Y-axis is striking when compared to our results regarding Twitter activity – while the former scale ranges from 0 to 40 tweets per day, the Page activity of the politicians in our sample can fit comfortably within a scale of 0–4 posts per day. This very basic result provides us with some initial insights into everyday uses of this particular service at the hands of politicians – a mode of communicating that is arguably not characterised by abundance. According to our findings, Norwegian politicians tended to provide a median of .28 Facebook Page posts per day (Mean = .36), with that same statistic for Sweden amounting to .11 posts per day (Mean = .26). While the middle boxes are still skewed upwards, they appear more evenly distributed around the median line in comparison with the Twitter data, indicating a comparably limited spread around the reported median for both countries – a tendency that seems especially valid for Norway. Furthermore, as the medians and means are relatively closer to each other for the Page activity variable than for its Twitter counterpart, we can conclude that while Twitter activity is more abundant and characterised by upward skews on the scale caused by highly active politicians, Facebook Page activity appears as rather limited – a result that is further corroborated by the fact that the number of outliers for the latter of these scales are rather limited in comparison with the former. In comparison with the ‘mid-level’ politicians found in our results pertaining to Twitter, the outliers in terms of Page activity tend to be top-level politicians – Siv Jensen is the leader of the Norwegian Progress Party, while Jonas Sjöstedt is the party leader for the Swedish Left Party.
No significant differences could be found regarding the degree to which politicians from our two case countries make use of social media on a daily basis here – whether testing for the median (SPSS Independent-Samples Median Test reported p > .05 for both variables) or for the mean (Mann–Whitney U test reported p > .05 for both variables). As such, while the results reported in Figure 2 indicate that neither Twitter nor Facebook Pages are employed by politicians from our case countries as frequently as popular belief perhaps would have us believe, the results from the Twitter index indicate that this particular platform seems to be the social media of choice – particularly for those elected in Sweden. While their Norwegian colleagues appear slightly more resolute in their use of Facebook Pages, this difference did not emerge as statistically significant. As such, interpretations of this particular result should be handled with caution.
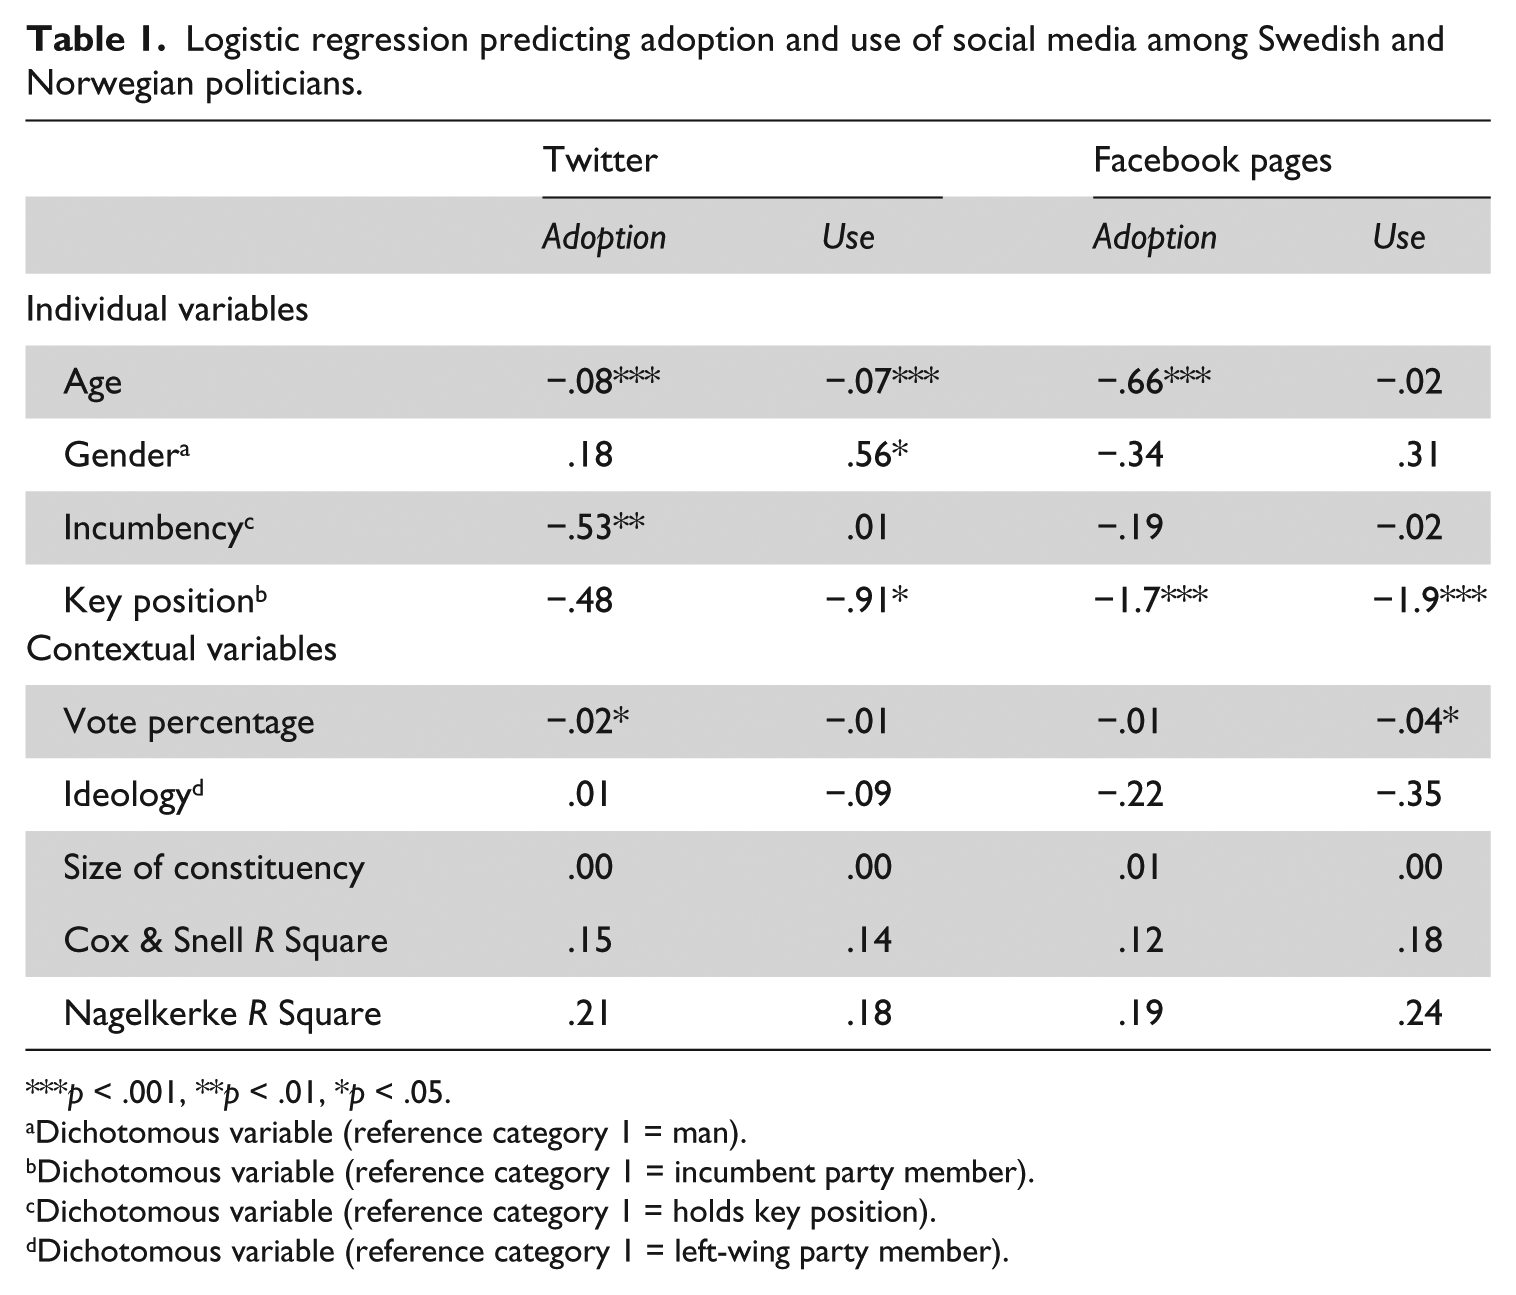
Finally, we gauge the influence of the aforementioned independent variables (pertaining to individual and contextual factors) on the adoption rates as well as the continued use rates of Twitter and Facebook Pages, respectively. For adoption, the same variables as presented in Figure 1 were employed. For use, the non-parametric nature of the variables was taken into consideration. Specifically, they were recoded into dichotomies, indicating whether or not the activity of each individual politician registered above (reference category) or below the previously reported median values for the Twitter and Facebook scales, respectively. Admittedly somewhat simplistic, the utilisation of such a scale will provide insights as to what characterises the high-end users in our data set. Moreover, as no differences pertaining to country could be discerned in our previous analyses, this particular variable was excluded from our final analytical effort. As such, these four dichotomised variables were employed as dependent variables in a series of logistic regression analyses, presented in Table 1 below.
Logistic regression predicting adoption and use of social media among Swedish and Norwegian politicians.
p < .001, **p < .01, *p < .05.
Dichotomous variable (reference category 1 = man).
Dichotomous variable (reference category 1 = incumbent party member).
Dichotomous variable (reference category 1 = holds key position).
Dichotomous variable (reference category 1 = left-wing party member).
While the reported Pseudo-R-square statistics (Cox & Snell R Square and Nagelkerke R Square, respectively) indicate that the explanatory possibilities employing these variables are somewhat limited, the results presented in Table 1 still allow us to point to some interesting significant dependencies between our measurements. Specifically, a couple of tendencies appear as particularly salient.
First, for the variables relating to the individual characteristics of the politicians, the mostly significant and negative coefficients reported for the age variable indicate that – as was expected – adoption as well as continued use of social media is dependent on the younger age of the politician. While gender only emerged as a significant (and positive) predictor for the Twitter Use variable, this finding appears to corroborate the results largely reported by previous research, suggesting that differences between male and female politicians with regard to their online activities might not be as stated as they were previously. Finally, the two variables estimating the effect of the status of each individual politician (incumbency and key position) collectively produce significant, negative coefficients for all four variables, indicating that adoption as well as active uses of the services at hand are most likely found among politicians in what is understood here as challenger positions – as well as by those who are not enjoying key positions within their respective parties.
Second, for the independent variables assessing contextual variables, only one of these emerged as significant for two of our dependent measurements – vote percentage. While the reported negative coefficients are minimal, they indicate that politicians belonging to parties with a smaller share of votes appear to be more adamant at the various facets of social media adoption and use, as detailed in Table 1.
In conclusion, the fact that contextual variables emerge as comparably poor predictors when compared to measurements dealing with individual factors suggest that explanations for social media use can primarily be ascertained by focusing on the characteristics of individual politicians. As such, the results presented in Table 1 are indicative of what could be referred to as an ‘underdog effect’, seeing as social media are primarily being adopted and used more extensively by younger politicians, often in ‘challenger’ positions both within their respective parties as well as in terms of general incumbency status. This finding and those reported previously are further dealt with in the following, final section of the article.
Discussion
Political use of new communication technology continues to raise interest among political scholars and practitioners alike. As most research looking into these issues has been performed during times of intensive political campaigning, this article provides useful insights into the ‘routine’ social media activities of elected officials in two advanced democracies – Norway and Sweden. In the following, we discuss what we feel are four of the most pertinent results to emanate from the reported study. In so doing, we also acknowledge some of the limitations of our selected approach, suggesting possible future studies for researchers interested in similar topics.
First, while the results presented here indicate some variation regarding the level of social media activity of politicians as measured through our activity index, the overall description of such use as reported in Figure 2 must be described as limited at best. When taking the adoption rates, reported in Figure 1, into account, one combined interpretation could be of the politician wanting to try these services out (i.e. starting an account), but subsequently failing to keep up his or her use of the adopted service. Indeed, it is difficult to provide any clear recommendations as to what level of use could be deemed sufficient, recommendable or even superior – but when the median scores of posts per day come out as low as reported in this study, we should be precautious to make any bold claims regarding the day-to-day social media activities of politicians (Larsson, 2013b). Indeed, if the notion is that professionalised campaigns are ‘characterized by being permanent, although with varying intensity’ (Strömbäck, 2007: 54), the low levels of social media activity presented here raise questions regarding how we should understand the term at hand. Future studies, looking into these issues with similar or different rationales for analysis, should be able to provide points for comparison in this regard.
Furthermore, the results indicated that Twitter adoption as well as use rates were slightly higher than the Facebook counterparts. As Twitter use in the two case countries is often reported at rather low levels (e.g. Larsson and Moe, 2013), the popularity of Facebook among the general populace becomes relatively sizeable (e.g. Nordicom, 2012). Our results here indicate that politicians are generally more present and more active on the former of these two, suggesting a potential online communicative mismatch between those electing and those elected. While the demographics of social media use can vary considerably in different contexts (e.g. Hargittai and Litt, 2012; Hargittai and Walejko, 2008), use of Twitter in the Scandinavian countries has mostly been associated with elite, urban, media-savvy groups (e.g. Christensen, 2013; Larsson, 2013c). In sum, then, if Scandinavian politicians wish to engage more clearly with everyday voters and regular citizens, outside of metropolitan power elites, they might be well served to look beyond Twitter for their social media activities.
Finally for our first point, while our focus here laid on Facebook Pages – specifically designed for more professional purposes – it is entirely possible for politicians to employ their personal Profiles for such activities. While this limitation of the work performed should be duly noted, the focus on Pages can be motivated by our goal to track degrees of political professionalisation in social media, as previously mentioned.
Second, previous research has indicated that the activities studied here could be expected to vary ‘not only across countries but also across different party types’ (Lisi, 2013: 262). Perhaps because of the similarity of the two countries under scrutiny, no variations regarding this factor could be discerned. Indeed, future research might find it wise to gauge these practices employing ‘least-similar designs’, comparing use patterns between countries that are more dissimilar in relevant respects. That being said, the fact that no significant differences could be discerned between either the countries or party groups at hand is interesting, especially as Norway was scheduled to undergo a parliamentary election the same year as the data collection took place. Perhaps the campaign machineries of the Norwegian parties had not geared up properly yet – or perhaps this result could be understood in terms of an ongoing deideologization of online activities at the hands of politicians, where not only left-wing ideologists make clear efforts online (as discussed by Lilleker et al., 2011; Schweitzer, 2008; Vergeer et al., 2012).
This brings us to our third point, which concerns our attempts at explaining social media adoption and use, as reported in Table 1. The variables employed were understood as pertaining either to the individual politician or to the characteristics of their affiliated political party. Given that the former of these groups of variables emerged as significant predictors to higher degrees than their latter counterparts, it would appear that the characteristics of the individual politician play a bigger part in determining adoption of and continued activity on social media than contextual party characteristics. Such tendencies towards higher merit for variables testing for individual factors are distinguishable also when looking at the high-end users of the services under scrutiny – the outliers identified in Figure 2. While the number of outliers is perhaps somewhat limited, the politicians found here are all associated with a wide variety of political parties, differing with regard to both size and ideology. As no pattern of either party size or ideology can be distinguished, the role of the individual politician in contrast with his or her party needs to be further problematised in future research efforts. In sum, then, the combined results seem to suggest that the shift from more party-oriented online approaches to more individualised activities (suggested by Vergeer, 2012) is tangible also in party-centred democracies like the ones under scrutiny here (e.g. Karlsen, 2012).
This tendency towards individualism also relates to our fourth and final point – what we previously dubbed as an ‘underdog effect’ – that is, those politicians in ‘disadvantaged competitive positions’ (Enli and Skogerbø, 2013: 14). As reported in Table 1, the most active users of social media in our sample tend to be younger, non-incumbents and outside of the immediate political hotspots. Echoing the suggestions of previous research, this finding suggests that activity on Twitter and Facebook Pages is perhaps best understood as an ‘opening for the outsiders’ (Strandberg, 2009: 835) rather than the preferred channel of choice of more established politicians. While the previously mentioned identification of outliers in Figure 2 does indeed provide some contrast to these findings, the overarching results seem to indicate that politicians holding key positions are not, for the most part, exhibiting patterns of exuberant activity on the services studied here. Again, we can point to the result that most of the politicians identified as outliers in Figure 2 tend to be what could be called ‘mid-level’ in their respective careers – while they have secured a seat in parliament, they do not for the most part enjoy key positions or especially prestigious professional portfolios. One possible explanation for this result could be the supposedly relatively low cost associated with operating a social media account (Williams and Gulati, 2012: 55), especially when considering the financial resources often associated with the launching and continued operation of a sleek, sophisticated website (Gibson, 2004; Margolis and Resnick, 2000; Strandberg, 2009). Moreover, as established politicians could be expected to have more access to traditional media outlets through which to convey their messages, our identified challenger or indeed ‘underdog’ politicians could be expected to take to social media to find the same opportunities (e.g. Jackson and Lilleker, 2009: 240; Kalnes, 2009). With this in mind, we should add that given the basic tenets of the previously discussed normalisation hypothesis, results like these might be expected to shift over time, clearing the online way for those parties that are rich in resources (Schweitzer, 2008, 2011). Future scholarly efforts studying these issues on- and off election season should be able to provide further insights regarding these matters.
In closing, while the analytical rationales employed here have adopted a multi-modal approach, taking both Twitter and Facebook into account (as suggested by Lewis et al., 2013), the types of quantitative approaches presented here can only further our knowledge to a certain extent. While this article has indeed provided a structural, ‘big picture’ of social media use at the hands of Norwegian and Swedish politicians, the employed approach admittedly suffers from limitations, some of which have already been brought up. Based on our findings, we suggest for other interested researchers to focus more on the details pertaining to specific social media activities, distinguishing between the different types of Twitter messages sent and the specific direction of Facebook messages posted by politicians. Such, more qualitative inquiry, focusing specifically on the actual content of these online transactions, would be not only enriching on its own but could also prove useful when variables are to be constructed for future quantitative efforts.
Footnotes
Funding
This research received no specific grant from any funding agency in the public, commercial or not-for-profit sectors.