
Abstract
In response to the challenge posed by electrical breakdown occurrences during the conventional current density electrolytic polishing of large-scale stainless steel workpieces, this investigation delved into the parameters of low current density electrolytic polishing process. The study scrutinised the surface morphology and corrosion resistance of 304 stainless steel, employing tools such as metallographic microscopy, a roughness gauge, and an electrochemical workstation. Within a sulphuric acid–phosphoric acid-based electrolyte characterised by a volume ratio of 1:2, the optimal mass concentration ratio of salicylic acid and saccharin was ascertained to be 3:3. By configuring the process parameters to 10 A dm−2 and 20 min, outcomes of electrolytic polishing were obtained that stood on par with the conventional current density approach. The stainless steel surface exhibited a surface roughness measuring a mere 0.08 µm and characterised by a corrosion current density of 1.907 × 10⁻⁸ A cm−2 and a corrosion potential of −0.0965 V.
Keywords
Introduction
Renowned for its exceptional heat resistance, corrosion resistance, and workability, 304 stainless steel finds extensive utility across diverse industries, encompassing marine engineering, manufacturing, construction, and the medical field.1–6 However, in practical application, the effects of friction and collisions on the oxide layer of the stainless steel surface result in its degradation, consequently expediting the onset of corrosion reactions. Electrochemical polishing, as a non-destructive surface treatment process,7,8 has gained considerable attention. Specifically, electrolytic polishing facilitates the formation of a stable chromium-rich oxide film on the surface of stainless steel, thereby enhancing its corrosion resistance. At the same time, electrolytic polishing effectively dissolves active sites such as manganese, sulphur and other non-metallic inclusions, 9 further stabilising the surface condition. Additionally, electrolytic polishing can also enhance the aesthetic appearance of the surface.
The mechanism of electrochemical polishing remains unclear to this day, 10 making it challenging to deduce optimal operating parameters directly from theoretical considerations. In current practical production, the identification of optimal process parameters aligning product characteristics necessitates ongoing exploration. 11 Phosphoric acid–sulphuric acid-based solutions are the most commonly used electrolyte for electrochemical polishing austenitic stainless steel. Chen et al. 12 investigated the impact of the volume ratio of phosphoric acid to sulphuric acid on the polishing effect. At 70 °C, a volume ratio of 2:1 of phosphoric acid to sulphuric acid resulted in better surface quality for austenitic stainless steel. In order to further improve the polishing effect and corrosion resistance of stainless steel surfaces, researchers often integrate diverse additives into phosphoric acid–sulphuric acid polishing solutions. 13 Lee 14 indicated that when the ratio of H2SO4 and H3PO4 in the electrolyte is 4 and 6, the addition of 10% glycerol resulted in the attainment of a highly refined surface with a roughness of 0.05 µm. Sulphosalicylic acid, as a corrosion inhibitor containing carboxyl and thiol groups, can form stable complexes with metal ions to resist corrosion. Mariem 15 indicated that adding 2% sulphonated salicylic acid to the electrolyte reduced corrosion products on chromium-nickel-iron alloy surfaces and achieved more uniform electrolytic polishing. Saccharin has consistently been one of the most commonly used organic additives.16–18 During the polishing process, it significantly enhances the wetting and dispersion properties of the polishing solution, contributing to a more uniform polishing process. Furthermore, this compound can form a protective film on the metal surface, reducing oxidation and other adverse reactions, effectively improving the quality of the passivation layer.
In addition, current density and polishing time play critical roles in determining the polishing effectiveness and corrosion resistance of stainless steel surfaces. The effect of different current densities on the passivation effectiveness of stainless steel surfaces was investigated in a study by Krzysztof. 19 In a phosphoric acid–sulphuric acid polishing solution with a volume ratio of 1:4, after electrochemical polishing at 50 A dm−2, the chromium-to-iron ratio (Cr/Fe) was 6.7. However, after treatment at 1000 A dm−2, the chromium-to-iron ratio decreased to only 1.9. This result indicated that different current densities could affect the composition of the passivation layer on the stainless steel surface. A high chromium-to-iron ratio indicates the formation of a chromium-rich oxide layer on the surface, significantly enhancing the corrosion resistance of stainless steel. Zhou et al. 20 investigated the effects of electrochemical polishing process parameters including polishing time, current density, and anode-cathode distance on the electro-polishing effect in a phosphoric acid (30%–60%)–sulphuric acid (20%–40%) based electrolyte. Under optimal process conditions (current density of 60 A dm−2, a polishing time of 1 min, and an anode-cathode distance of 5 cm), the surface roughness of 304 stainless steel decreased from 0.12 µm to 0.044 µm. However, this process utilised a relatively high polishing current density, which could lead to issues such as excessive gaseous oxygen emission and overheating of the electrolyte when dealing with large-sized workpieces. These problems could result in undesirable phenomena such as defects, 21 localised scorching, and excessive corrosion. To the best of our knowledge, research on electrochemical polishing processes for stainless steel under low current density conditions is relatively limited. Therefore, this study aims to develop an electrochemical polishing process suitable for stainless steel under low current density conditions by optimising additive ratios, current density and polishing time parameters.
This study utilised a phosphoric acid–sulphuric acid-based electrolyte with salicylic acid and saccharin as additives to explore the optimal electrolyte formulation. Subsequently, electrochemical polishing treatment was conducted on 304 stainless steel using a lower current density based on this electrolyte. Surface roughness and microstructural morphology were employed as evaluation criteria for the polishing effect, enabling the determination of the best polishing process. The corrosion resistance of stainless steel under these process conditions was also investigated. By comparing the microstructural morphology and electrochemical performance of 304 stainless steel after low current density polishing and conventional current density polishing, it was observed that the corrosion resistance of stainless steel after electrochemical polishing at low current density was comparable to that achieved by conventional current density electrochemical polishing. Under specific conditions, the low current density electrochemical polishing can effectively replace conventional current density electrochemical polishing while yielding similar polishing effectiveness.
Materials and methods
The chemical reagents (phosphoric acid, sulphuric acid, ethylene glycol, glycerol and other additive materials) used in this experiment were of analytical grade and were purchased from Shanghai Titan Technology Co., Ltd The 304 stainless steel sheets used in the experiment were produced by Shanxi Taiyuan Iron and Steel Group and were cut into small pieces measuring 1 cm × 3 cm as experimental substrates. The chemical composition of these sheets is presented in terms of weight percentage (%), as follows: Cr 18, Ni 8.6, Si <1.0, C 0.08, S <0.035, Mn <2.0, P <0.045, with the remaining component being Fe. The water used was deionised water.
The surface treatment process for 304 stainless steel is illustrated in Figure 1, presenting both the process flow and the schematic diagram. The process flow includes grinding, electrolytic polishing, passivation, neutralisation and cleaning-drying steps. Firstly, the 304 stainless steel sheets were polished using 500, 800 and 1000 grit sandpaper sequentially. Subsequently, we carried out the electrolytic polishing step. The apparatus consists of a high-frequency switching power supply, polishing solution, and electrodes. The 304 stainless steel sheet served as the anode, while the copper sheet acted as the cathode, with an anode-to-cathode area ratio of 2:1 and an anode-cathode spacing of 40 mm. The operating temperature of the electrolytic polishing solution was set at 65 °C. Following the polishing, passivation and neutralisation were performed. The passivation solution was a 35% volume fraction nitric acid, and the neutralisation solution was a 5% sodium carbonate solution. Lastly, the specimens were cleaned sequentially for 3 min each with distilled water and ethanol using an ultrasonic cleaning machine, followed by drying.
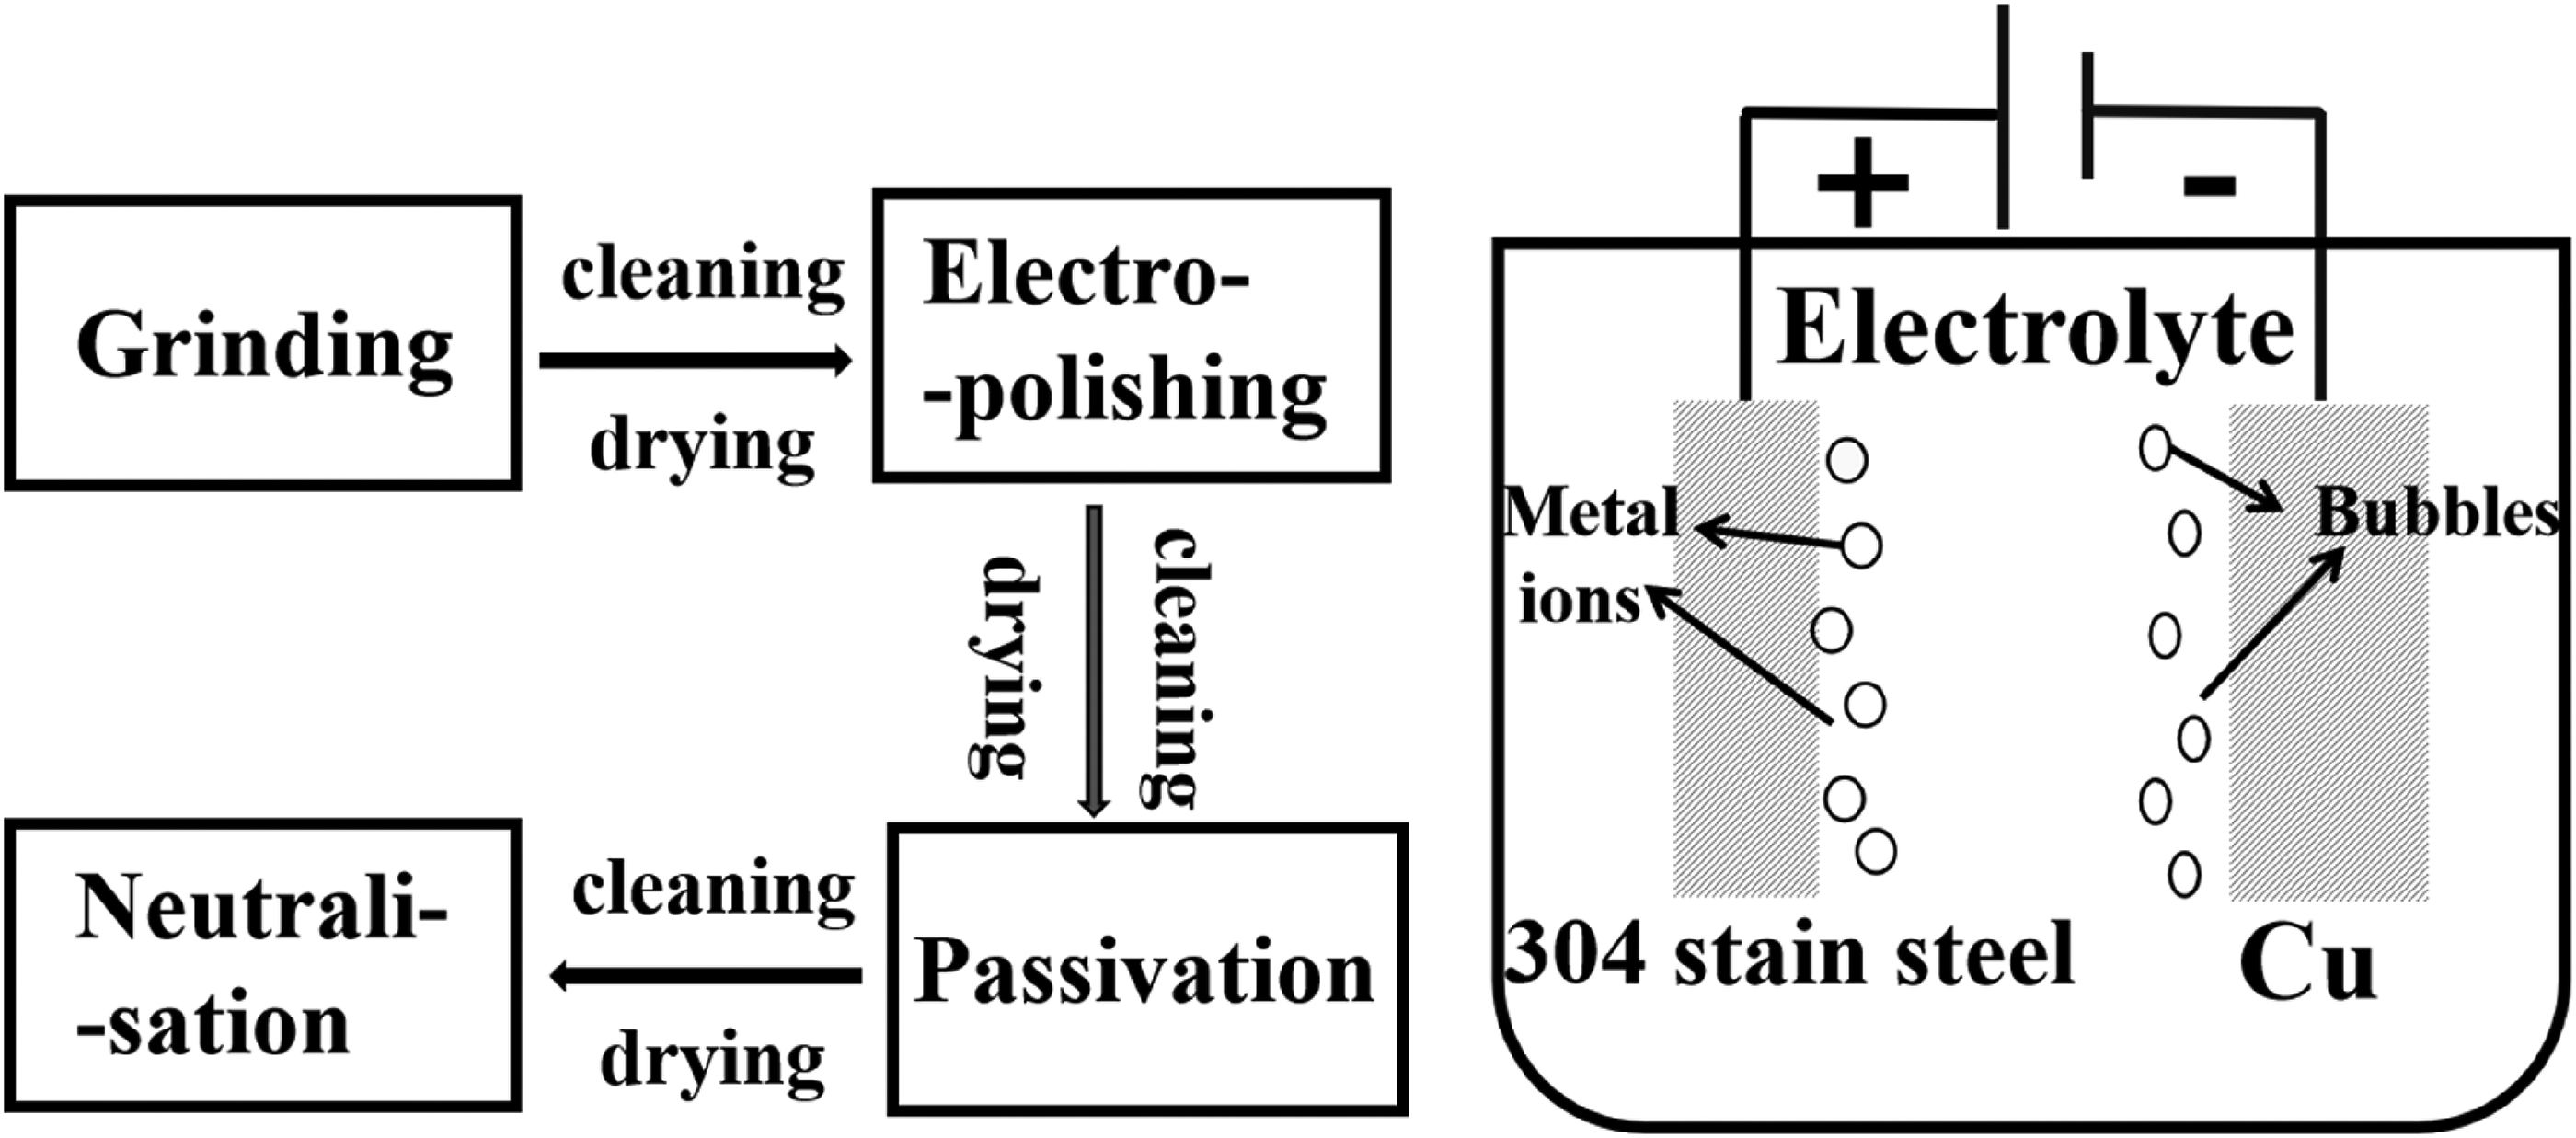
Flow chart and schematic diagram of the electrolytic polishing process.
In order to thoroughly investigate the effects of the electrolytic polishing process on surface roughness, morphology, and corrosion resistance, this study focuses on three key factors: the mass concentration ratio of saccharin to salicylic acid, polishing time, and current density. Through systematic single-factor optimisation experiments for each of these parameters, we aim to attain the optimal polishing process conditions. Qu et al. 22 identified an optimal dosage of 3 to 5 g L−1 for salicylic acid when employed as a brightening agent in the polishing solution. The literature 23 has explored the influence of saccharin, utilised as an electrolyte additive, on the corrosion behaviour of Co and CoFe alloy coatings, with concentrations ranging from 1 to 7 g L−1. Drawing upon existing literature and the collective experience of our research group, we standardised the total additive quantity to 6 g L−1. A series of electrolyte solutions were prepared with varying mass concentration ratios of saccharin to salicylic acid, using the nomenclature X:Y. Here, X represents the mass concentration of saccharin (g L−1), and Y represents the mass concentration of salicylic acid (g L−1). Referencing the process parameter settings reported by Zhou et al., 20 we further reduced the current density and systematically investigated the impact of low current densities (6 A dm−2, 8 A dm−2, 10 A dm−2, 12 A dm−2 and 14 A dm−2) on the surface quality of stainless steel. Considering the inverse relationship between polishing time and current density, 24 we appropriately extended the polishing time and selected a range from 10 to 30 min for experimentation. The different levels of these key factors are listed in Table 1.
Factors and levels in a one-factor experiment.
The surface morphology of the polished 304 stainless steel was analysed using the Shanghai BM-ML1000 metallographic microscope. Images were taken at three different positions on the surface after each electrochemical polishing, selecting representative surface morphologies. Surface roughness profiles were obtained using the TIME-3200 surface roughness tester, and the surface roughness (Ra) was calculated. To ensure high reliability in surface evaluation, the polished stainless steel samples were tested at three points on the same sample. Each point was measured three times, and the average value of the three measurements for each point within a range of ±10% was considered valid data. Finally, the average value of the three measured points was taken as the roughness value for each stainless steel sample.
Corrosion resistance of the stainless steel surface was tested using a Dutch Lvium electrochemical workstation. 304 stainless steel served as the working electrode, a Pt electrode as the counter electrode, and a saturated calomel electrode (SCE) as the reference electrode. The electrolyte used was a 3.5% NaCl solution. The open-circuit potential of the samples was tested for a duration of 800 s. Once the open-circuit potential stabilised, dynamic potential polarisation curves measurements and electrochemical impedance spectroscopy (EIS) tests were conducted. For the dynamic potential polarisation curve measurement, the scan rate was set at 0.5 mV s−1, and the scanning range was from −0.7 V to 0.6 V (vs Ag/AgCl). In the case of EIS testing, the amplitude was 10 mV, and the frequency range spanned from 105 Hz to 10−2 Hz.
Results and discussion
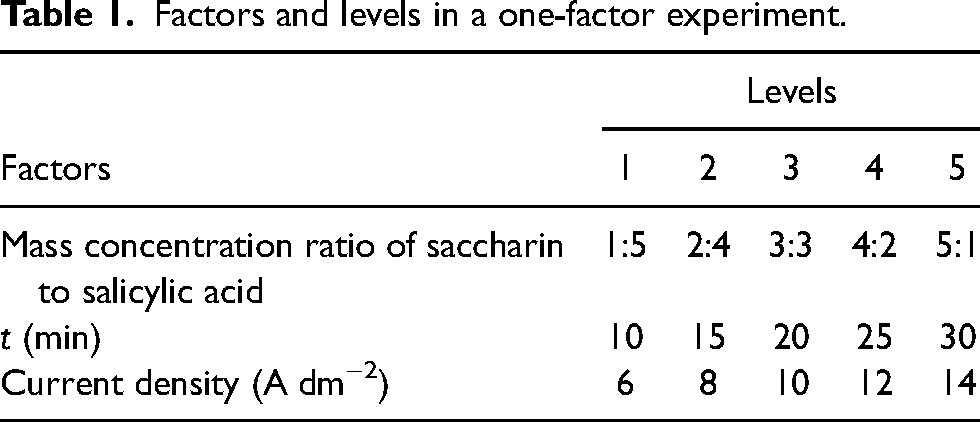
The profile curves record the peak-valley structure or height variation of the sample surface, which can effectively describe surface roughness or irregularities. Surface roughness, Ra, can be determined through analysis of the profile curves. Given the undetermined optimal current density and electropolishing time, our initial optimisation used conventional parameters (current density of 60 A dm−2 and electropolishing time of 3 min). Under the experimental conditions, 304 stainless steel was polished using electrolytic polishing solutions of different compositions. The surface profile curves after polishing are shown in Figure 2(a). As can be seen from the figure, as the concentration ratio of saccharin to salicylic acid increases, the fluctuation amplitude of the contour curve shows a trend of decreasing and then increasing. When the mass concentration ratio of saccharin to salicylic acid is 3:3, the profile curve is the flattest. Figure 2(b) presents the roughness of 304 stainless steel as a function of electrolyte composition. The trend of roughness is consistent with the results of the contour curves described earlier. The roughness of the polished stainless steel reached a minimum value of 0.088 µm when the concentration ratio of saccharin to salicylic acid was 3:3. The above results indicate that saccharin and salicylic acid have a synergistic effect on regulating the surface quality of stainless steel and can be used to optimise the surface properties of stainless steel in a specific concentration range. Figure 2(c) shows the surface topography of stainless steel. From the figure, it can be seen that as the concentration ratio of saccharin to salicylic acid increases, the surface of stainless steel is gradually flattened and the point pits are reduced. This may be due to the fact that saccharin can react with the impurities on the surface and form soluble complexes which help in removing the impurities from the surface. 23 When the mass concentration ratio exceeded 3:3, corrosion pits and areas of significant oxidation were observed on the stainless steel surface. This may be due to the fact that as the salicylic acid content decreases, fewer salicylic acid molecules are involved in the reaction on the stainless steel surface, thus failing to form a sufficiently protective film. 15 Based on the stainless steel surface profile curve, roughness and surface morphology, an electrolyte with a mass concentration ratio of saccharin to salicylic acid of 3:3 was selected as the polishing solution for the subsequent study in this article.
The samples polished with electrolytes solution with saccharin and salicylic acid mass concentration ratios of 1:5, 2:4, 3:3, 4:2 and 5:1: (a) profile curves, (b) roughness and (c) surface morphology.
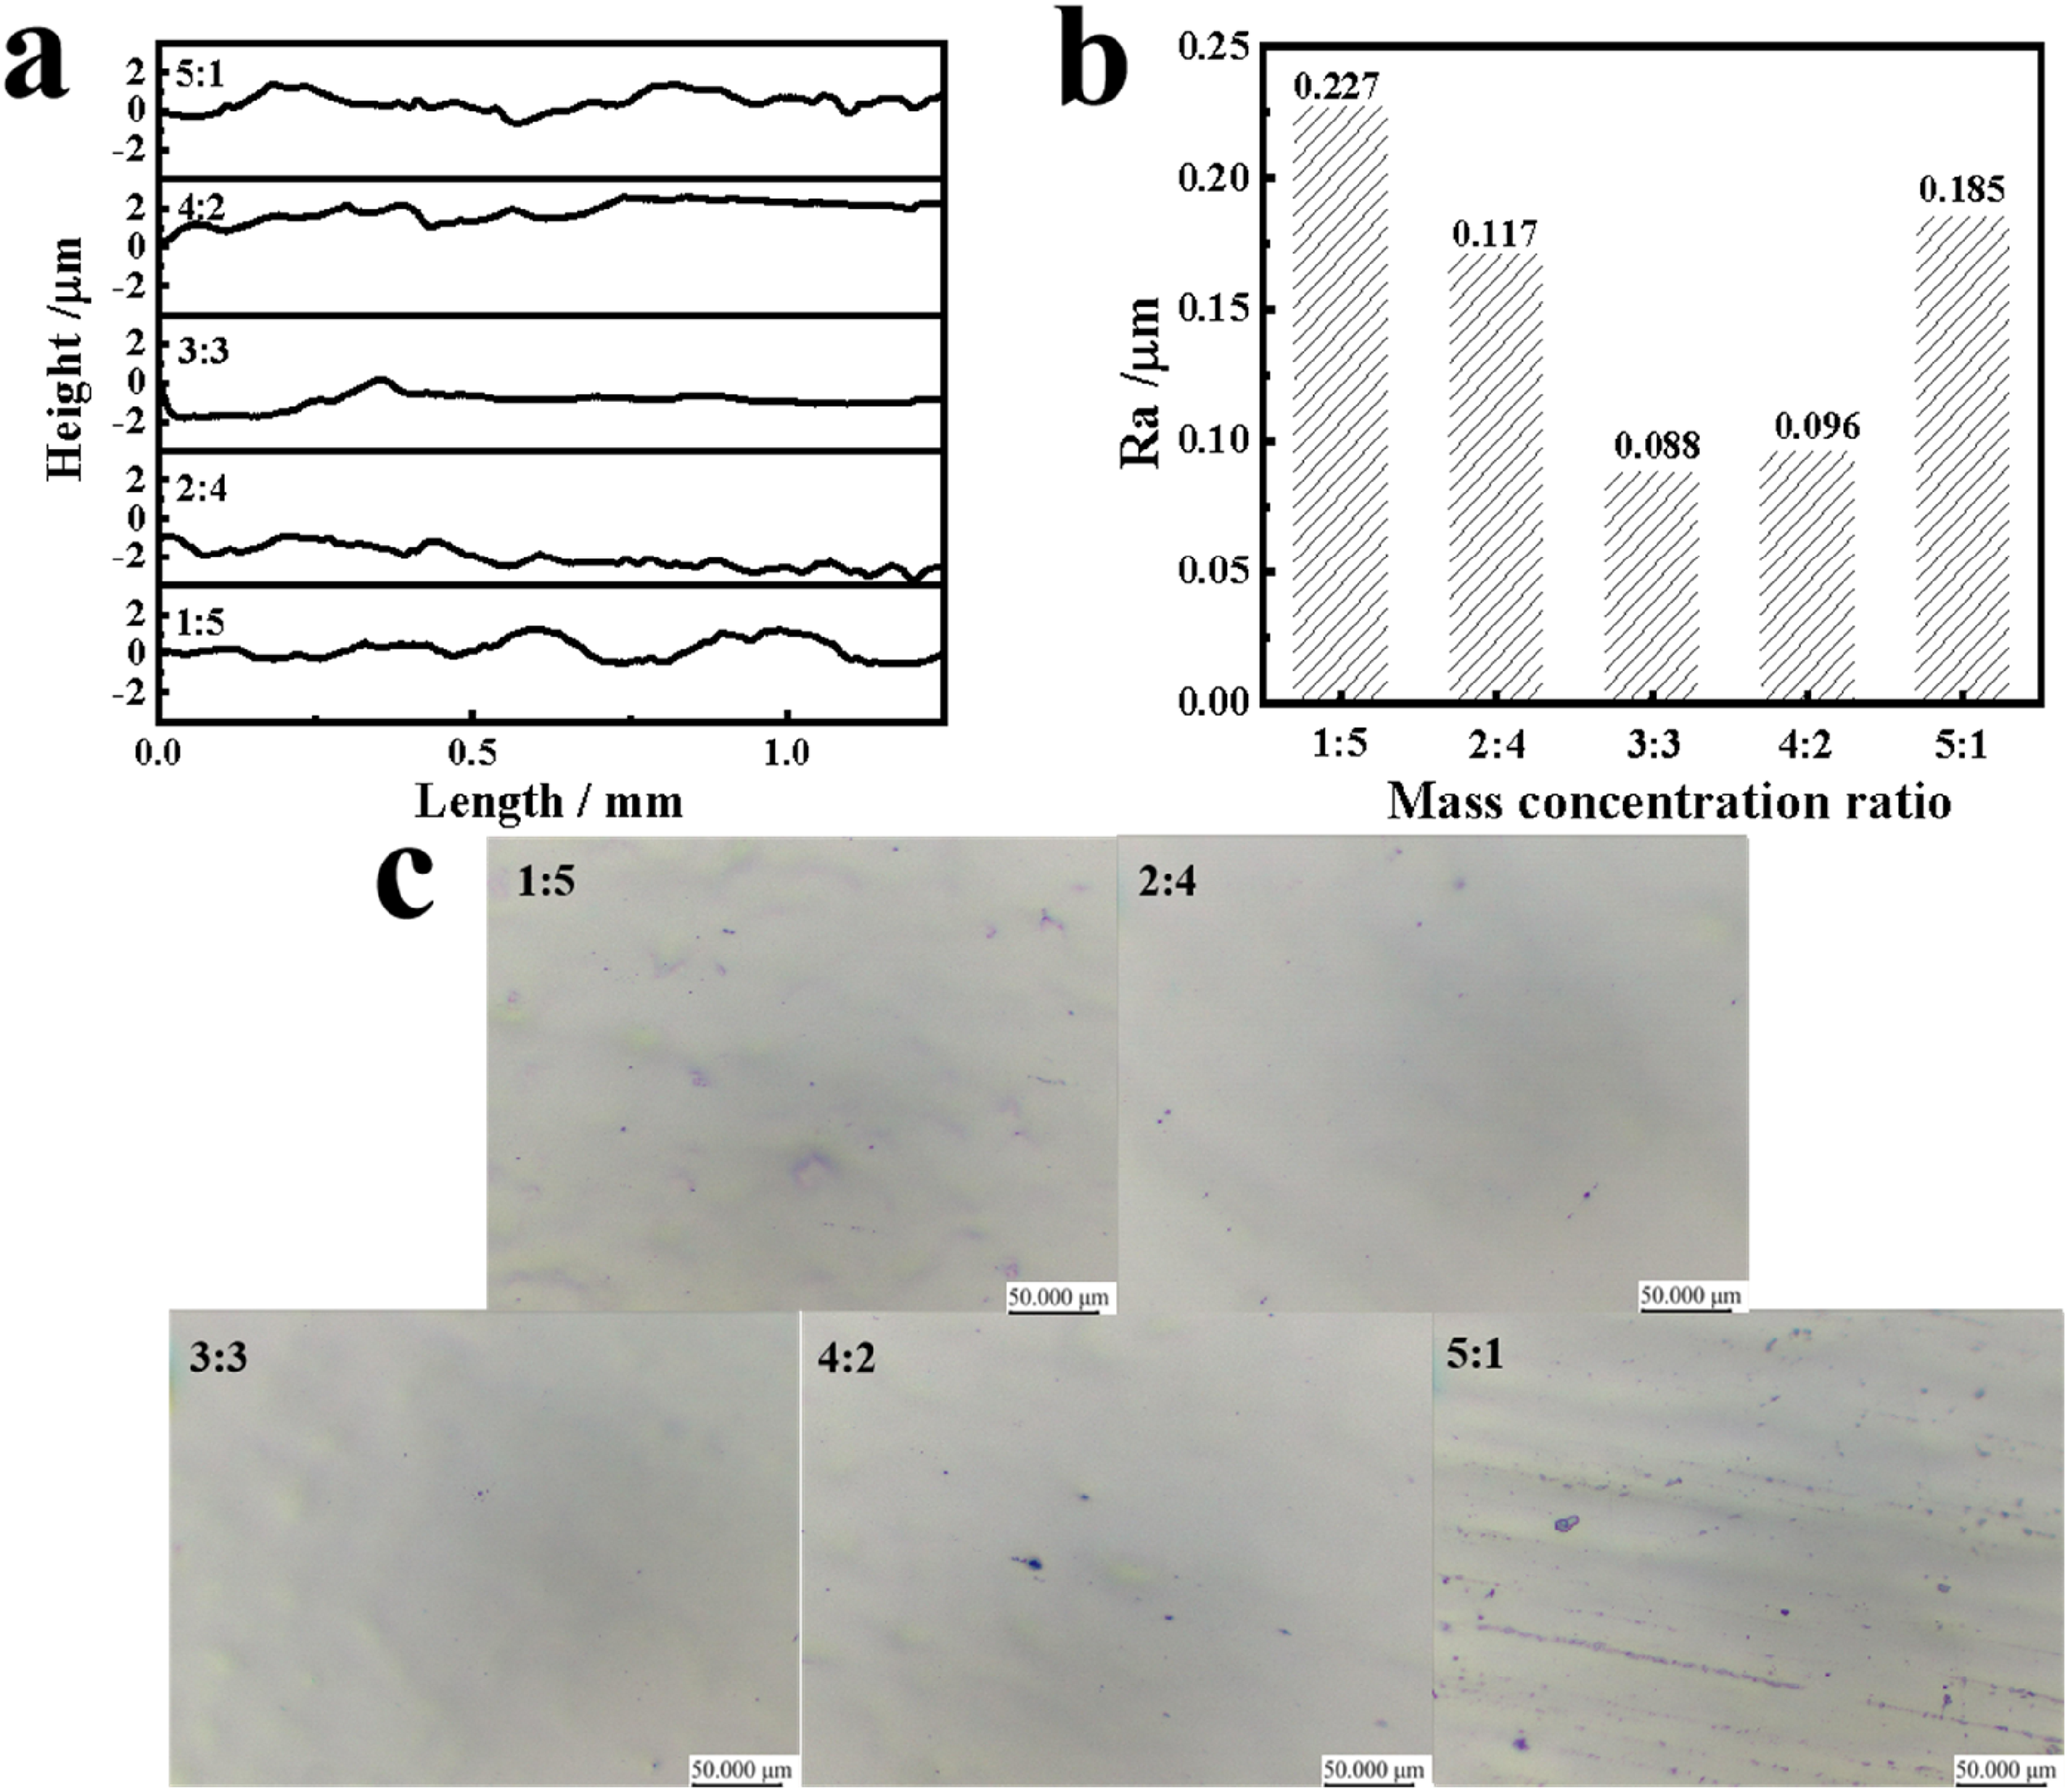
The effect of current density on surface quality is shown in Figure 3. As can be seen from Figure 3(a), with the increase of current density, the fluctuation amplitude of the contour curve shows a trend of first increasing, then decreasing and then slowly increasing. When the current density is 10 A dm−2, it can be observed that the contour curve is very flat at this time, and the fluctuation amplitude is also the smallest. At different current densities, the roughness trend of the stainless steel surface is consistent with the corresponding contour curve changes (Figure 3(b)). From Figure 3(c), we can observe that the morphology of the stainless steel surface shows significant changes after polishing at different current densities. At current densities lower than 10 A dm−2, there are more obvious unpolished scratches and unpolished defect pits on the sample surface. This may be due to the current density is small, the stainless steel surface convex metal dissolution slow, resulting in a larger surface roughness, up to 1.77 µm, when the profile curve fluctuations are also larger. When the current density is 10 A dm−2, the surface of the sample has no obvious scratches, corrosion pits, matrix defect pits, the surface quality is good and the roughness value is as low as 0.08 µm. when the current density is greater than 10 A dm−2, the surface of stainless steel began to appear uneven corrosion pits. This is due to the fact that with the further increase in current density, the surface of the stainless steel specimen precipitation of oxygen intensified, and accompanied by the production of a large number of air bubbles. Bubbles and the heat generated cannot be released from the electrolytic bath in time, the local polishing liquid flow is uneven, the anode surface is easy to be over-corrosion, resulting in the appearance of more corrosion pits, so that the surface film layer is destroyed, affecting the quality of surface polishing. 7
Samples obtained after treatment with different current densities: (a) profile curves, (b) roughness and (c) surface morphology.
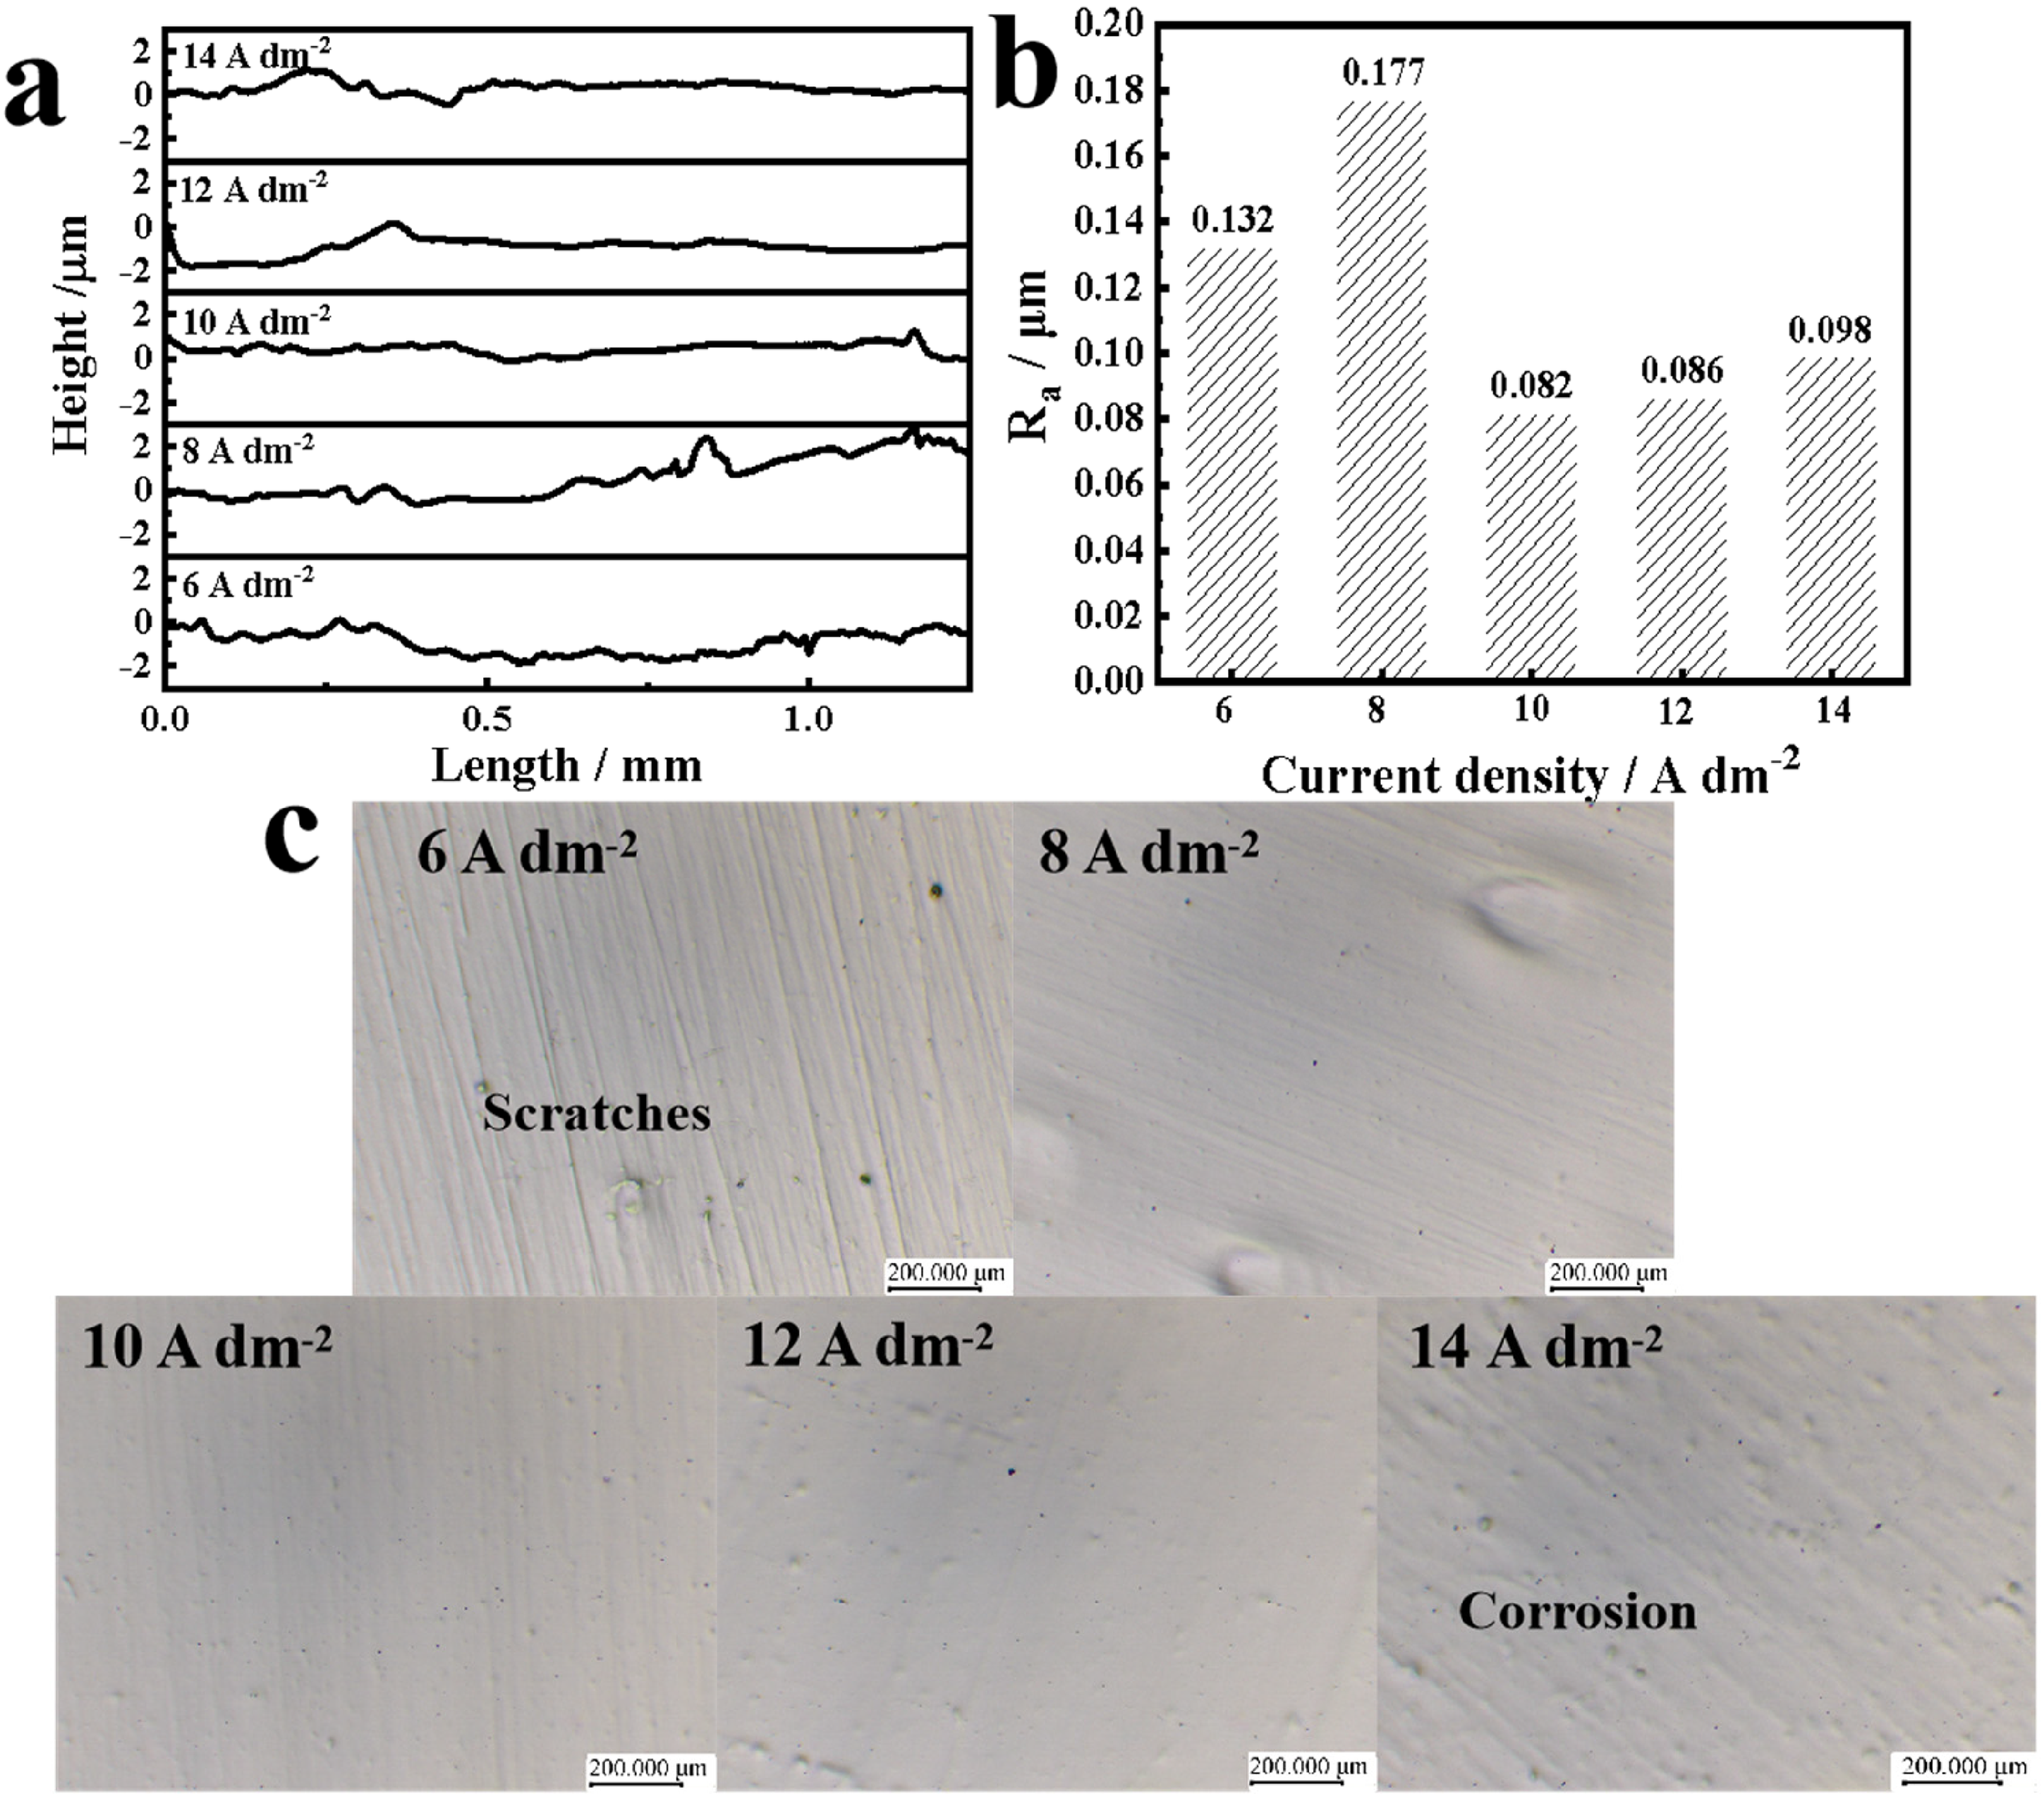
Figure 4 shows the effect of different polishing time on surface quality. From Figure 4(a), it can be seen that the fluctuation amplitude of the contour curve shows a tendency of decreasing and then increasing with the increase of polishing time. When the polishing time is 20 min, it can be observed that the fluctuation amplitude of the contour curve at this time is smaller and the flattest. At different polishing times, the roughness value first decreases slightly and then shows an increasing trend (Figure 4(b)). Figure 3(c) shows the metallographic diagram of stainless steel under different polishing time light. When the polishing time is lower than 20 min, the grinding scratches on the surface of stainless steel are not completely removed, and there are corrosion spots with high surface roughness. When the polishing time is 20 min, the surface is flat and bright without obvious bumps, the polishing effect is obviously improved, and the roughness value reaches the lowest value of 0.081 µm. When the polishing time is further increased to 30 min, there are obvious bumps and large pitting corrosion on the surface, and the surface quality decreases, and the roughness reaches the highest (0.122 µm). This is because the long polishing time led to the destruction of the stainless steel surface by over-polishing. According to the above one-factor experiment to determine the optimal polishing conditions: saccharin and salicylic acid mass concentration ratio of 3:3, current density of 10 A dm−2, polishing time of 20 min.
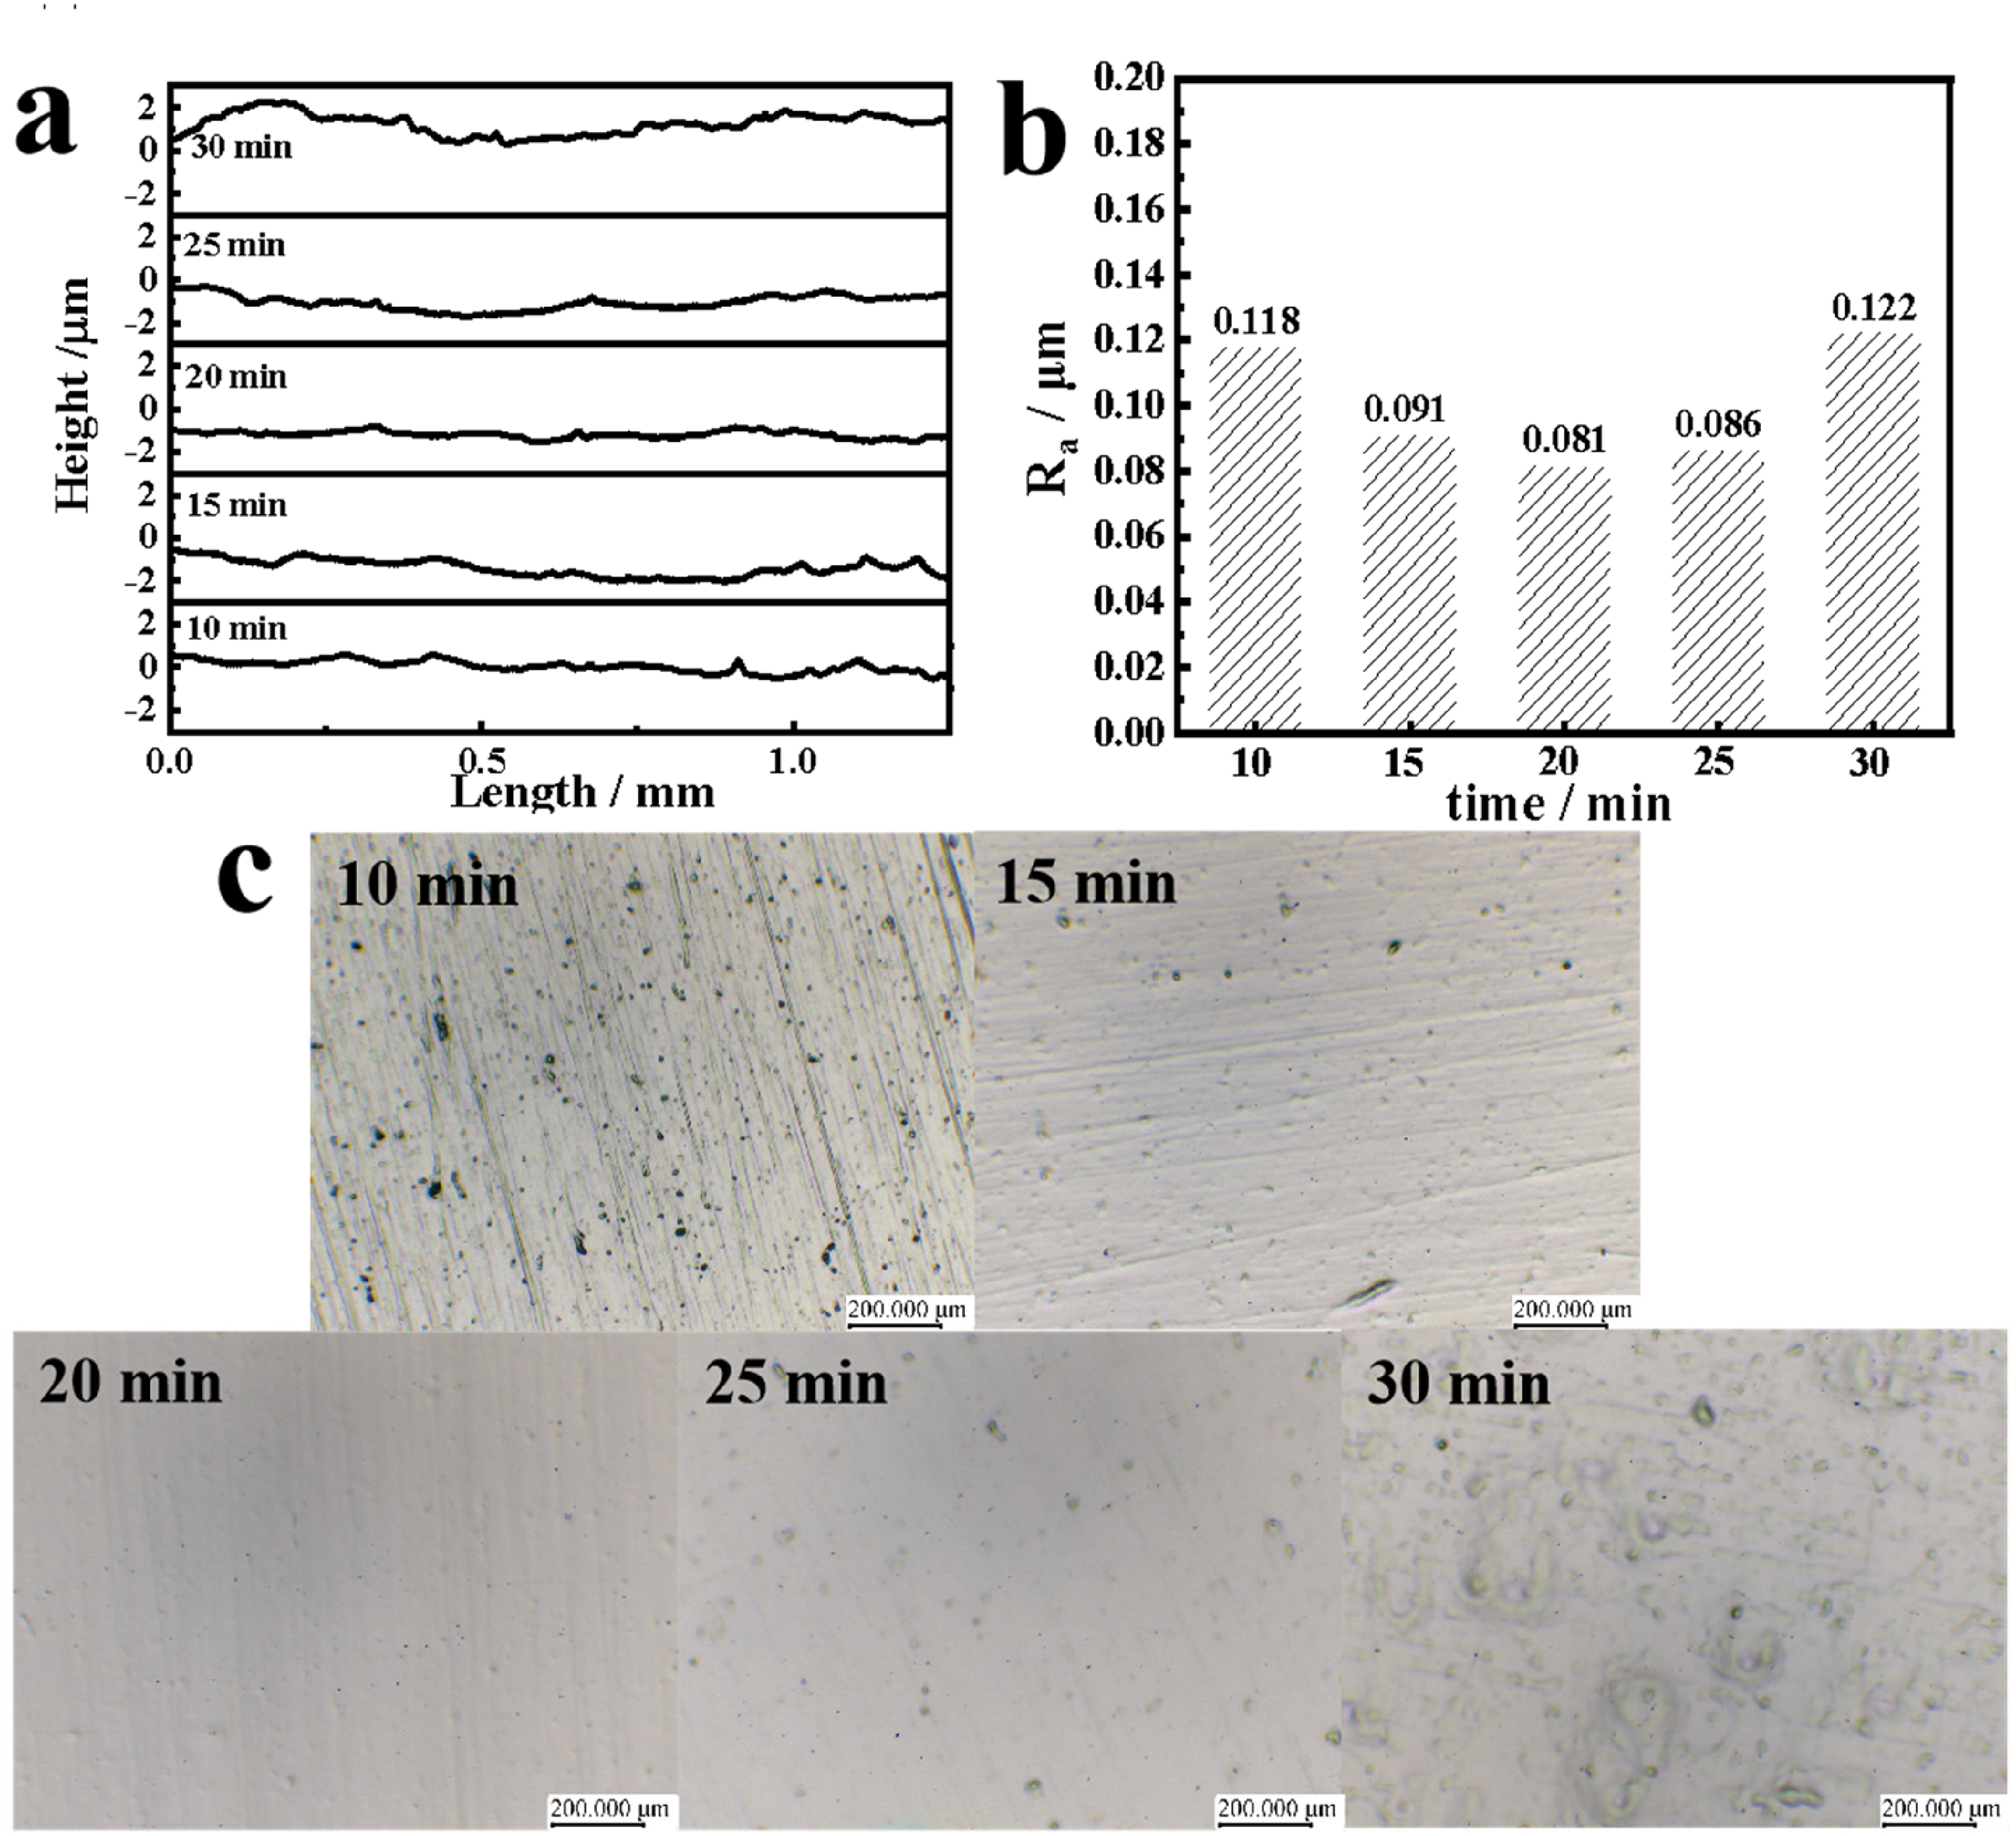
Samples obtained after treatment with different time: (a) profile curves, (b) roughness and (c) surface morphology.
Figure 5 shows the surface morphology before polishing as well as after polishing using the optimal low current density polishing parameters (10 A dm−2, 20 min) and conventional current density parameters (60 A dm−2, 3 min). In Figure 5(c), it can be clearly observed that the surface of the stainless steel substrate after polishing with 1000 grit sandpaper has a serious problem of scratches, and these scratches are of different depths. After polishing at 10 A dm−2 for 20 min (Figure 5(a)), the stainless steel surface was not only free of scratches but also free of excessive oxidation. Overall, the surface showed fine and smooth characteristics and no obvious defects. Compared with the surface after polishing at normal current density (Figure 5(b)), there was no significant difference in surface quality between the two treatment conditions, but there was a significant improvement compared with the untreated stainless steel.
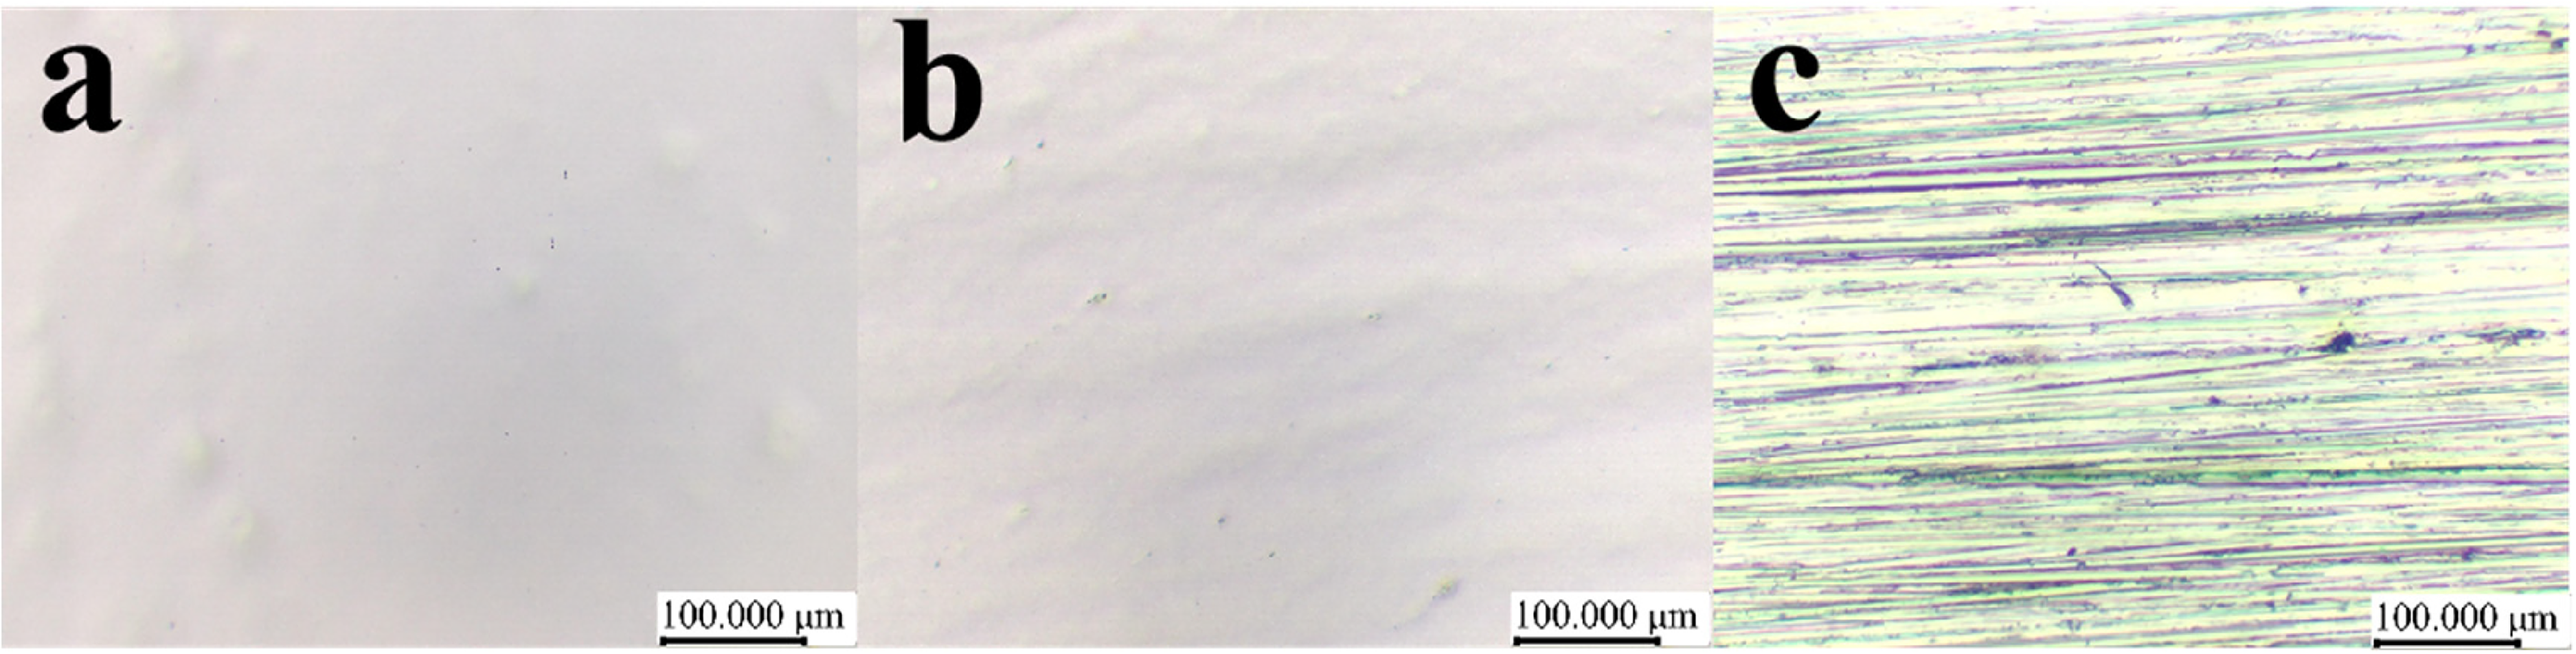
Comparison of morphology of low current density, regular current density and untreated 304 stainless steel: (a) 10 A dm−2, 20 min; (b) 60 A dm−2, 3 min; (c) untreated.
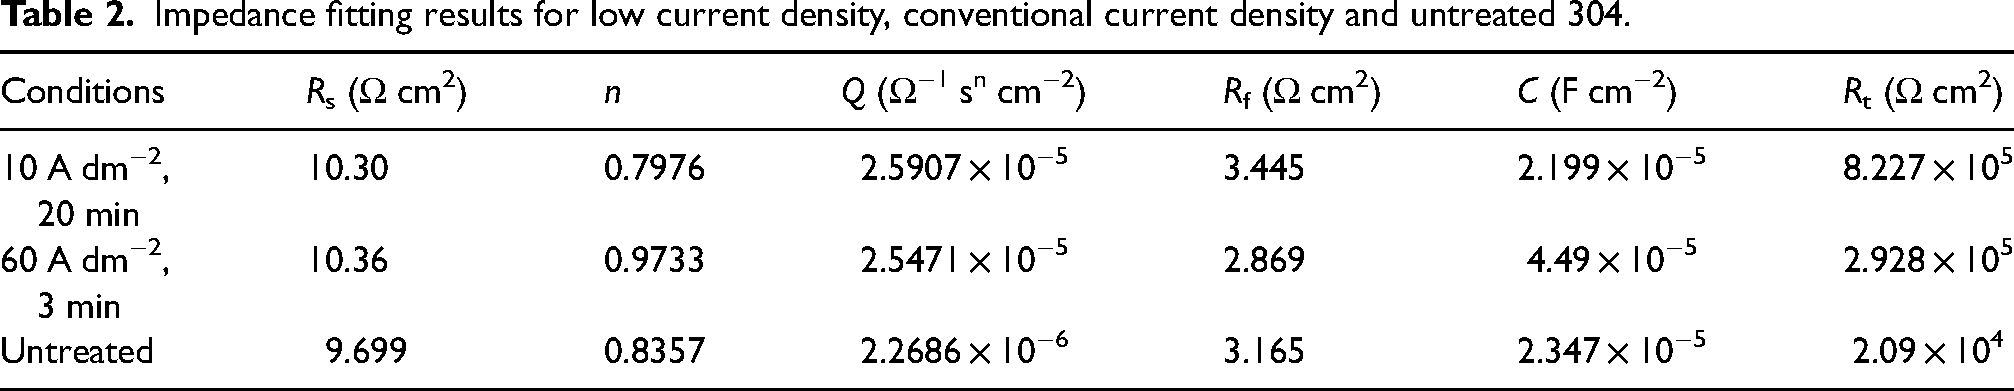
The impedance was fitted using the equivalent circuit from Figure 6, 25 where Rs represents the electrolyte resistance, Rf stands for the film resistance, Rt is the interface charge transfer resistance, Cd denotes the double-layer capacitance at the electrode–solution interface and Q is the constant phase element. The results of impedance fitting are presented in Table 2. The electrolyte resistance (Rs value) varies slightly around 10 Ω cm2, indicating that the system is in a more stable state in the test solution. Rf reflects the self-repairing ability of the passivated film on the metal surface, and the Rf value decreases with the increase of the number and size of pitting. The semicircle diameter from the extrapolation of the Nyquist plot visualises the size of the charge transfer resistance (Rt). A larger semicircle diameter indicates a higher resistance of the substrate, which in turn means a lower corrosion rate of the substrate. From Figure 7(a) can be clearly observed, in the low current density conditions resulting in the largest radius of the impedance arc, which indicates that the surface of 304 stainless steel treated with this condition has the best corrosion resistance. After polishing, the film resistance (Rt value) of stainless steel was reduced by one order of magnitude compared with the initial stainless steel substrate, which indicates that electrolytic polishing can effectively improve the corrosion resistance of stainless steel.
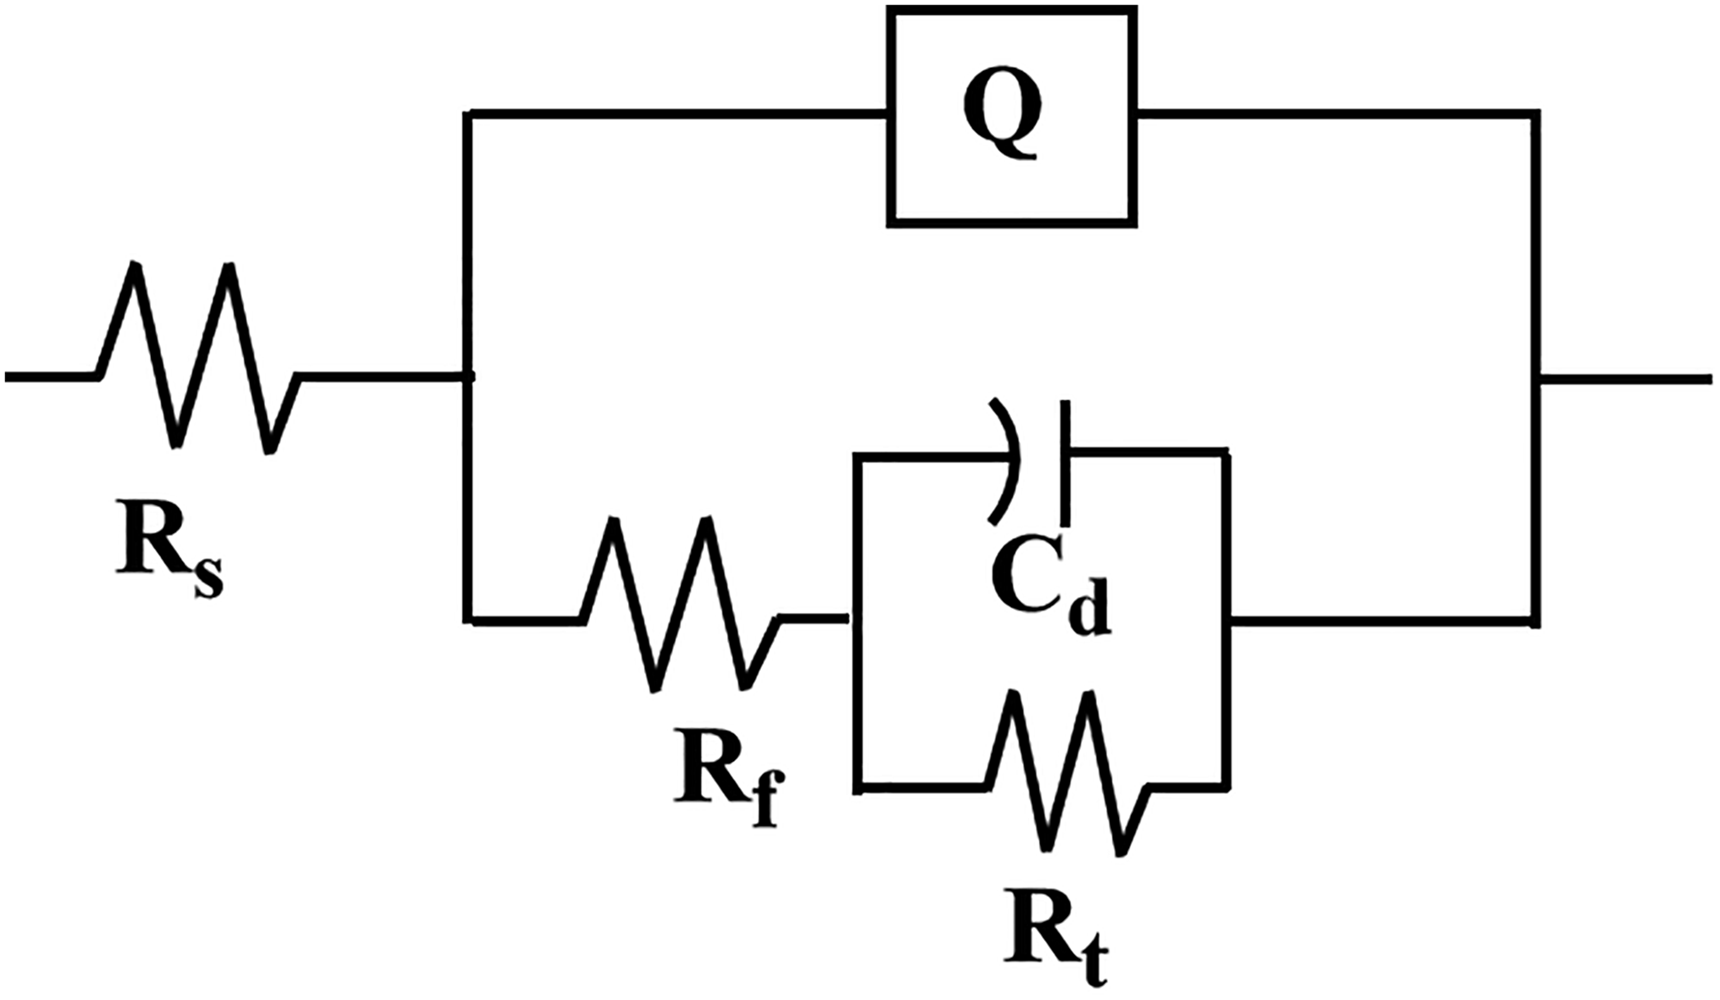
Equivalent circuit diagram.
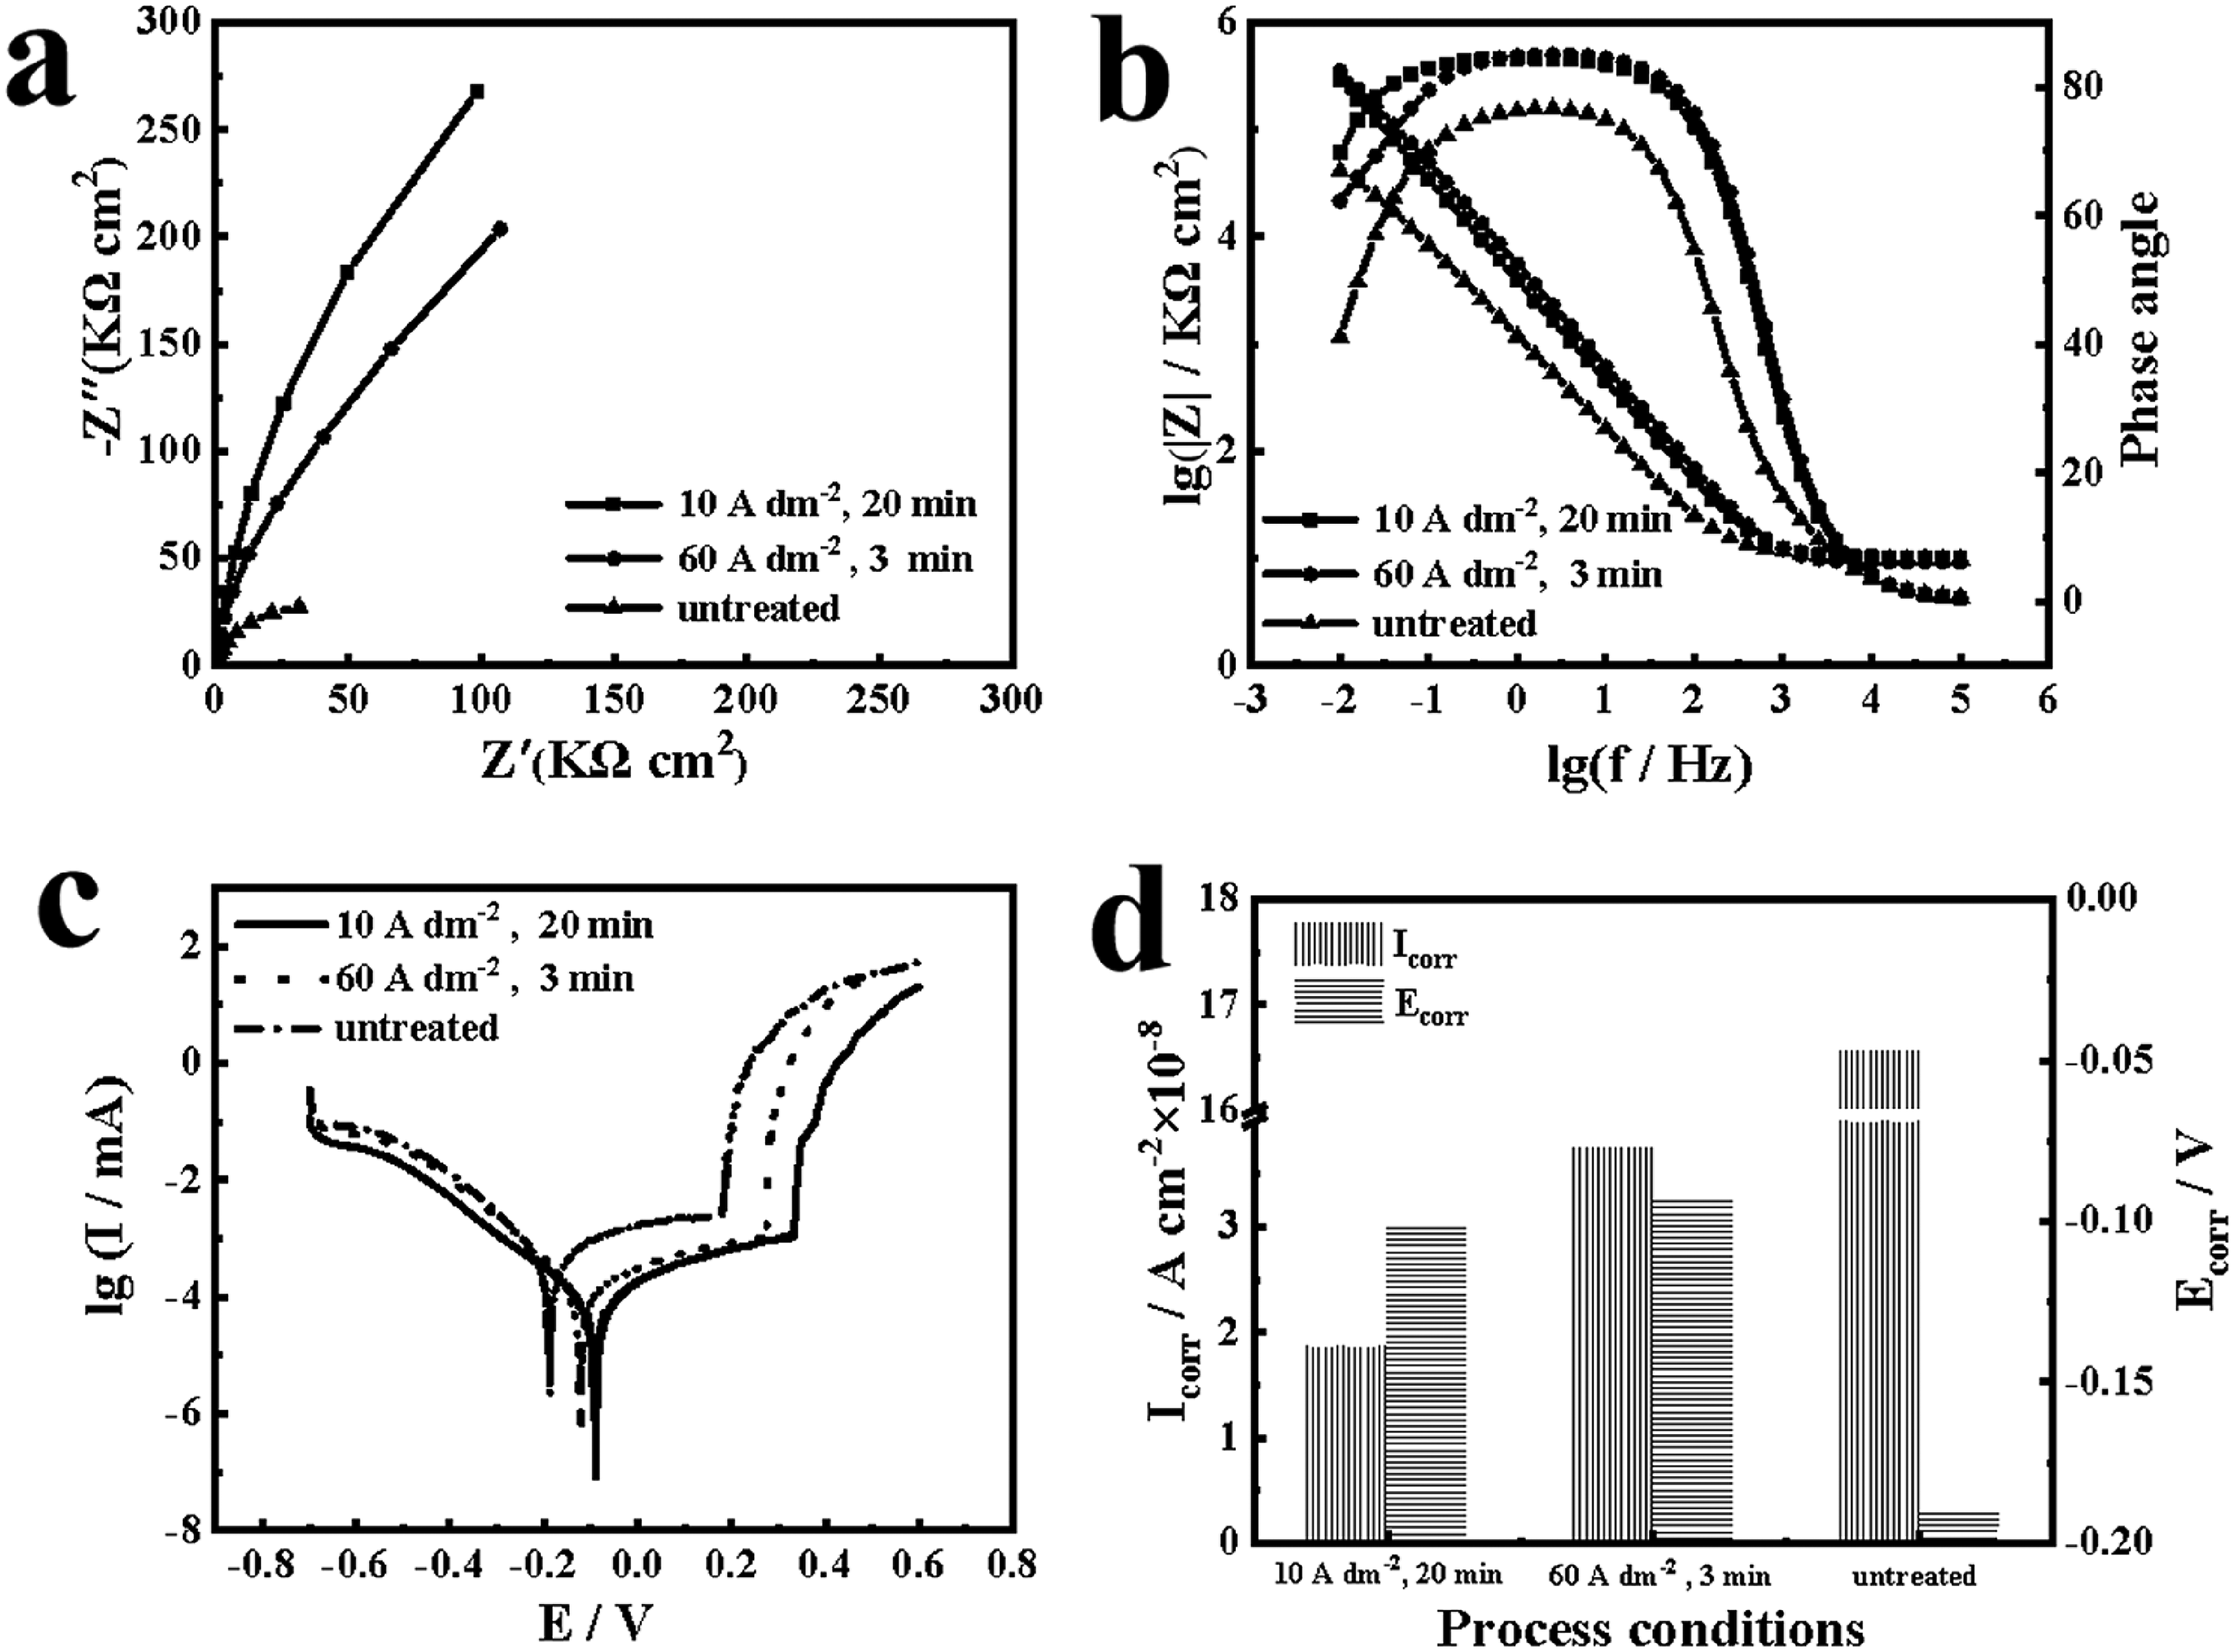
Comparison of low current density, regular current density and untreated 304 stainless steel: (a) Nyquist, (b) Bode, (c) polarisation curves and (d) Ecorr and Icorr.
Impedance fitting results for low current density, conventional current density and untreated 304.
In order to obtain more information about corrosion resistance, bode plots are applied for impedance analysis. According to Figure 7(b), it can be observed that the polarisation curves of the polished samples at different current densities almost overlap, while there is a significant difference with the polarisation curves of the unpolished samples. This can be attributed to the formation of passivation film after polishing. The stainless steel passivation film consists of an internal barrier layer and an external porous layer, which exhibit capacitive properties during electrochemical processes. Specifically, the logarithm of the impedance film value (log|Z|) tends to be constant in the high frequency range, with a linear slope around −1 in the mid-frequency range. In the low frequency range, the maximum value in the phase angle plot is less than 90°, indicating a deviation of the passivated film from the ideal capacitance. 26 The polished 304 stainless steel sample has a higher impedance modulus (|Z|) than the unpolished sample as shown by the relative up and down positions of the Bode plots at low frequency (0.01 Hz). The higher the impedance modulus at low frequencies, the better the corrosion resistance. This indicates that the samples treated with low and normal current density polishing have superior corrosion resistance.
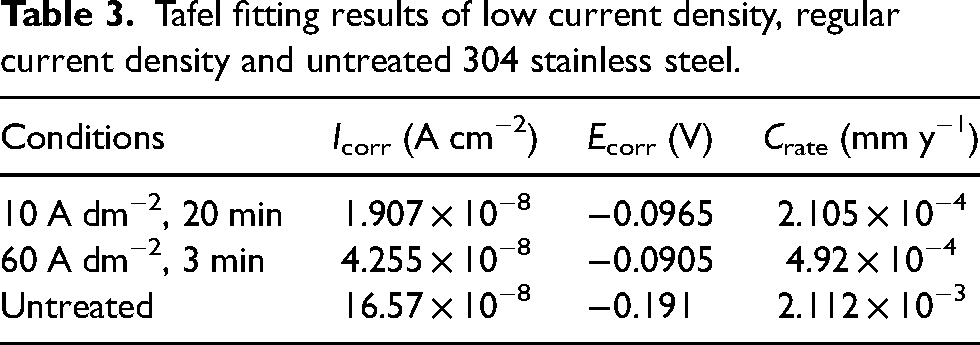
Figure 7(c) demonstrates the polarisation curves measured for 304 stainless steel in a mass fraction 3.5% NaCl solution. As can be seen from Figure 7(c), the polarisation curves of the samples obtained from the low and normal current density polishing treatments show a consistent trend with distinct passivation intervals. The corrosion potential of the polished samples was positively shifted compared to the unpolished samples. The kinetic potential polarisation curves for different polishing current densities were fitted using Tafle straight-line extrapolation method, and the values of corrosion current (Icorr), corrosion voltage (Ecorr), and corrosion rate (Crate) were derived and listed in Table 3 and plotted (Figure 7(d)). According to Figure 7(d), it can be seen that the unpolished 304 stainless steel has a lower corrosion potential (Ecorr) as well as a higher corrosion current (Icorr), and its corrosion current is an order of magnitude higher than that of the polished sample. Samples polished at low current densities had the smallest corrosion currents, only 1/2 of those polished at normal current densities, and both had similar corrosion potentials. The corrosion rate of the samples polished at low current density was 2.105 × 10⁻⁴ mm y−1, which was lower than that of the samples polished at normal current density (2.112 × 10⁻³ mm y−1). Comprehensive results show that the low current density electrolytic polishing process developed in this experiment has a polishing effect comparable to that of normal current density.
Tafel fitting results of low current density, regular current density and untreated 304 stainless steel.
Conclusions
In this article, the effect of electrolytic polishing of 304 stainless steel at low current density was investigated. The experimental results are as follows:
The optimum electrolytic polishing solution formulation was determined after testing and comparison. When testing the electrolytic polishing solution with different additive contents, it was found that the best electrolytic polishing effect was achieved when the mass concentration ratio of saccharin to salicylic acid was 3:3. The optimum process conditions for electrolytic polishing were analysed by the one-factor experiment to be 10 A dm−2, and the polishing time was 20 min. The surface flattening and uniformity measured by electrolytic polishing under this parameter decreased the surface roughness from 0.1 µm to 0.08 µm, and the impedance value was increased from 2.09 × 10⁴ Ω cm2 to 8.227 × 10⁵ Ω cm2, and the self-corrosion current 1.657 × 10⁻⁷ A cm−2 decreased to 1.907 × 10⁻⁸ A cm−2, and the self-corrosion voltage increased from −0.191 v to −0.0965 v. The corrosion resistance was significantly improved compared with the original stainless steel. Through comparative tests, it was found that the brightness, roughness and corrosion resistance after polishing at low current density could reach the polishing effect at normal current density. Overall, through experiments and systematic optimisation studies, the electrolytic polishing process formulations and parameters suitable for low-current density conditions were found, thus achieving significant enhancement of stainless steel surface quality and improvement of corrosion resistance.
Footnotes
Declaration of conflicting interests
The authors declared no potential conflicts of interest with respect to the research, authorship and/or publication of this article.
Funding
The authors received no financial support for the research, authorship and/or publication of this article.