
Abstract
Utilising electro-discharge machining, powdered metallurgical tool materials are applied to coat the surface pattern-wise. The tool undergoes a thorough blending process followed by hydraulic pellet press. Essential evaluations encompass the determination of material deposition rate, tool wear rate, surface roughness, microhardness, layer thickness and wear rate. Characterisations confirm the presence of tool constituents, provide insights into its constituent's composition and reveal the formation of tungsten carbides on the uppermost surface of the deposit. Significantly, a substantially higher deposition rate of 4.9 mg/min is achieved when a compact load of 10 tons and a peak current of 2.5A are applied. Notably, the top surface exhibits a microhardness of 330.5 HV, while the base material maintains a hardness level of 98.7 HV. The maximum thickness of the deposited layer reaches 293.68 μm under identical conditions. These hard materials serve to mitigate the specific wear rate effectively.
Introduction
Surface modification is an essential aspect of improving the performance and longevity of engineering components. Among various manufacturing techniques, Electro-discharge machining (EDM) is extensively applied for precision machining of electrically conductive materials. In addition to material removal, EDM has gained recognition as an effective method for surface modification. This process involves controlled electrical discharges that induce localised melting, vaporisation and recasting of the material, resulting in changes in surface properties such as hardness, roughness, microstructure and residual stresses. By employing EDM parameters and electrode materials, specific surface modifications can be achieved to meet application requirements. The primary goal of surface modification in EDM is to enhance wear resistance, corrosion resistance, fatigue strength and other mechanical or functional properties of machined components. This is achieved through the formation of a hardened layer, modified phases or alloying elements near the surface, which can be precisely controlled by the process inputs and dielectric fluid. EDM offers advantages such as selective modification of localised regions, the ability to process complex geometries and compatibility with various materials making it suitable for industries like aerospace, automotive, mould and die manufacturing and biomedical engineering. Continued research and development in surface modification using EDM are necessary to explore its potential in different industrial applications and further expand its capabilities. Elaiyarasan et al. 1 modified magnesium alloy surfaces employing tungsten carbide-copper powder metallurgy (PM) tool in EDM. Compaction load (CL), peak current (Ip) and pulse on-time (Ton) affected material deposition rate (MDR) and surface roughness (Ra). The Ip influenced the MDR and Ra the most. Chakraborty et al. 2 conducted research on the impact of electro-discharge coating (EDC) process parameters on Al-6351 with a PM tool of SiC/Cu. Their findings revealed that the Ton had the greatest influence, resulting in high microhardness (MH) and low Ra. Mussada et al. 3 examined the post-processing of deposited layers with a PM tool of tungsten (W)+copper (Cu). The deposited layer primarily consisted of W, Cu and their respective carbides and its formation was influenced by the PM tool composition, CL, Ip, Ton and voltage (V). Devarani and Joshi 4 conducted a study where they utilised PM green compact tool electrodes, which consisted of an equal combination of titanium (Ti) and aluminium (Al) to improve the wear, corrosion resistance and hardness of AISI P20 mould steel. By facilitating the formation of Fe3C and TiAl, they achieved a significant enhancement in MH, increasing it up to four times than original material. Tyagi et al. 5 modified mild steel substrate using PM green compact containing Hbn and Cu powder. At 50:50 mixing ratio, 10 A Ip, and 70% duty factor, micrographs showed fewer gaps and pores. A considerable decline in wear value from 95.75 μm (workpiece) to 1.52 μm (coating) and friction coefficient from 0.9 to 0.1 was observed. Tyagi et al. 6 also modified mild steel substrate in EDC using the powder of MoS2 and Cu and examined the tribological characteristics and surface properties. A coating of WS2 and Cu on mild steel was tribologically studied by Tyagi et al. 7 W, WS2, Cu and CuS2 established resistance to wear on the workpiece and reduce wear by 95%. Mazarbhuiya and Rahang 8 investigated the application of reverse polarity in EDM to deposit a tungsten hard coating onto graphite surfaces. Parameters such as powder particle size, compaction load and sintering temperature have a substantial impact on the developed surface. It was found that the coating thickness varied between 15.46 and 33.93 µm. Ramdatti and Gohil 9 conducted a study to optimise the input parameters on die steel using W, Cu and Si PM tools. The study revealed that by identifying specific parameters they were able to achieve two significant outcomes: increased hardness on the die steel surface and the formation of a defect-free coated surface. The impact of powder addition on mild steel surface using a copper tungsten electrode was studied by Khan et al. 10 Increasing the Ip during the investigation of TiC and Al2O3 powders along with kerosene as the dielectric medium led to thicker recast layers and an increased occurrence of cracks. Liew et al. 11 performed EDC with a tungsten powder suspension to deposit materials onto aluminium moulds and dies. The impact of Ip, Ton and V on factors such as deposited element percentage, MH and surface topography were studied. The analysis revealed the deposition of C, Al, W, O and Cu elements doubling the MH compared to the base aluminium. Arun et al. 12 coated Ni and W onto die steel surfaces. The deposition process exhibited minimal crack formation, achieved excellent metallurgical bonding and resulted in high hardness (around 1059 HV0.3) and superior wear resistance. Barua and Rahang 13 utilised a Cu-MWCNT green compact to enhance the Al-7075 surface and investigated the impact of Ip, V and CL on material deposition rate (MDR), tool wear rate (TWR) and Ra. They achieved a significant improvement in MH reaching up to 2.6 times higher than the original material through the deposition of tool materials. Rajeshshyam et al. 14 used WS2 powder blended EDC to apply a coating on aluminium (Al) 6061-T6 alloy resulting in a low coefficient of friction (COF) and low wear rate relative to the base workpiece. The data obtained reveal that the coating was efficient in improving the tribological properties. Mohanty et al. 15 develop a hard layer on Ti6Al4 V surface using μ-EDM. The deionised water mixed with WS2 powder, while a brass rod served as the tool. The study encompassed an improvement in MH and a reduction in wear rate compared to the original material. In the realm of EDM, the conventional process of fabricating tools with different shapes is both time-consuming and costly. Researchers like Rahang and Patowari16,17 were inspired to look into alternate techniques that can produce desired patterns on the work surface without the necessity for intricate tool forms. They suggested a method using masking material and a simple PM green tool with a flat end, providing a cost-effective and efficient approach without the need for complex tool designs or extra, pricey machinery like vacuum chambers. Mazarbhuiya and Rahang18,19 also used a reverse EDM approach with laser cutting and photochemical machining to manufacture complex-shaped patterns effectively and efficiently.
Hard coatings applied to aluminium (Al) surfaces offer significant advantages, enhancing durability, wear resistance and performance across various industries. These coatings reduce friction, wear and abrasion, thereby prolonging the lifespan of manufacturing processes. Hard coatings protect aluminium components from corrosion and improve overall performance and reliability. Similarly, hard coatings on the surfaces of medical devices ensure biocompatibility, wear resistance and corrosion resistance. Therefore, a research gap may exist in terms of a detailed examination of the process parameters, the mechanical and tribological qualities of the deposited surfaces, and the potential applications and benefits of this EDC technique for enhancing the performance and durability of aluminium components in different industries. Further research in this area could help bridge this gap and provide valuable insights into the effectiveness and potential advantages of the EDC method. To create a modified surface, the EDC method is employed, involving the deposition of hard tungsten particles onto an aluminium surface. The text discusses the effects of various process parameters on both the mechanical and tribological characteristics of these modified surfaces. Consequently, thorough research has been conducted with the aim of improving surface integrity and investigating the tribological behaviour of the surfaces after the deposition of tungsten particles.
Materials and methods
W and Cu powder of particles (size 325 mesh i.e. 44 μm) are selected for the experimentation. The powders are selected based on the purity of the quality (Make: Loba Chemie Pvt. Ltd). The high density of W particles makes deposition simple. It raises the substrate material's hardness where it is deposited. As a binder for the brittle and hard W particles, Cu powder is added to the composition. Copper also makes the process more machinable due to its high electrical conductivity. The characteristics of tungsten, copper powder and aluminium 6061 (Al6061) are shown in Table 1. A mixture of 25%Cu–75%W (weight %) is thoroughly blended for 1 h and compacted within a die (⌀13 mm) by a pellet press. The composition is selected based on the better deposition of powder particles.16,17 Thus, the required number of pellets are fabricated by applying different levels of compact load (CL). These pellets are glued to the same diameter of copper shank to make the complete tool for EDC operation. The peaks of X-ray diffraction (XRD) plot of the PM green compacts validated W and Cu particles (Figure 1). The composition of the powder, workpiece and tool weights are weighted using an electronic weighing balance. The MDR and TWR are calculated by recording the tool and work sample weights before and after the trials. These rates are determined by dividing the weight variations by the deposition time. Al6061 of size 30 × 20 × 2 mm is chosen as workpiece. The main experimental work is carried out by a EDM (die-sinking) manufactured by Sparkonix (I) Private Ltd, specifically the S25 model. The machine configuration includes a worktable responsible for controlling movements along the X and Y axes while Z-axis allows tool holder movement. A servo mechanism is employed to regulate the tool holder's downward movement. Flushing pressure is monitored using a pressure gauge and the dielectric medium used is EDM oil (DEF 92). The conducted experiment aimed to examine the surface integrity and investigate the tribological behaviour of the deposited workpiece. PM green compact tool electrodes are utilised in the reverse polarity of EDM to create the coating. A series of twelve experiments are conducted and the post-processing characteristics are investigated. The study encompassed the analysis of various parameters, including MDR, TWR, Ra, layer thickness (LT), MH and indentation depth. Field emission scanning electron microscope (FESEM) observations, energy dispersive spectroscopy (EDS) analysis, XRD analysis and wear test analysis are also performed. Certain parameters such as tool composition (75%W + 25%Cu), polarity (reverse), flushing pressure (5 kgf/cm2), deposition time (5 min) and duty factor (83.33%) are kept constant with predetermined values. To determine the most influential process parameter levels, several preliminary experiments are conducted. Pilot experiments identify process parameter ranges, aiming to moderate TWR, MDR and improved surface finish. The selection of constant parameters promotes the objective of achieving a significant amount of material transfer. Table 2 shows the chosen range of process parameters as well as the assigned values for CL and Ip.
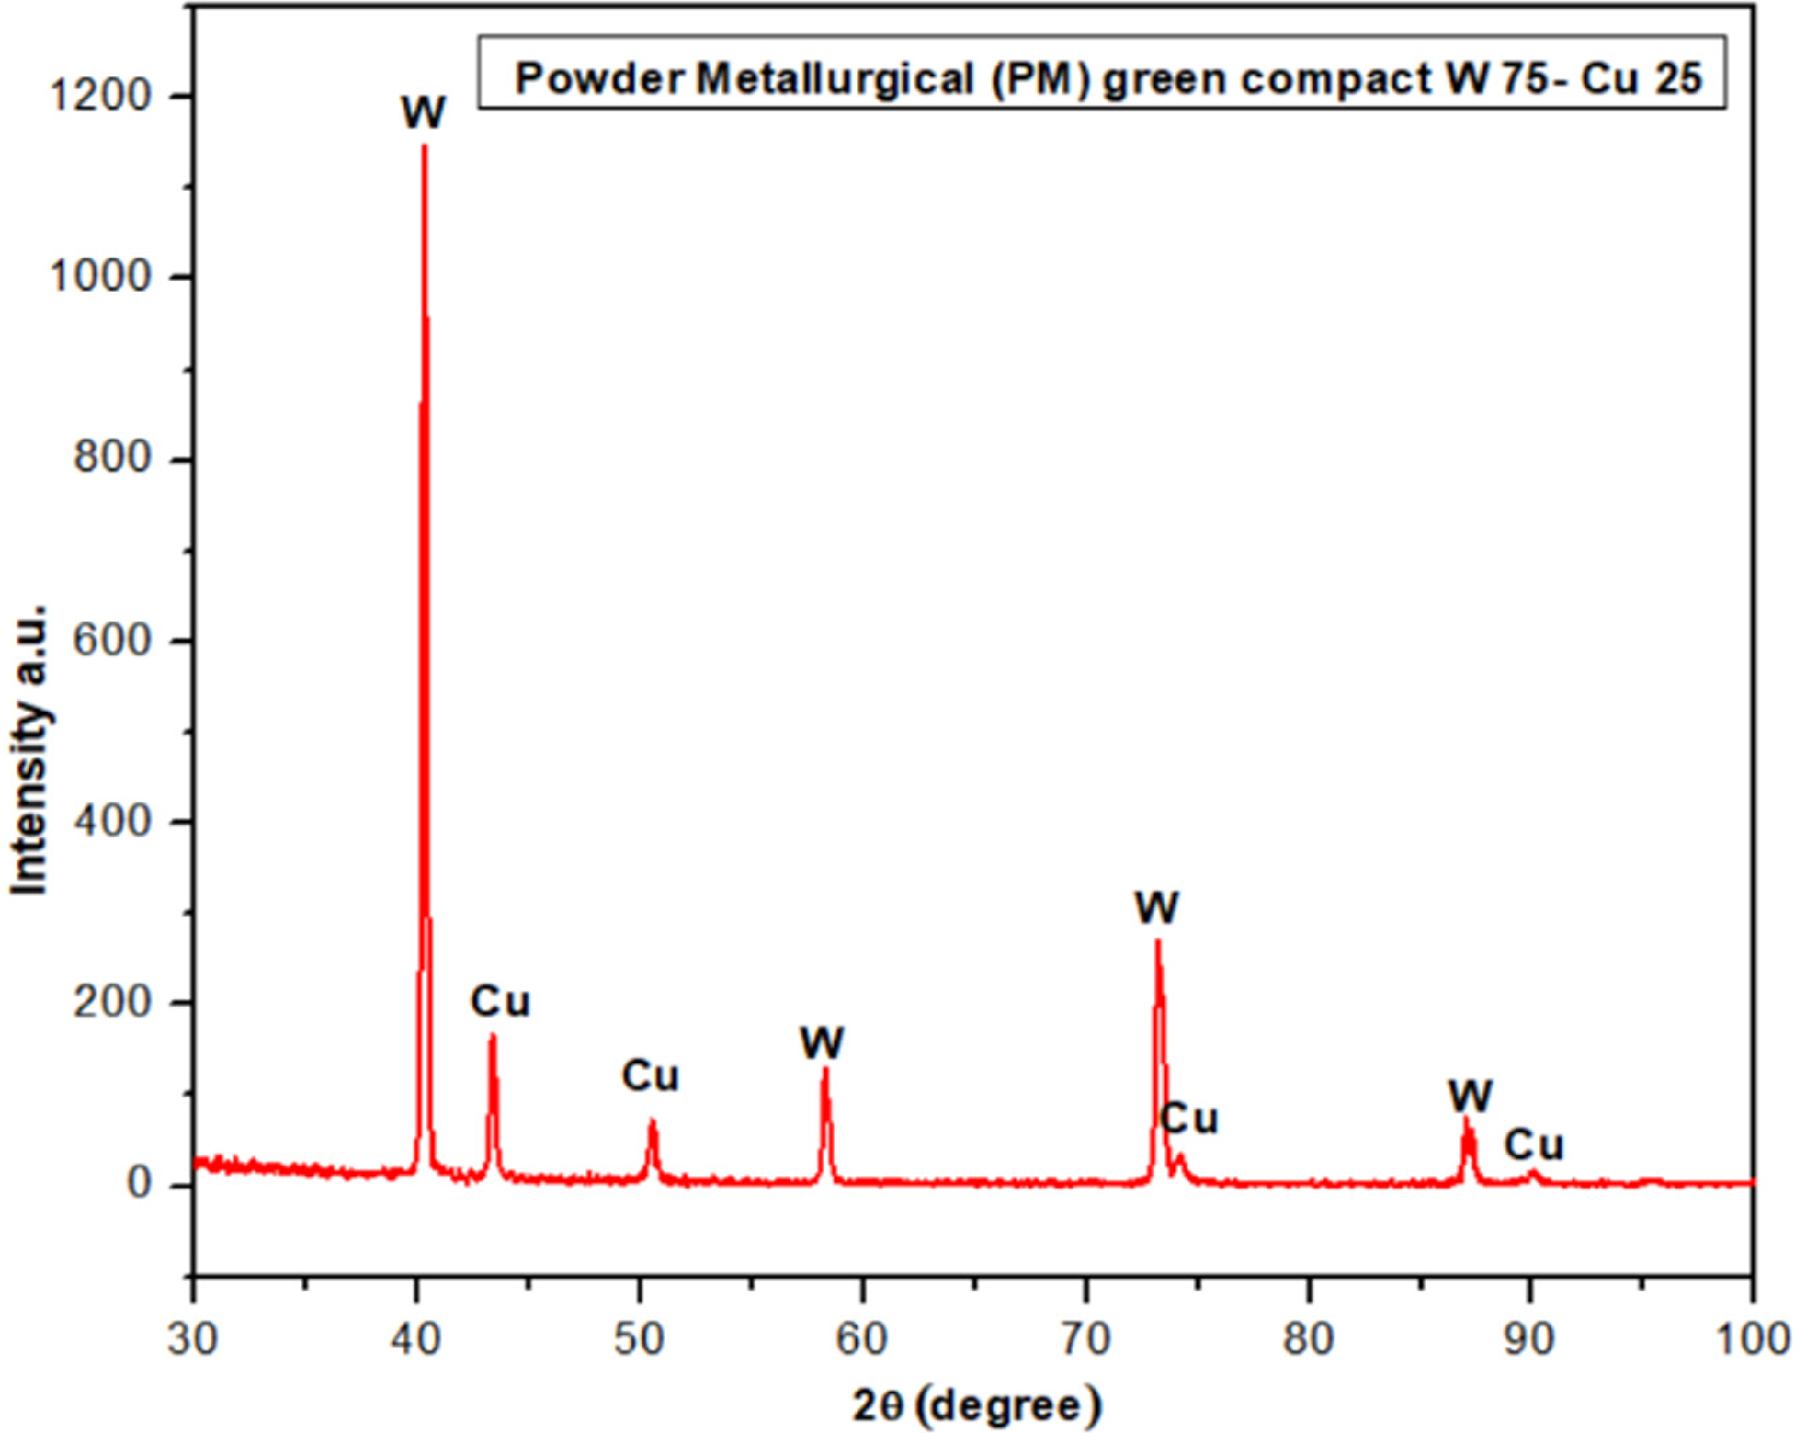
XRD plot of W75%–Cu25% PM green compact.
Characteristics of tungsten and copper powder and Aluminium 6061 workpiece.
Process parameters and their assigned values.
Results and discussion
Table 3 showcases quantitative findings. Figure 2 visually represents the coated work surface due to the deposition process. Maintaining control over input parameters is essential to attain an even surface with uniform deposition, emphasising the significance of surface preparation for both the workpiece and the tool electrode.
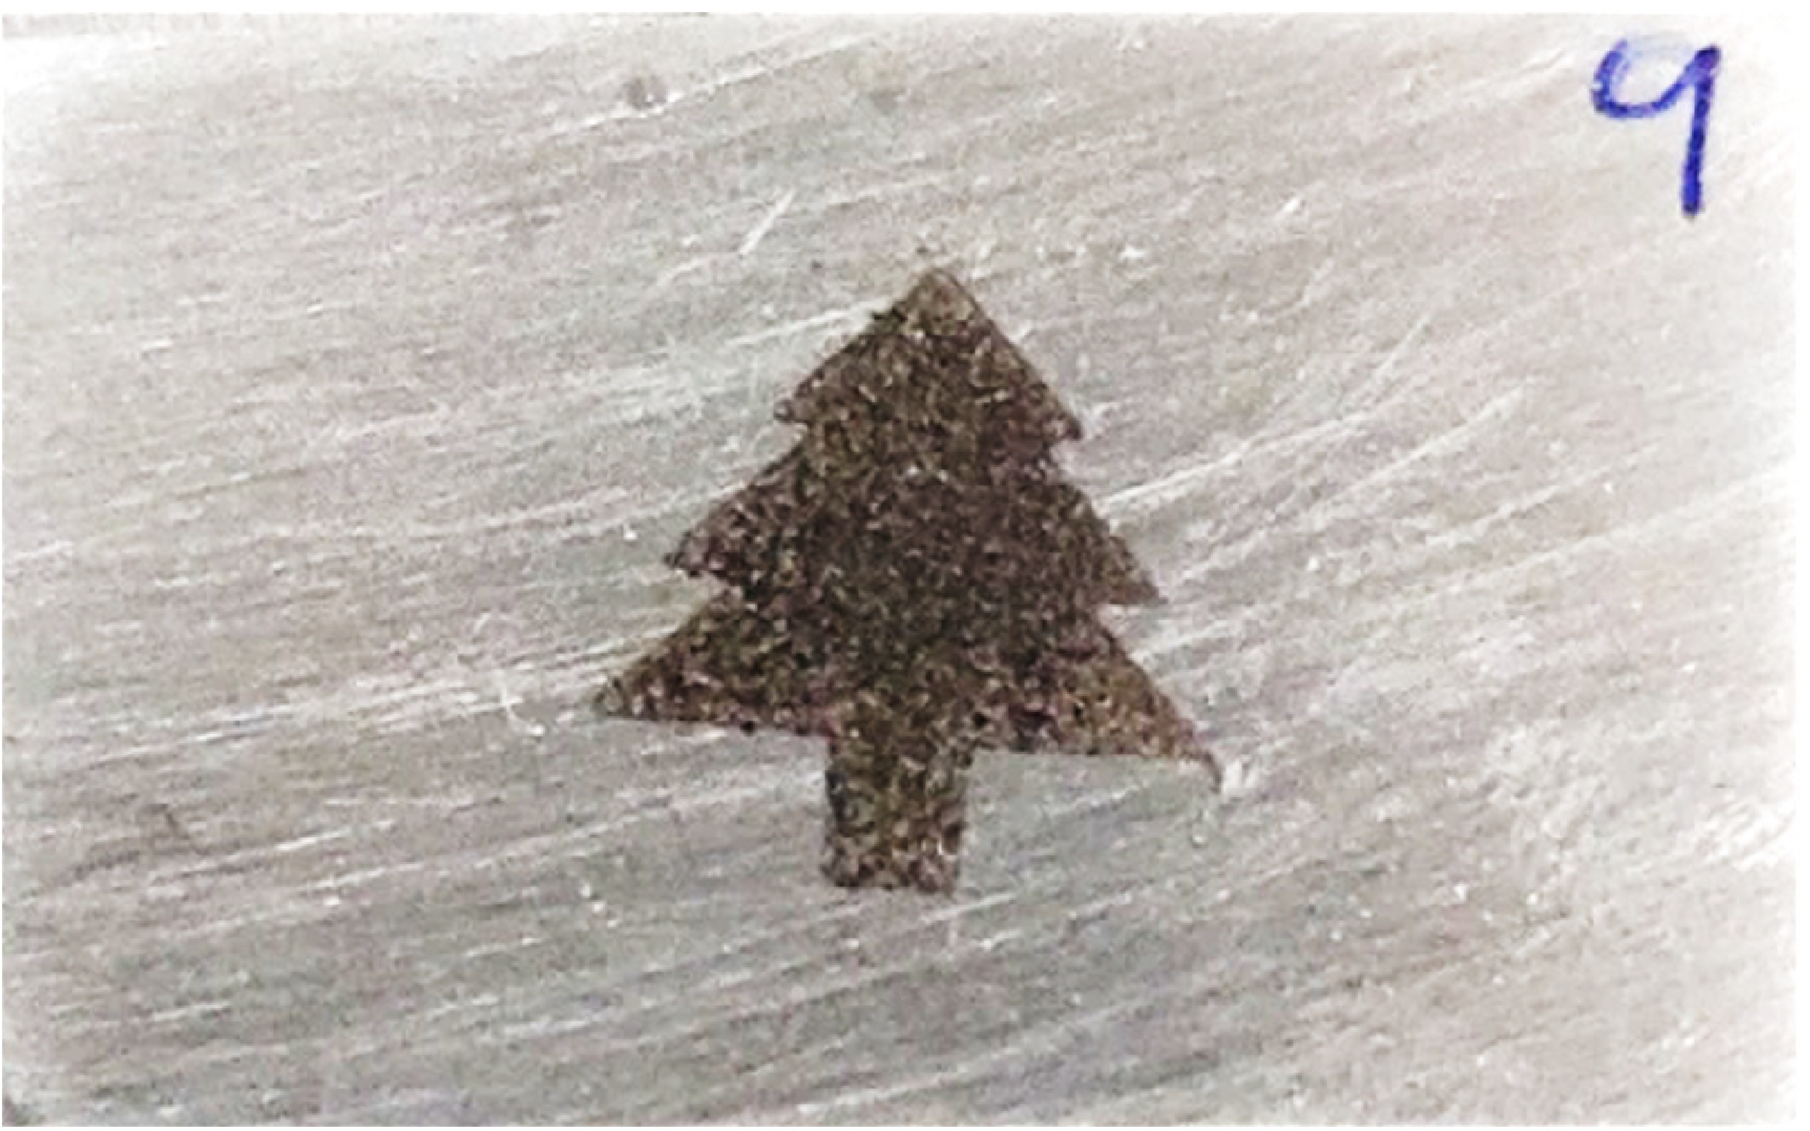
Coated surface at CL of 20 ton, Ip of 1A and Ton of 100 μs.
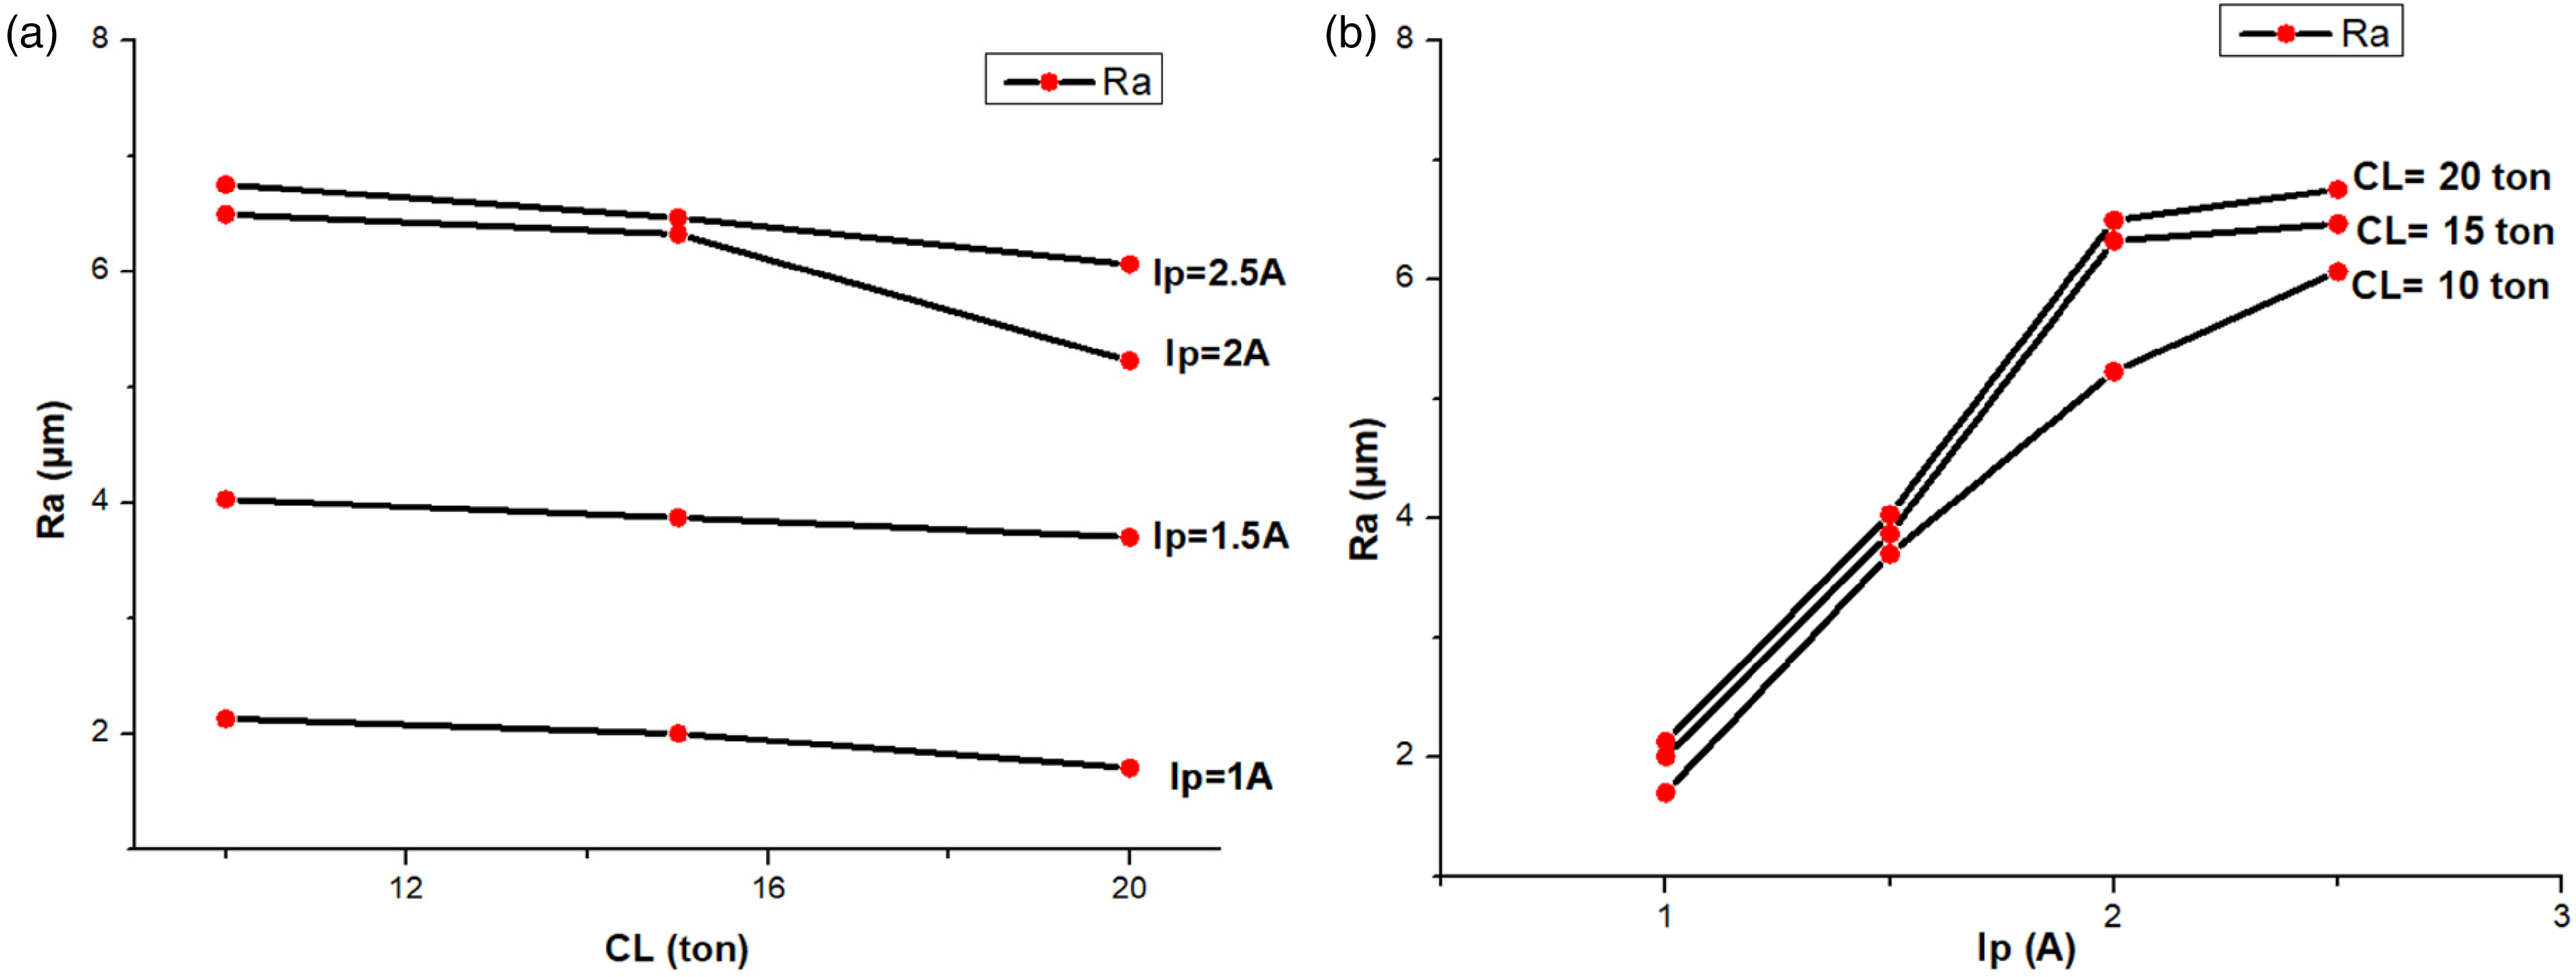
Experimental results.
Analysis of output-performance parameters
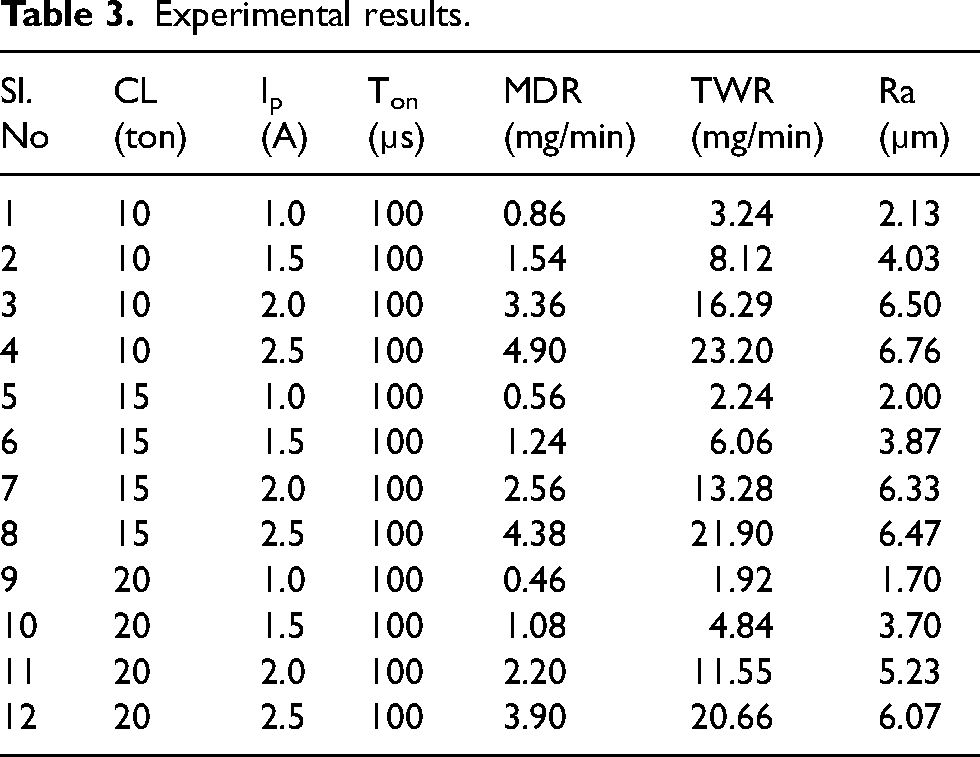
In Figure 3(a) and (b), the influence of Ip and CL at different levels on MDR is demonstrated. An increase in Ip results in higher energy discharge leading to high energy spark and subsequently higher MDR. 16 Similarly, variation in MDR is observed as CL decreases from 20 to 10 ton (Figure 3(b)). This decrease in CL boosts spark energy, promoting greater erosion of tool particles, resulting in a higher deposition rate. MDR is directly influenced by the erosion rate of the tool, where a decrease in CL leads to an increase in MDR. 17 On the other hand, lower MDR is attained with a lower rate of tool erosion. Increase in Ip settings leads to higher rates of tool erosion, resulting in higher MDR. For instance, at CL = 20 ton, Ip = 1A and a constant Ton = 100 µs, the MDR is 0.46 mg/min. In contrast, at CL =10 ton, Ip = 2.5A and a constant Ton = 100 µs, the MDR is 4.9 mg/min. This represents a 965.21% increase in MDR when selecting input parameters of CL 10 ton, Ip 2.5A and Ton 100 µs as compared to the parametric settings CL 20 ton, Ip 1A and Ton 100 µs.
(a) Effects of CL on MTR at different Ip settings, (b) Effects of Ip on MTR at different CL settings.
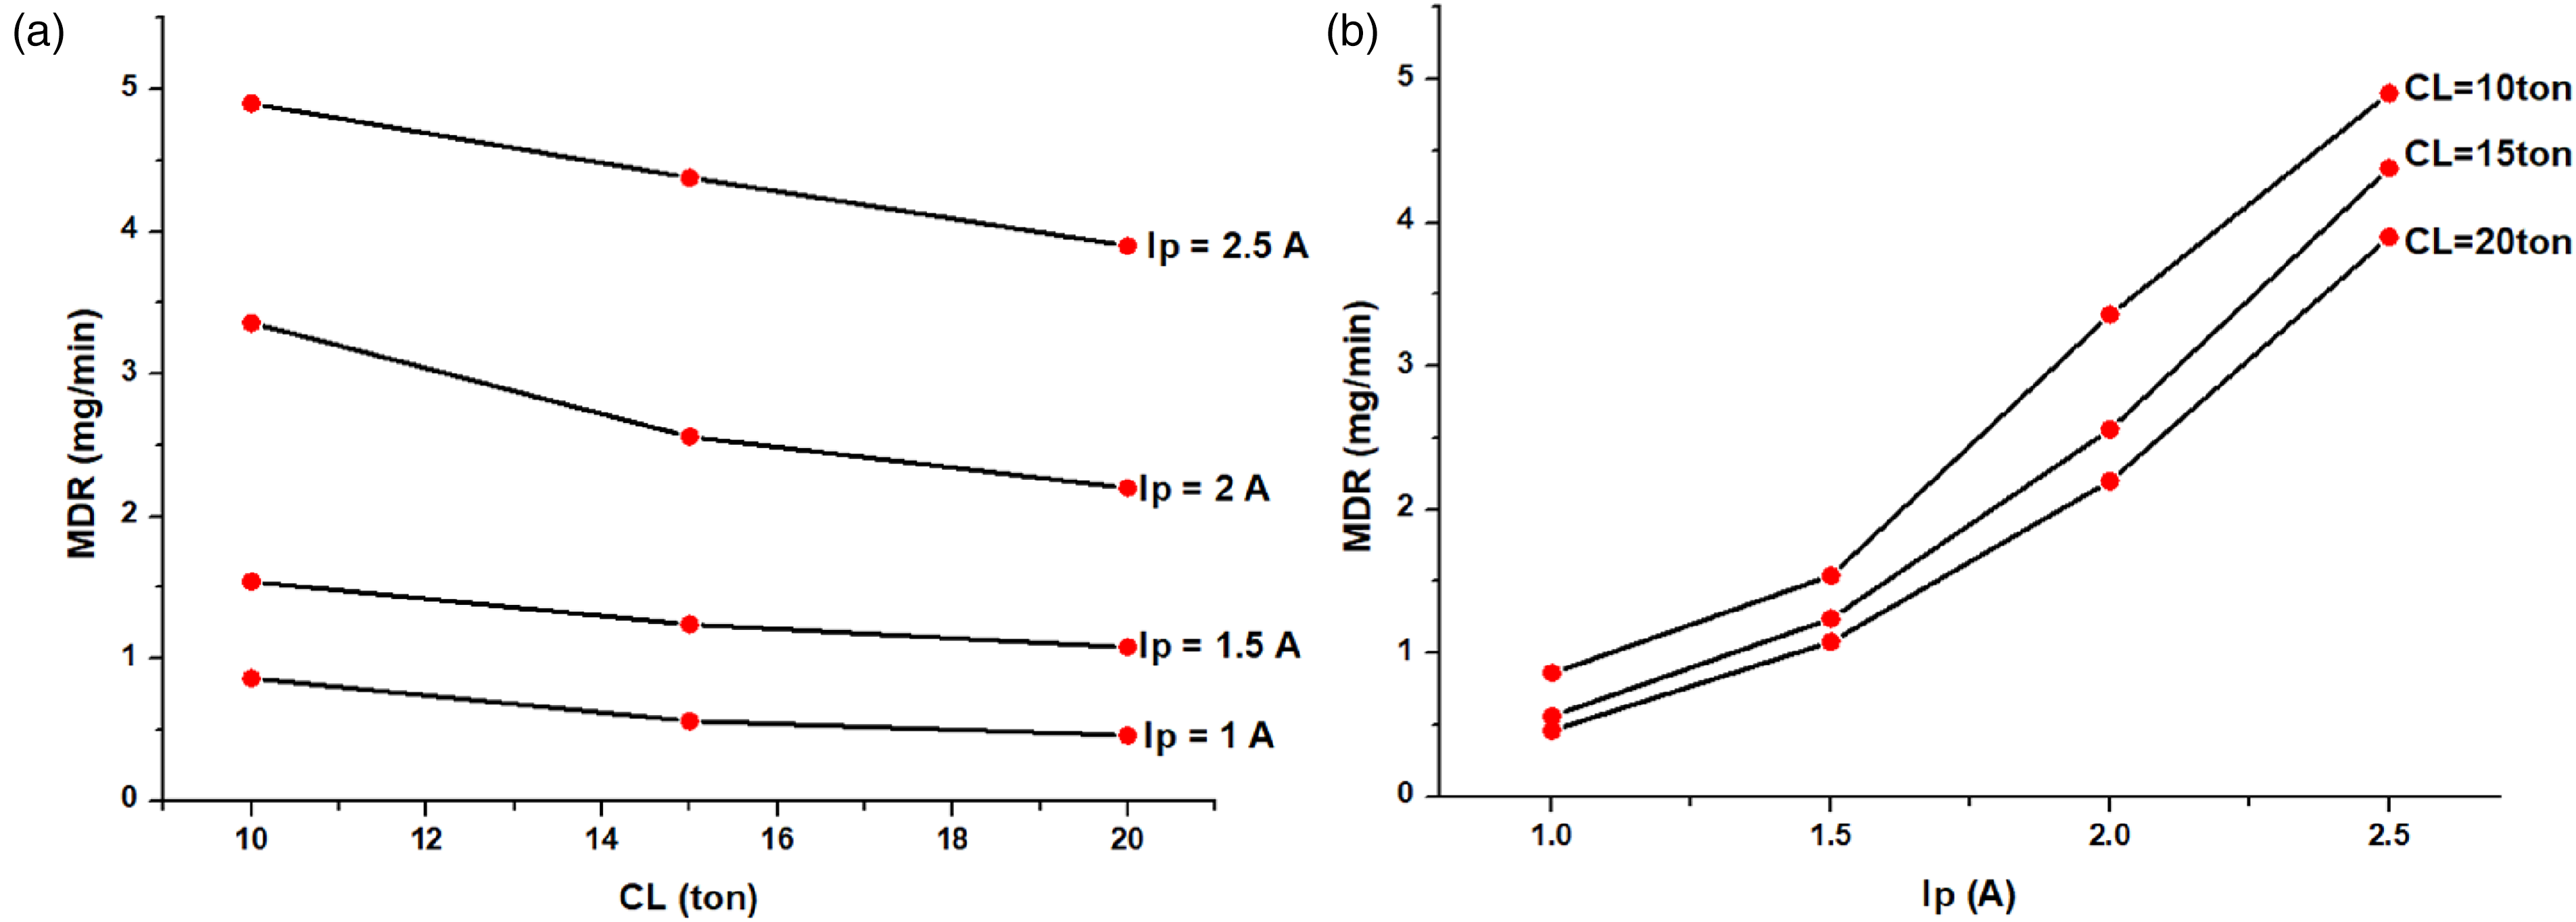
The tool material that undergoes erosion is carried over to the workspace to some extent and rest flushed away by the action of flushing pressure. The Ip plays a significant role. A low CL can lead to weak bonding, causing the tool to degrade despite reduced energy levels and shorter pulse durations. 17 Consequently, a higher TWR = 23.20 mg/min is achieved at CL of 10 ton and Ip of 2.5A (4th experimental run), whereas at CL = 20 ton, Ip = 1A and a constant Ton = 100µs, the TWR is 1.92 mg/min. With increased CL, the erosion rate decreases owing to stronger bonding between the powdered tool components. 18 Therefore, it takes more energy to degrade the tool for achieving a high TWR. Figure 4(a) and (b) shows the variation in TWR at various CL and Ip values. Ip supplies the energy needed for tool erosion and a low energy results in low TWR. However, the wear rate of the tool increases as Ip settings are raised (Figure 4(b)). High Ip accelerates tool electrode wear. By selecting the input parameters of CL = 10 ton, Ip = 2.5 A and Ton = 100 µs, the TWR value shows a percentage increase of 1108.33% as compared to the parametric settings CL 20 ton, Ip 1 A and Ton 100 µs.
(a) Effects of CL on TWR at different Ip settings, (b) Effects of Ip on TWR at different CL settings.
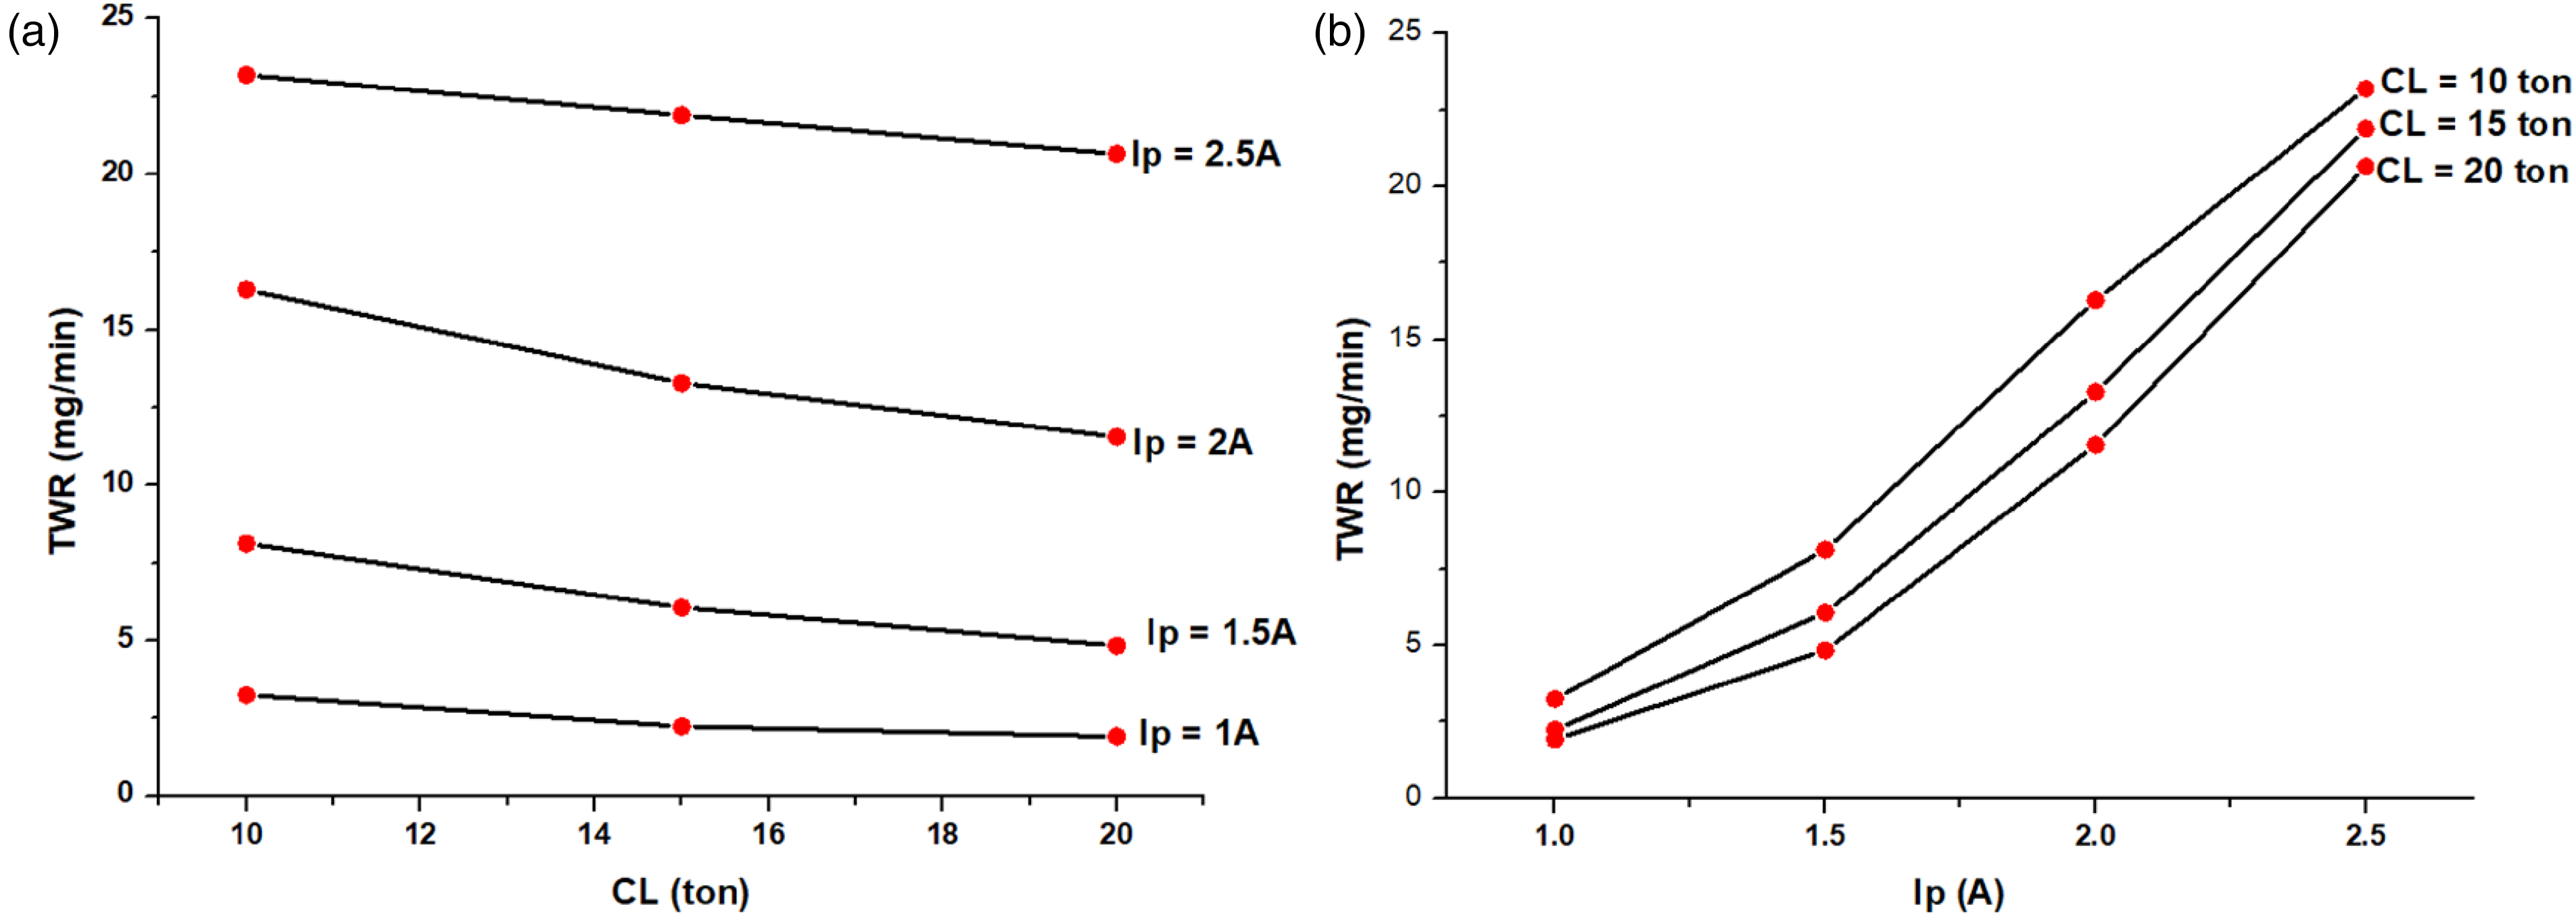
The method of deposition and rate of deposition also effect developed surface integrity. This parametric study aims to reduce Ra with uniform deposition. The minimum Ra value of 1.70 µm is measured corresponds to CL at 20 ton, Ip at 1 A and Ton at 100 μs. When the Ip is low and Ton is short, the tool experiences minimal erosion at high CL due to the strong binding energy between particles. 18 As a result, the deposited surface becomes smooth due to the uniform deposition of materials. Conversely, a higher Ip value can accommodate a larger amount of tool material, resulting in a rough surface due to non-uniform material deposition. 16 The maximum Ra value of 6.76 µm is measured corresponds to CL at 10 ton, Ip at 2.5 A and Ton at 100 μs. Effective sparks are generated at low Ton produced smooth surface by tiny spark radius and energy concentration. The particles are loosely bonded at low CL causing sudden erosion of the tool particles produces non-uniform deposition of the particle. 17 The quality of the deposited surface is greatly influenced by the Ip. Low Ip results in low MDR because there is less energy discharged, which causes shallow craters to form on the work surface. 16 The percentage decrease of roughness value is observed to be 74.85% when selecting the input parameters of CL = 20 ton Ip = 1 A and Ton = 100 µs as compared to the parametric settings CL 10 ton, Ip 2.5 A and Ton 100 µs. Figure 5 (a) and (b) shows the variation of Ra with CL and Ip at various parametric combinations. Figure 5(b) suggests that as the Ip increases from 1 to 2.5A, the Ra increases from 1.70 to 6.07 µm at constant CL of 20 ton and Ton of 100 µs. The Ra increases drastically with the increase of Ip. Ip increases spark energy, which transfers more energy to the tool causing melting of material extremely and raising the rate of deposition and Ra values. It erodes the tool surface, affecting the newly formed surface. A low Ip setting produces a reduced rate of material deposition. Higher Ip settings increase crater size and roughness. Large Ip handles more material. Thus, a higher Ra of 6.76 µm is measured at 2.5 A of the Ip. Likewise, low Ra is measured at a low Ip setting of 1A. The Ra increases as the CL lowers from 20 to 10 ton due to decreasing tool particle binding energy. Low CL influences Ra by causing abrupt tool degradation and an uncontrolled deposition rate. 16 This is also caused by inconsistency in sparking at low CL. The surface becomes rough due to unrestricted material transfer and random material deposition. A smooth surface arises from regulated migration at high CL. The Ra obtained at 20 ton of CL is comparatively lower than that of 10 ton of CL.
(a) Effects of CL on Ra at different Ip settings, (b) Effects of Ip on Ra at different CL settings.
The layer thickness of the coated samples is measured by transversely cutting the workpieces using a wire-cut EDM machine. Optical micrograph analysis is conducted after the samples are mounted, polished and etched with measurements taken at multiple locations and averaged. The measured layer thickness at CL = 10 ton, Ip = 2.5 A, Ton = 100 µs is shown in Figure 6. The melted W and C in the dielectric fluid formed tungsten carbides on top surface. The layer's thickness depended on its height, tool composition and its transfer to the surface. Increasing the Ip led to a higher layer thickness due to the increased spark energy and subsequent material melting. Conversely, decreasing the CL resulted in greater tool migration and thicker layers. Worn-out powder particles and machining conditions affected deposition rate and layer thickness. Powder particles facilitated chemical reactions and the creation of a molten pool during deposition. The layer thickness varied between a minimum of 59.61 μm (sample 9) and a maximum of 293.68 μm (sample 4), demonstrating the impact of the input variables and uniformity of the deposited material. Ultimately, the coated surface provided enhanced durability, enabling it to withstand extreme environmental conditions and exhibit the required surface properties to withstand damage.
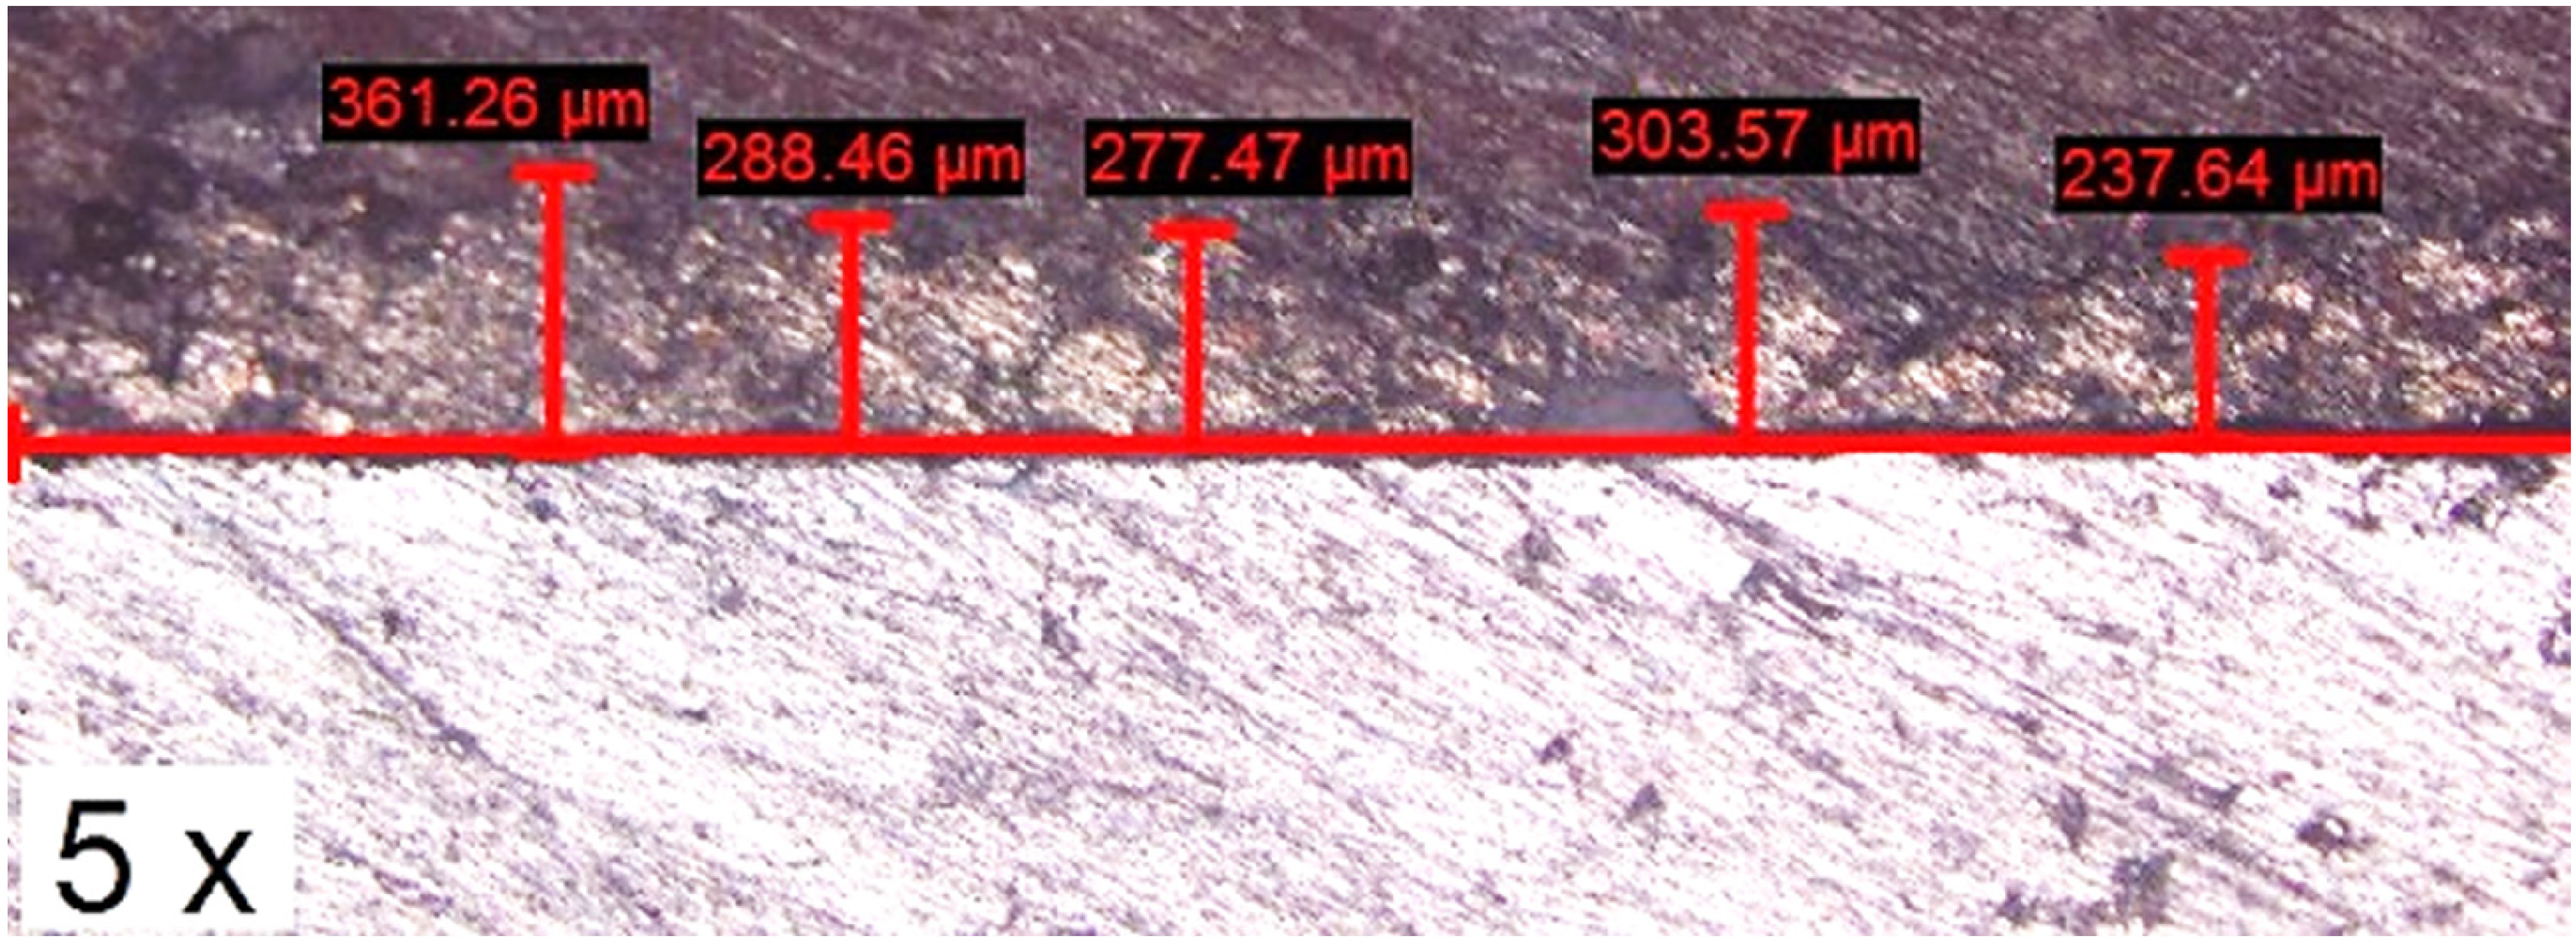
Layer thickness at CL = 10 ton, Ip = 2.5A, Ton = 100 µs.
Morphological and tribological studies
FESEM images have been employed to conduct detailed morphological examinations of the deposited workpiece surfaces. These examinations specifically focused on assessing the variations in surface morphology under two distinct sets of input parameters: one at the maximum material deposition rate conditions, at CL of 10 tons and Ip of 2.5 A, and the other at minimum MDR conditions, denoted by CL of 20 tons and Ip of 1 A, as illustrated in Figure 7(a) and (b). Both sample analyses were performed at a Ton of 100 µs and a duty factor of 83.33%. Upon close inspection at various magnifications, it is observed that the material deposition exhibited a globular and less agglomerated pattern when subjected to high CL, low Ip and a short Ton. 16 This phenomenon can be attributed to the rapid generation of intense heat within the immersed EDM process, causing the molten material to solidify into small spherical structures upon cooling. The reduced agglomeration indicates that the deposited material appears less densely packed or clustered together, suggesting that individual globular deposition. Microscopic analysis also revealed the presence of nanometric particle sizes, which accounted for the achieved finer surface of Ra of 1.70 µm. Conversely, the combination of high Ip in conjunction with a loosely bonded tool at lower CL setting generated a significant amount of thermal energy. This elevated thermal energy led to increased tool erosion and uncontrolled material transfer during the deposition process. The rapid cooling effect of the cold dielectric fluid on the molten mass resulted in the formation of large particle clusters on the coated surface. Additionally, tool particles subjected to high temperatures in the gap experienced melting and evaporation, and the dielectric fluid played a crucial role in swiftly cooling the molten material, forming distinctive globules, craters and voids in the deposit. Gas bubbles trapped within the solid deposit contributed to its porosity, which signifies the presence of empty spaces within the material. These entrapped gas bubbles introduced voids or empty spaces within the deposit, subsequently increasing its porosity. 18 This porosity had implications for the material's density, strength and other properties. Notably, as the molten material started to solidify, the solubility of gases within it significantly decreased with decreasing temperature. Consequently, any dissolved gas within the molten metal began to come out of the solution, forming gas bubbles. The formation of gas porosity could be influenced by several factors, including the composition of the molten material, the presence of impurities, the cooling rate and the input parameter conditions during the solidification process.
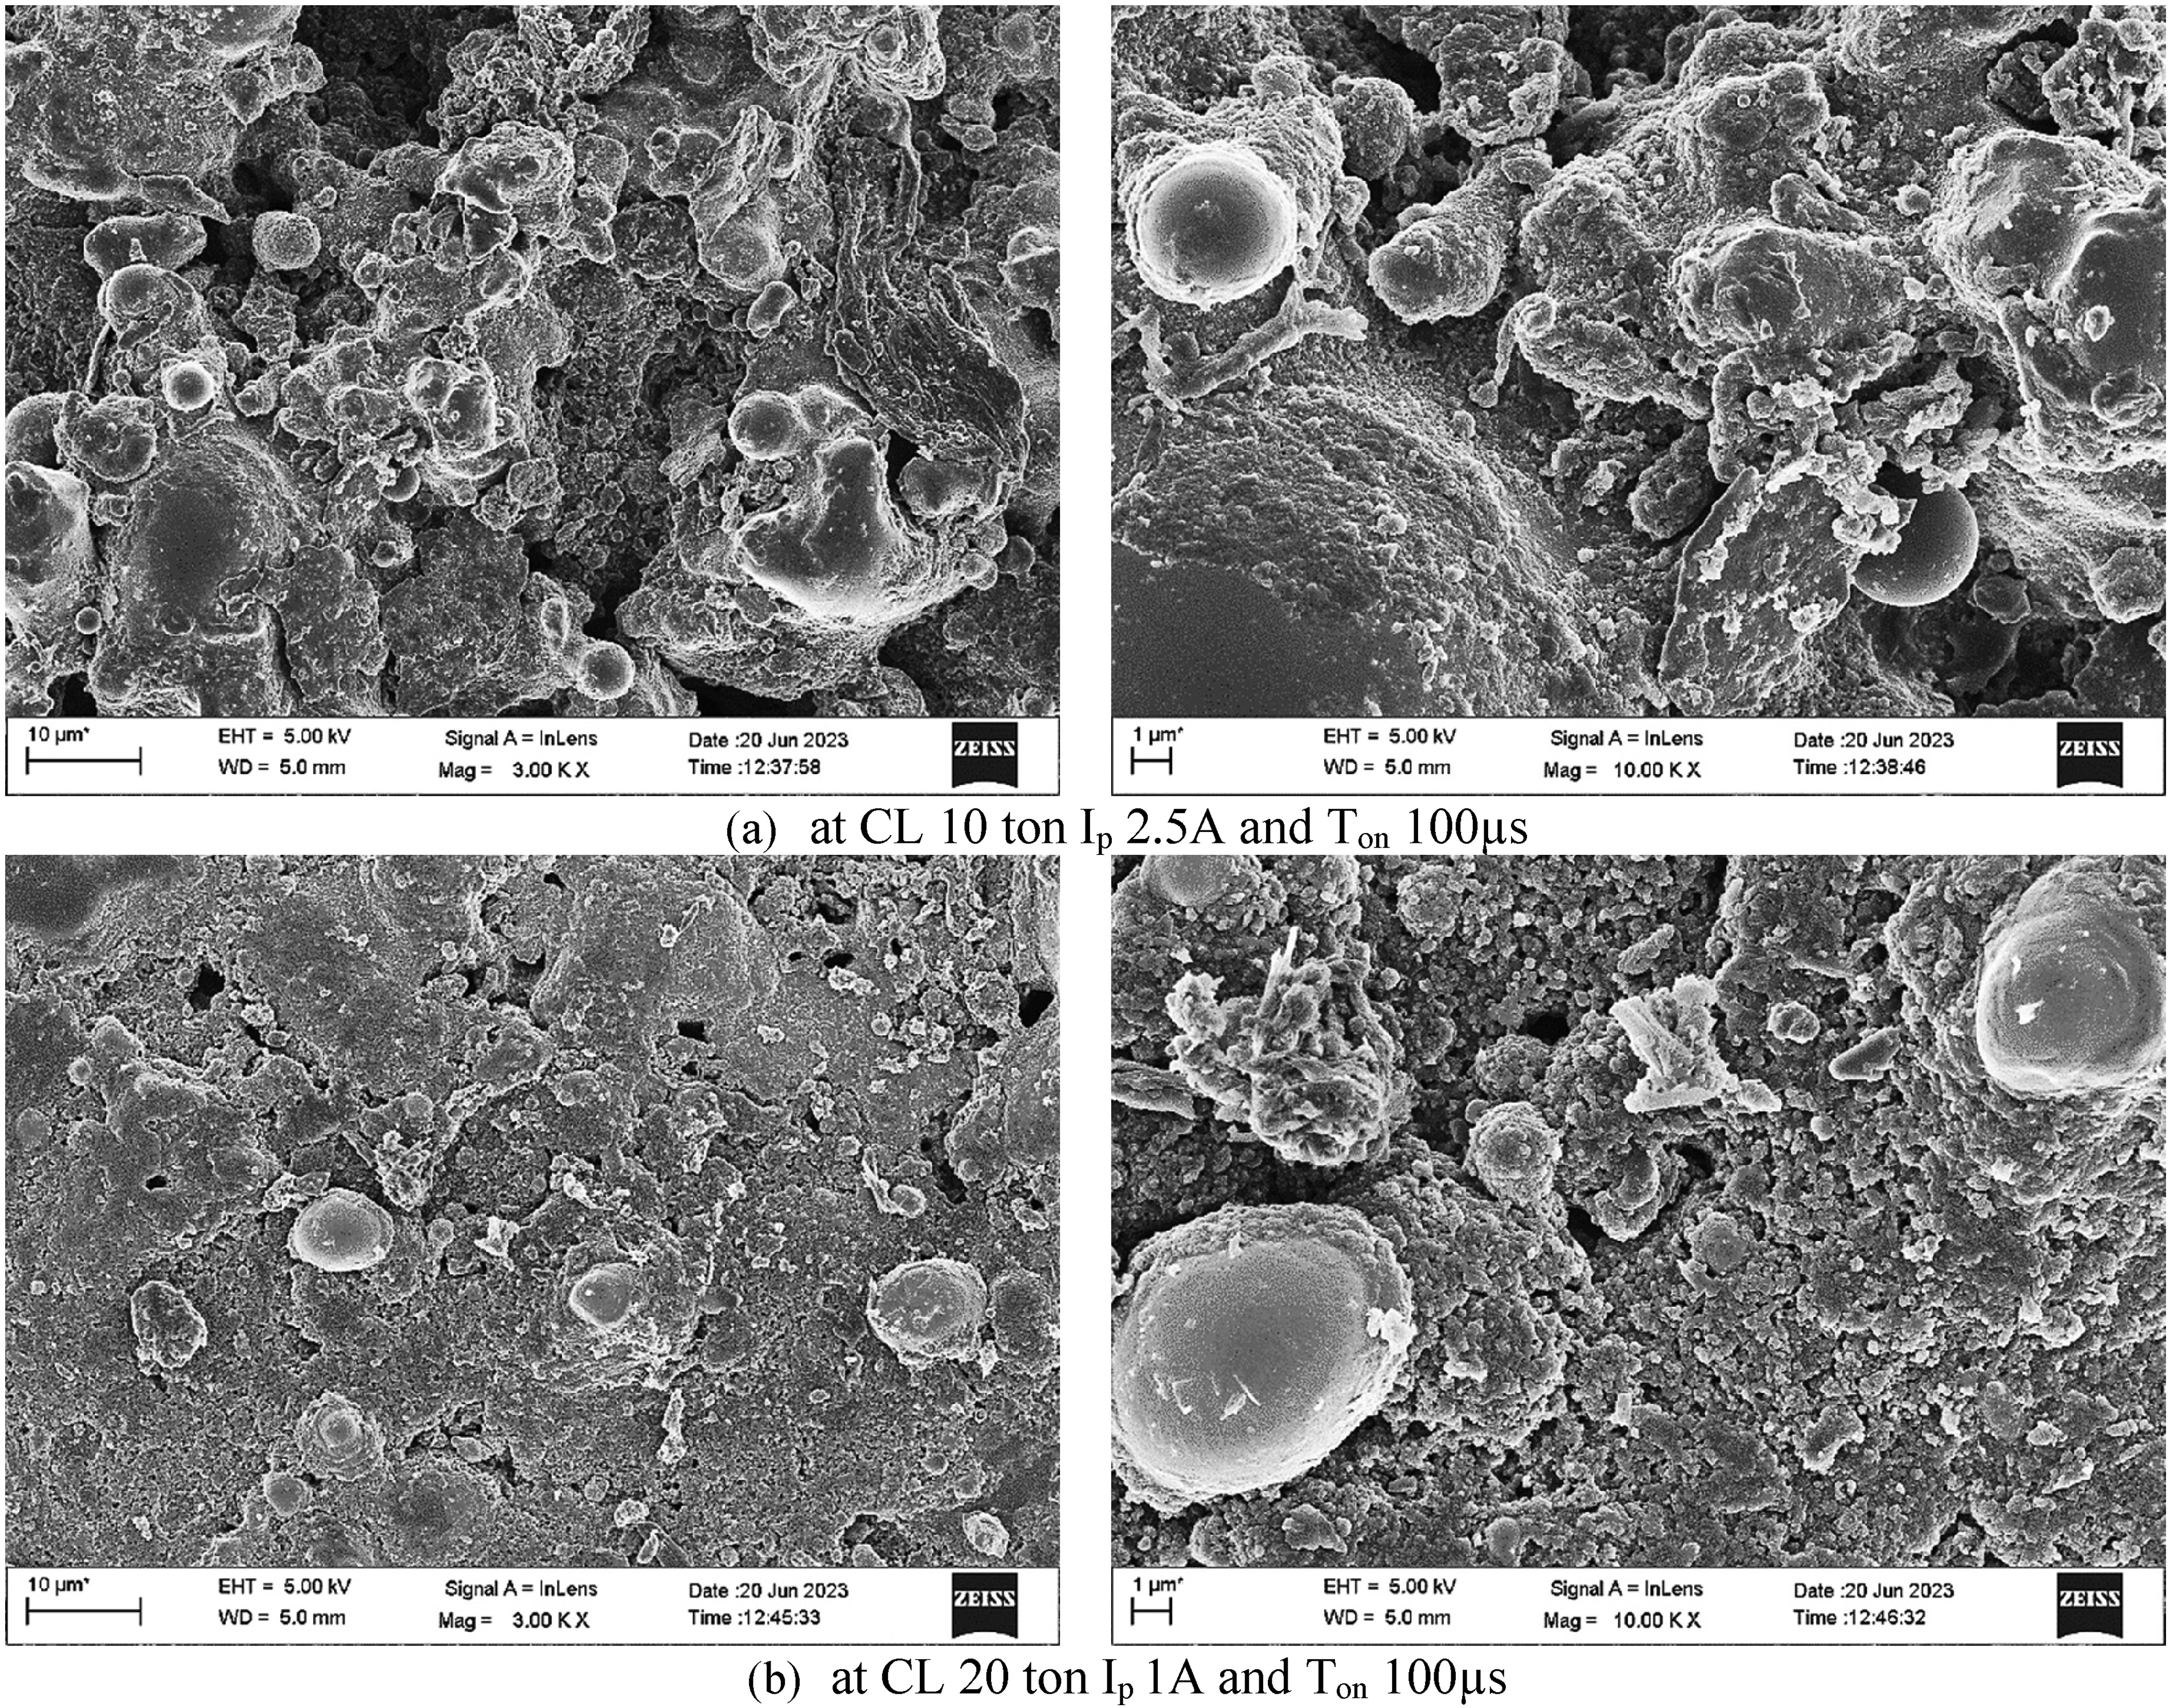
FESEM images.
EDS analysis reveals the existence of major constituents like copper (Cu), aluminium (Al), tungsten (W) and carbon (C) on the top surface. The surface composition shows different elements and their weight percentages. Figure 8 (a) and (b) displays the work piece's cross-section EDS plot to identify components in the base material and coatings under the layer. This sample is selected at 10 ton of CL and 2.5A of Ip. Figure 8 (c) and (d) displays the EDS plot on the top coated and interface surface of the deposited area in that particular area. The transfer of tool material is confirmed by W and Cu peaks. The C is liberated from the dielectric whereas, Al is from the base material. The diffusion process occurs due to the thermal energy possessed by atoms or molecules, which causes them to vibrate and move randomly. EDS is used to evaluate the diffusion of various elements from the tool to the coating. The base material and deposited surface cross-section region are selected for EDS analysis. Particles from the tool material diffused to the recast layer, suggesting a coating layer on the surfaces. The diffused tool particles weight and atomic fraction show the elemental difference between the base material and the coated layer. At the interface, the compositional percentage is more for Al as compared to the deposited surface. The compositional difference shows the variation of the particle transfer at different locations. At higher Ip, stronger sparks assimilate more particles into the modified surface. Thus, the deposited surface contains W, Cu and decomposed carbon.
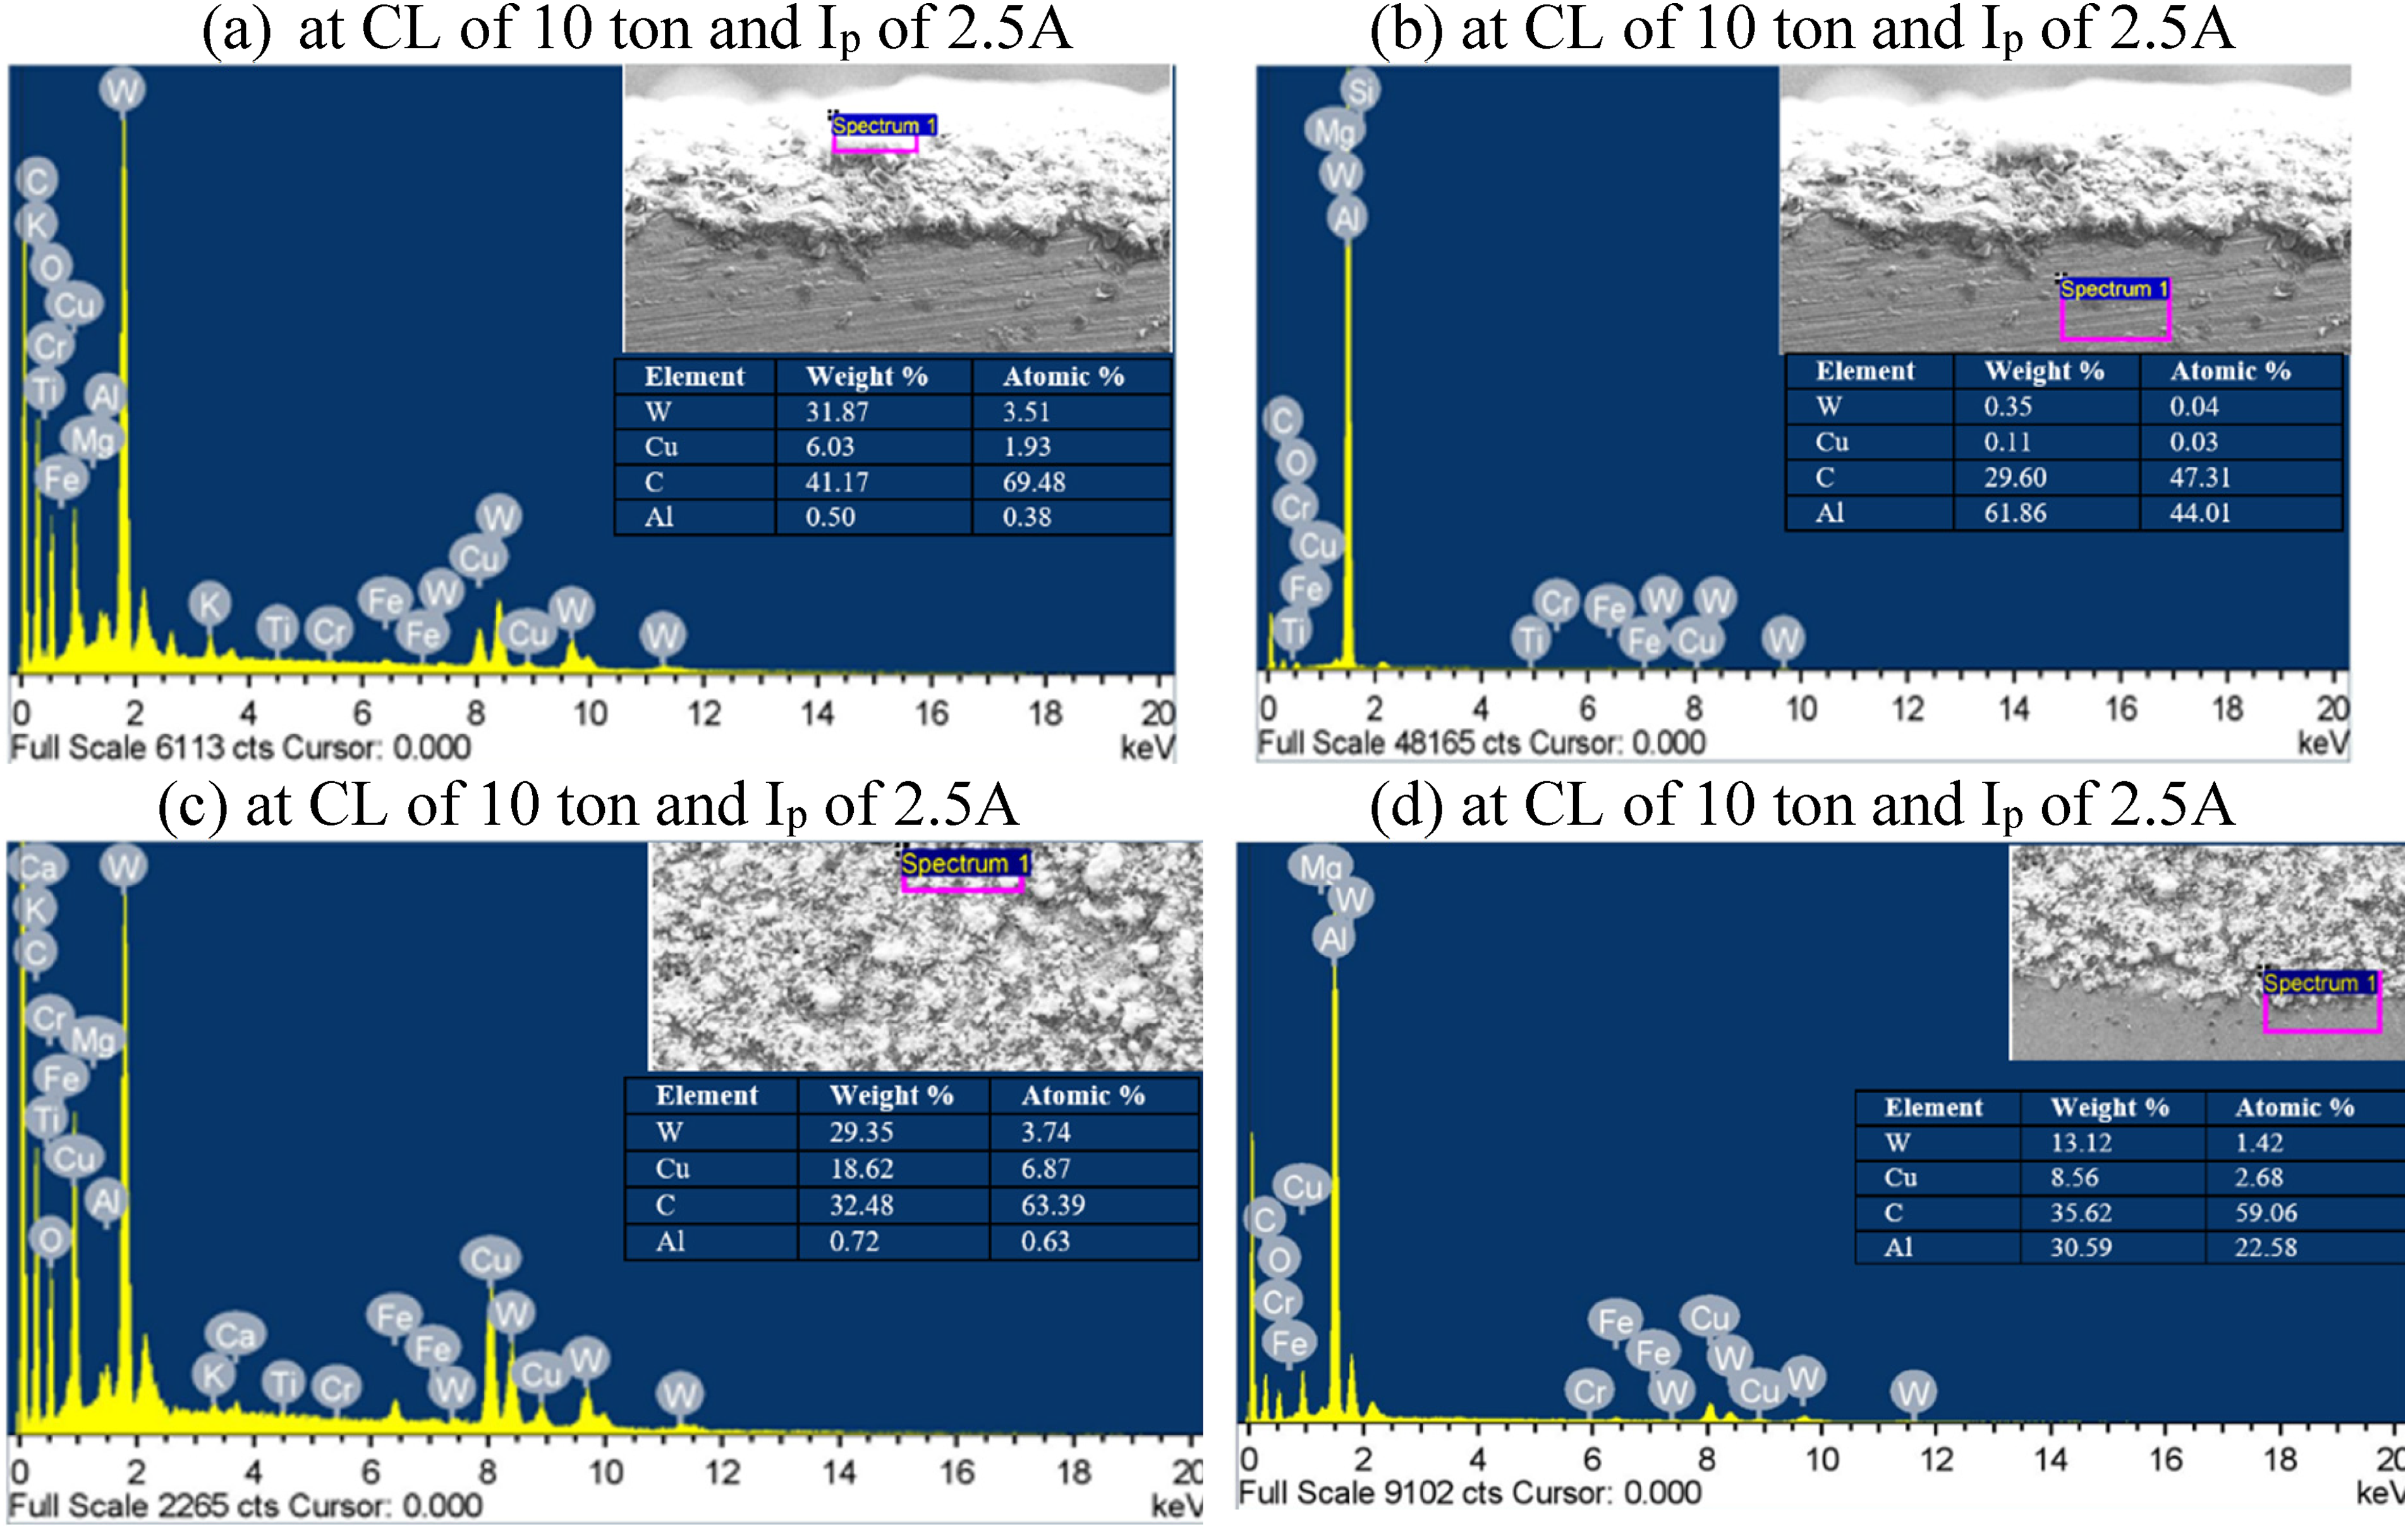
(a–b) EDS plot on the workpiece's cross-section region, (c) EDS plot on the top coated and interface surface of the workpiece.
Figure 9 shows the diffraction angle 2θ from 30° to 120°. Tool material on the work surface is also confirmed by XRD. Tungsten carbide (WC, W2C) is formed by tool particles and dissolved carbon atoms. Aluminium (Al) forms the base material, while copper (Cu) and tungsten (W) originate from the powder metallurgical tool particles employed in the process. The crystallite size, microstrain and dislocation density are interconnected parameters that provide valuable insights into the structural characteristics and mechanical properties of a material. XRD analysis is a valuable technique for determining various properties of a material, including crystallite size, dislocation density and microstrains. XRD analysis determines particle crystallite size and lattice strain. Scherrer's equation, employed in XRD analysis, calculates crystallite or grain size (D).
20
The equation relates XRD peak broadening to crystallite size. The equation can be written as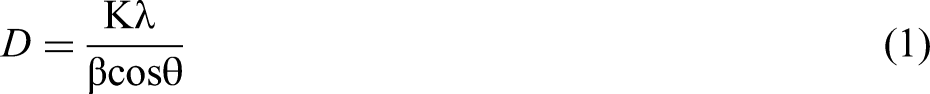
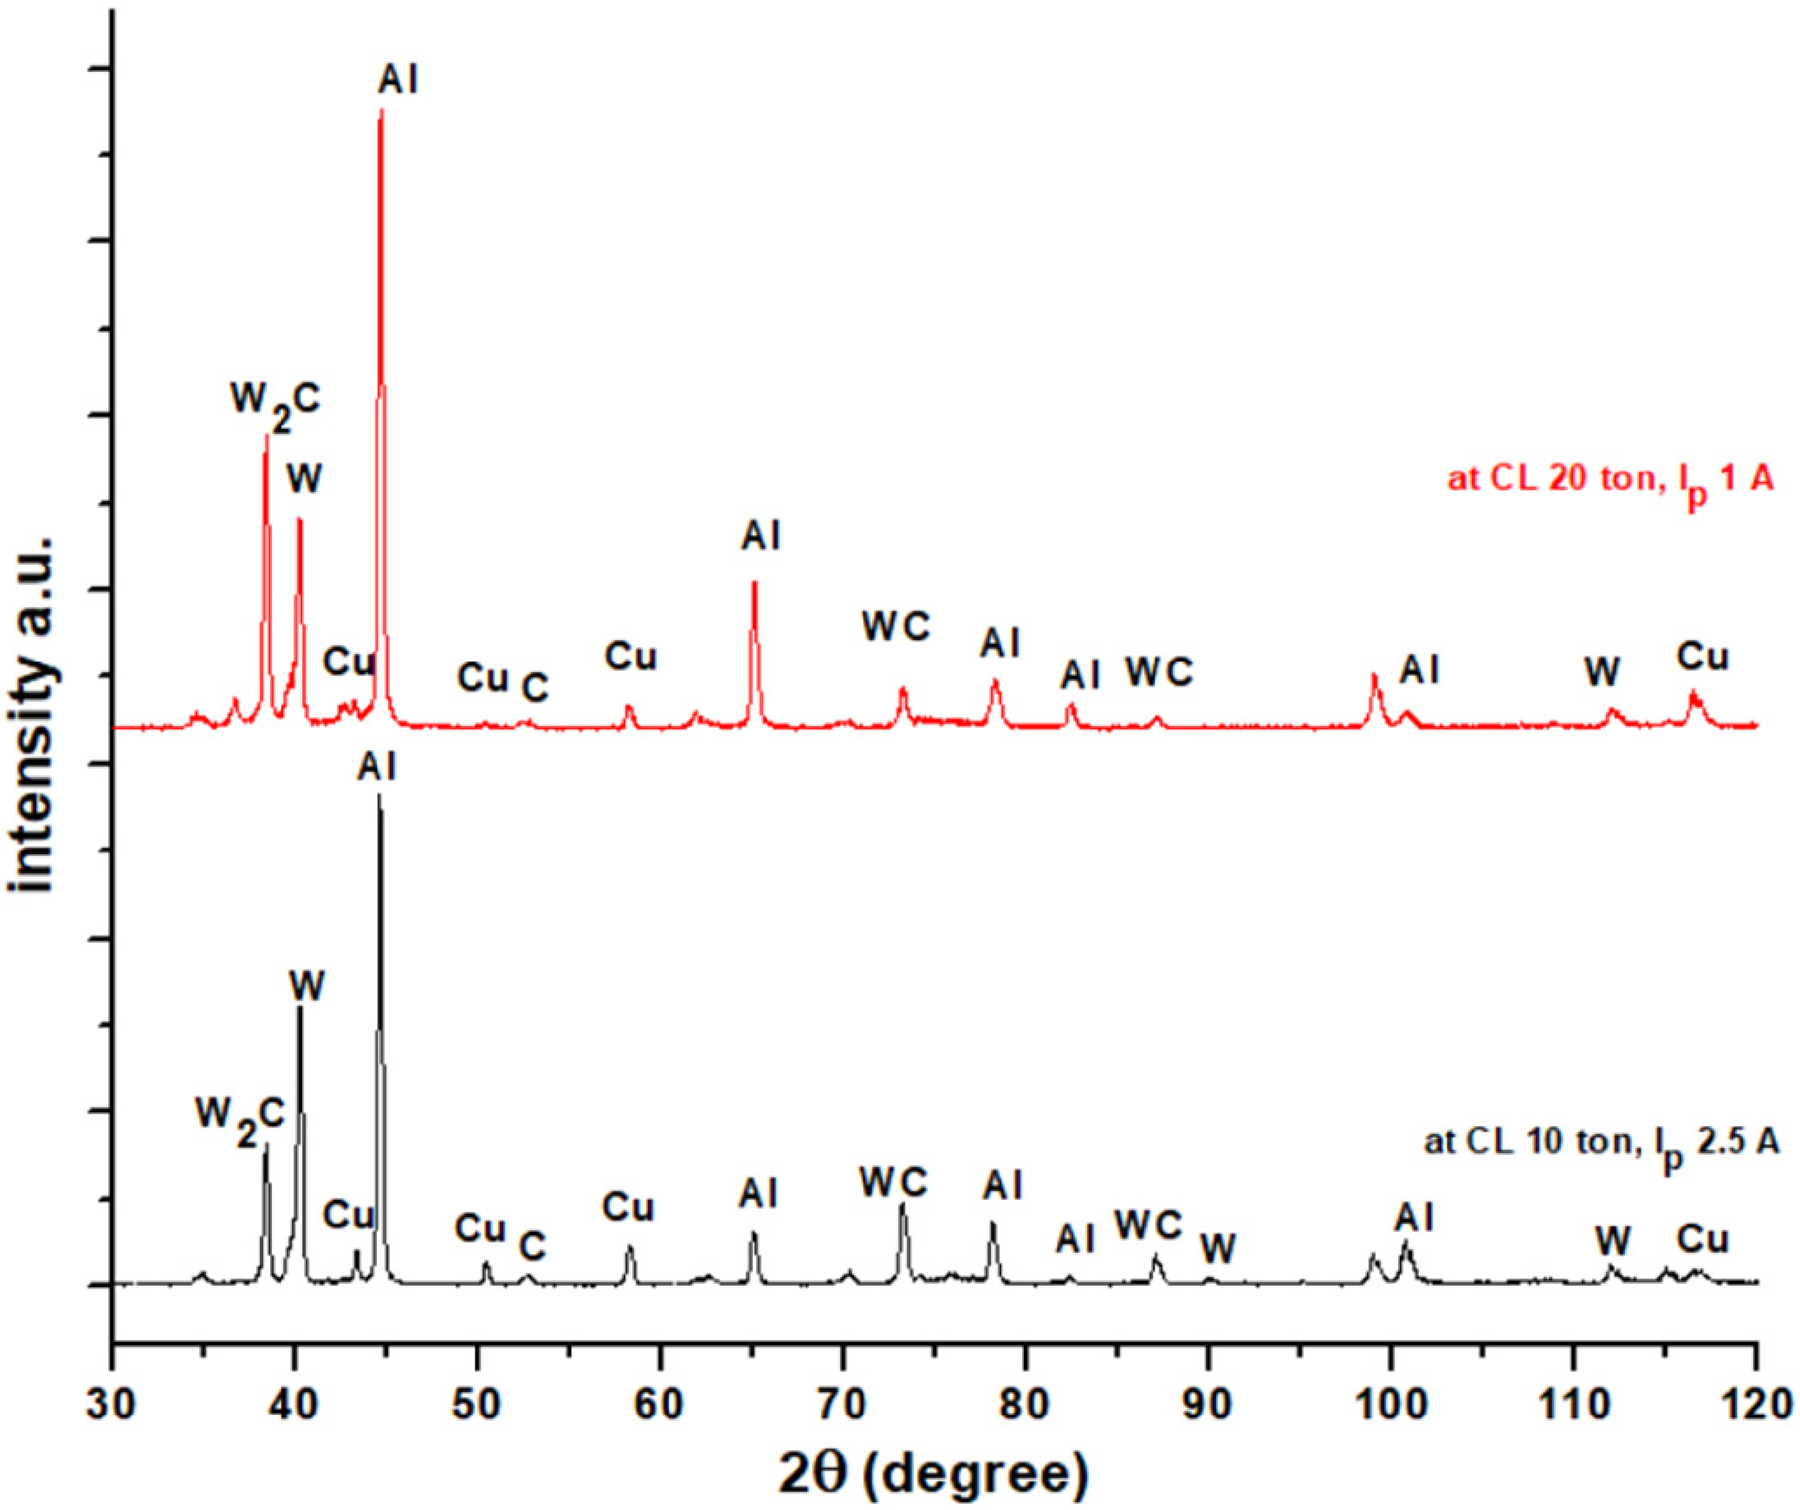
XRD patterns showing the coated workpiece sample at different parameter settings.
where D is the average crystallite size (grain size), K is the shape factor (generally considered about 0.9), λ is the X-ray wavelength (0.15406 nm), β is the peak's full width at half maximum (FWHM) and θ is the Bragg angle (in degrees).
The study of D involves investigating the relationship between the size of crystalline regions within a material and its mechanical behaviour. Crystallites are small regions within a material where the atoms are arranged in a regular and repeating pattern. Crystallite size affects the material mechanical characteristics. By measuring the FWHM of the XRD peaks and applying Scherrer's equation for each peak, the crystallite size can be calculated. The average grain size is determined by taking the average of the grain sizes obtained from multiple peaks in the XRD pattern. Microstrain quantifies the relative deformation or strain experienced by the crystal lattice. It arises due to crystal imperfections, such as dislocations, lattice defects or external stress. Microstrain affects the lattice spacing and can be estimated from the broadening of XRD peaks. Equation (2) calculates microstrain(ε) for the same crystallite size.
20
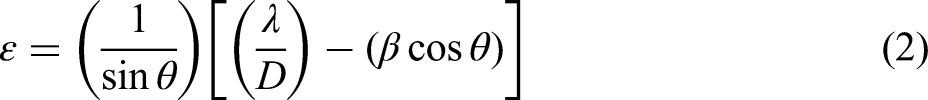

Measurement of average crystallite size (D), dislocation density and microstrain.
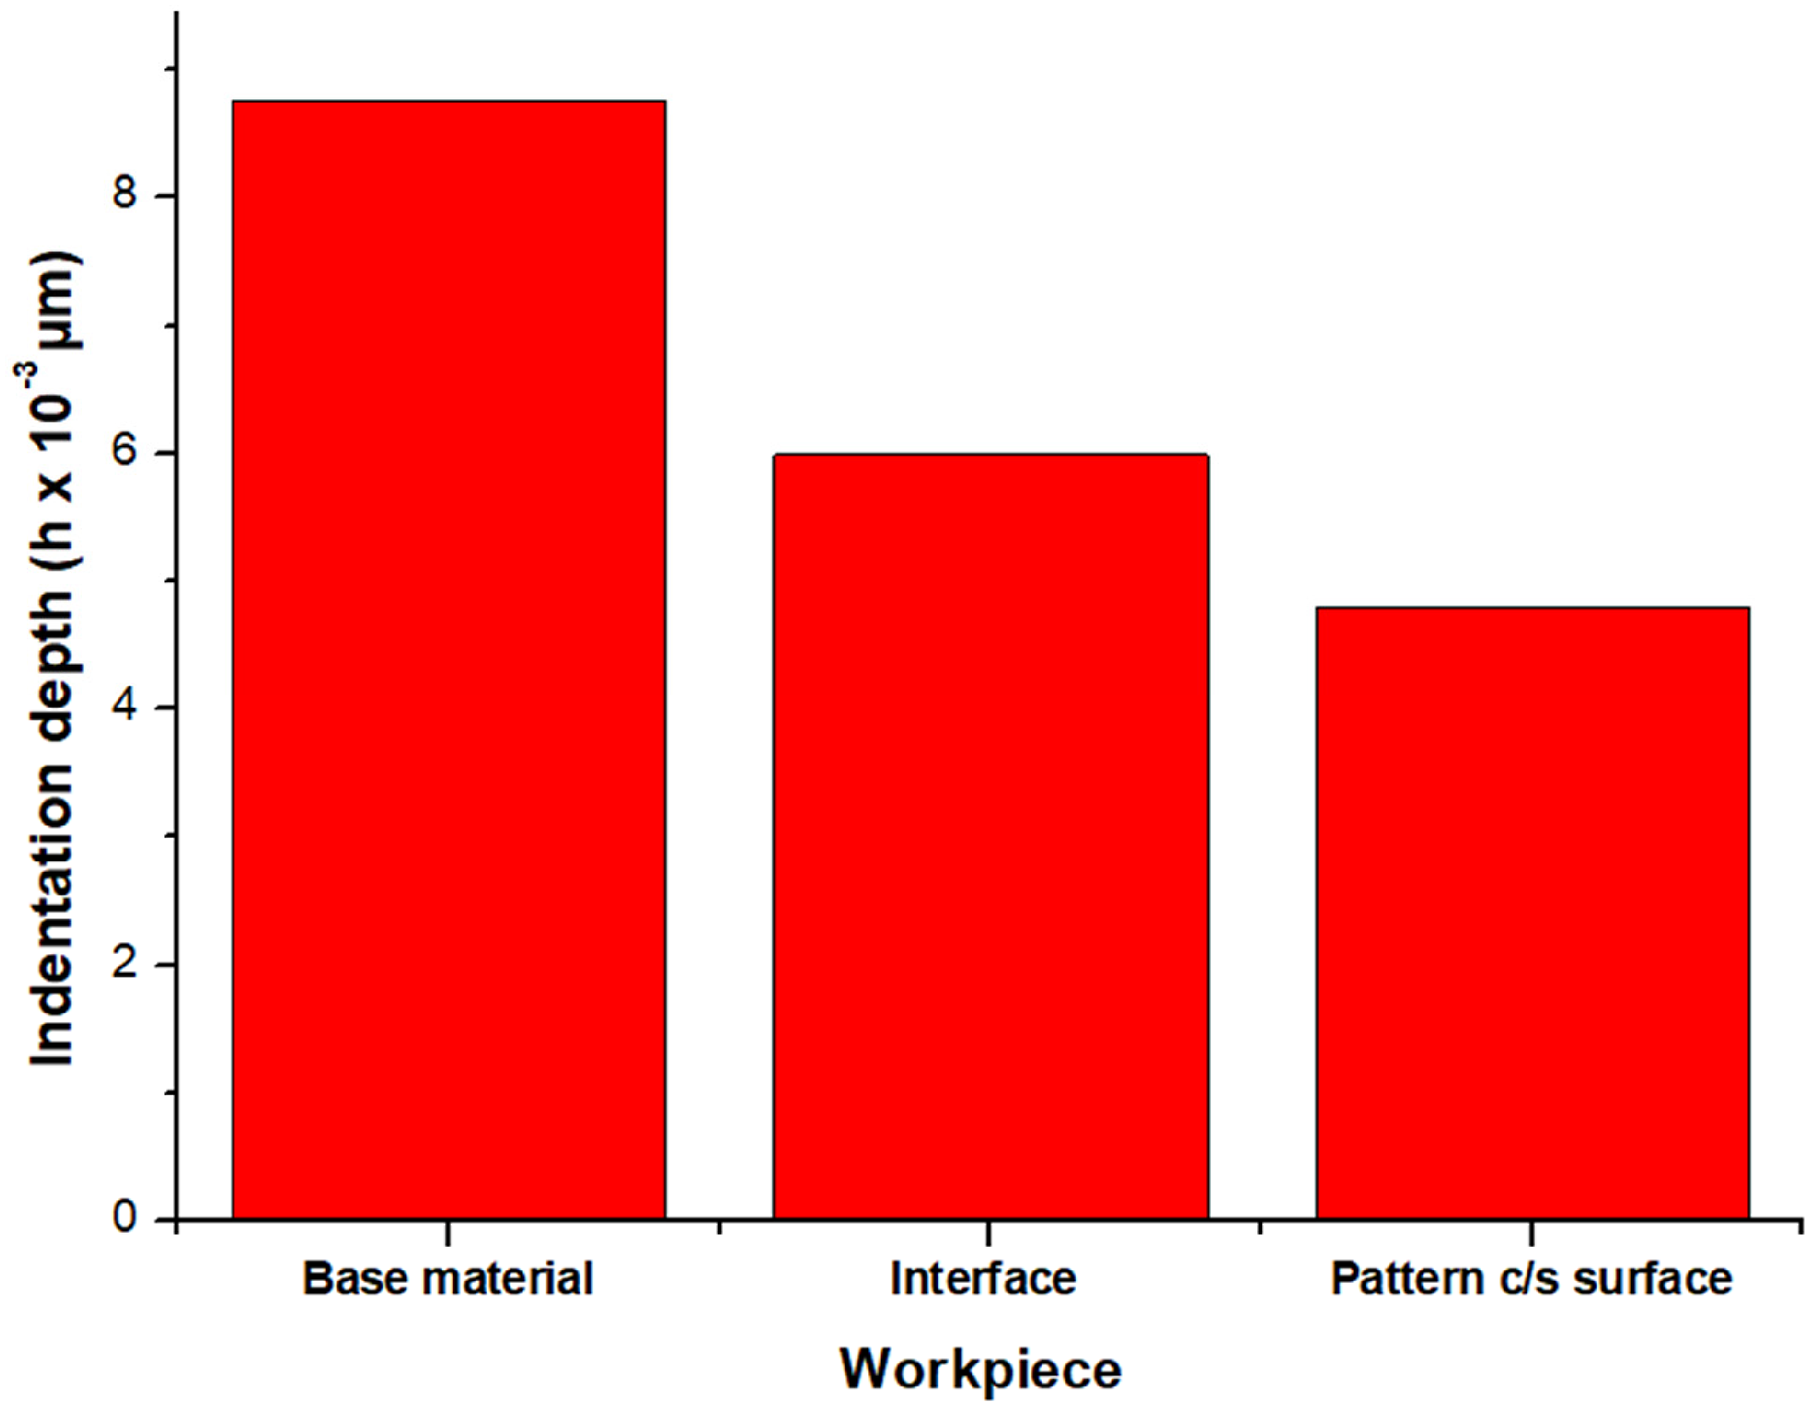
Vicker's microhardness tester measures deposited surface microhardness. Hardness is tested at 0.2 kgf force and 10 s dwell time, and indentation depths are determined. Where D is the mean of diagonals of indent area and θ = 136° is the indent tip angle. Hard tool materials harden the surface. C dissolved from the EDM oil forms carbide, which influences surface layer hardness. Surface hardness depends on carbide density. Surface hardness is 330.5 HV, while base metal hardness is 98.7 HV. The workpiece (sample 4) is transversely sectioned using a wire cut-EDM machine to measure the MH values at the base material, interface and coated layer as shown in Table 5. Due to hard tungsten deposition and carbide formation, coated samples have higher MH values. Indentation depth is also measured to correlate MH with coating thickness. Equation (4) is used to calculate the indentation depth (h).
22
The indentation depth decreases along the deposited layer due to changing hardness values. Figure 10 shows the variation in depth of indentation with time.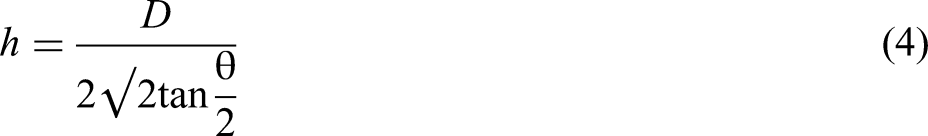
Variation of indentation depth.
Measurement of microhardness and indentation depth at transverse direction.
To predict the behaviour of wear for the coated and base material, wear tests are conducted. Surface engineering uses wear tests to assess how surface modification can reduce wear for a given application. A pin-on-disc wear test device (Make: DUCOM, TR 20 SERIES NEO) is used to carry out the test to calculate the specific wear rate. For the wear testing, a wear disc made of EN31 hardened steel measuring 60 mm in diameter is employed. The experiments are performed with a sliding load =10 N, speed = 400 rev/min and time = 600 s at 300 K (room temperature) in dry sliding conditions. Prior to the wear testing, the disc (EN31) is thoroughly polished and cleaned with acetone to get rid of any adhering particles that may have accumulated on its surface. Coated samples are cleaned and polished before the wear test to create a smooth, even surface for disc contact. The samples are attached to cylinder-shaped pins that are 30 mm long and 6 mm in diameter using bonded adhesive paste. The specific wear rate (Ws) is estimated through Equation (5).
23

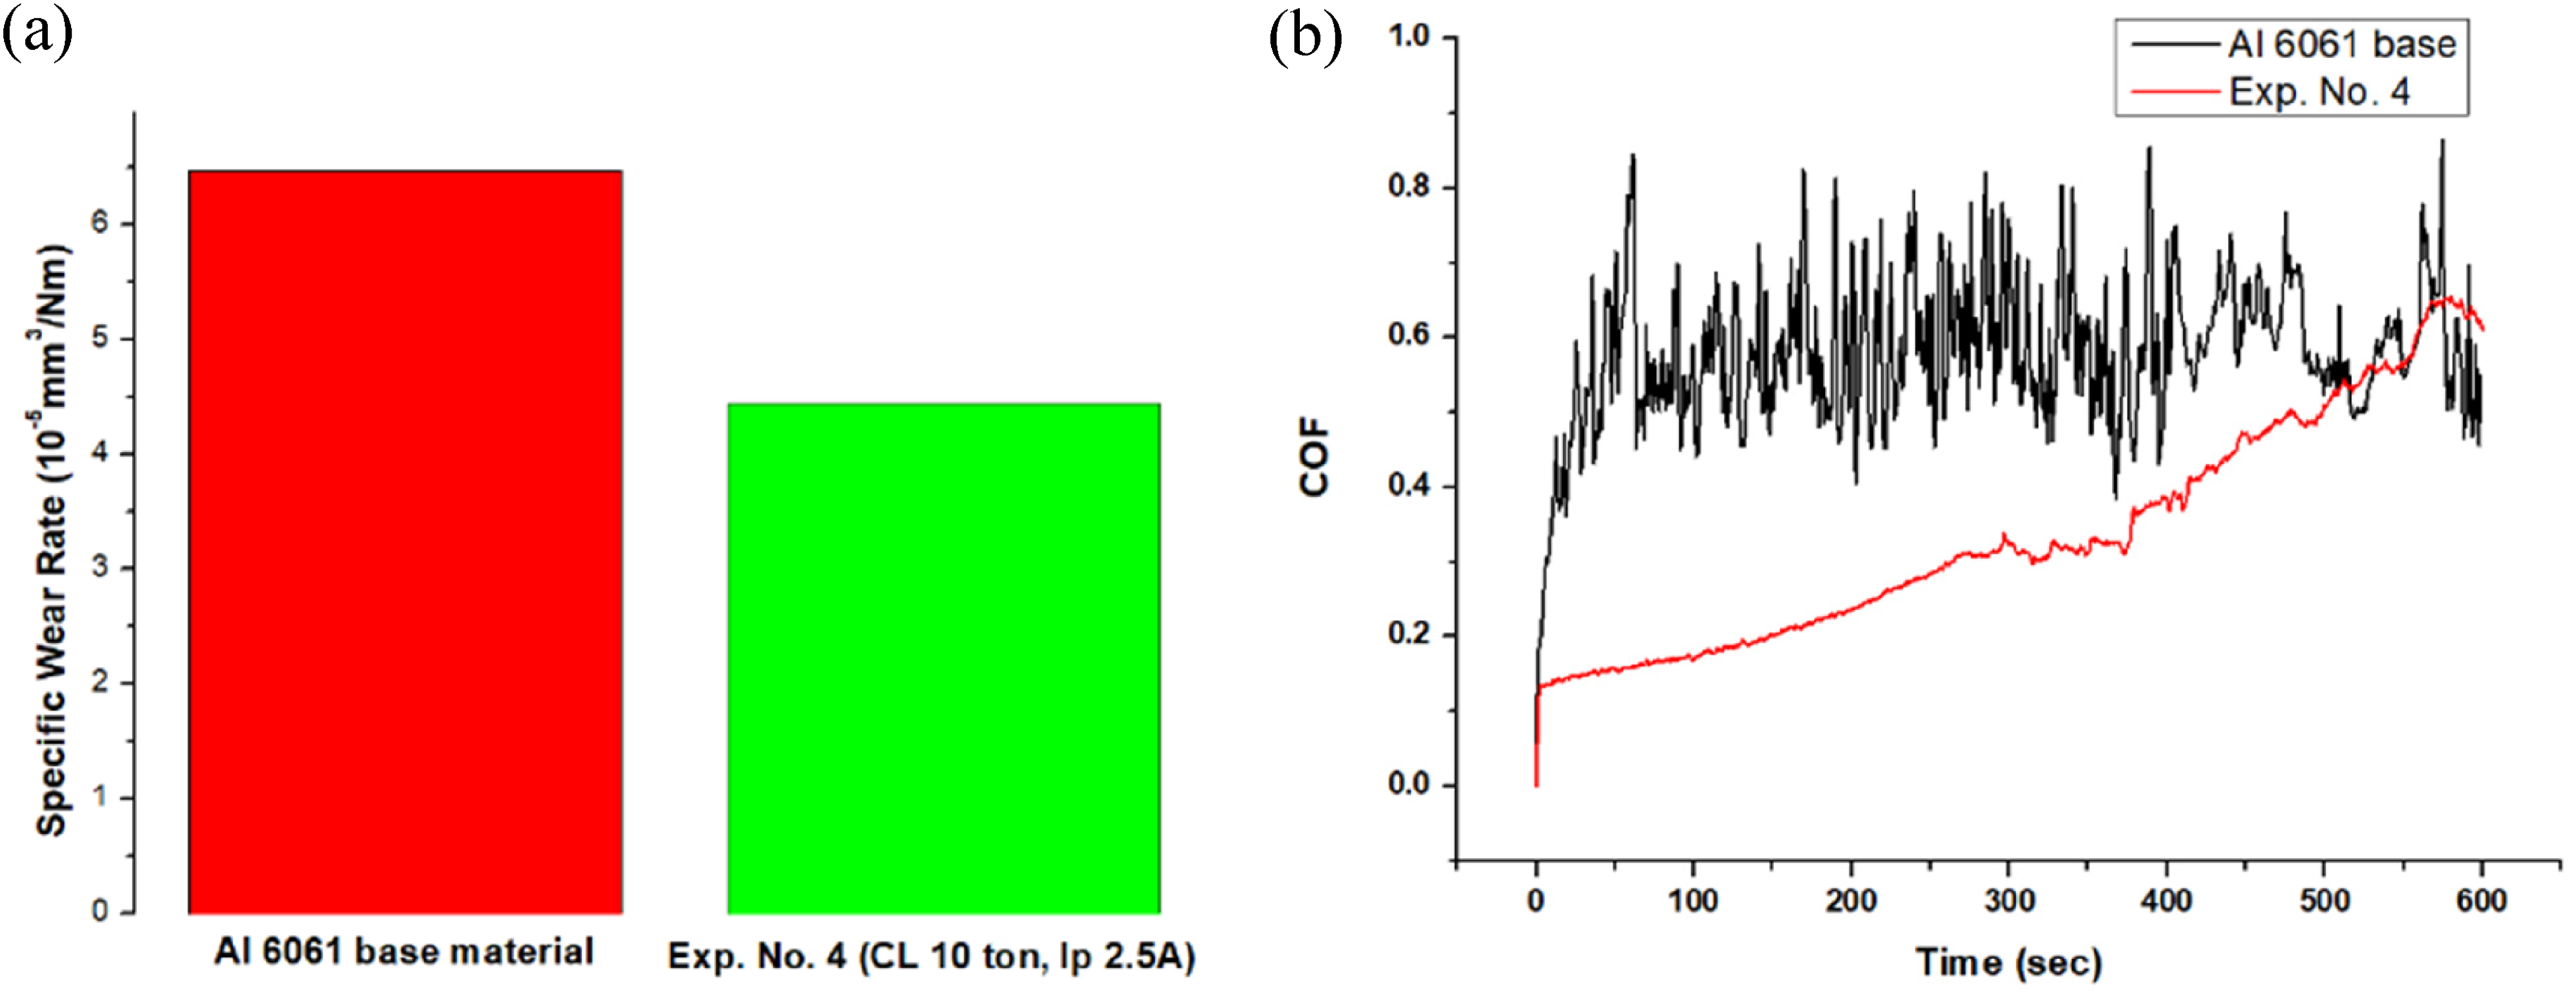
(a) variation of a specific wear rate and (b) coefficient of friction for the base material and coated samples (CL 10 ton, Ip 2.5 A).
Conclusions
The experimental study enhances surface quality and explores the tribological properties of EDC. In this process, a powdered metallurgical tool deposits its components onto the surface of Al 6061 to form the coating. The obtained results can accomplish the following conclusions.
When the CL is set to 10 ton and Ip is 2.5 A, MDR is 4.9 mg/min. However, increase in the CL to 20 ton and lower current (Ip) setting of 1 A leads to a lesser MDR of 0.46 mg/min. Experimental analysis reveals that the CL of 20 ton, Ip of 1 A and Ton of 100 µs result in minimal TWR and Ra of 1.92 mg/min and 1.70 µm, respectively. Uniform deposition of the tool particles at higher CL contributes to reduced Ra. The minimum layer thickness of 59.61 μm (sample 9) and a maximum of 293.68 μm (sample 4), demonstrating the impact of the input variables and uniformity of the deposited material. The process of transferring tool particles to the surface results in a notable enhancement of the microhardness (MH) of that surface, elevating it to a level of 330.5 HV, while in contrast, the microhardness of the base metal remains significantly lower at 98.7 HV. FESEM, EDS and XRD studies indicate tool particle migration onto the work surface, proving the PM tool particle's coating capability. The sample's COF decreases due to tool material deposition. The base material's COF is 0.47, while the coated specimen is 0.25. Thus the coating with a W–Cu PM tool sharply reduces COF.
Footnotes
Acknowledgements
The authors express heartfelt gratitude to CSIR-NEIST for providing the facilities of FESEM and EDS analyses. The authors are grateful to CIF NIT Meghalaya for XRD facilities. The authors are also thankful to Tribology Lab of M.E. Department NIT Silchar for Tribometer facility.
Declaration of conflicting interests
The authors declared no potential conflicts of interest with respect to the research, authorship, and/or publication of this article.
Funding
The authors received no financial support for the research, authorship, and/or publication of this article.