
Abstract
AZ31 magnesium alloy with different annealing temperatures was subjected to micro-arc oxidation (MAO) treatment, and its corrosion behaviour was studied using immersion experiments, polarisation curves, electrochemical impedance spectra, scanning electron microscopy (SEM) and X-ray diffraction (XRD) spectra. The alloy, when annealed at 300 °C, had the smallest grain size and the lowest electrical conductivity. Compared to other annealed alloys, the MAO coating had the smallest pore size and porosity and better corrosion resistance. The corrosion resistance of the alloy increased initially and then decreased with the increase in annealing temperature. This is mainly because the grain size first decreases and then increases, leading to a decline in electrical conductivity and then a rise, resulting in changes in the microstructure of the coating surface.
Introduction
Magnesium alloy has the advantages of low density, high specific strength, high specific stiffness, etc., and has broad prospects in transportation, aerospace, biomedicine, electronic industry and other fields.1–3 Magnesium belongs to the close-packed hexagonal crystal structure, and there is less slip system at room temperature, so its room temperature plasticity is poor. Magnesium alloy will produce twins during the rolling process, and the dynamic recrystallisation, so that the grains are refined, thereby affecting the mechanical properties of magnesium alloys. 4 Magnesium has high chemical activity, is prone to galvanic corrosion with other metals and has poor corrosion resistance. 5
So far, scholars have done a lot of research on improving the properties of magnesium alloys. Zhang et al. 6 showed that the yield strength and ultimate tensile strength of Mg–2Ag alloy increased significantly after multi-pass hot rolling treatment, and the elongation also changed with the increase of rolling passes. Wang et al. 7 have shown that compared with pure Mg, the ductility and stretch formability of Mg–3Y alloy can be improved simultaneously through cross-rolling at high temperatures and subsequent annealing. Li et al. 8 have shown that under current densities below 30 A/dm2, the corrosion resistance and photo-thermal properties of the Mg–3Zn–0.2Ca alloy micro-arc oxidation (MAO) coating continue to improve as the current density increases. These studies show that plastic deformation, MAO and heat treatment can affect magnesium alloys’ mechanical properties and corrosion resistance.
The MAO process is a method of coating a ceramic surface on an alloy, which effectively improves its corrosion resistance.9–12 In previous experiments on MAO, researchers have considered various factors, such as electrolyte composition, electrical parameters and additives. However, there are few literature reports on how deformation and annealing can also affect the corrosion behaviour of MAO coatings on alloy matrices. Wasekar 13 proposed the relationship between grain size and corrosion current, showing an inverse relationship between Hall Page-type functions. Annealing can produce new microstructures of elongated or recrystallised grains, thereby altering the properties of the alloy. Grain size also affects the performance of MAO coatings. Yin et al. 14 studied the MAO coating prepared by Ti plate and sputtered Ti film and found that adjusting the grain size and configuration can control the phase structure and surface morphology of the oxide film. Gu et al. 15 performed ultrasonic cold forging (UCFT) pre-treatment on Ti6Al4V alloy before MAO. UCFT refined the grains, making the MAO coating denser and more uniform, reducing pores. Dense and smaller pores can effectively prevent corrosion media from infiltrating the matrix, improving the corrosion resistance of the alloy. However, the effect of grain changes generated during deformation and annealing on MAO performance and corrosion behaviour of AZ31 magnesium alloy is still unclear, and further research is needed. The objective of the present study is to clarify the relationship between deformation, annealing and microstructure, performance as well as corrosion behaviour of MAO coatings on magnesium alloy.
Materials and methods
Material preparation
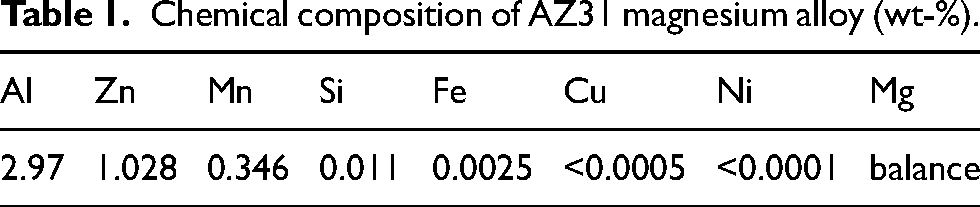
The cast AZ31 magnesium alloy used in this study is provided by Dongguan Zhenghong Metal Materials Co., Ltd, and its main components are shown in Table 1. The material is cut into a plate with a thickness of 6.5 cm by wire cutting, and then the plate is homogenised at 400 °C for 12 hours, and then the plate is hot rolled to a thickness of 2 cm in the casting direction at 400 °C, and finally annealed at different temperatures, the annealing temperature is 200, 250, 300 and 350 °C.
Chemical composition of AZ31 magnesium alloy (wt-%).
Hardness test and electrical conductivity test
The hardness test was conducted according to ASTM E92-2017 standard on a 200HVS-5 microhardness machine with a load of 0.5 kg. The hardness value is measured five times in different areas of the sample surface, and the maximum and minimum values are removed to obtain an average value. The electrical conductivity test was conducted according to ASTM B5-11 standard on a Sigma 2008C2 digital conductivity meter. Measure the values of five different regions, and remove the maximum and minimum values to find the average value.
MAO test
MAO uses a JHMAO-380/20H MAO instrument (Xi’an Jintang Material Application Technology Co., Ltd), which is mainly composed of an MAO power supply, electrolyser and automatic stirring device. AZ31 magnesium alloy as the anode, electrolyser as the cathode. A typical silicate electrolyte system is used, sodium silicate 5 g/L, potassium hydroxide 11 g/L, sodium fluoride 8 g/L. Before the MAO treatment, the surface of all samples is smoothed with sandpaper of 400 to 2000 grit, and then the specimen is punched and tied to the copper rod by aluminium wire. Constant current mode is adopted, the current density is 5.2 A/dm2, the frequency is 500 Hz, the duty cycle is 20% and the coating is obtained by depositing in the electrolytic cell for 20 minutes.
Microstructure
The microstructure of the annealed sample was observed using optical microscopy (OM), ground with sandpaper of 400 and 2000 particle size, and then polished with 0.5 μm diamond polishing to prepare optical microscope samples, and the polished surface was etched by picric acetic solution (mixture of 3 g picric acid, 5 mL acetic acid, 5 mL distilled water and 35 mL ethanol) to reveal the micromorphology of the sample surface. The surface topography and cross-sectional morphology of MAO samples were studied by scanning electron microscopy (SEM, JSM-IT100). The surface roughness was evaluated using laser scanning confocal microscopy (OLS4100). X-ray diffraction (XRD, D/MAX25000) was used to confirm the phase structure of ceramic coatings on the surface of all MAO samples, where the 2θ value was between 10° and 90°, the step size was 0.02, the scan rate was 2°/min, and the test data were analysed with jade software.
Immersion corrosion test
The immersion experiment test was conducted according to ASTM G31 standard. MAO samples were immersed in 3.5 wt-% NaCl solution for 14 days at room temperature to study the corrosion behaviour of micro-arc-oxidised AZ31 magnesium alloy. After the immersion test, the surface topography after corrosion was observed using SEM, corrosion products were detected by XRD and corrosion depth was observed using OM.
Electrochemical corrosion
The electrochemical corrosion test was conducted using ASTM G5-94 (2017) standard. The CS350 electrochemical workstation (Wuhan Koster Co., Ltd) was used to measure the potentiodynamic polarisation curve and electrochemical impedance curve of the sample after maintaining the steady state for 20 minutes under the open circuit potential (OCP) at a scanning rate of 1 mV/s. A traditional three-electrode system is used for potentiodynamic scanning, the platinum electrode is the auxiliary electrode, the saturated calomel electrode is the reference electrode, and the test sample is the working electrode. The polarisation test scans between −0.3 and 0.3 V at a scanning speed of 1 mV/s. Fit the test data with CS Studio software. The impedance is carried out by a CHI660E electrochemical workstation, the frequency is in the range of 0.01 to 100,000 Hz, the amplitude is 0.01 V, and ZSimpWin software is used to fit the data.
Results and discussion
Microstructure
Optical micrographs of rolling and annealing are shown in Figure 1. Hot rolled alloys are mainly composed of coarse grains, fine grains, twins, and shear bands. As can be seen from Figure 1(a), the shear bands are generated from the grain boundary during the rolling process. With the increase of annealing temperature, the number of twins and shear bands is constantly decreasing, and the elongated grains are transformed into fine equiaxed grains, and there is a tendency to grow abnormally. When the annealing temperature is 250 °C and above, partial recrystallisation grains are observed. The annealing temperature of 300 °C has finer, homogeneous equiaxed grains. The average grain size in the hot-rolled and annealed states is shown in Figure 2. As the annealing temperature continues to increase, the average grain size decreases, but due to the grain growth, after complete recrystallisation, the average grain size of the sample increases under annealing at 350 °C. In the hot rolled state, the average grain size of 200, 250, 300 and 350 °C is 9.5, 7.3, 6.7, 6.4 and 11.2 μm, respectively.
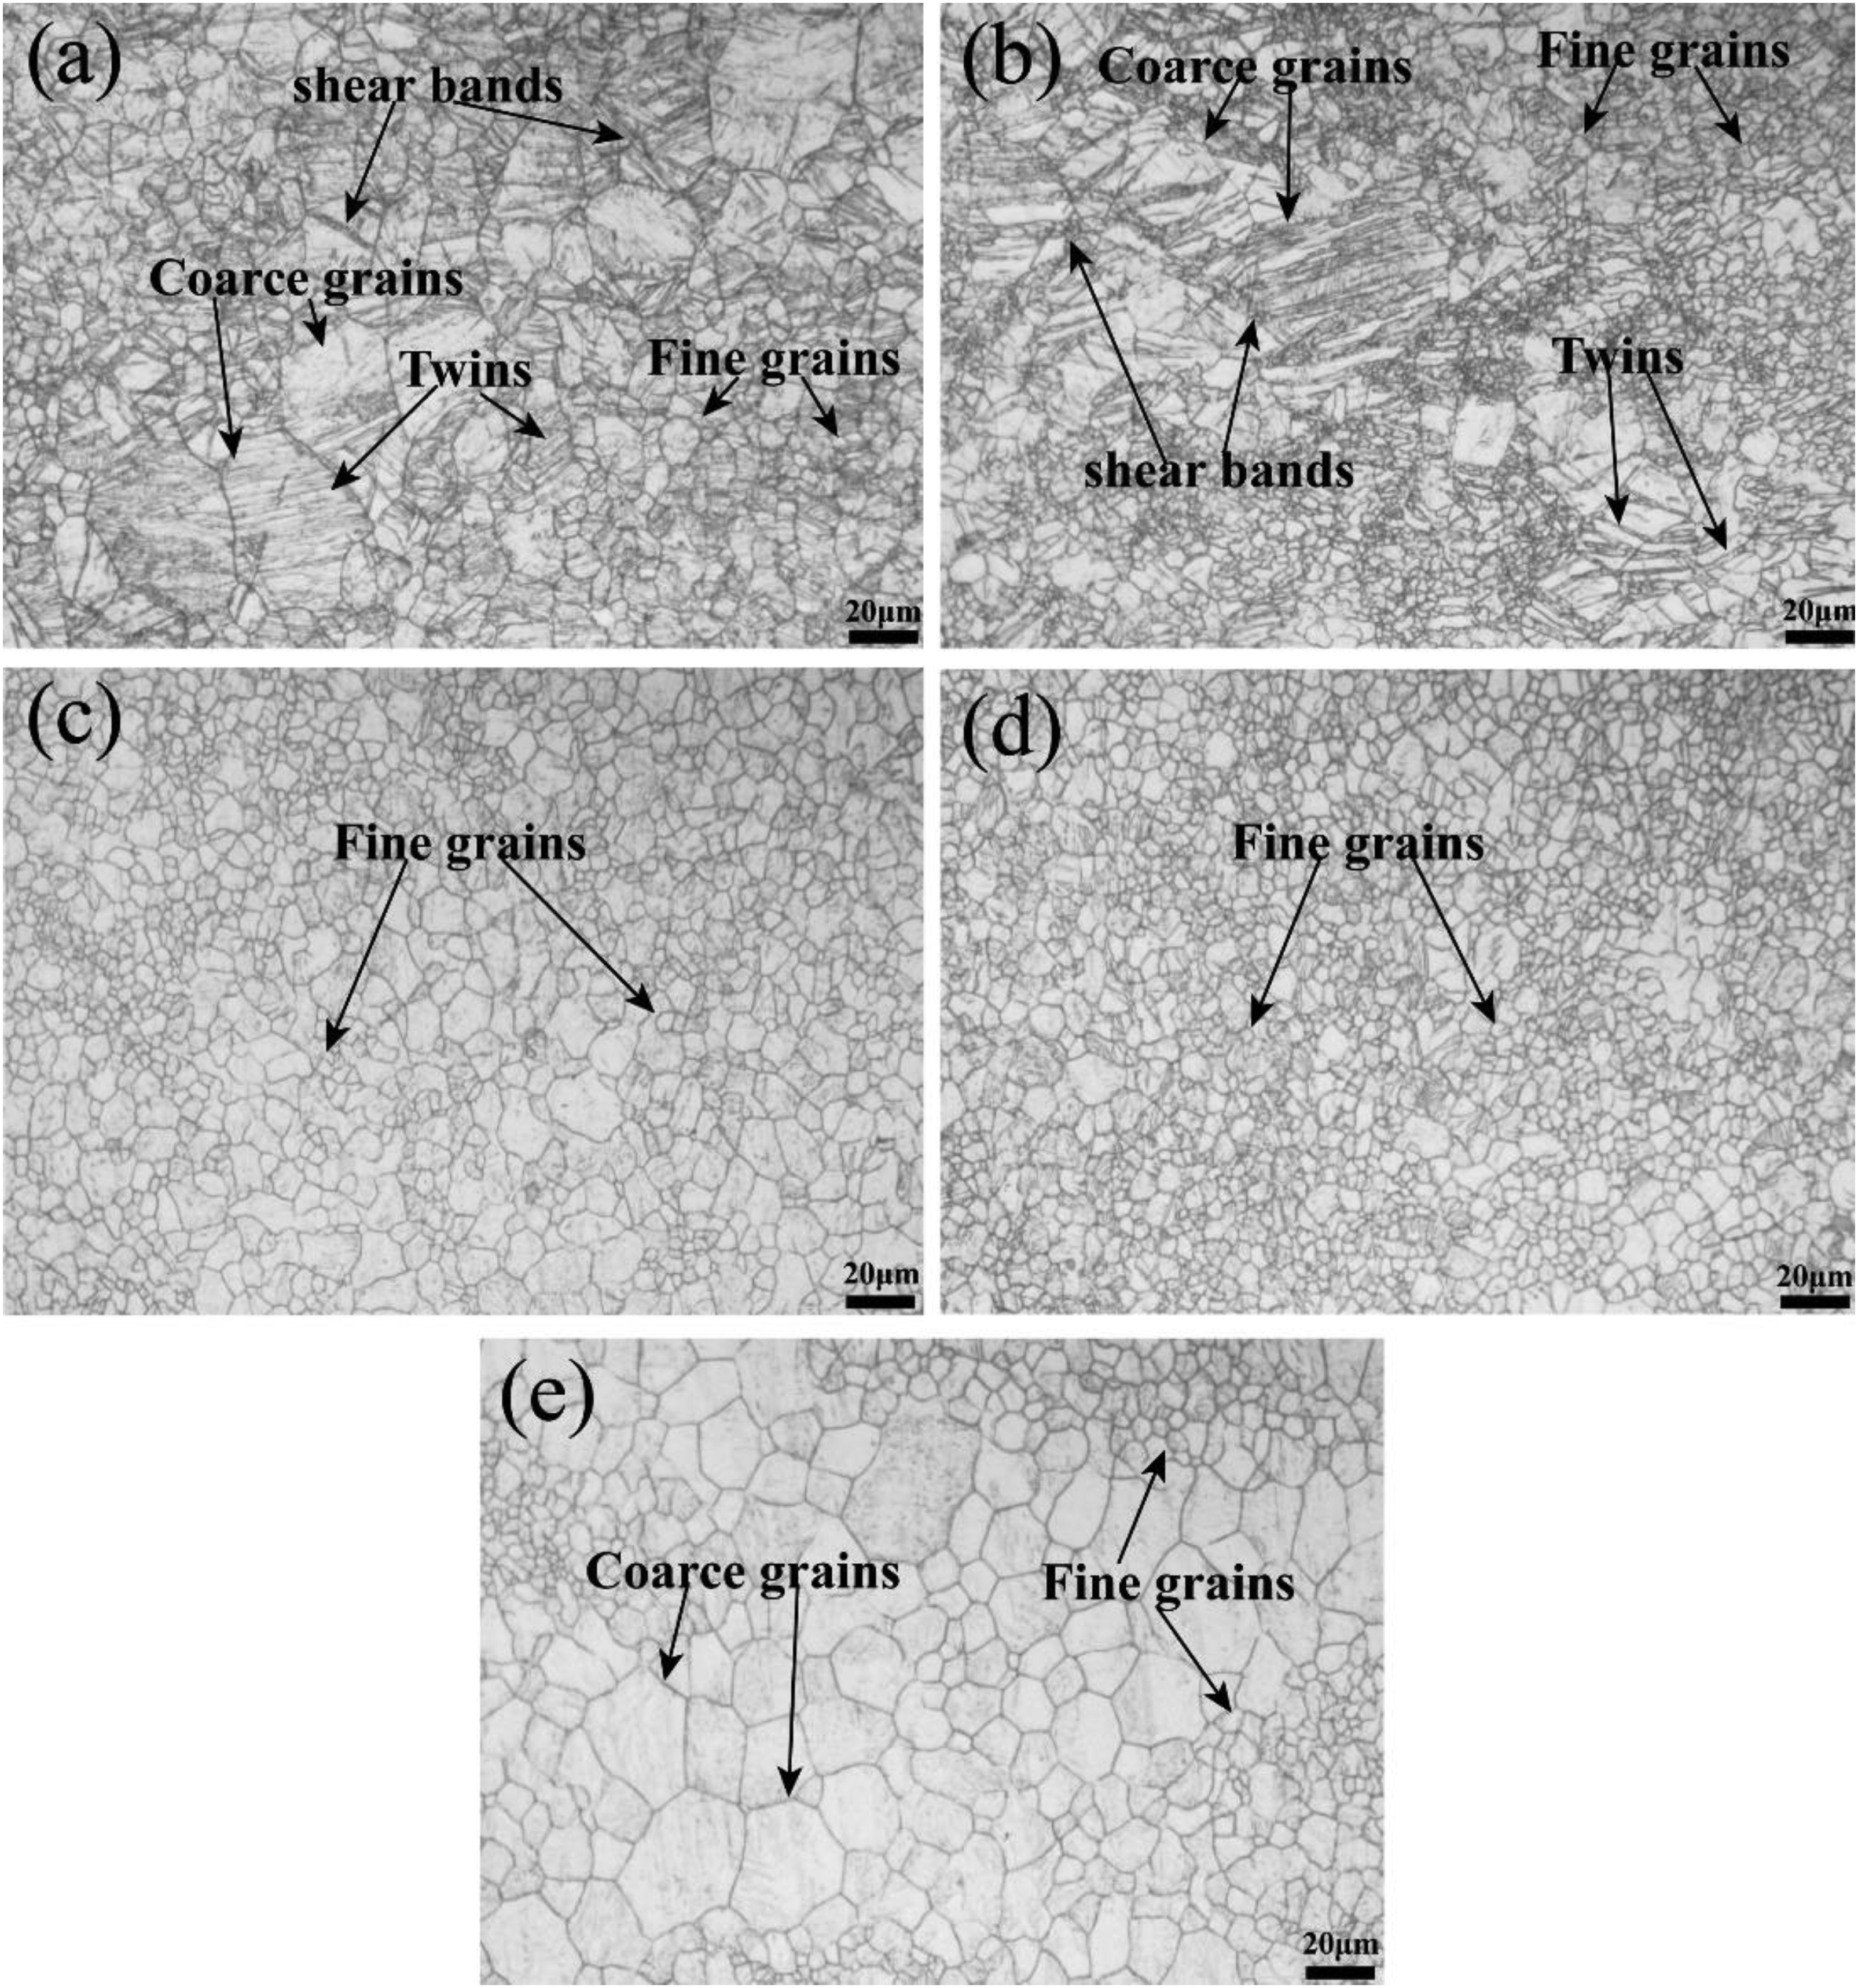
Optical micrographs of AZ31 magnesium alloy sheet at hot-rolled and different annealing temperatures: (a) hot rolled state, (b) 200 °C, (c) 250 °C, (d) 300 °C and (e) 350 °C.
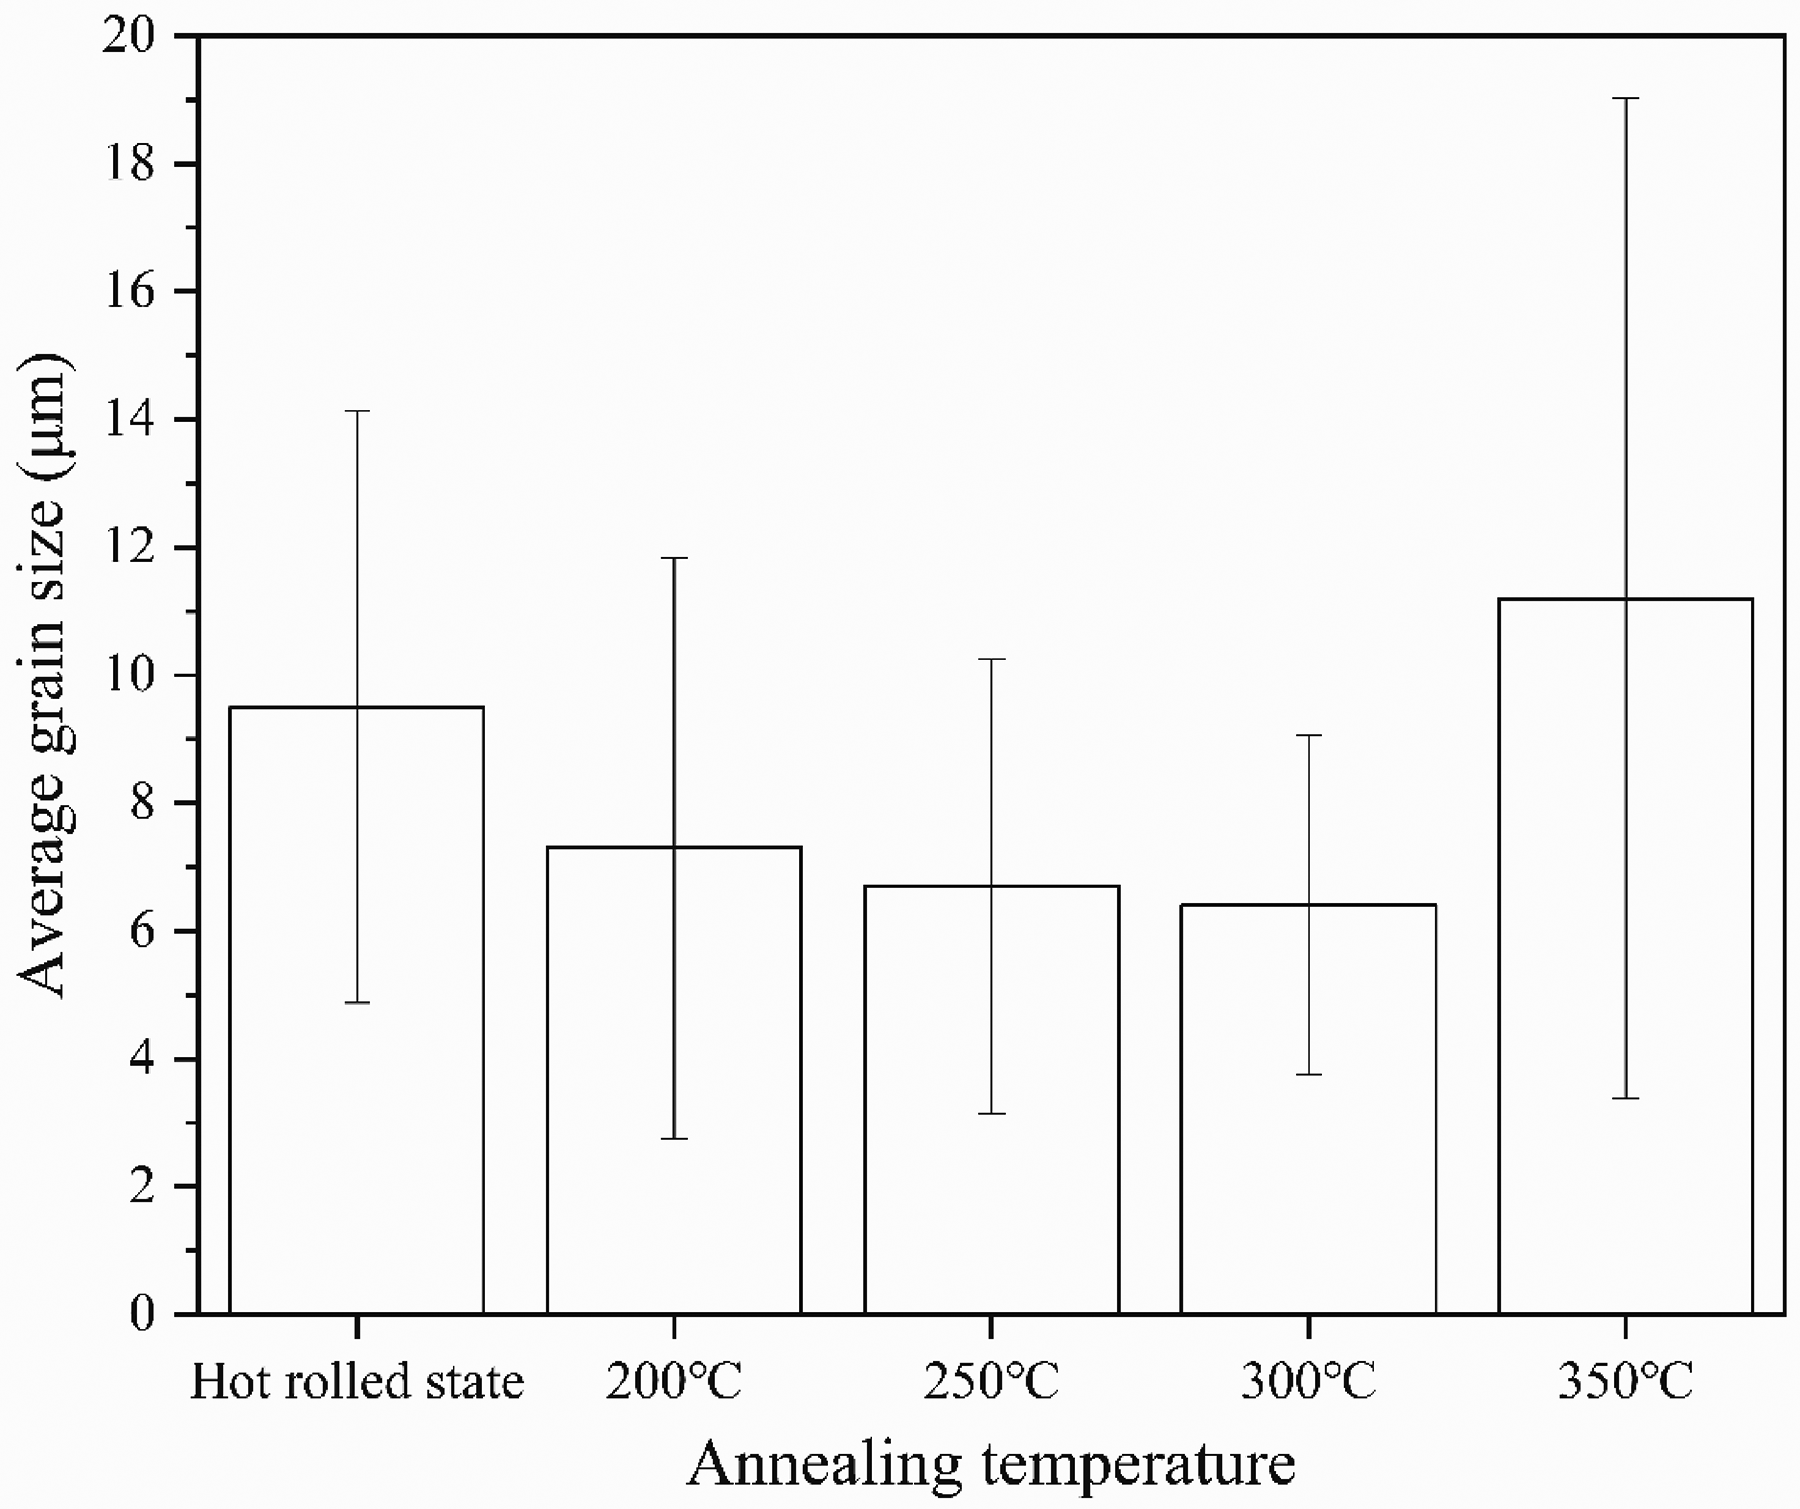
Average grain size of AZ31 magnesium alloy at hot-rolled and different annealing temperatures.
Alloy hardness and electrical conductivity at different annealing temperatures
Figure 3 shows the hardness and electrical conductivity of AZ31 magnesium alloy hot-rolled sheet after various annealing temperature treatments. It can be seen from the figure that with the increase in annealing temperature, the hardness of AZ31 magnesium alloy gradually decreases. When the annealing temperature is lower than 250 °C, the hardness is rapidly reduced from 83 to 63 HV0.5. When the annealing temperature is higher than 250 °C, the hardness is slowly reduced from 63 to 60 HV0.5. During the annealing process, the internal defects of the material crystals are reduced and the grains grow larger, which will reduce the hardness of the material. In addition, the electrical conductivity falls first and then rises, and the electrical conductivity is the lowest at 300 °C. The electrical conductivity and electrical resistivity are reciprocal to each other. The Mayadas
16
equation can be used to determine the changes in electrical resistivity caused by electron scattering at grain boundaries: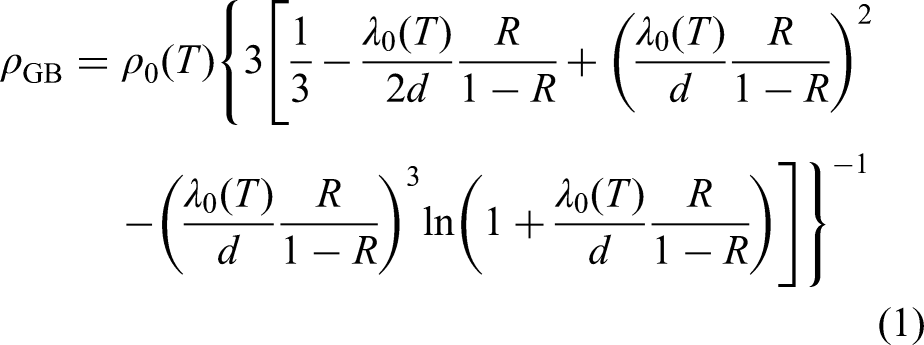
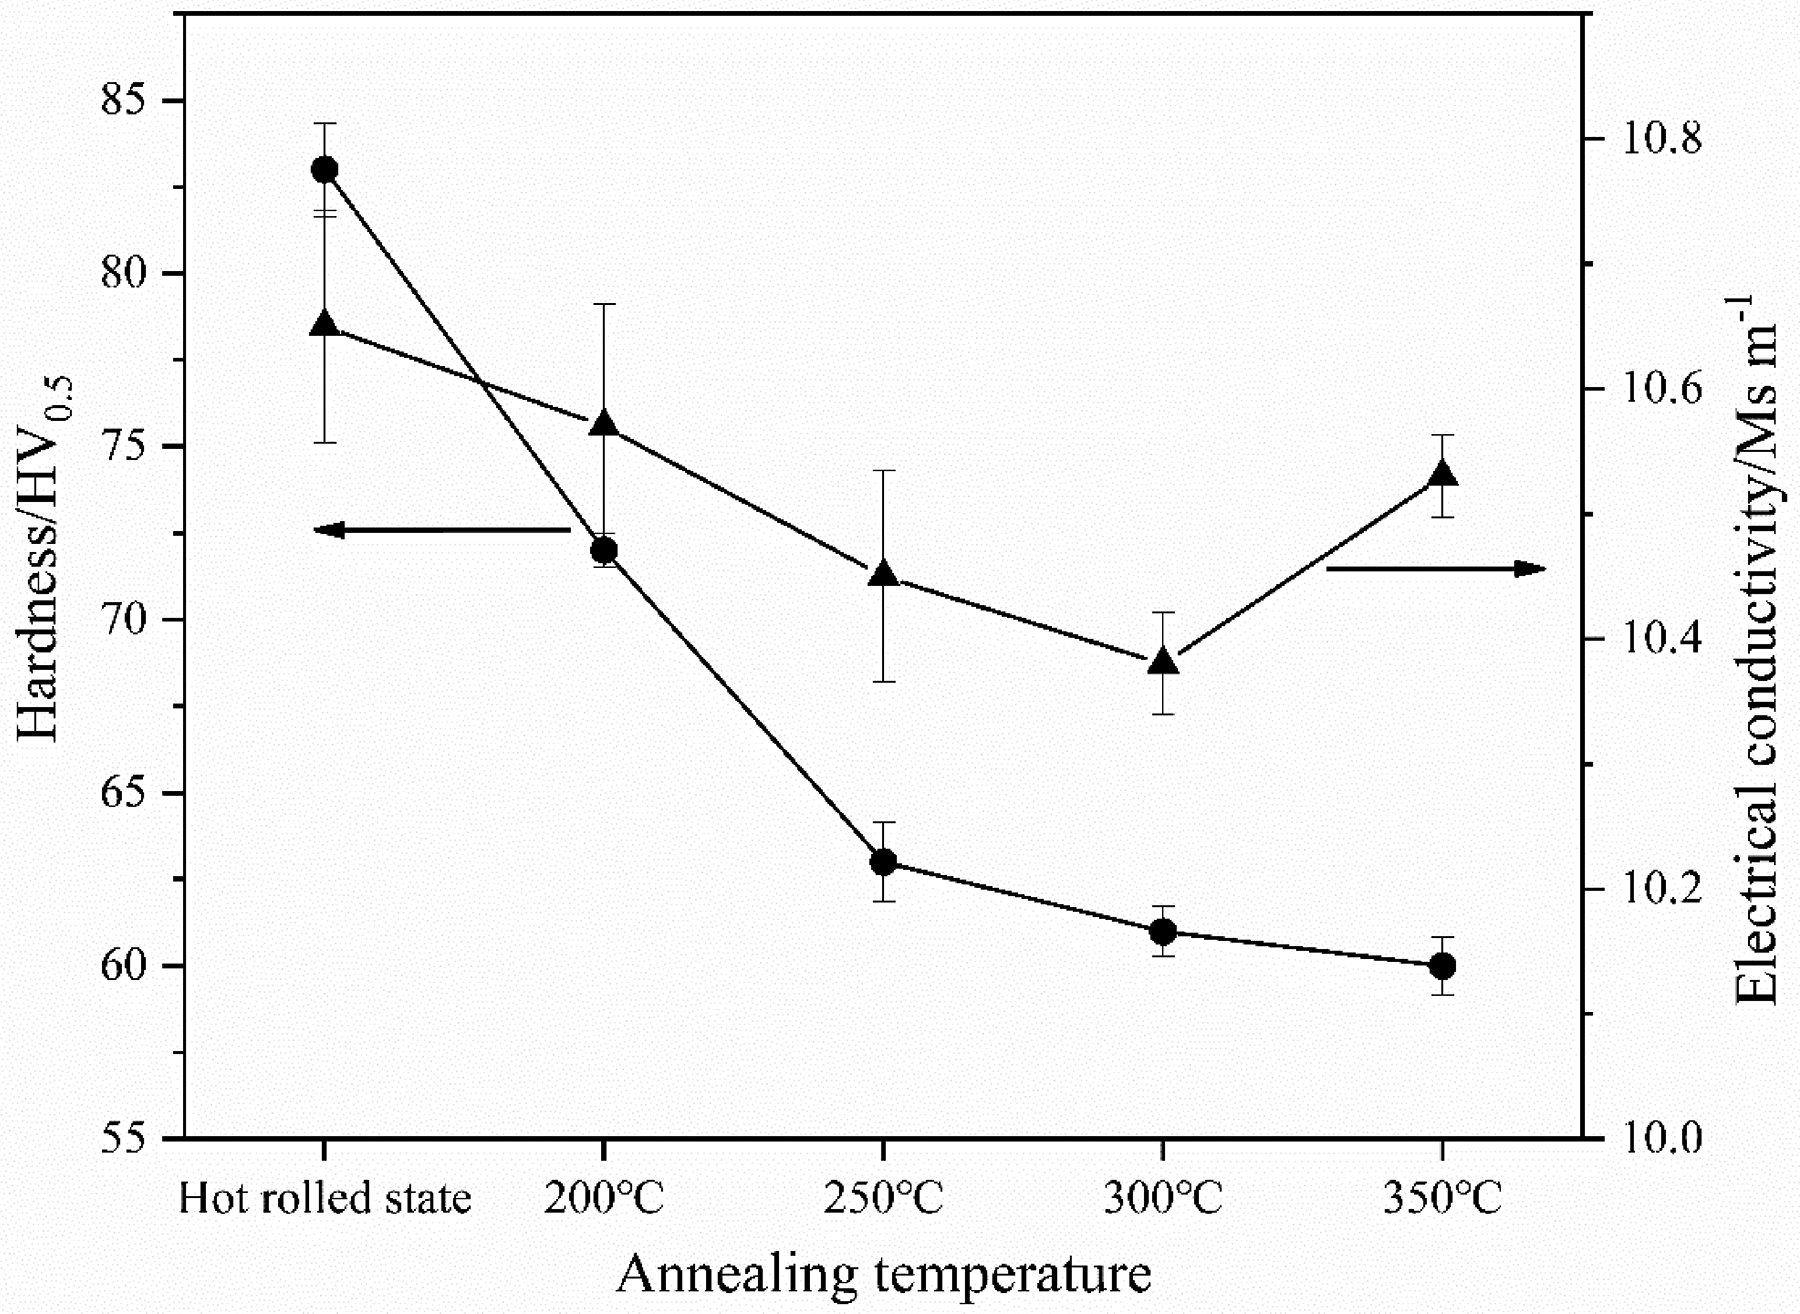
Variation of hardness and electrical conductivity of AZ31 magnesium alloy after various annealing treatments.
MAO properties
MAO process
Figure 4 shows the voltage change of AZ31 magnesium alloy after various annealing treatments. The voltage change of MAO is divided into four stages. (1) Anodic oxidation stage: the voltage rises rapidly in a short time, and countless fine uniform white bubbles appear on the sample surface before reaching the breakdown voltage. (2) Spark discharge stage: After the voltage exceeds the breakdown voltage, countless spark points begin to appear on the sample surface and the micro-arc oxide coating layer begins to form. (3) MAO stage: The voltage fluctuates up and down in a small range, and the spark is gradually dense, which is the main stage of the formation of the ceramic coating layer. (4) Arc extinguishing stage: At the end of MAO, the voltage rises briefly and then drops rapidly, and there is a small amount of spark on the surface until it finally disappears completely, and the MAO process also ends. The voltage change and conductivity data in the figure are inverse, mainly because the excellent conductivity of the metal substrate can reduce the breakdown voltage and slow down the voltage growth rate during the MAO process. 18
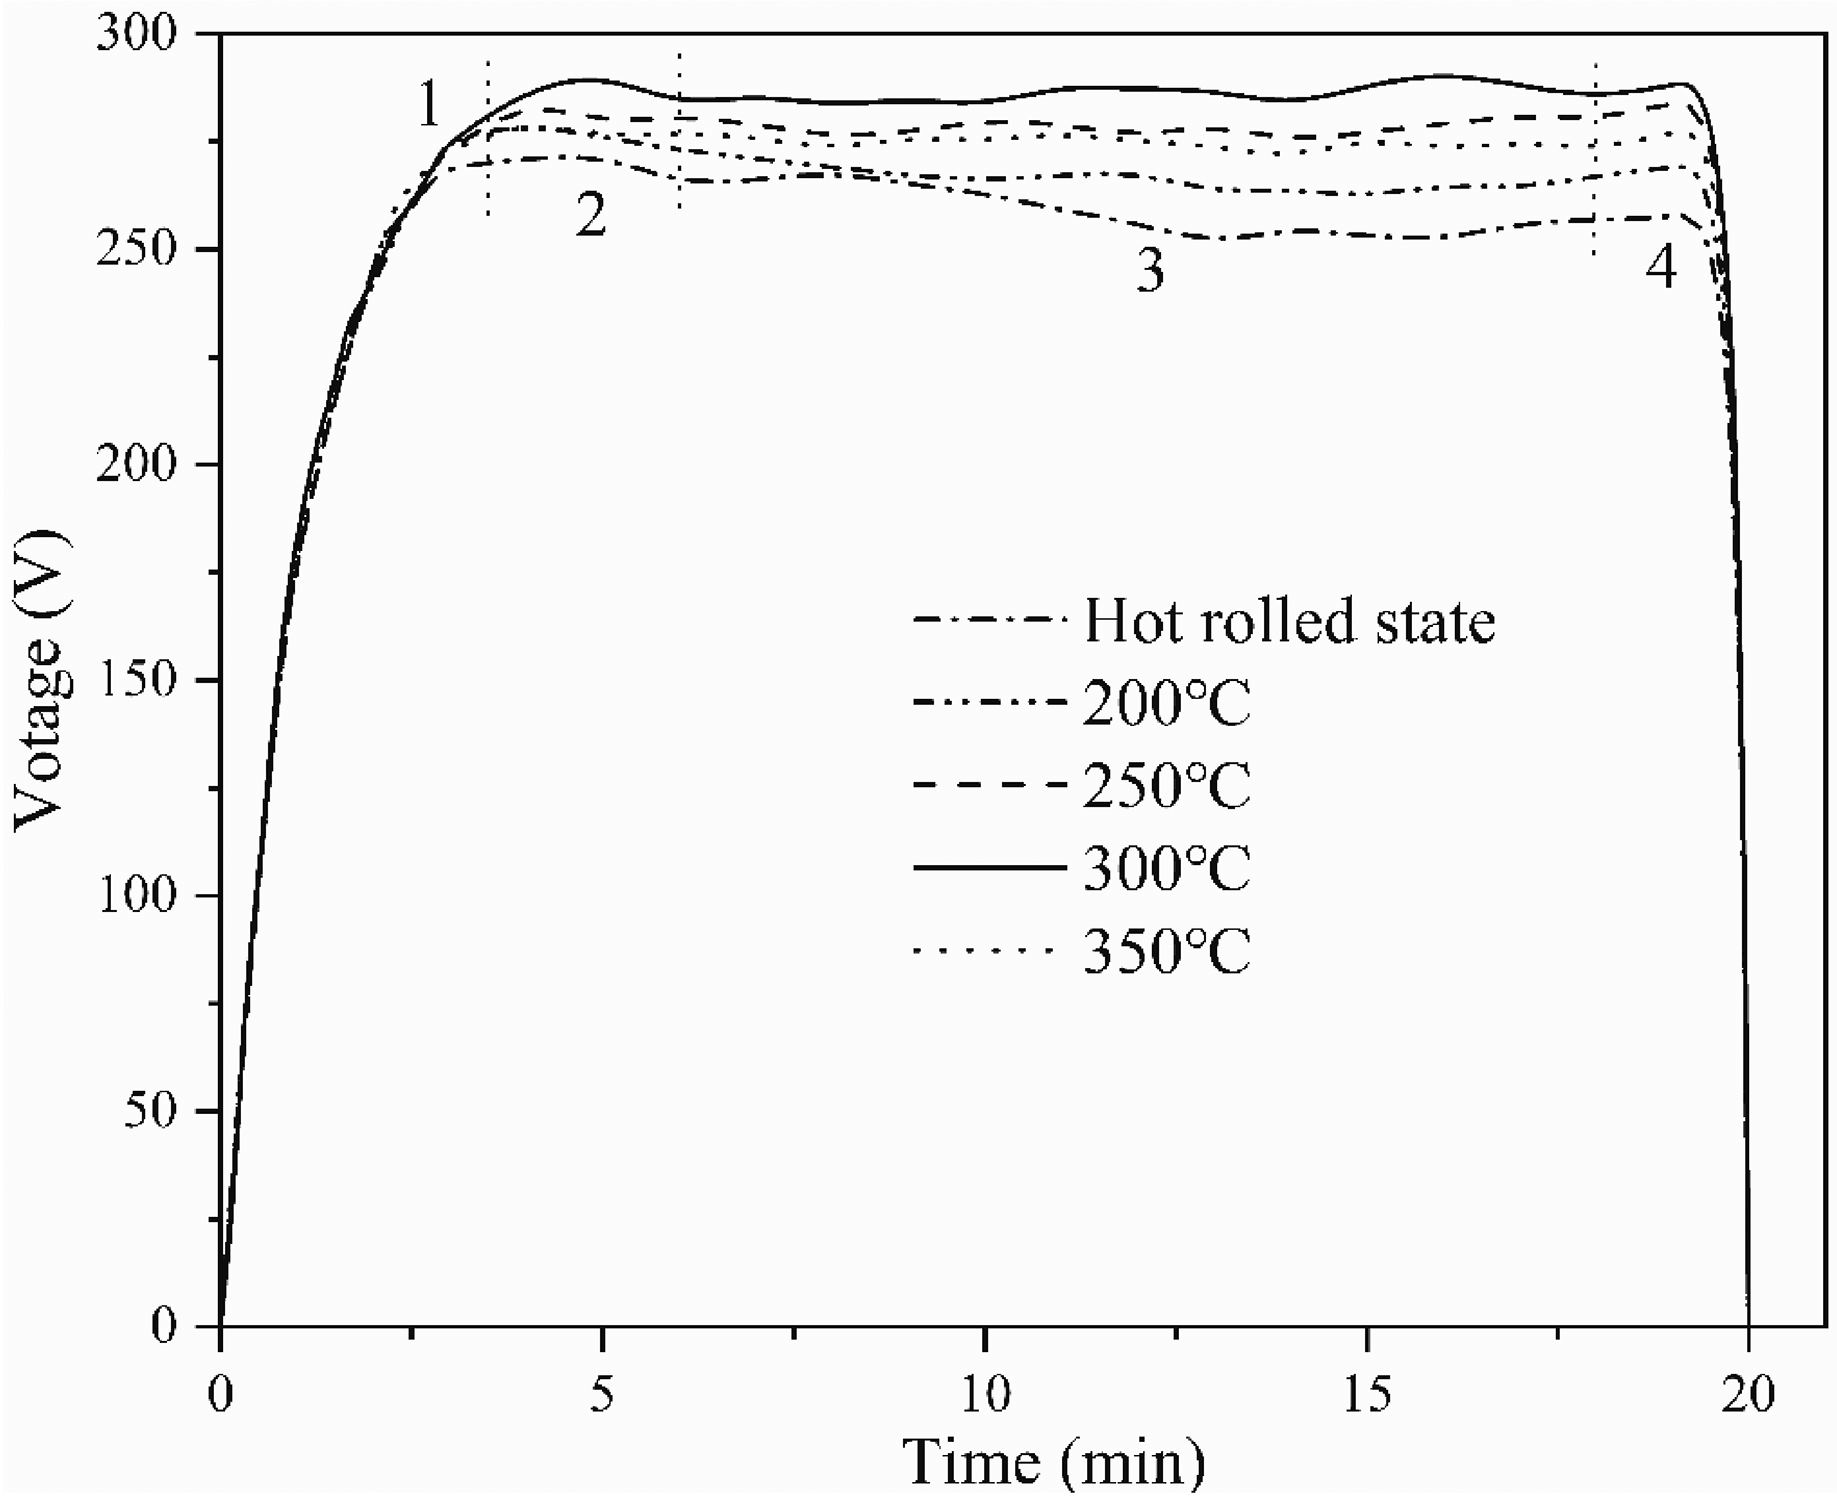
Voltage change of AZ31 magnesium alloy after various annealing treatments.
Microstructure characterisation
Figure 5 shows the surface SEM image of the MAO ceramic coating formed on the AZ31 magnesium alloy after various annealing treatments. It can be seen that MAO ceramic membranes show irregular porous morphology and rough surfaces. The formation of volcanic microporous morphology is mainly caused by a dielectric breakdown caused by micro-arc discharge and bubbles at the discharge channel during rapid cooling.19,20 As the annealing temperature gradually increases, the pore size first decreases and then increases, and the number of pores first increases and then decreases. The pore size is the smallest at the annealing temperature of 300 °C. For annealing at 300 °C, due to its highest conductivity and working voltage, the higher the working voltage, the more molten oxides sprayed out from the discharge channel, blocking the surface pores, increasing the number of pores and reducing the pore size. 21 Figure 6 shows the MAO surface porosity of each sample. With the increase of voltage, the porosity of the coating decreases first and then. At 300 °C, the porosity of the sample is the smallest, which is 13.76%. The increase in voltage promotes the growth of the coating and reduces the possibility of plasma discharge penetrating the coating, thus reducing the porosity of the coating.
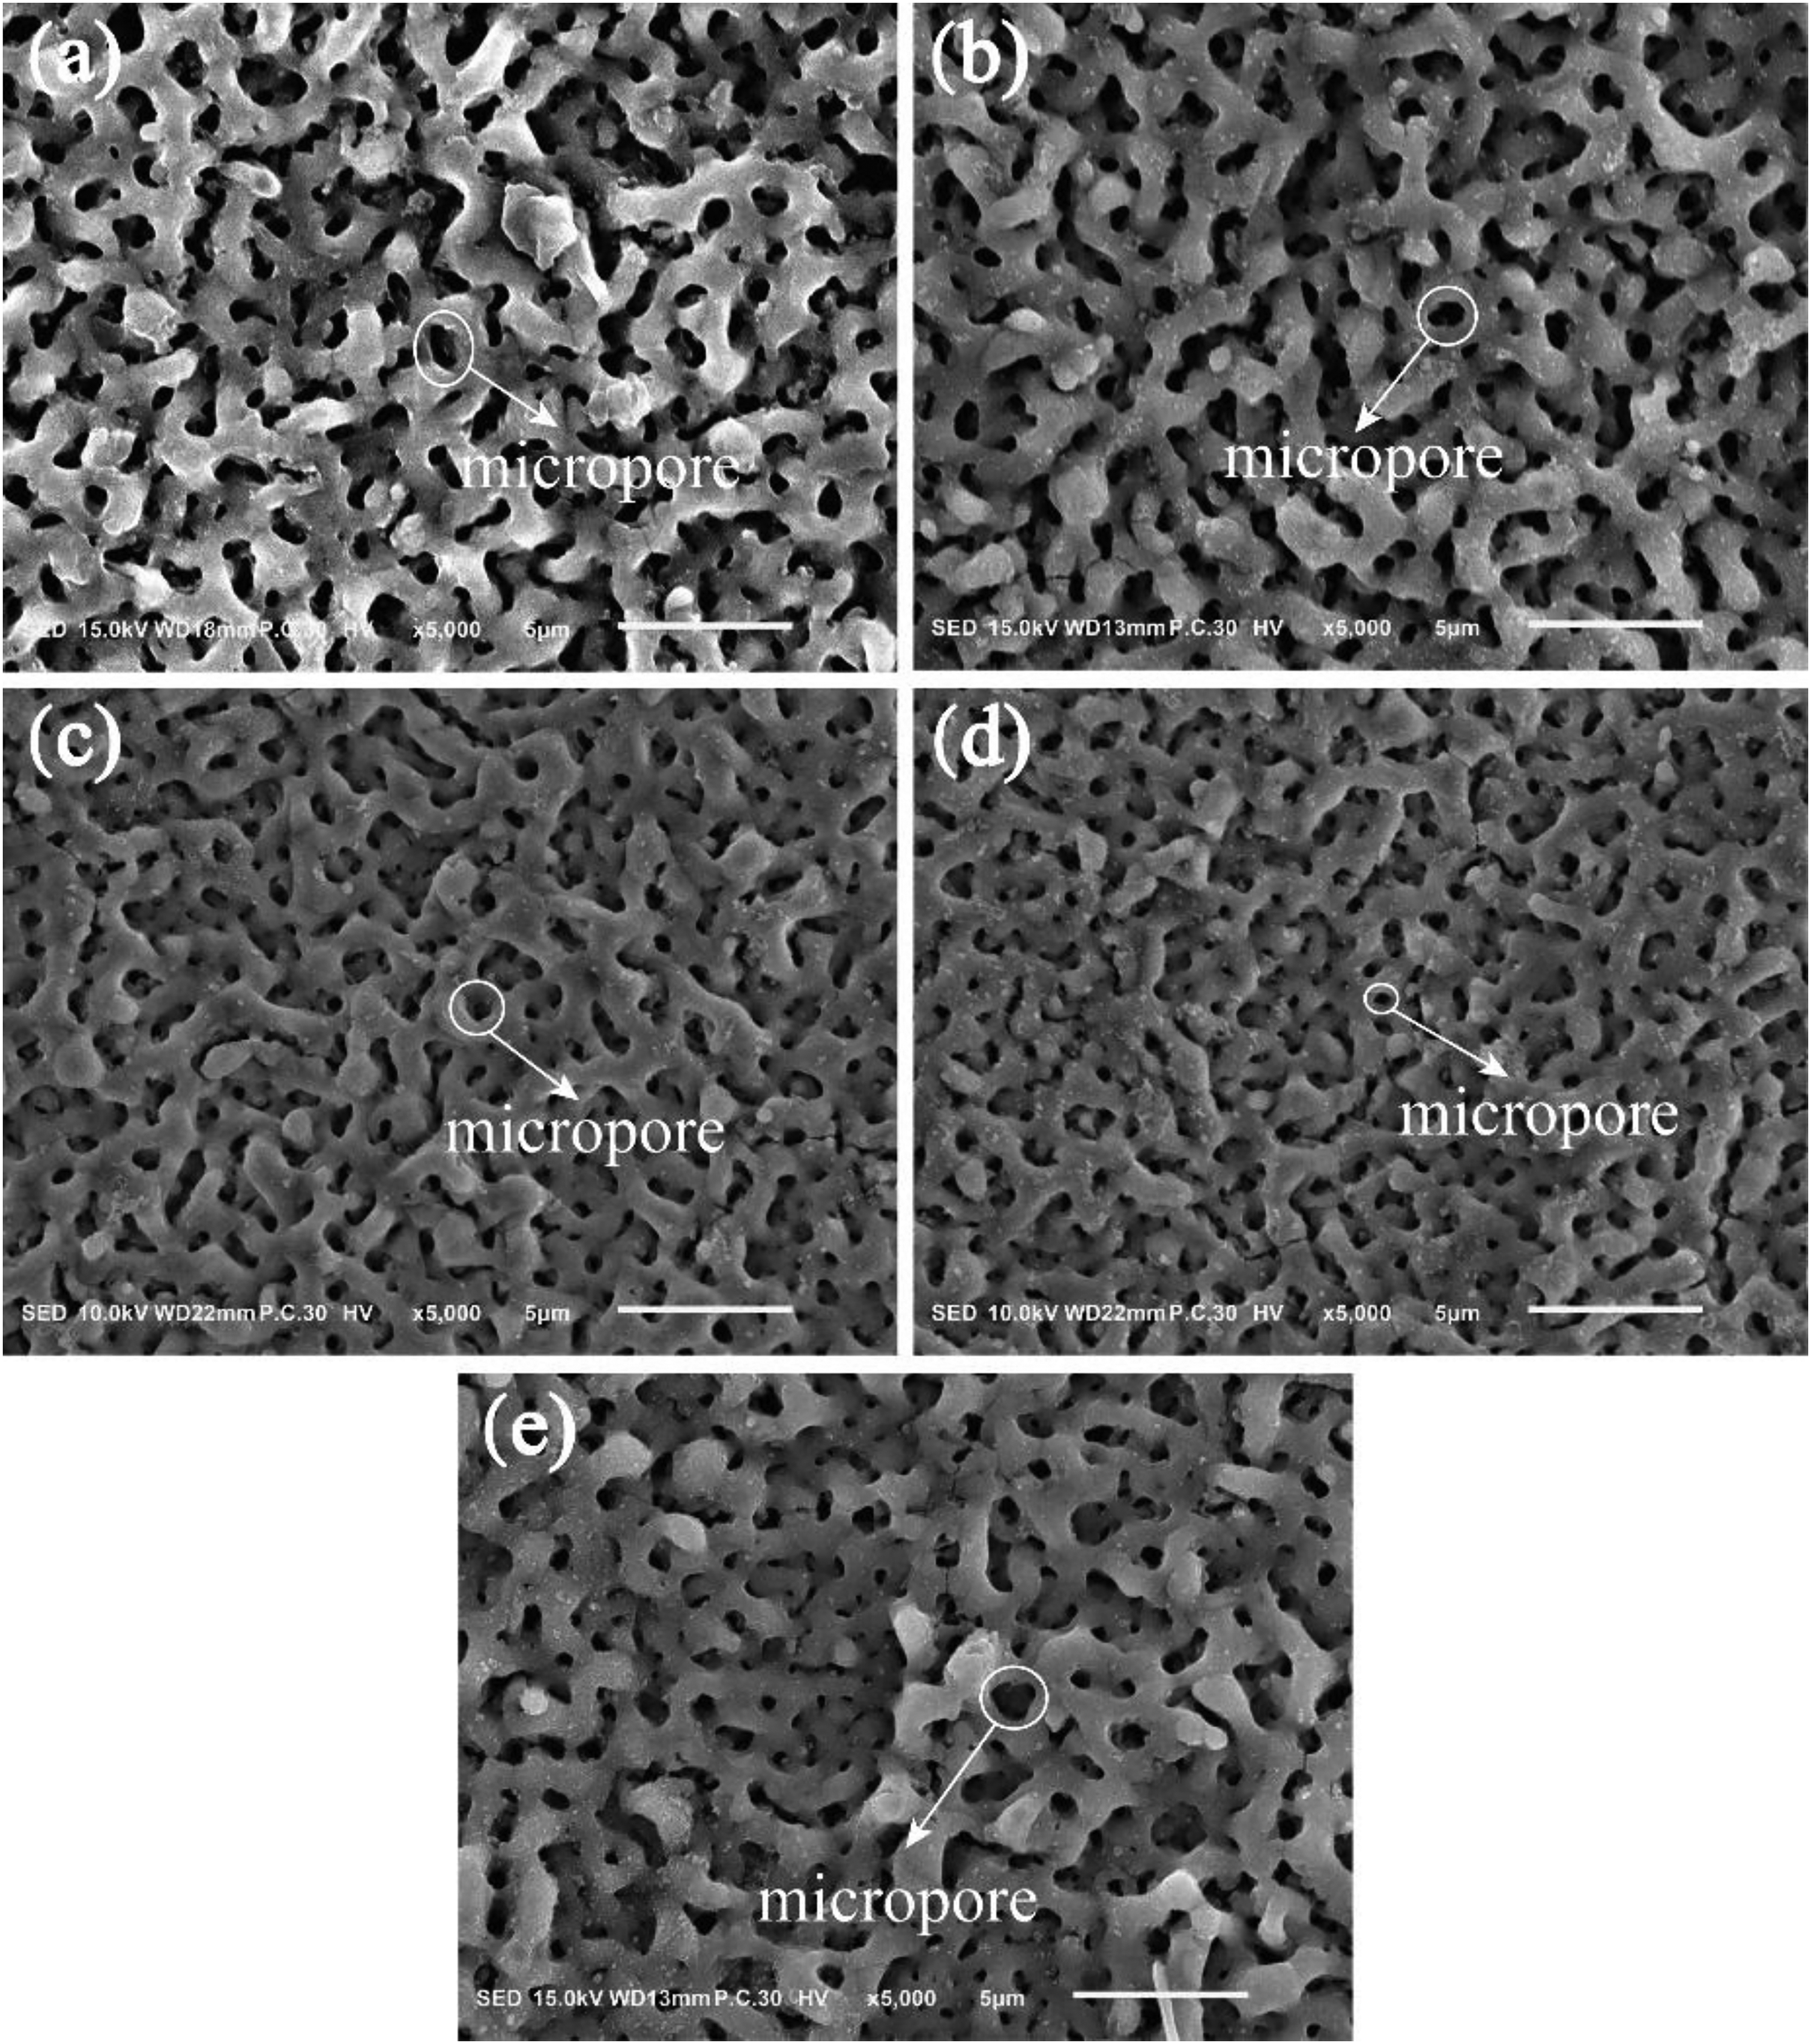
Surface morphology of AZ31 magnesium alloy micro-arc oxide coating at hot rolled and different annealing temperatures: (a) hot rolled state, (b) 200 °C, (c) 250 °C, (d) 300 °C and (e) 350 °C.
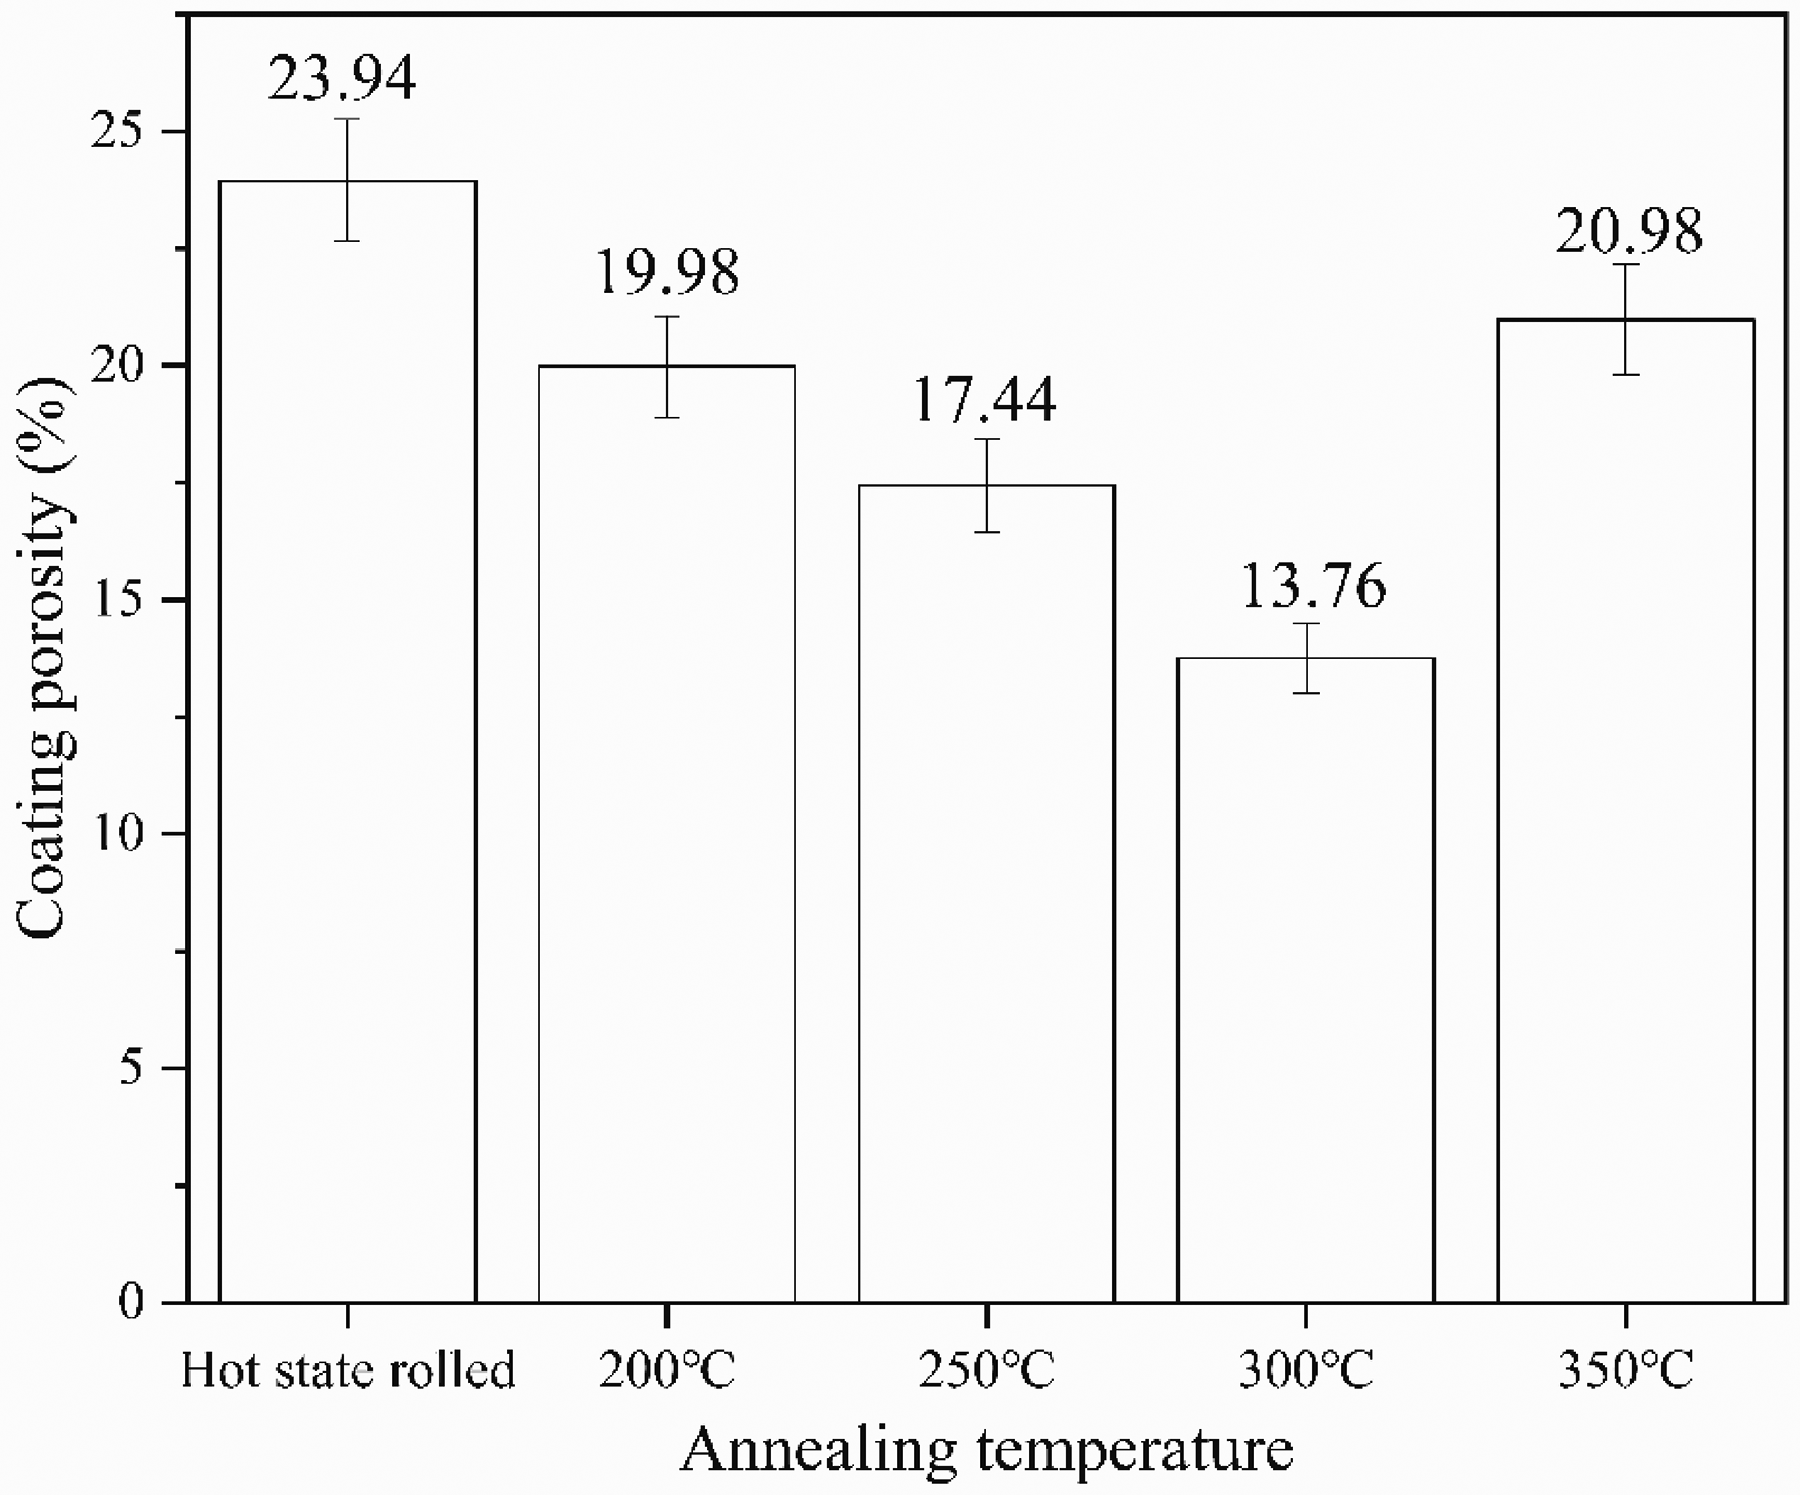
Porosity of MAO coatings at hot rolled and different annealing temperatures.
In order to further explore the surface changes of the coatings under different annealing temperatures, the three-dimensional profiles and roughness of different coatings were analysed, as shown in Figure 7. The surface of the sample is rough at hot rolled and 400 °C annealing temperature, because the surface of the coating is full of micropores and the pores are connected to cause the surface height difference, so the roughness is higher. As shown in Figure 7(b), (c) and (d), with the increase of annealing temperature, the surface of MAO coating gradually becomes smooth and the surface roughness decreases. When the voltage is high at 300 °C, the micropore size on the surface of the coating decreases continuously during the continuous discharge process, and the coating gradually smooths during the reshaping process, so the roughness decreases.
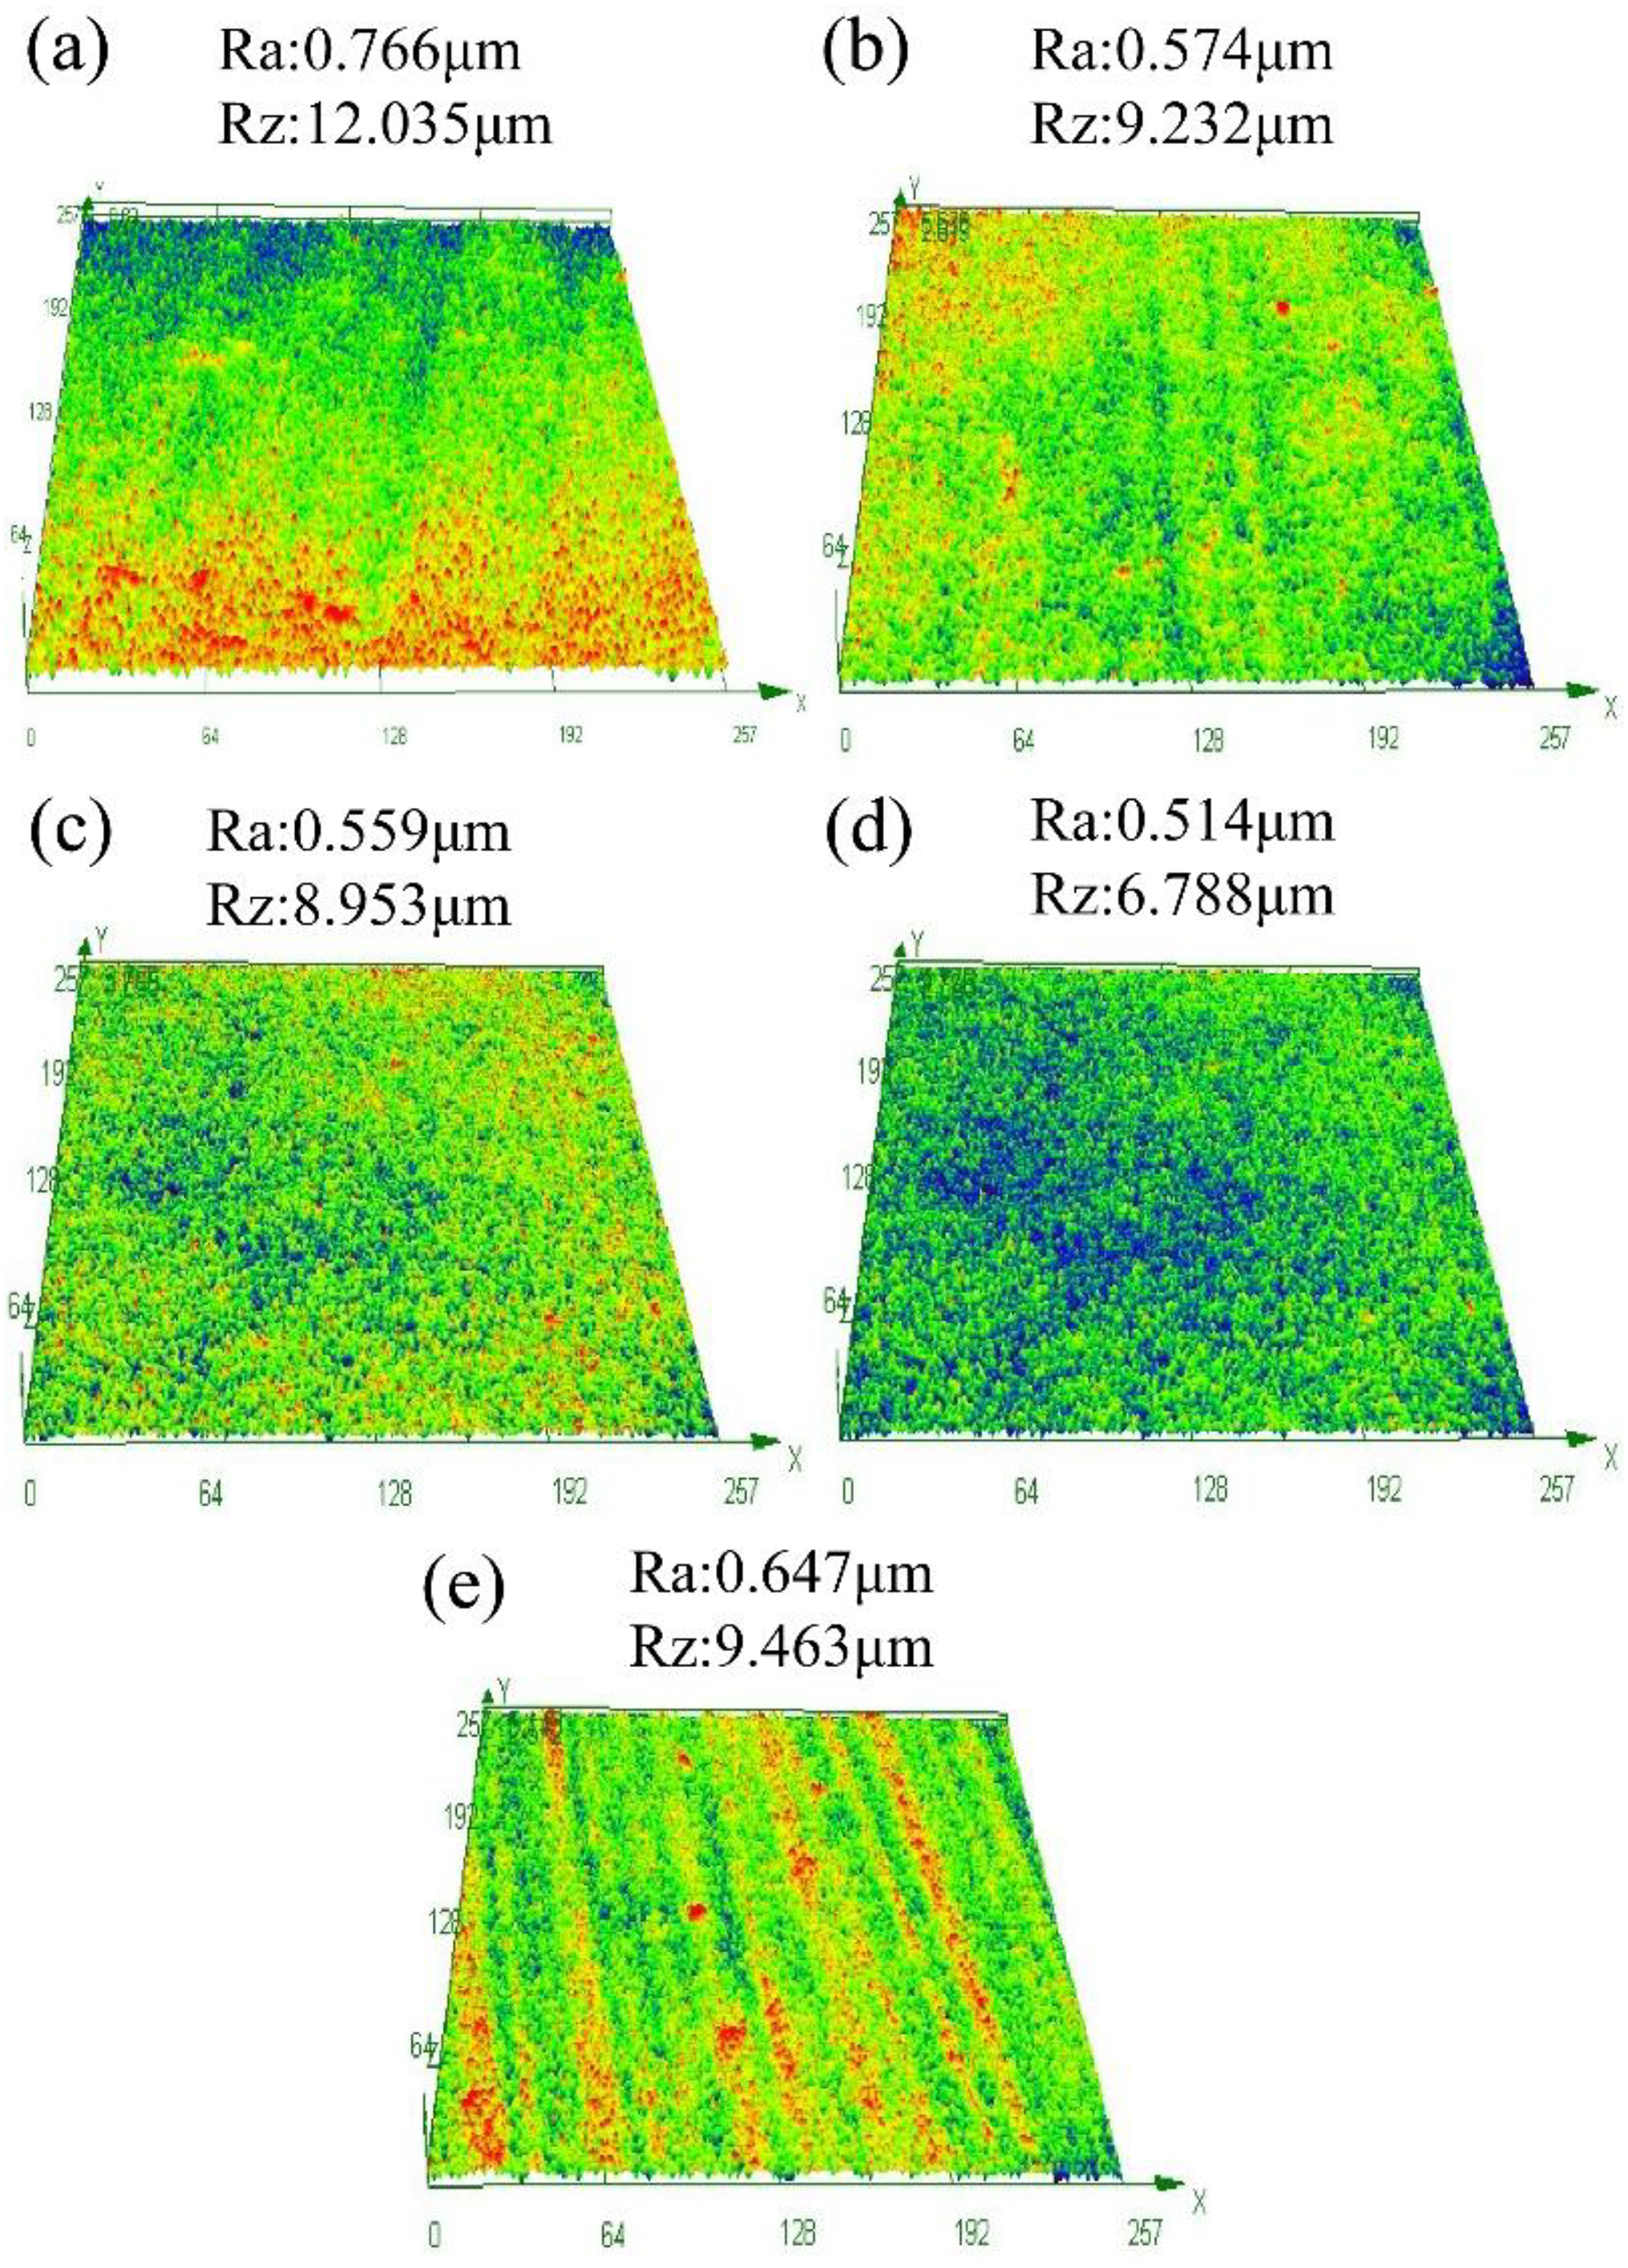
3D profile and roughness of MAO coating at hot rolled and different annealing temperatures: (a) hot rolled state, (b) 200 °C, (c) 250 °C, (d) 300 °C and (e) 350 °C.
Figure 8 is the cross-sectional SEM diagram of MAO coating. The coating thickness of the five samples follows the rule of the same voltage as shown in Figure 4, indicating that there is a linear relationship between voltage and coating thickness. The average thickness of MAO coatings on samples at hot rolled state and annealing temperatures of 200, 250, 300 and 350 °C is 3.7, 4.2, 5.2, 6.3 and 3.9 μm, respectively. The coating thickens as the final voltage increases. The final voltage is the main factor affecting the coating thickness. The higher the voltage, the thicker the coating thickness. 22
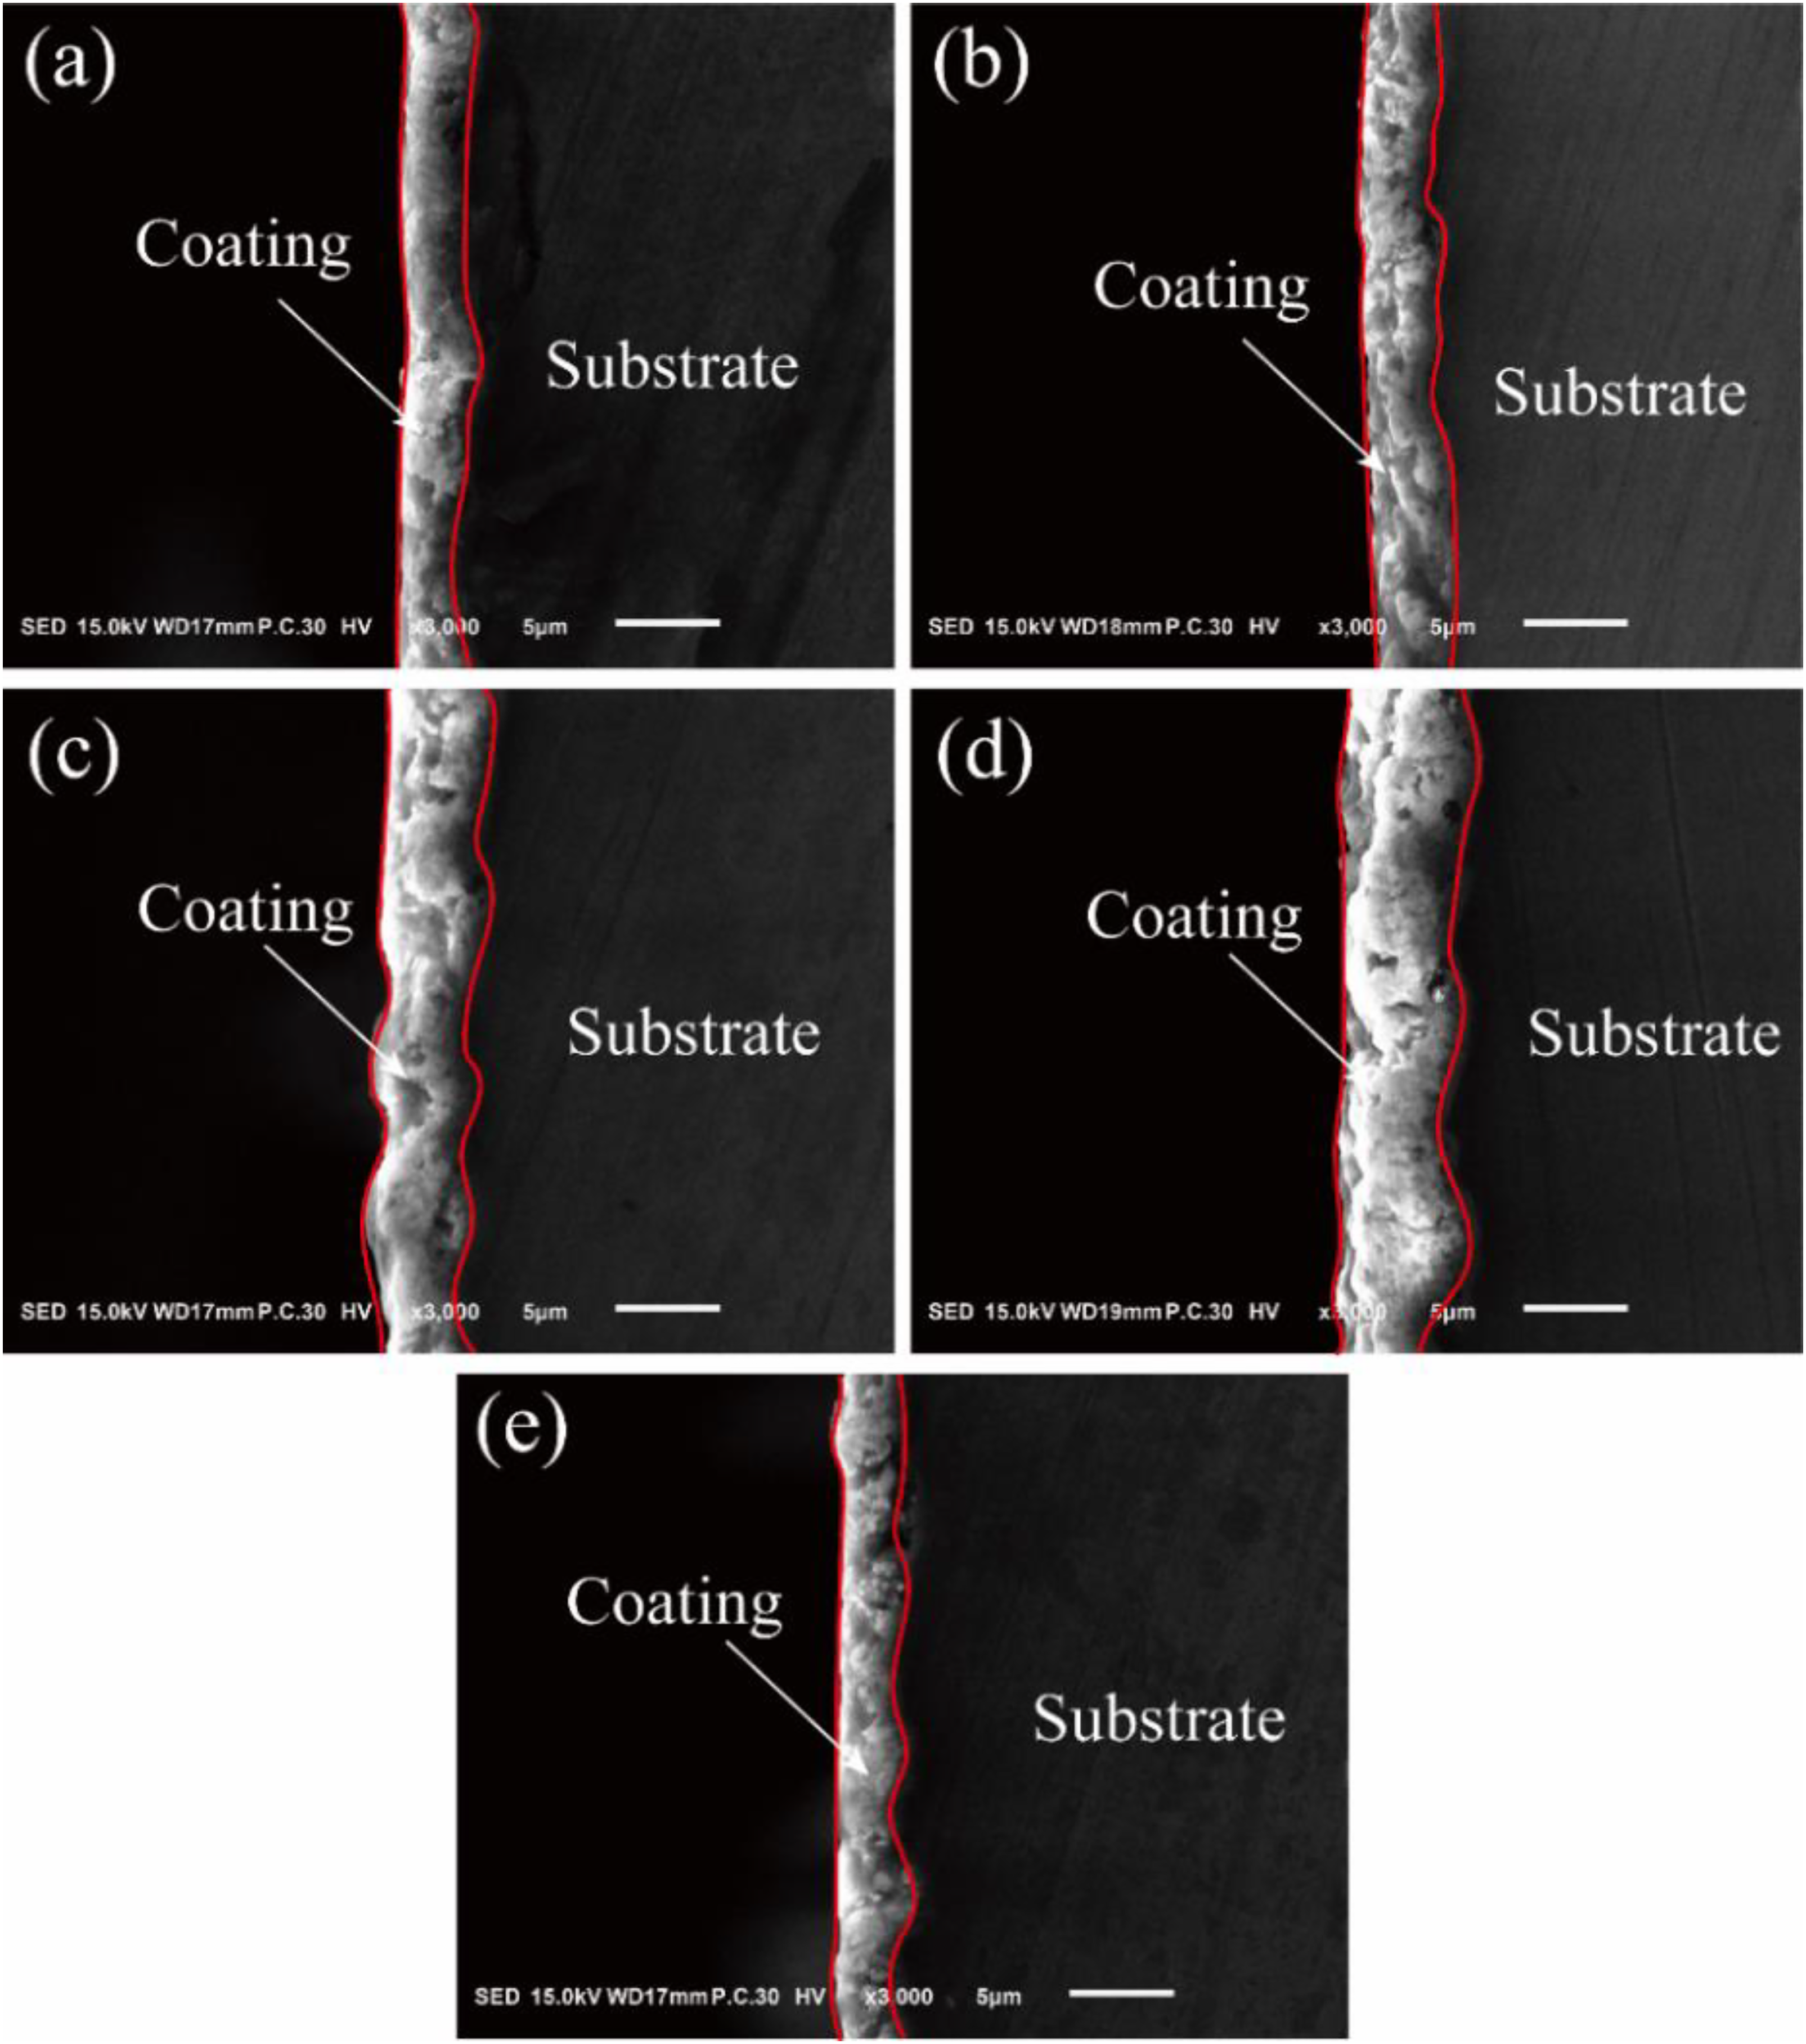
Cross-section morphology of MAO coating as hot rolled and different annealing temperatures: (a) hot rolled state, (b) 200 °C, (c) 250 °C, (d) 300 °C and (e) 350 °C.
Phase analysis
Figure 9 shows the XRD pattern of AZ31 magnesium alloy MAO coating under different annealing treatments. It can be seen in the figure that the annealing temperature has little effect on the phase composition. Because the coating layer is thin and porous, the magnesium alloy matrix can also be detected from XRD spectroscopy. The electrolyte uses a silicate system, and the results of XRD are also surface sodium silicate, potassium hydroxide, and sodium fluoride added to each resulting in products in the coating layer Mg2SiO4, MgO and MgF2. In the formation of MAO, Mg2+ is generated on the surface of the anode. In a high electric field environment, Mg2+ rapidly solves the sample surface, and MgF2, MgO and Mg2SiO4 are generated in solution with F−, OH− and SiO32− ions, and the specific reaction formula is as follows
23
:


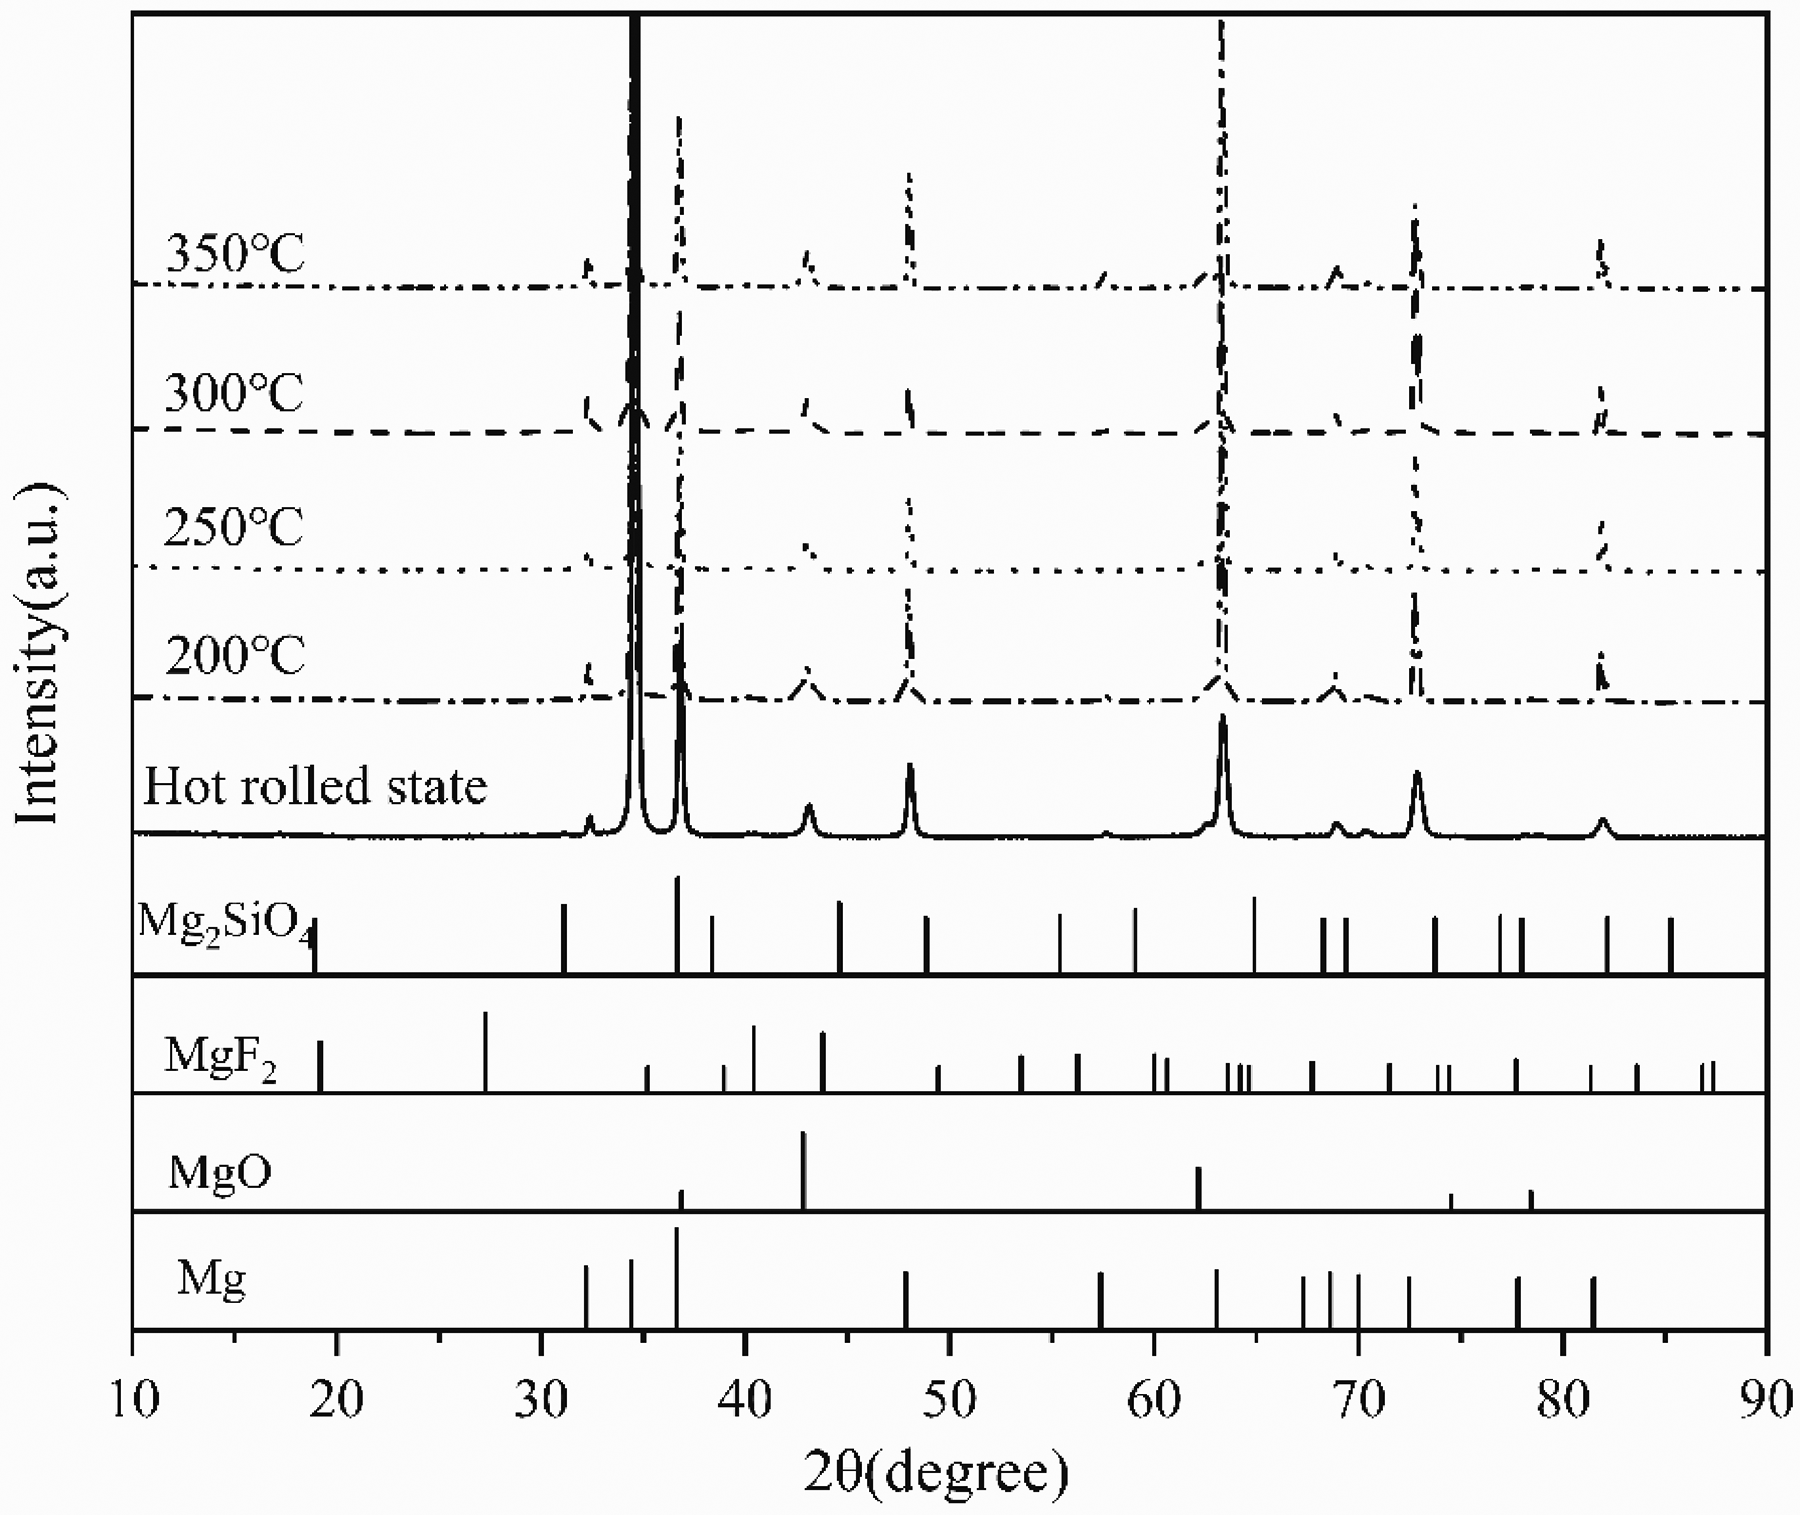
XRD pattern of the surface of AZ31 magnesium alloy in hot rolled state and different annealing temperatures: (a) hot rolled state, (b) 200 °C, (c) 250 °C, (d) 300 °C and (e) 350 °C.
Immersion corrosion
Corrosion morphology of MAO AZ31 magnesium alloy after 14 days of immersion
Figure 10 shows the microscopic topography of the MAO coating after 14 days of immersion. It can be seen from the figure that the degree of corrosion decreases first and then increases with the increase in annealing temperature. There are many cracks and corrosion pits on the corrosive surface, and the cracks on the coating surface are caused by corrosive media infiltrated by pores. After the corrosive medium comes into contact with the magnesium alloy matrix, a corrosion reaction occurs, and the corrosion products produced block the pores and cause stress, causing the coating to crack. 24 Once the coating is penetrated by corrosive media, pitting corrosion will occur, and residual stress will be released due to cracking, further extending to other areas of the coating to form large corrosion pits. 25 As the annealing temperature increases, the thickness and pore of the coating change. The small porosity can effectively prevent the penetration of the corrosive solution, thereby greatly improving the corrosion resistance of the coating. 26 There are a small number of pitting pits on the surface of the sample annealed at 300 °C, and there are fewer corrosion products, indicating that the corrosion resistance has been significantly improved.
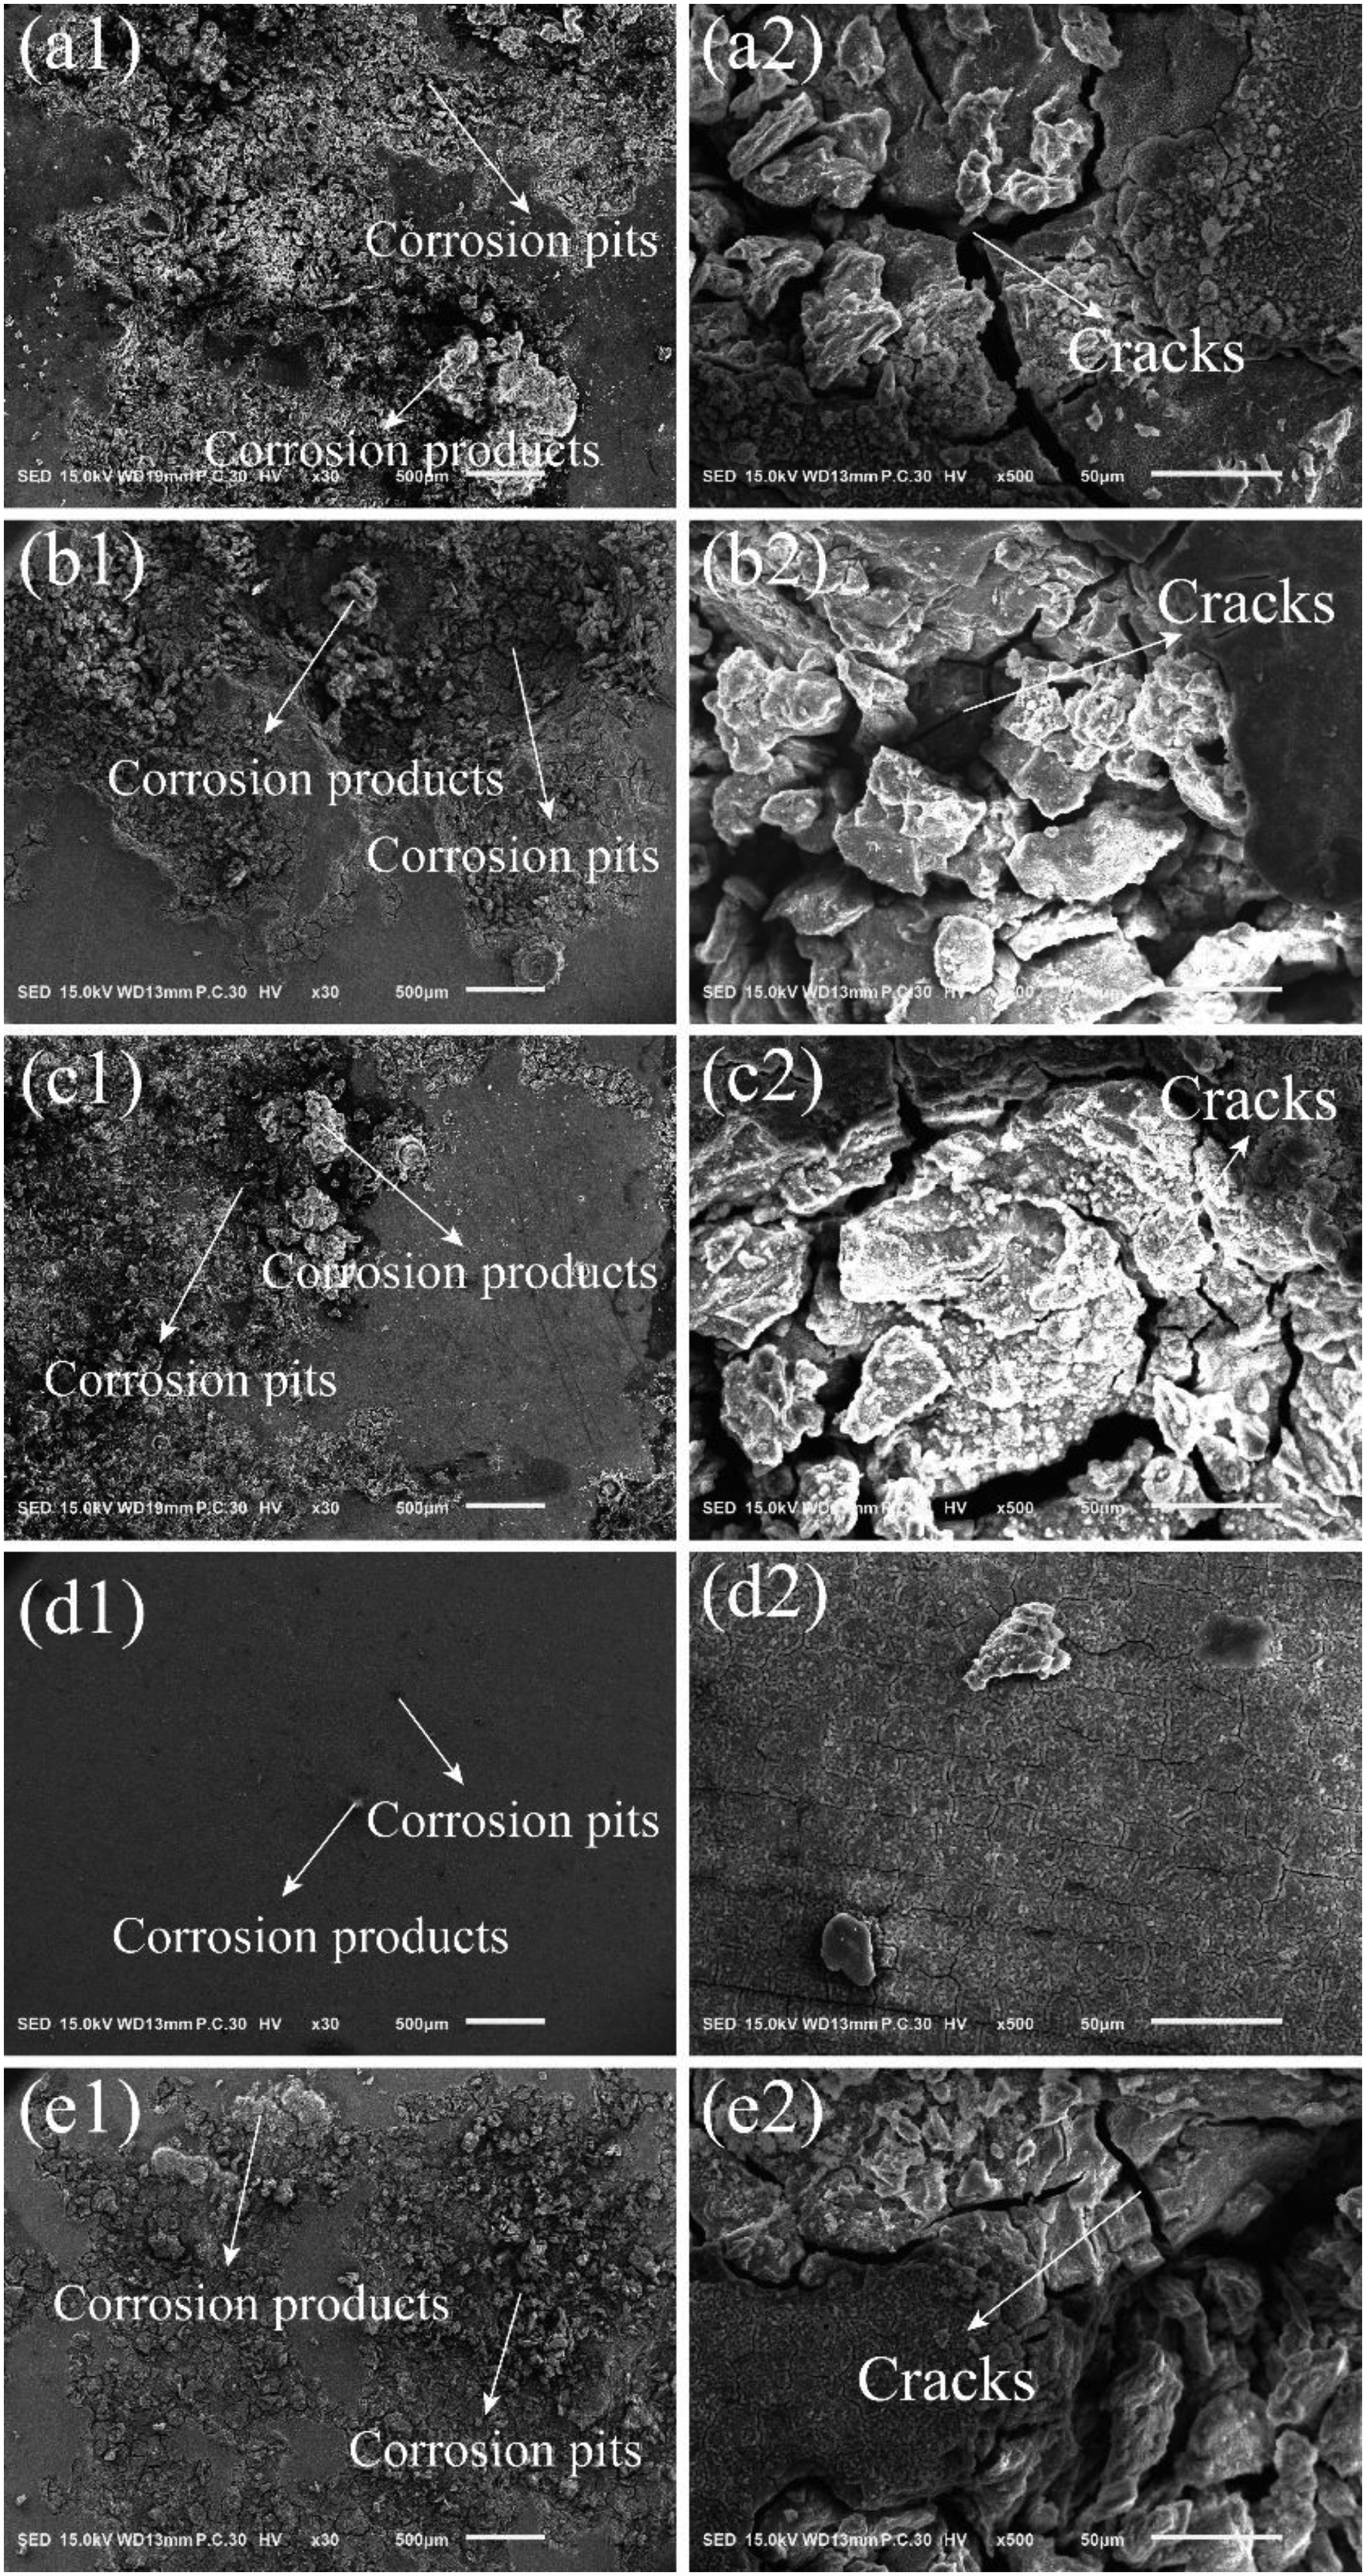
Surface morphology of AZ31 magnesium alloy after corrosion for 14 days: (a1 and a2) hot rolled state; (b1 and b2) 200 °C; (c1 and c2) 250 °C; (d1 and d2) 300 °C; (e1 and e2) 350 °C.
Corrosion depth of MAO AZ31 magnesium alloy after 14 days of immersion
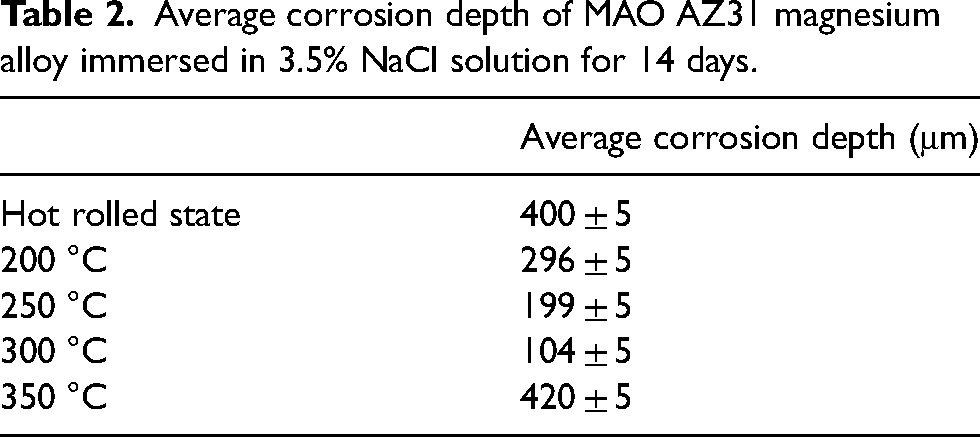
Figure 11 shows the maximum corrosion depth of 14 days of sample corrosion. Table 2 shows the average corrosion depth after sample corrosion. It can be seen from the chart that with the increase of annealing temperature, the maximum corrosion depth and average corrosion depth are first decreased and then increased, and when the annealing temperature is 300 °C, the corrosion depth is the smallest. After immersion, the corrosive medium penetrates into the surface of the matrix, causing corrosion on the surface of the magnesium alloy and forming a corrosion pit. The increase in voltage reduces the pore of the coating and inhibits the penetration of the corrosive medium into the coating, thereby improving the corrosion resistance of the coating. 24 The smaller the micropore size, the less the area where the corrosion solution penetrates and comes into contact with the alloy matrix.
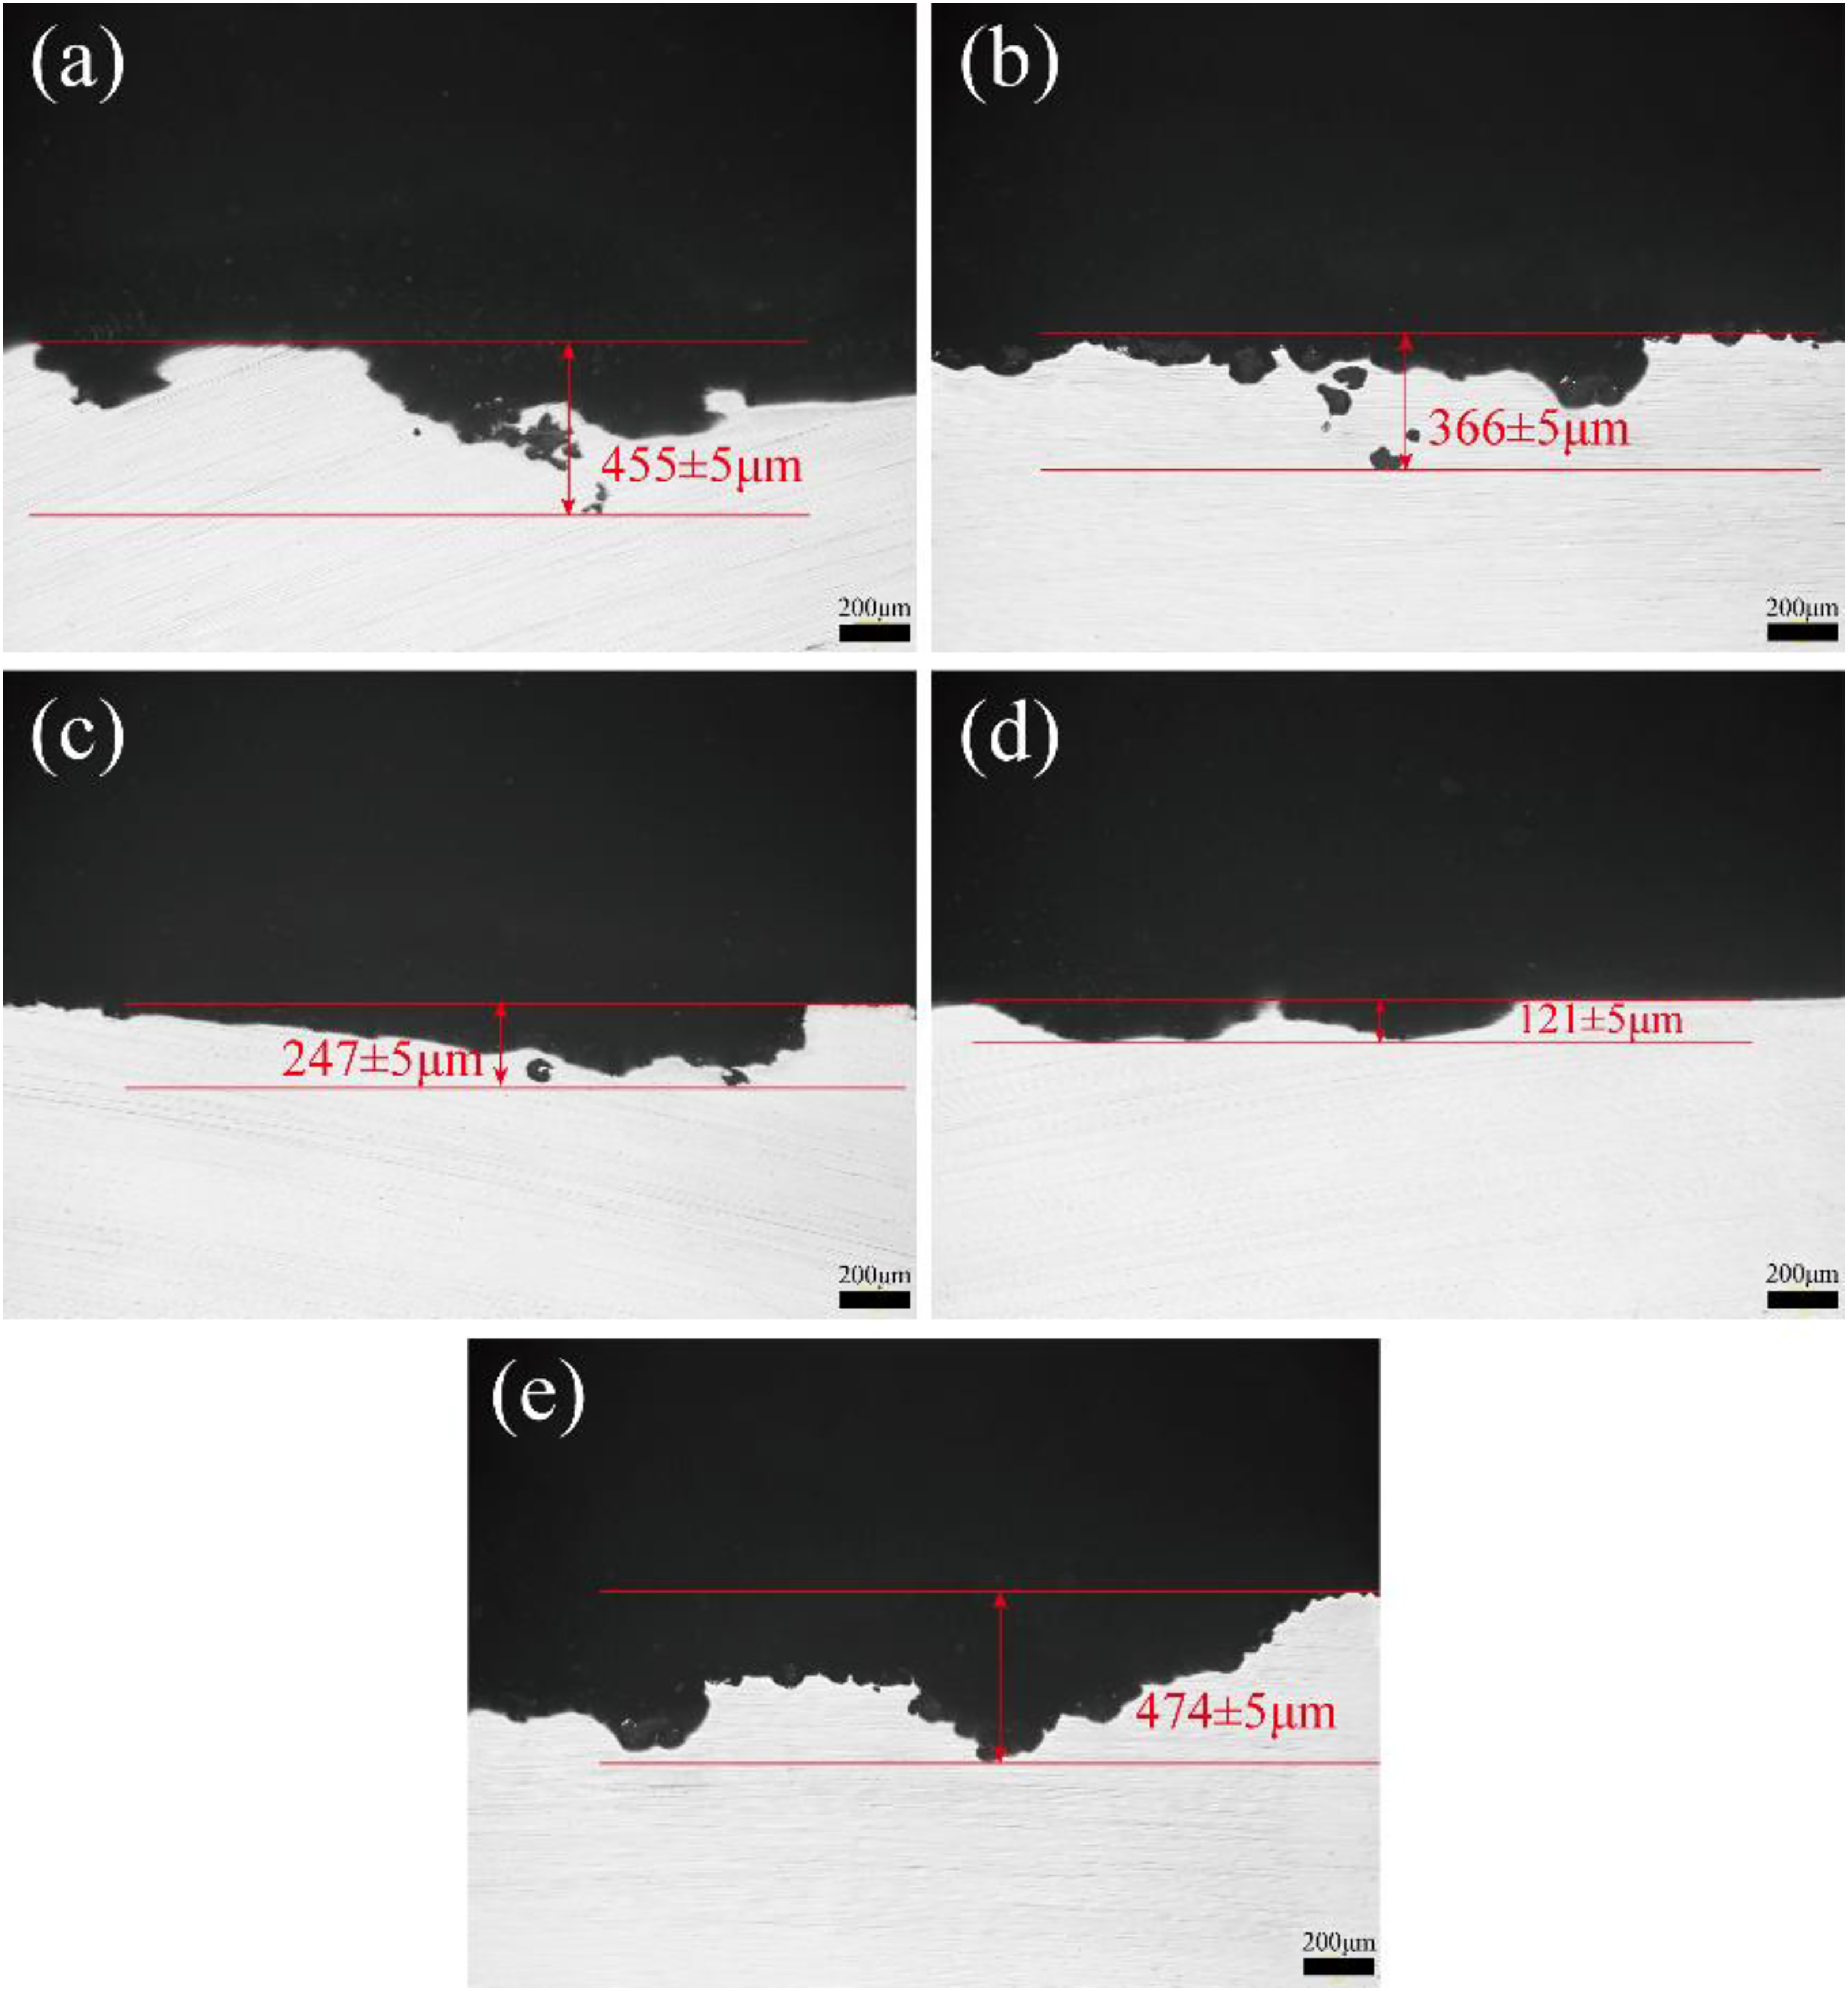
Maximum corrosion depth of the sample: (a1 and a2) hot rolled state; (b1 and b2) 200 °C; (c1 and c2) 250 °C; (d1 and d2) 300 °C; (e1 and e2) 350 °C.
Average corrosion depth of MAO AZ31 magnesium alloy immersed in 3.5% NaCl solution for 14 days.
Corrosion products after 14 days of immersion
Figure 12 shows the XRD pattern of a sample after 14 days of immersion. As can be seen from the figure, the corrosion products are mainly Mg(OH)2. At the beginning of immersion, corrosive media (Cl−, H2O) enter the MAO coating through the pores. The main components of MAO coatings are Mg2SiO4, MgO and MgF2, which react with corrosive media to form soluble substances (such as MgCl2), resulting in the destruction of the coating. 27 Mg reacts with H2O to form Mg(OH)2. As the immersion time is extended, the corrosive medium continues to enter the MAO coating, causing corrosion products to accumulate in the pores of the coating. These accumulated corrosion products create high stress on the MAO coating, causing the MAO coating to expand or even be destroyed, resulting in local peeling of the MAO coating, and eventually leading to severe local corrosion. 28
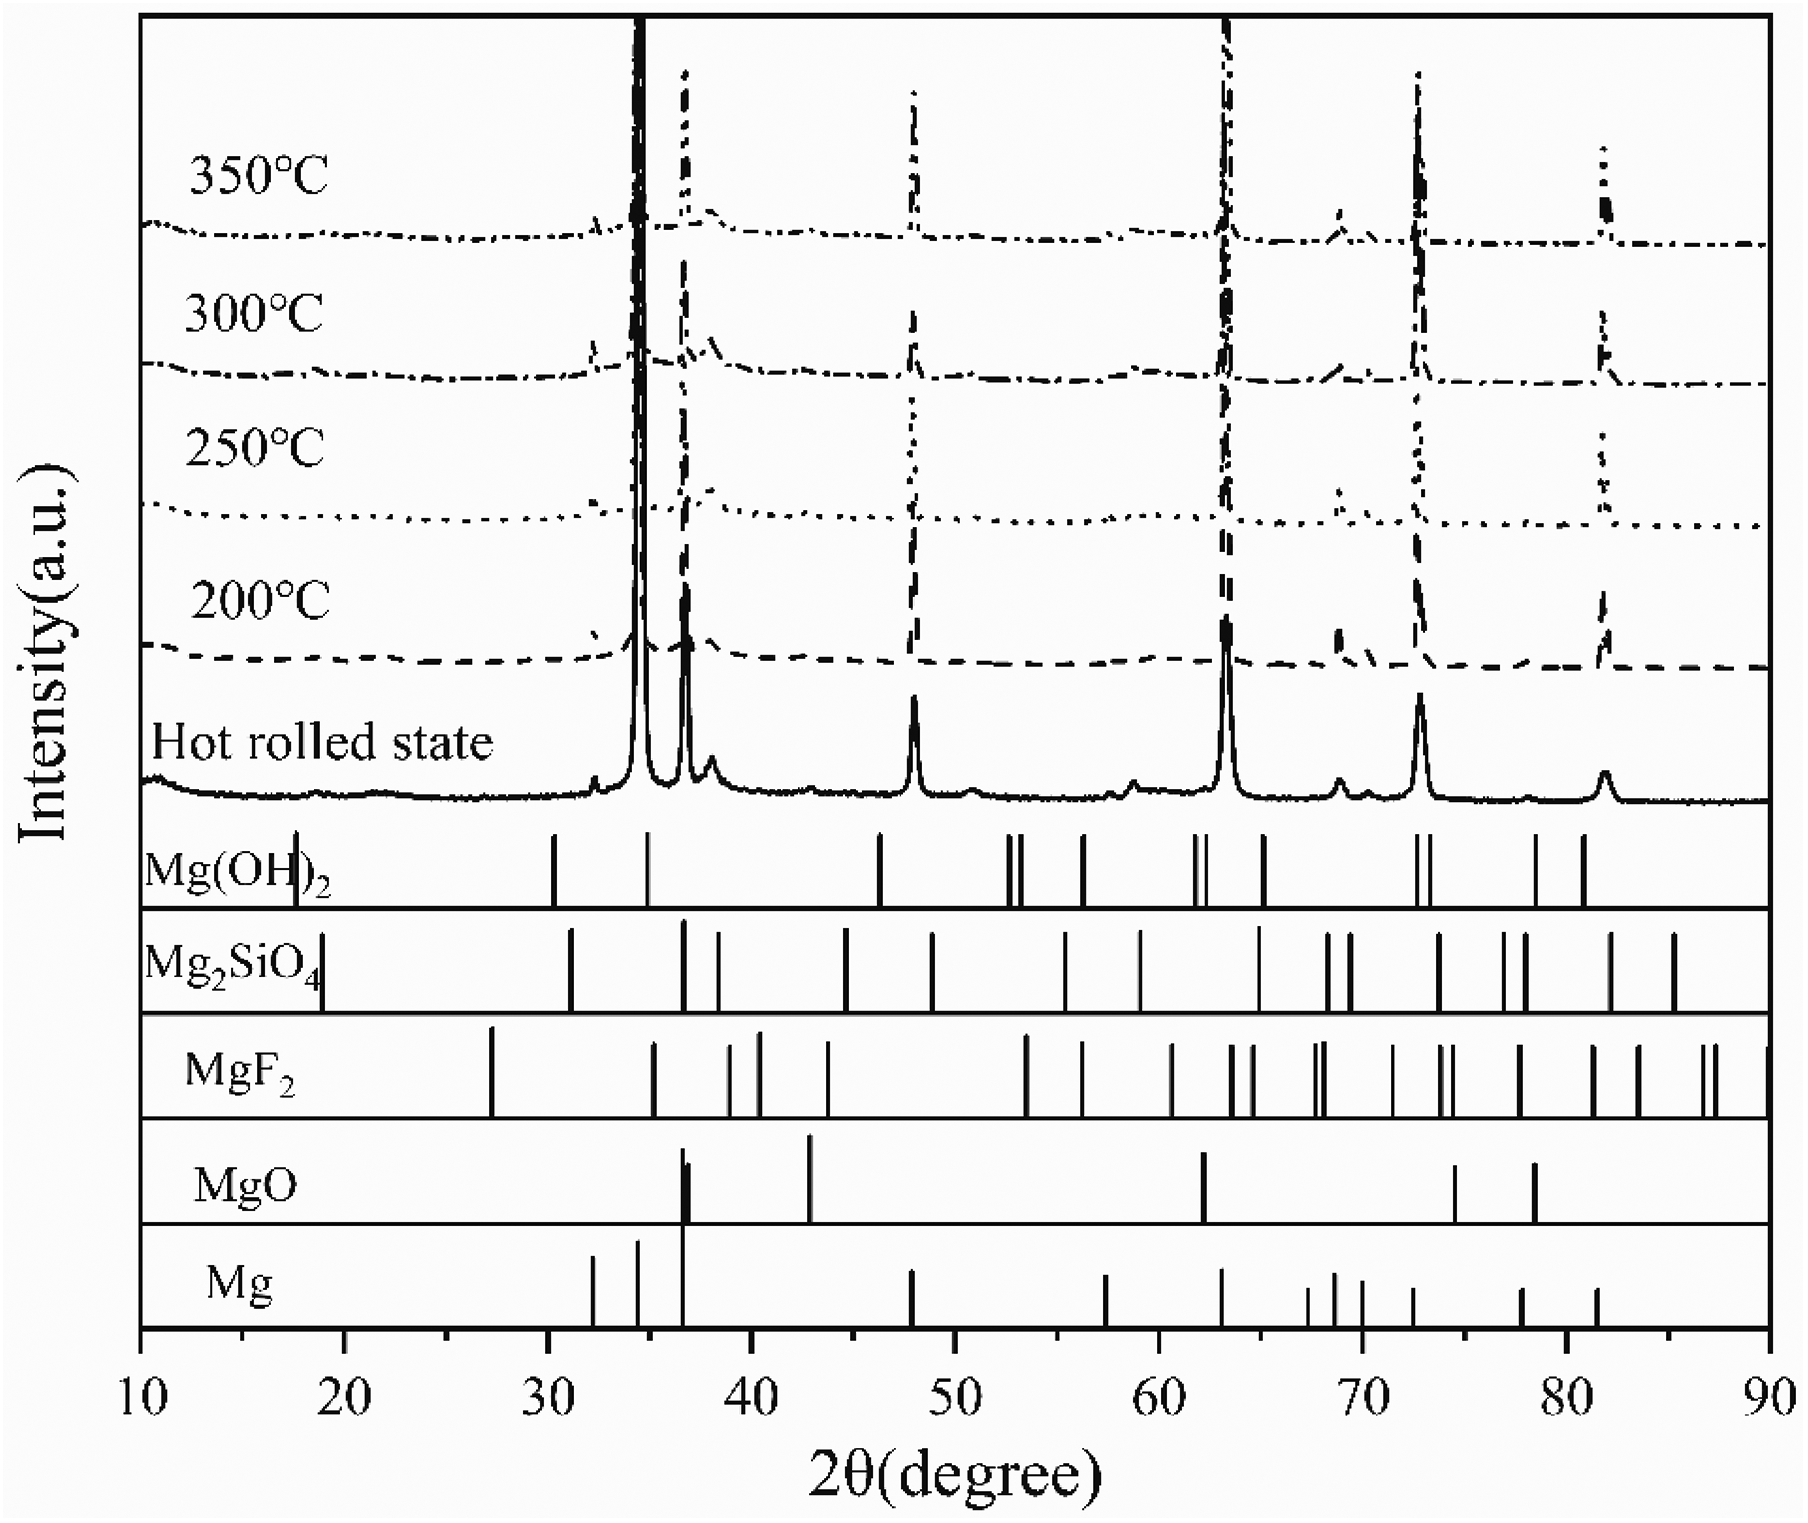
XRD pattern of surface corrosion products of MAO AZ31 magnesium alloy after immersion in 3.5% NaCl solution for 14 days.
Electrochemical corrosion
Potentiodynamic polarisation test
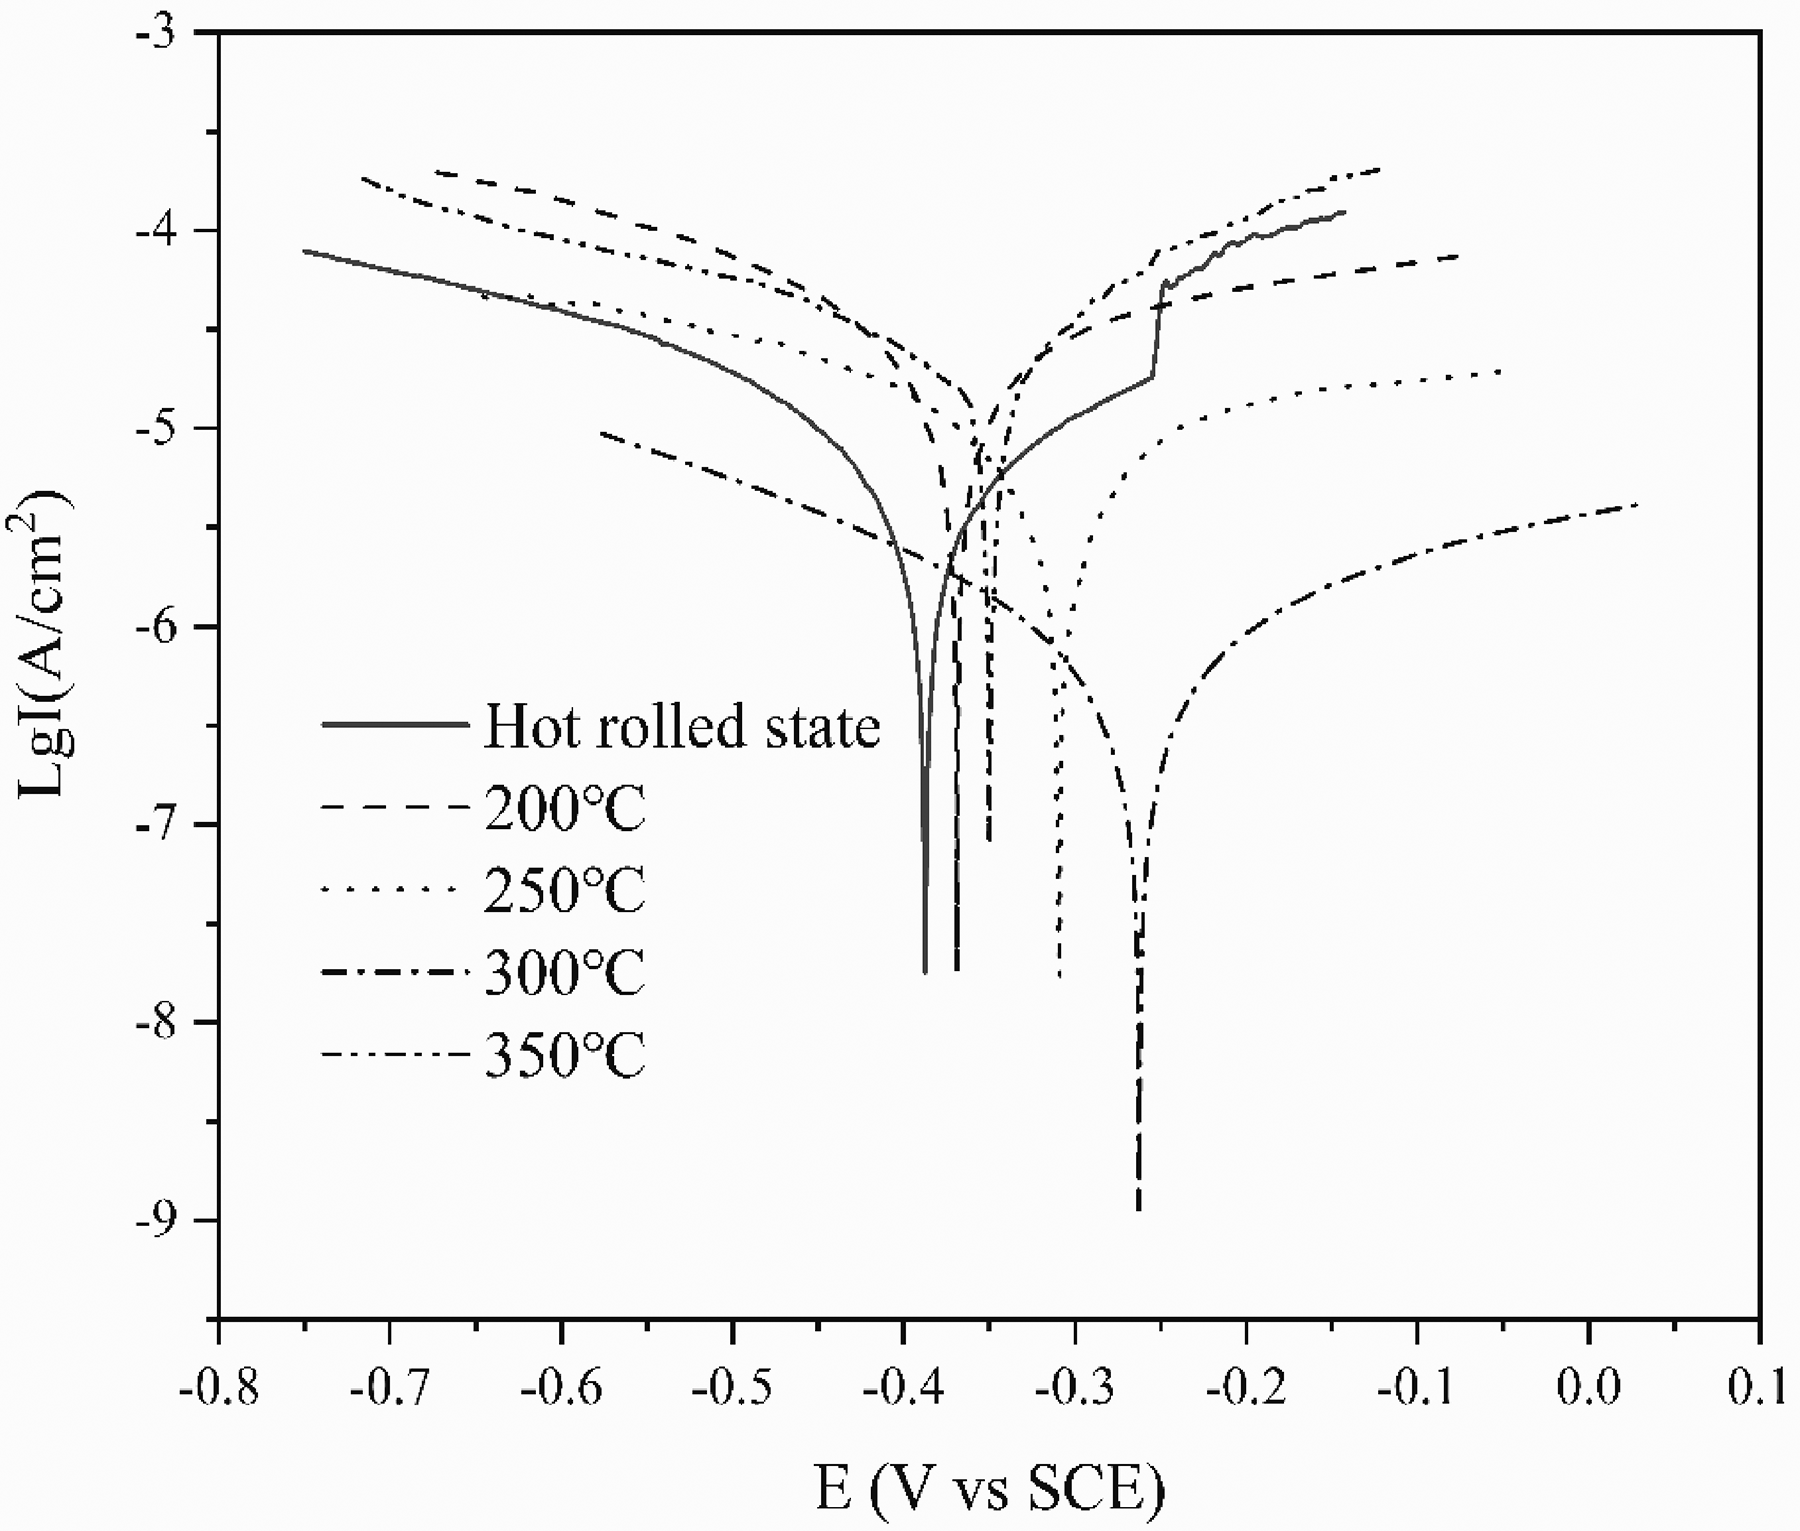
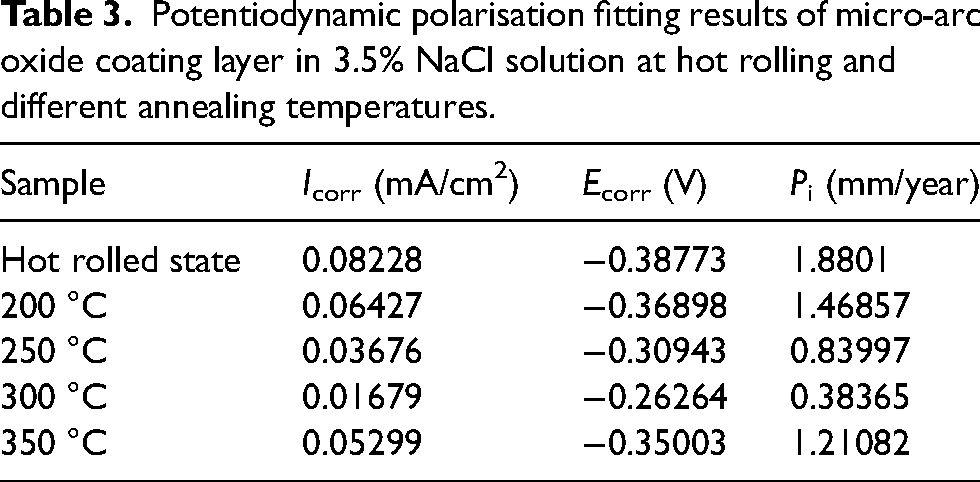
Figure 13 shows the polarisation curve of the MAO AZ31 magnesium alloy after hot rolling and different annealing temperatures. Table 3 shows the corrosion potential, corrosion current, and corrosion rate obtained by fitting. The smaller the corrosion current of the MAO coating on the sample surface, the lower the corrosion rate and the better the corrosion resistance of the MAO coating. With the increase of annealing temperature, the self-corrosion current first decreases and then increases, the self-corrosion potential first increases and then decreases, and the corrosion rate changes accordingly, first decreasing and then increasing. Calculate the corrosion rate using the following formula Pi (mm/year)
29
:
Potentiodynamic polarisation curve of AZ31 micro-arc oxide coating layer under hot rolling and different annealing temperatures.
Potentiodynamic polarisation fitting results of micro-arc oxide coating layer in 3.5% NaCl solution at hot rolling and different annealing temperatures.
Electrochemical impedance test
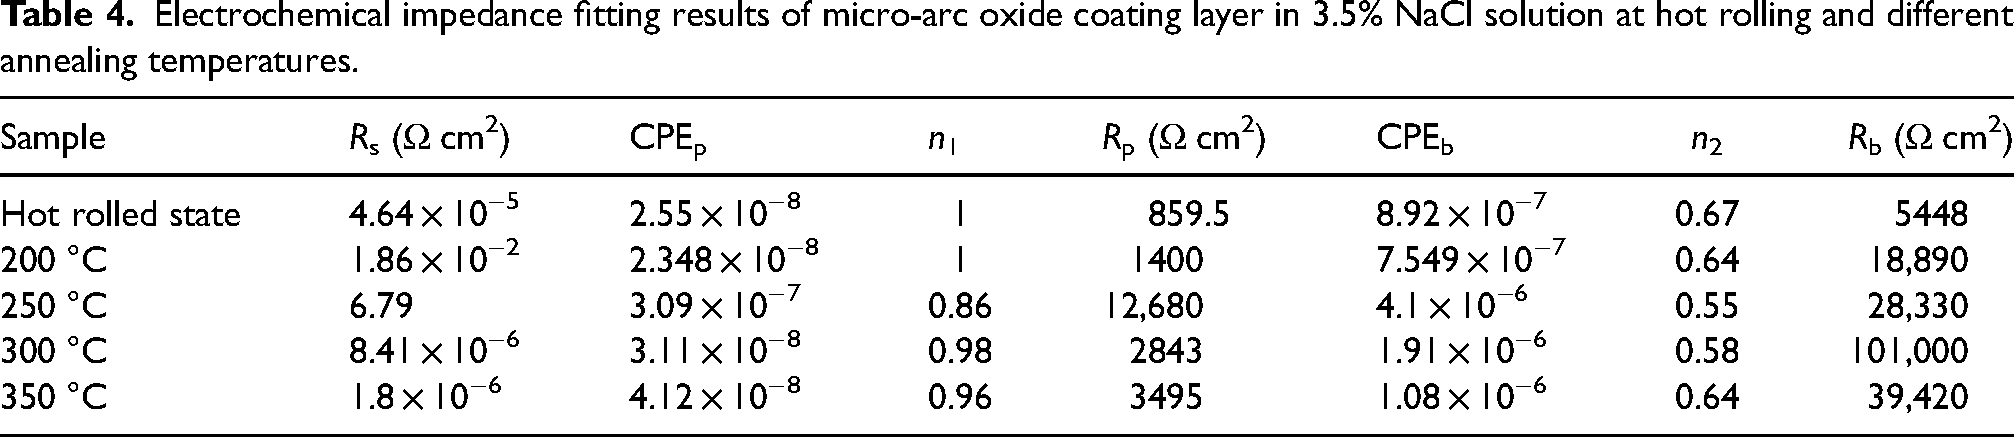
The Nyquist diagram of the AZ31 micro-arc oxide coating layer in the hot-rolled state and at different annealing temperatures is shown in Figure 14(a). The loop radius of the Nyquist plot is related to the corrosion rate, and a larger loop radius indicates that the sample is more resistant to corrosion. 30 It can be seen from the figure that with the increase of annealing temperature, the capacitive arc radius first becomes larger and then decreases, and when the annealing temperature is 300 °C, the capacitive arc radius is the largest and the corrosion resistance is also the best. The Bode diagram of AZ31 magnesium alloy after MAO treatment is shown in Figure 14(b), the greater the modulus (|Z|) the larger the scale, and the greater the corrosion resistance. This shows that with the increase of annealing temperature, the corrosion resistance of the alloy first increases and then decreases. Figure 14(c) shows the equivalent circuit for each sample. In the equivalent circuit diagram, Rs is the solution resistance, Rp is the loose layer resistance of the MAO coating, Rb is the resistance of the dense layer and CPE is the corresponding phase angle element.25,31 Table 4 shows the electrochemical impedance fitting results of different samples in 3.5% NaCl solution. The corrosion resistance of the anodic coating is determined by the resistance of the dense layer, 32 and among all samples, the annealing temperature of 300 °C shows the largest Rb, so it has the best corrosion resistance. This is consistent with the polarisation test results described above.
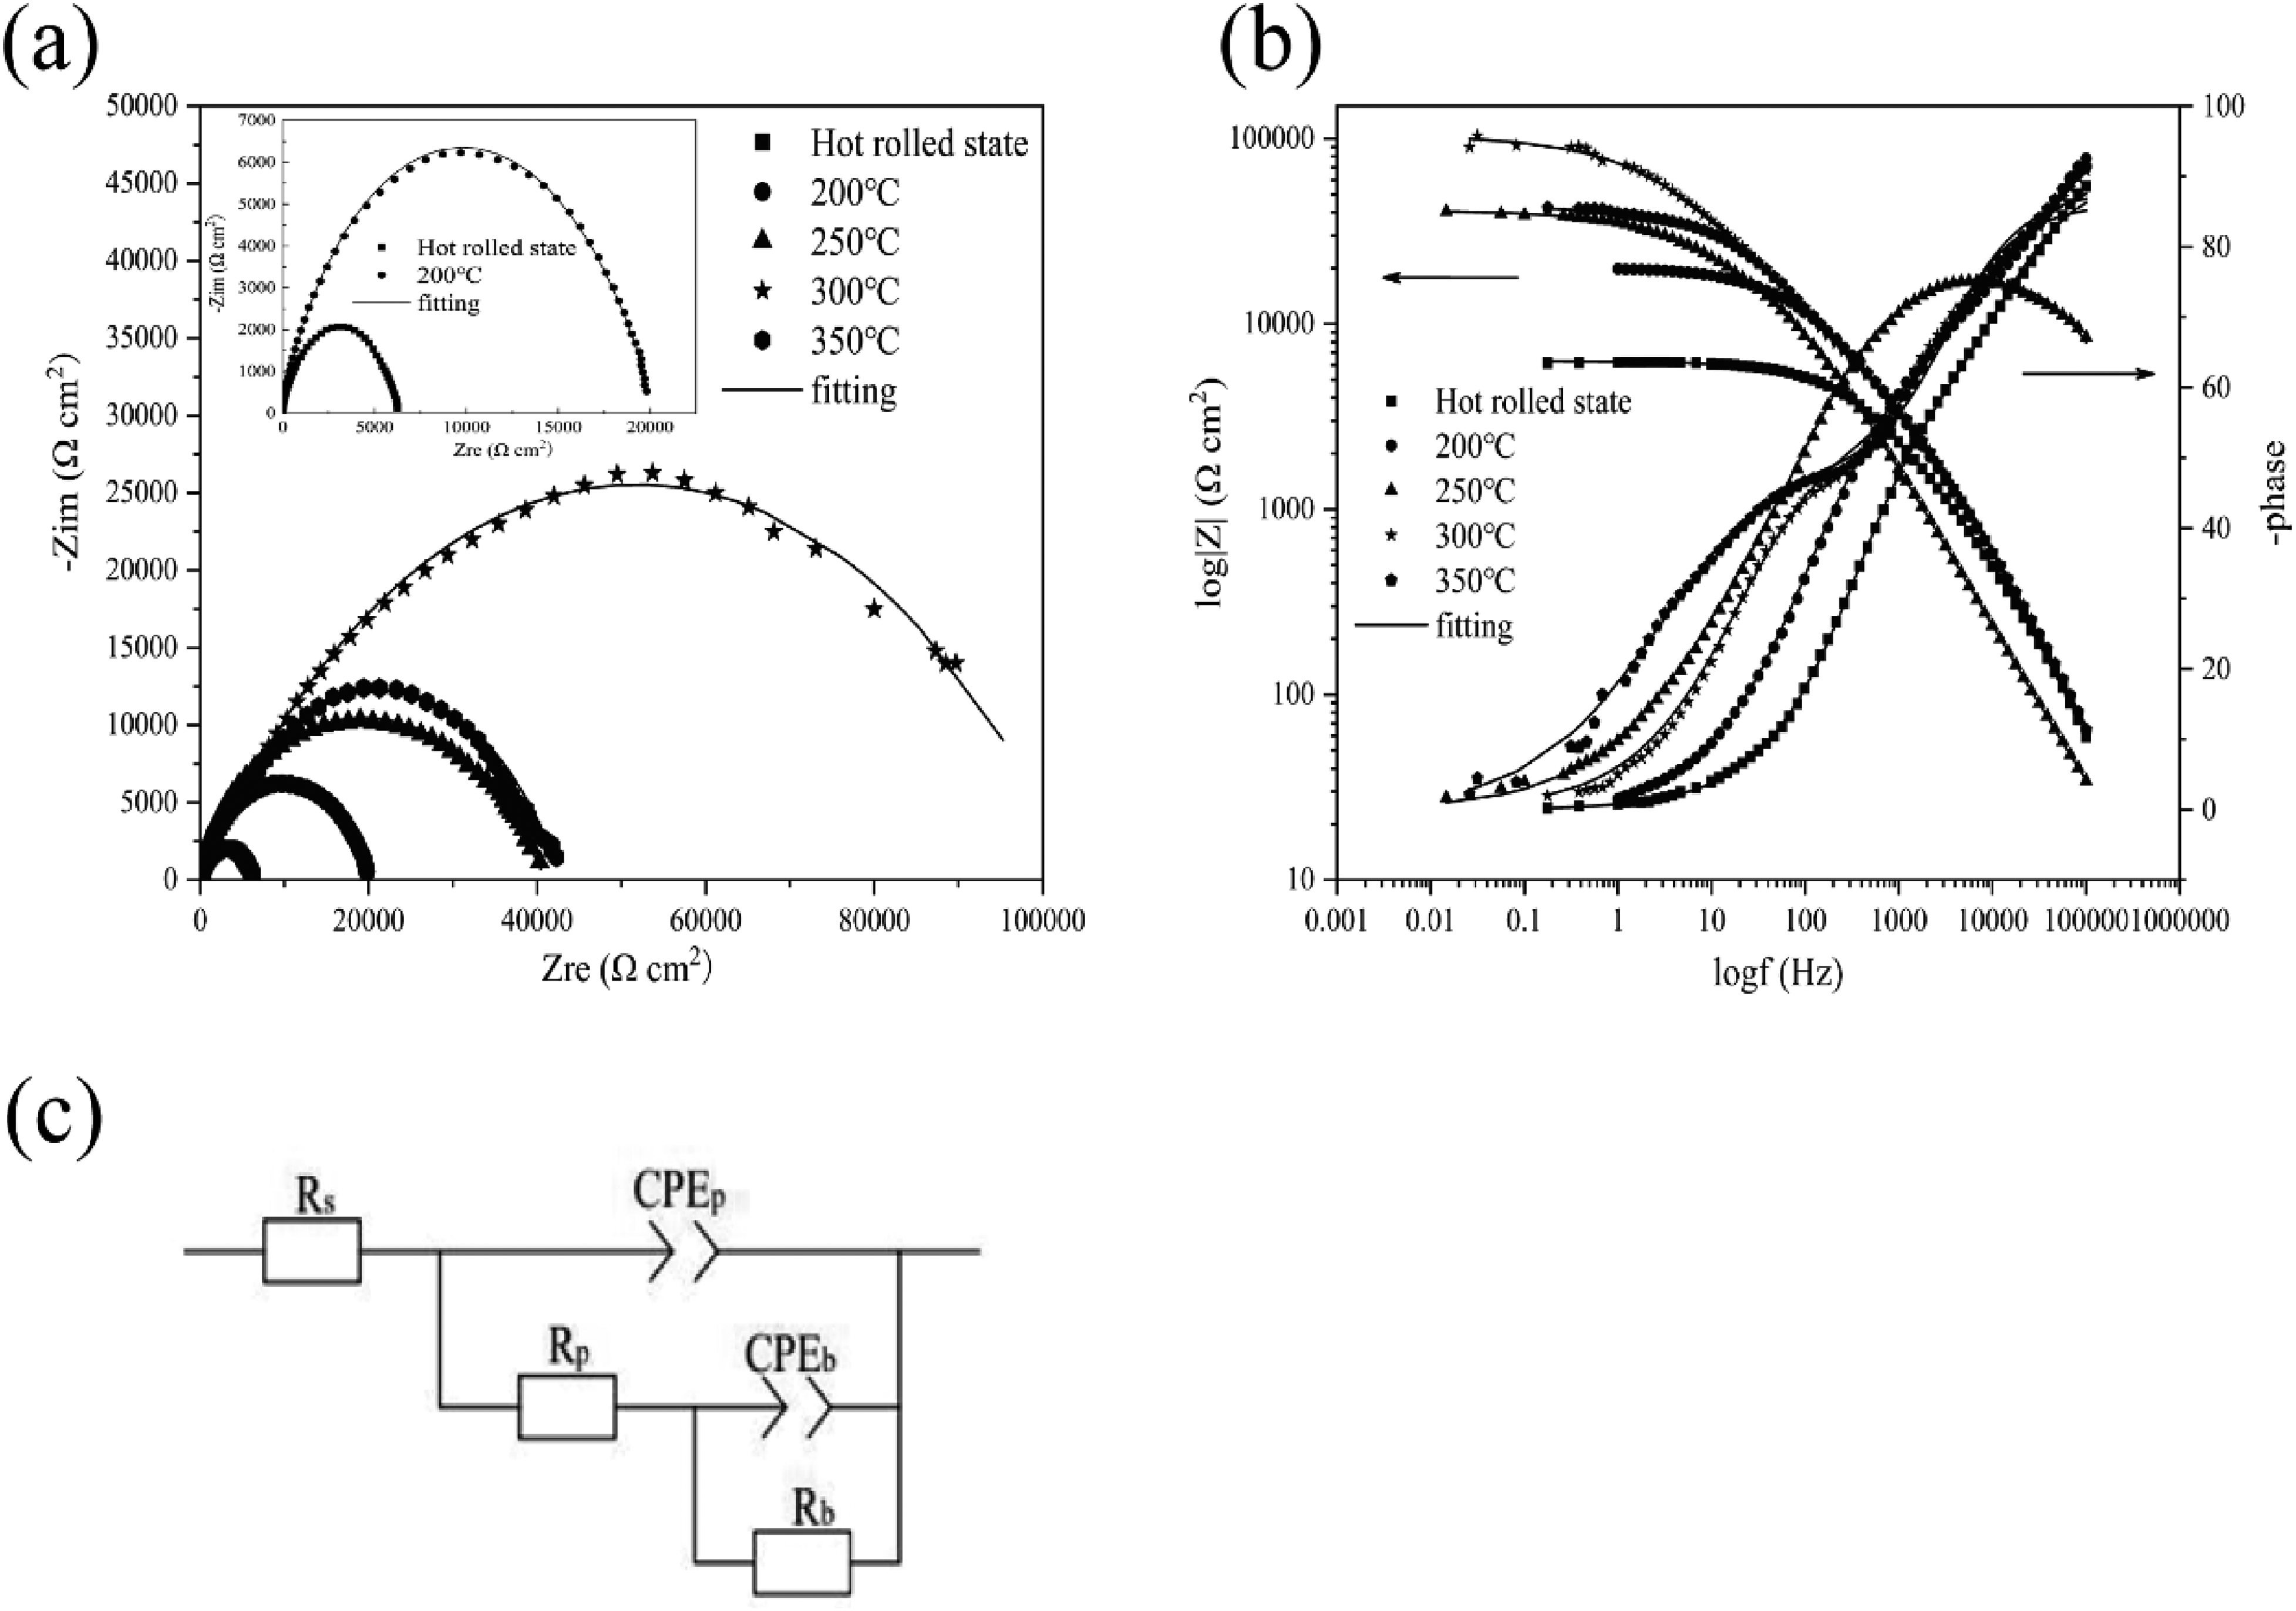
Impedance diagram of AZ31 micro-arc oxide coating layer fitting at hot rolling and different annealing temperatures: (a) Nyquist diagram, (b) Bode diagram and (c) Equivalent circuit.
Electrochemical impedance fitting results of micro-arc oxide coating layer in 3.5% NaCl solution at hot rolling and different annealing temperatures.
Conclusions
The effects of different annealing temperatures on the corrosion behaviour of MAO AZ31 magnesium alloy were studied, and the main conclusions are summarised as follows.
After hot rolling of AZ31 magnesium alloy at 400 °C, a large number of twins were observed inside the grains, and after annealing at 200 to 350 °C for 1 hours, the number of twins was constantly decreasing, the grain size showed a trend of first decreasing and then increasing, and the elongated grains after hot rolling changed to fine equiaxed grains and gradually grew abnormally. Changes in grain size cause changes in conductivity. The grain size and conductivity after annealing affect the microstructure of MAO coating. As the annealing temperature increases, the pore size increases first and then decreases. After annealing at 300 °C, the grain size (6.4 μm) of the alloy is the smallest, and the conductivity is the lowest (10.38 Ms/m) so that the coating obtains the smallest pores, the thickest coating layer, and the best corrosion resistance. Study the corrosion law of AZ31 magnesium alloy through immersion experiment and electrochemical test. With the increase of annealing temperature, the corrosion resistance of the alloy first increases and then decreases, which is related to the change in grain size and conductivity. At the same time, the 300 °C grain is finer and more uniform, the electrical conductivity is lower, and the pore size of the coating is smaller, so the corrosion resistance is better.
Footnotes
Declaration of conflicting interests
The authors declared no potential conflicts of interest with respect to the research, authorship and/or publication of this article.
Funding
The authors disclosed receipt of the following financial support for the research, authorship, and/or publication of this article: The financial aids from the National Natural Science Foundation of China under Grant No. 51871031 and the Priority Academic Program Development of Jiangsu Higher Education Institutions (PAPD).