
Abstract
This study investigates how yttrium (Y) and indium (In) substitutional doping tailors ZnO using density functional theory (DFT) in CASTEP within Materials Studio. A 2
Introduction
In today’s world, the proliferation of portable electronic devices and smart sensors has transformed daily life; however, their reliance on a continuous power source remains a major challenge. To address this, researchers are increasingly investigating self-sustaining energy solutions that harness ambient energy sources such as thermal, solar, and mechanical energy.1,2
Among these options, piezoelectric nanogenerators (PENGs) have become a promising technology, able to transform mechanical energy from environmental vibrations, human movements, or structural flexing into usable electrical power.3,4
Zinc oxide (ZnO), a wide-bandgap semiconductor, has garnered significant attention because of its unique set of properties: high exciton binding energy, excellent chemical stability, biocompatibility, and affordability.5–7 These features make ZnO a versatile material applicable in many areas, including piezoelectric sensors, photovoltaic devices, UV photodetectors, gas sensors, and transparent electronics.8–10 In piezoelectric applications, ZnO nanostructures—especially nanowires and nanorods—exhibit high electromechanical coupling efficiency, making them well-suited for energy harvesting in wearable tech and biomedical devices.11–13
In photovoltaics, ZnO functions as a transparent conductive oxide (TCO), enhancing light absorption and charge movement in thin-film and perovskite solar cells.14–17 Although pristine ZnO offers several benefits, it still encounters issues like low inherent conductivity and limited absorption of visible light.18–20 These limitations can be overcome by doping with transition metals (TMS), which creates controlled defects and modifies the electronic structure, thereby enhancing electrical, optical, and magnetic properties.21–23
In this context, yttrium (Y) and indium (In) have become effective dopants. Yttrium, a rare-earth element with a relatively large ionic radius, has been demonstrated to enhance the dielectric properties, decrease defect density, and improve carrier mobility in ZnO matrices.24–26 Research shows that Y-doping reduces trap sites and enhances surface morphology, benefiting optoelectronic uses.27–29 For example, Y-doped ZnO nanostructures show increased dielectric permittivity and reduced AC conductivity, making them ideal for high-performance electronic devices. Similarly, Indium doping introduces localized states within the bandgap, effectively narrowing it and broadening ZnO’s photoresponse into the visible spectrum.23,30,31 In-doped ZnO thin films show better crystallinity, increased optical absorption, and altered surface textures, which are advantageous for photocatalytic and photovoltaic applications.32–35 Incorporating In also increases electrical conductivity and improves charge separation, which are crucial for efficient energy conversion. The selection of dopants depends on various factors, such as ionic radius compatibility, solubility, and their ability to alter electronic properties without destabilizing the ZnO lattice.36–38
Both Y and In meet these criteria, exhibiting low formation energies and favorable substitution behavior in ZnO’s wurtzite structure.39–42
This research uses CASTEP, a first-principles density functional theory (DFT) software, to systematically analyse how doping with Y and In influences the structural, electronic, and optical properties of ZnO. By simulating atomistic interactions and electronic band structures, the study aims to reveal the mechanisms through which these dopants improve ZnO’s performance, guiding the development of advanced materials for energy harvesting and optoelectronic applications.43–45
Semi–local GGA–PBE is known to underestimate the ZnO band gap owing to self–interaction error and the missing derivative discontinuity; in our supercell calculations the pristine phase yields
No Hubbard
Computational and geometry models
This study evaluates the computational models of both pure and doped ZnO system, and compare them with the existing literature.
All density–functional calculations were carried out in CASTEP within the generalized gradient approximation of Perdew Burke Ernzerhof (PBE); all runs were spin–polarized. A 2
The doping levels based on the atomic substitution were kept fixed to 14.2% and 28.4% in this study. Figure 1 shows the designed model of pure ZnO system. In Figure 1(b) and (c), Y doped ZnO models are shown, Zn atoms are substituted by Y atoms. Figure 1(d) and (e) show the In doped ZnO system.

(a) Pure ZnO supercell (Oxygen atoms in red, Zn atoms in dark grey, Y atoms in cyan, and In atoms in brown). (b) 2Y doped ZnO supercell. (c) 4Y doped ZnO supercell. (d) 2In doped ZnO supercell. (e) 4In doped ZnO supercell.
The nominal concentrations used here (14.2% and 28.4%) result from substituting two and four Zn sites, respectively, in a 2
Results and discussions
Results with their analysis are given below:
Band structure and DOS of doped ZnO
The given research gives a comprehensive evaluation of the electronic behaviour of pristine and doped ZnO through a study of their band structures and density of states (DOS). The Y and In doping concentrations were added in an attempt to determine how they impacted the electrical properties of pure ZnO. To have a complete picture of dopant induced changes, band structure and DOS calculations were made to both relaxed and fully optimized geometries.45,49,50 Doping led to a small change in bond length: in the undoped Zn-O structure the bond length changed by 0.004 Å between the initial 2.005 Å and in the doped structures the Y-O bond length changed by 0.171 Å compared to 2.073 Å, and the In-O bond length changed by 0.149 Å compared to 2.005 Å. The electronic band structures were calculated along the high symmetry path of G-F-Q-Z and the DOS calculations used a 4 x 4 x 4 Monkhorst-Pack k point grid across all configurations.
A band gap of 0.603 eV was computed for pure ZnO system while evaluating the band structure, as shown in Figure 2 (a).

Band structures of (a) Undoped ZnO, (b) 2Y doped ZnO, (c) 4Y doped ZnO, (d) 2In doped ZnO, and (e) 4In doped ZnO.
The band structure modification is pronounced with dopant dependent modifications. In the case of Y doping, the band gap (0 eV) is completely closed by the introduction of 2Y atoms, which means that the behaviour becomes metallic as shown in Figure 2(b)-(c).51–53 Further concentration to 4Y results in partial reopening of the band gap (0.941 eV), which is non linear in the doping response and is probably due to localized states or structural relaxation effects. In doping, the 2In and 4In structures both have full band gap closure, and hence, persistent metallic behaviour regardless of dopant concentration 2(d)-(e). These tendencies are in correlation with the known results that transition metal dopants bring about donor levels and defect states close to the Fermi level, which enhance carrier concentration and electrical conductivity.54–56
The band structure is in agreement with DOS analysis as shown in Figure 3. At the undoped ZnO system, the DOS is mostly smaller than the Fermi level, as is expected of a semiconductor with an explicit band gap. The 2Y doping material has a strong effect, which is a high DOS at the Fermi level, meaning that the material has developed donor states that are attributed to metallic behaviour. The concentration to 4Y is keeping the DOS at a high level close to the Fermi level with a slight decrease over 2Y, which is similar to the partial opening of the band gap and the shift to a narrow gap semiconducting state. The two Y doped systems exhibit localized states at the Fermi level which is indicative of enhanced carrier mobility and conductivity. In doping In 2In and In 4In systems both have a high DOS at the Fermi level and an apparent gap, indicating the highly metallic character of the systems and the presence of a large number of conduction states. These observations support the known fact that Y and In doping produce donor levels and defect related states, which enhance carrier density and mobility, and convert ZnO into a more conductive material that can be used in applications like transparent conductors, sensing platform and spintronic device.57–60
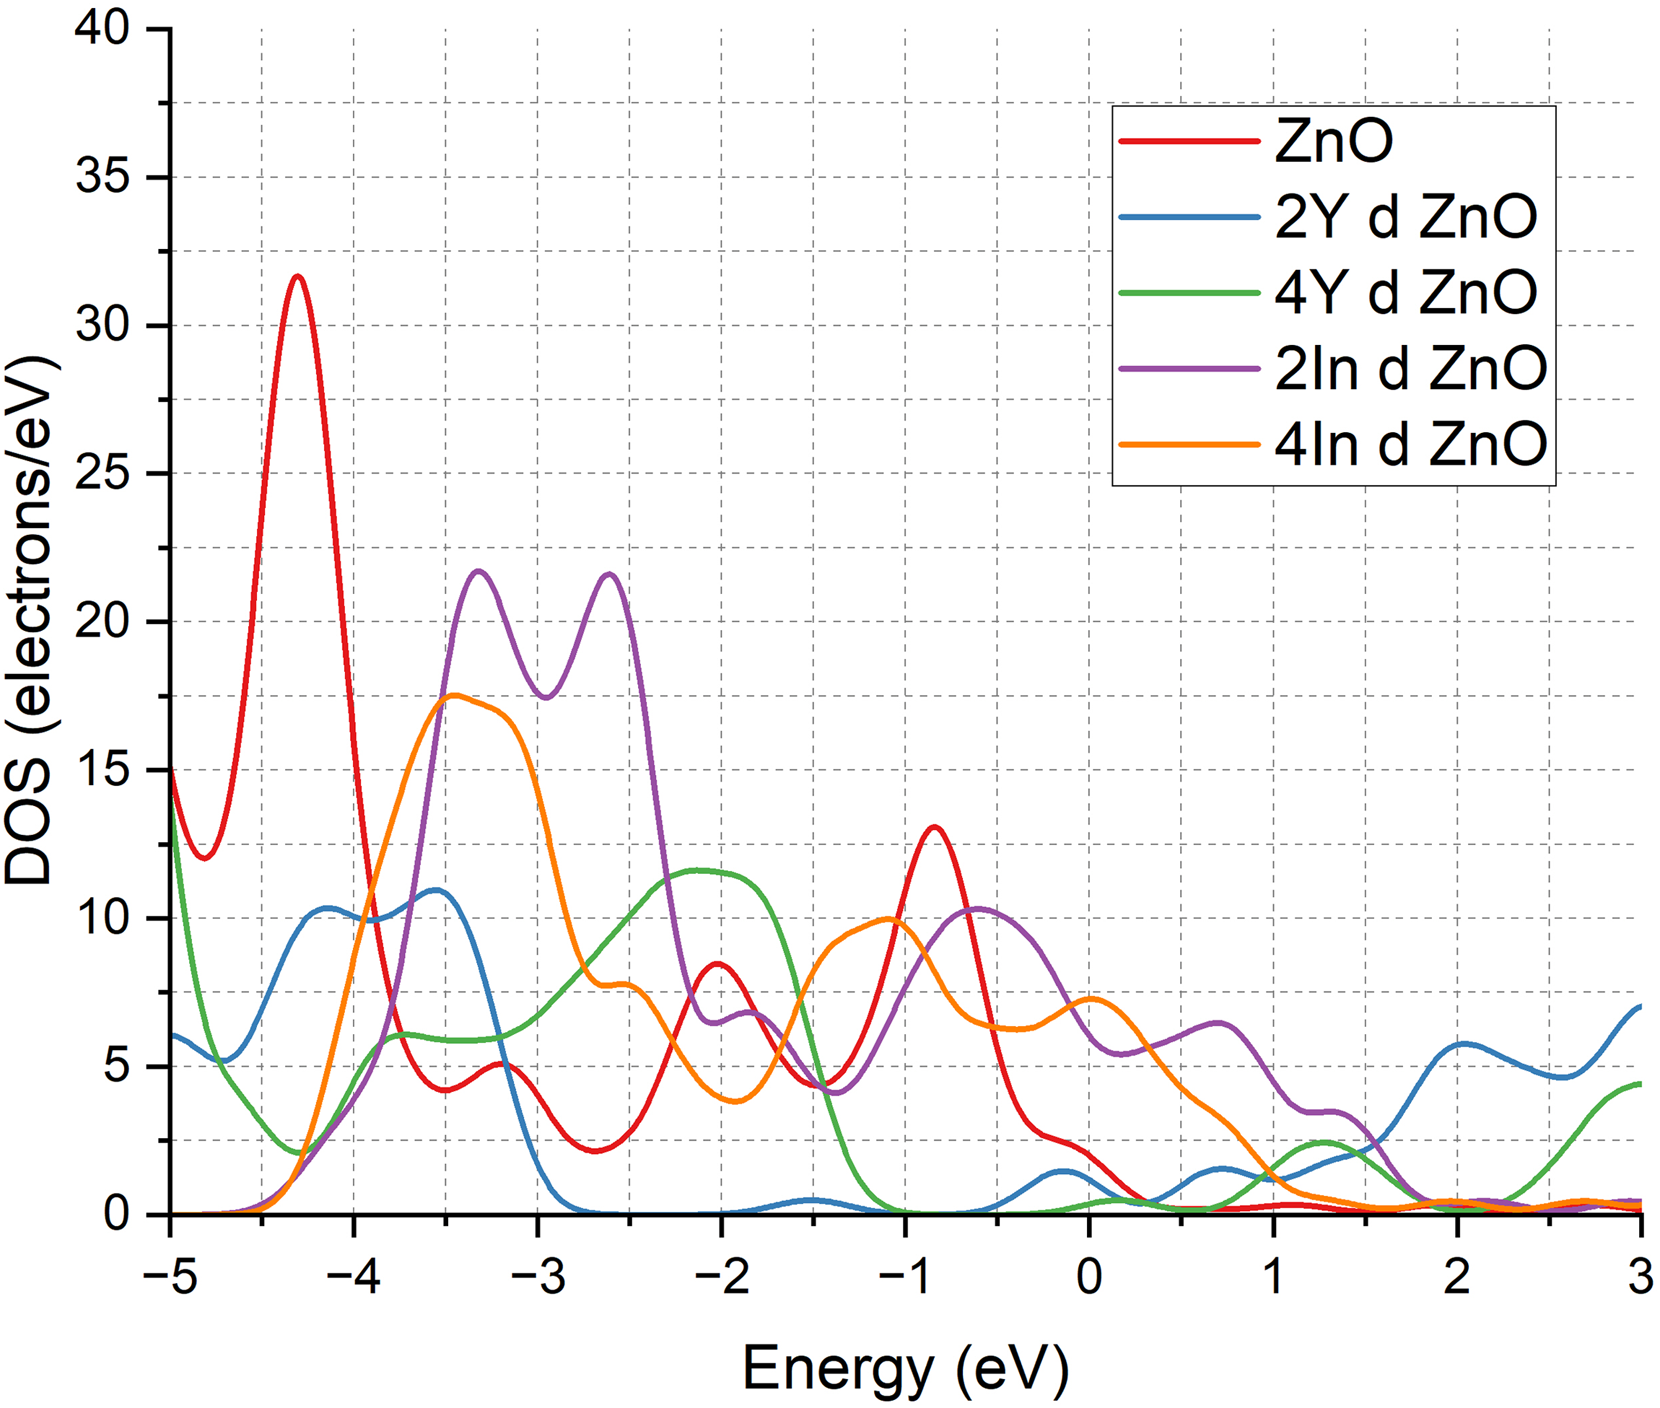
DOS of pure ZnO & doped ZnO cases.
Optical properties
The optical characteristics, which include reflectivity, refractive index, optical conductivity, absorption coefficient and dielectric function, have been well reported in the past literature making a solid basis of assessment of dopant induced effects.61–63 The basis sets and computational parameters used in this work are in line with the available methodologies . All electronic and optical computations were made with the Density Functional Theory (DFT) in the Perdew-Burke-Ernzerhof (PBE) form of the Generalized Gradient Approximation (GGA), which is a well-tested framework of semiconductor properties modelling.64–66
The refractive index analysis will also give extra information on the optical and electronic changes caused by Y and In doping, as indicated in the Figure 4. The undoped system (red curve) has a standard low energy peak of a wide bandgap semiconductor with a small contribution of free carriers. The addition of 2Y atoms (blue curve) at the beginning lowers the refractive index compared to pure ZnO, but becomes higher than it at high energies, indicating the development of donor states and greater electronic polarization at high energies.
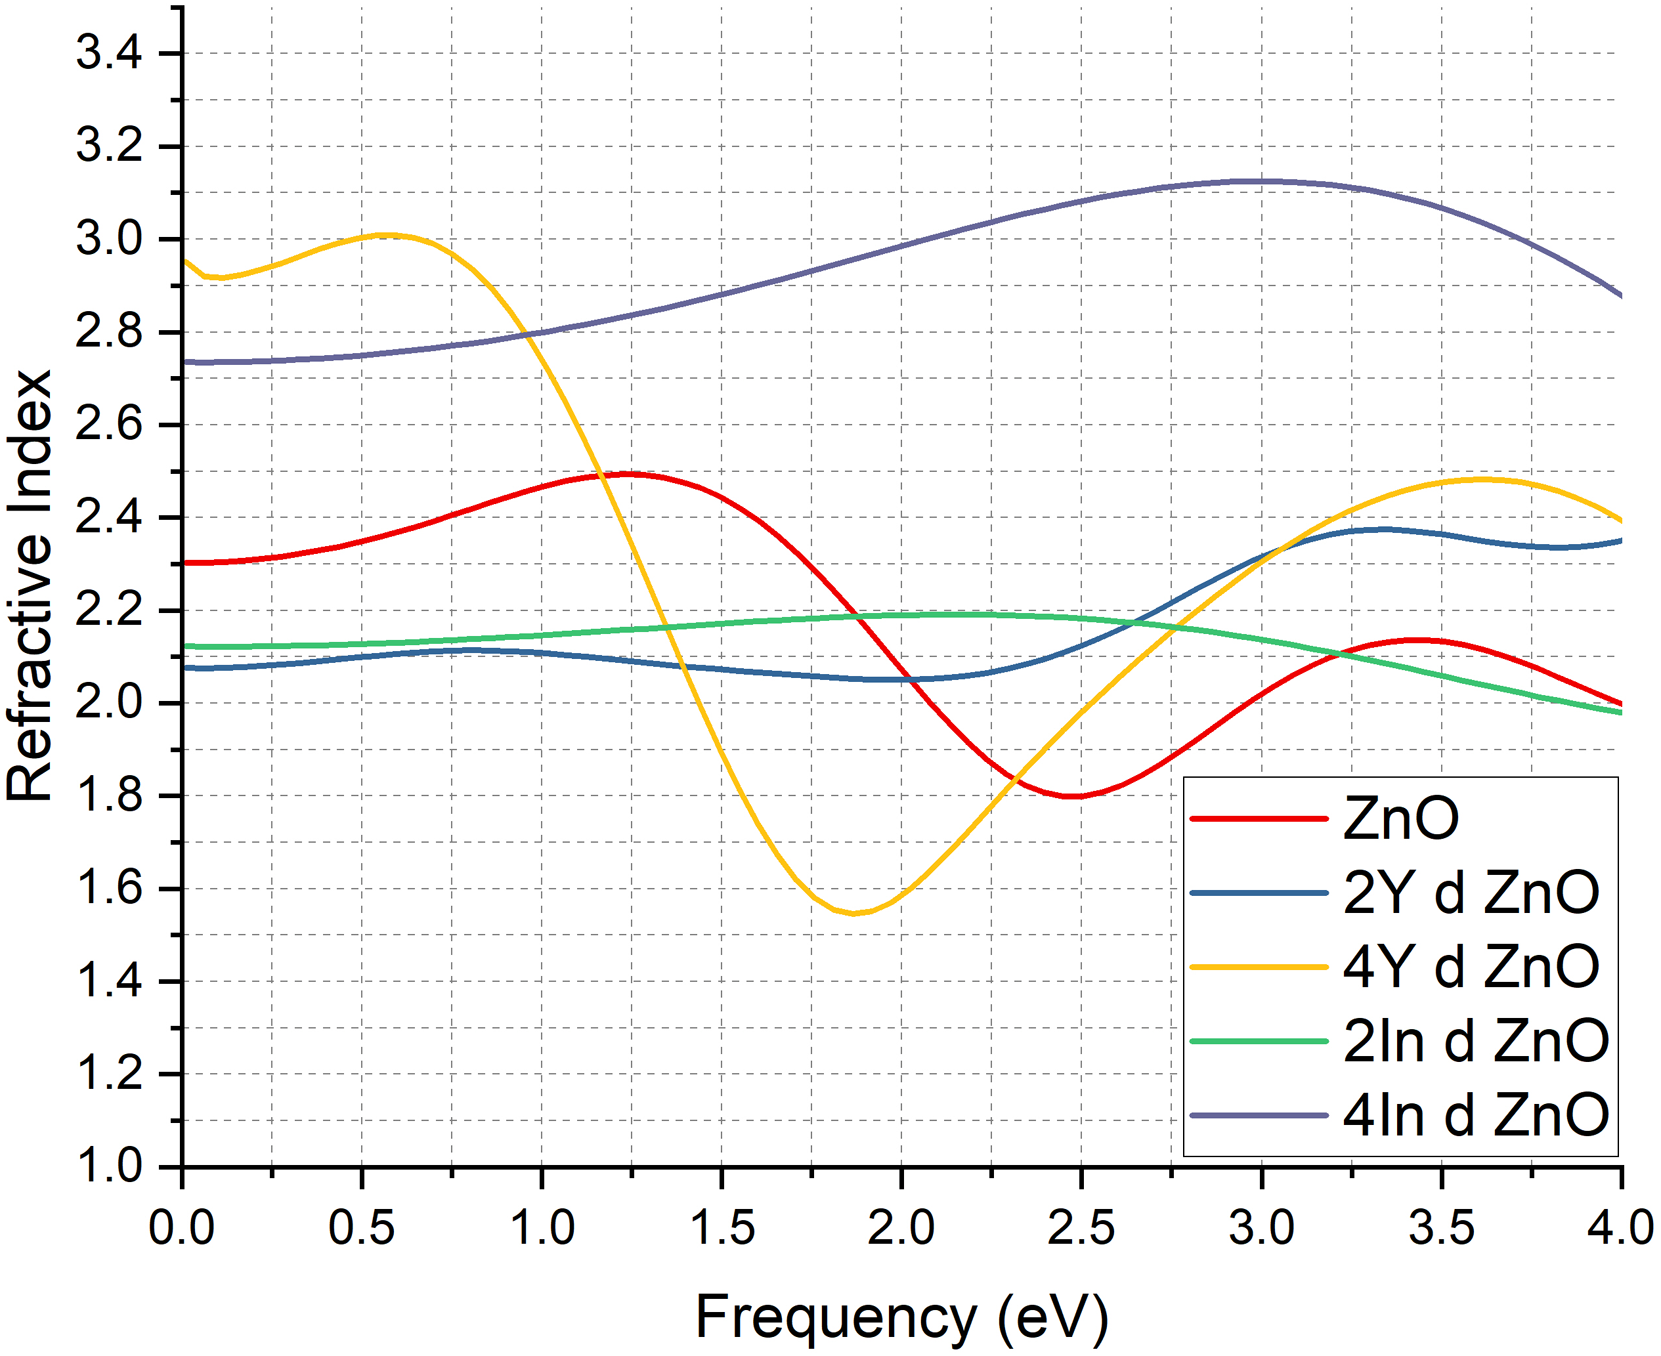
Refractive Index of pure ZnO & doped ZnO cases.
As the doping level grows to 4Y (yellow curve) the overall refractive index is larger, but there seems to be a small decline at 2 eV than at 2Y. This behaviour is associated with the partial opening of the band gap (0.941 eV) and a density of states that is moderated, which suppresses low energy carrier response and increases polarization at higher energies. This general trend in the increase of refractive index with 4Y is due to increased lattice distortion and increased electronic polarizability, in that higher concentration of Y atoms causes strain, localized defect levels, and increased charge redistribution. All these results enhance the optical response and provide a higher refractive index than undoped and 2Y doped ZnO.
In the case of the In doped systems, the 2In (green curve) exhibits a very stable refractive index at 2
These trends are consistent with the existing literature that indicates that the optical constants are enhanced by transition metal doping by increasing the carrier density, as well as by changing the electronic structure.67–69 It is interesting to note that the 4Y and 4In designs exhibit the largest improvement in refractive indices, due to concentration of carriers, lattice distortion, and electronic polarizability, and are therefore especially useful in applications of optoelectronic, sensing, and photonic devices.
Figure 5 of the absorption spectra explains the dependence of optical response of ZnO on the dopant. In the undoped system (red curve), the absorption edge starts at about 0.5 eV, which is in agreement with a wide band gap semiconductor needing more energy photons to make interband transitions. When doped with 2Y (blue curve), the edge moves to 0.5 eV and the absorption is maxima around 5,000
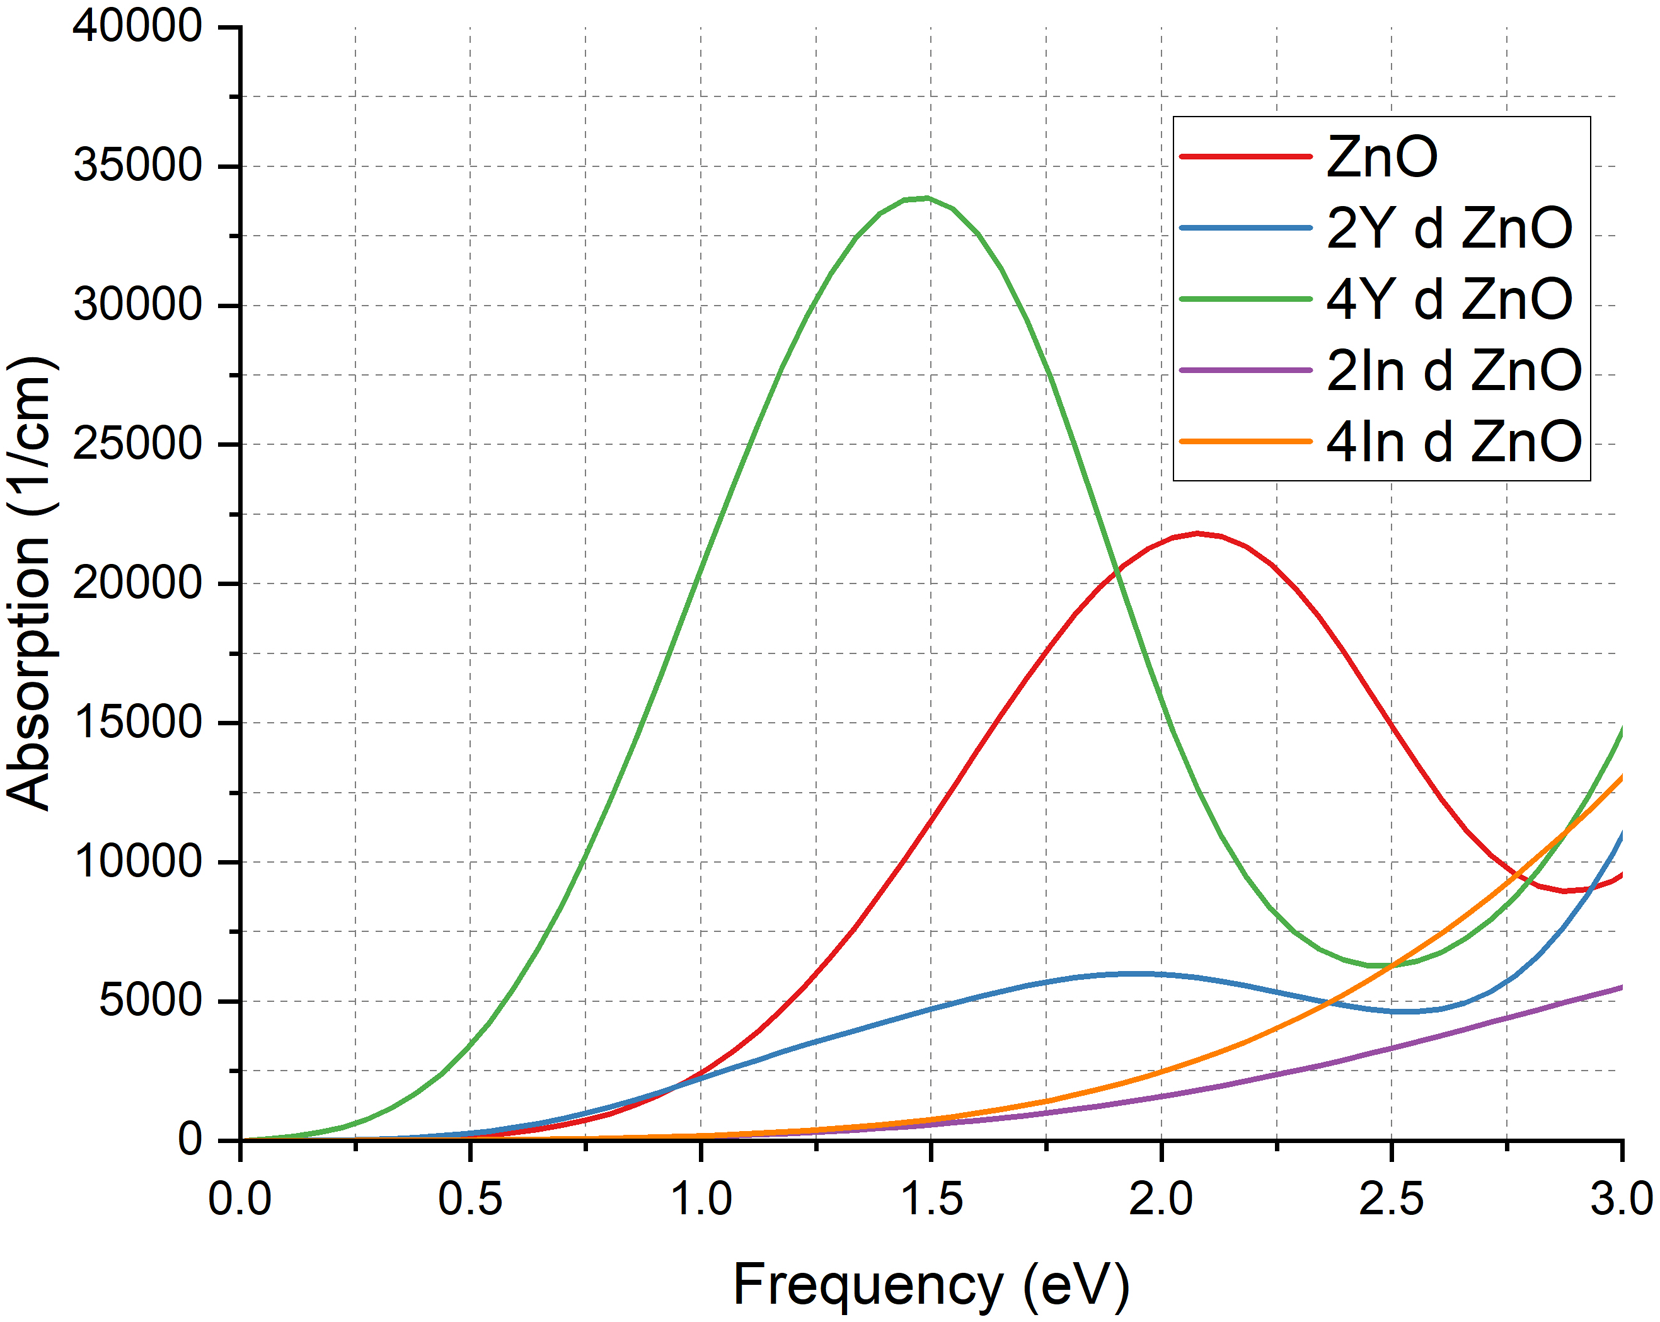
Absorption Coefficient of pure ZnO & doped ZnO cases.
The reflectivity spectra also explain the optical changes that Y and In introductions cause in ZnO as shown in Figure 6. The reflectivity of the undoped sample is low with a maximum of slightly less than 0.2, typical of wide band gap semiconductors where the low free carrier density leads to low light-matter interaction. With the addition of 2Y atoms to ZnO, reflectivity increases significantly and exceeds 0.125 in the low energy range. This improvement is indicative of the increase in electronic polarizability and interaction of free carriers due to the appearance of Y related donor states. When 4Y doping is used the reflectivity increases even more and reaches about 0.25. This growth is due to the increased concentration of the Y atoms giving rise to more defect induced carriers and a stronger lattice distortion which increases the interaction of the electrons and the incoming photons. However, in contrast, the behaviour of the In doped samples is dictated by their metallic like behaviour. There is a relatively flat curve in the 2In doped ZnO and the sample with 4In doping has a steady reflectivity of above 0.20. These elevated values come about due to the fact that metallic systems with closed band gap have dominant free carrier reflection as opposed to semiconducting interband contributions and the high concentration of electrons at the Fermi level increases the total reflectivity. High reflectivity in 4In doped ZnO is thus attributed to high free electronradiation coupling as is characteristic of conductive materials. These observations are consistent with earlier studies that suggest transition metal doping in ZnO enhances its optical constants, including reflectivity, due to increased carrier concentration and modified electronic structure.21,73,74
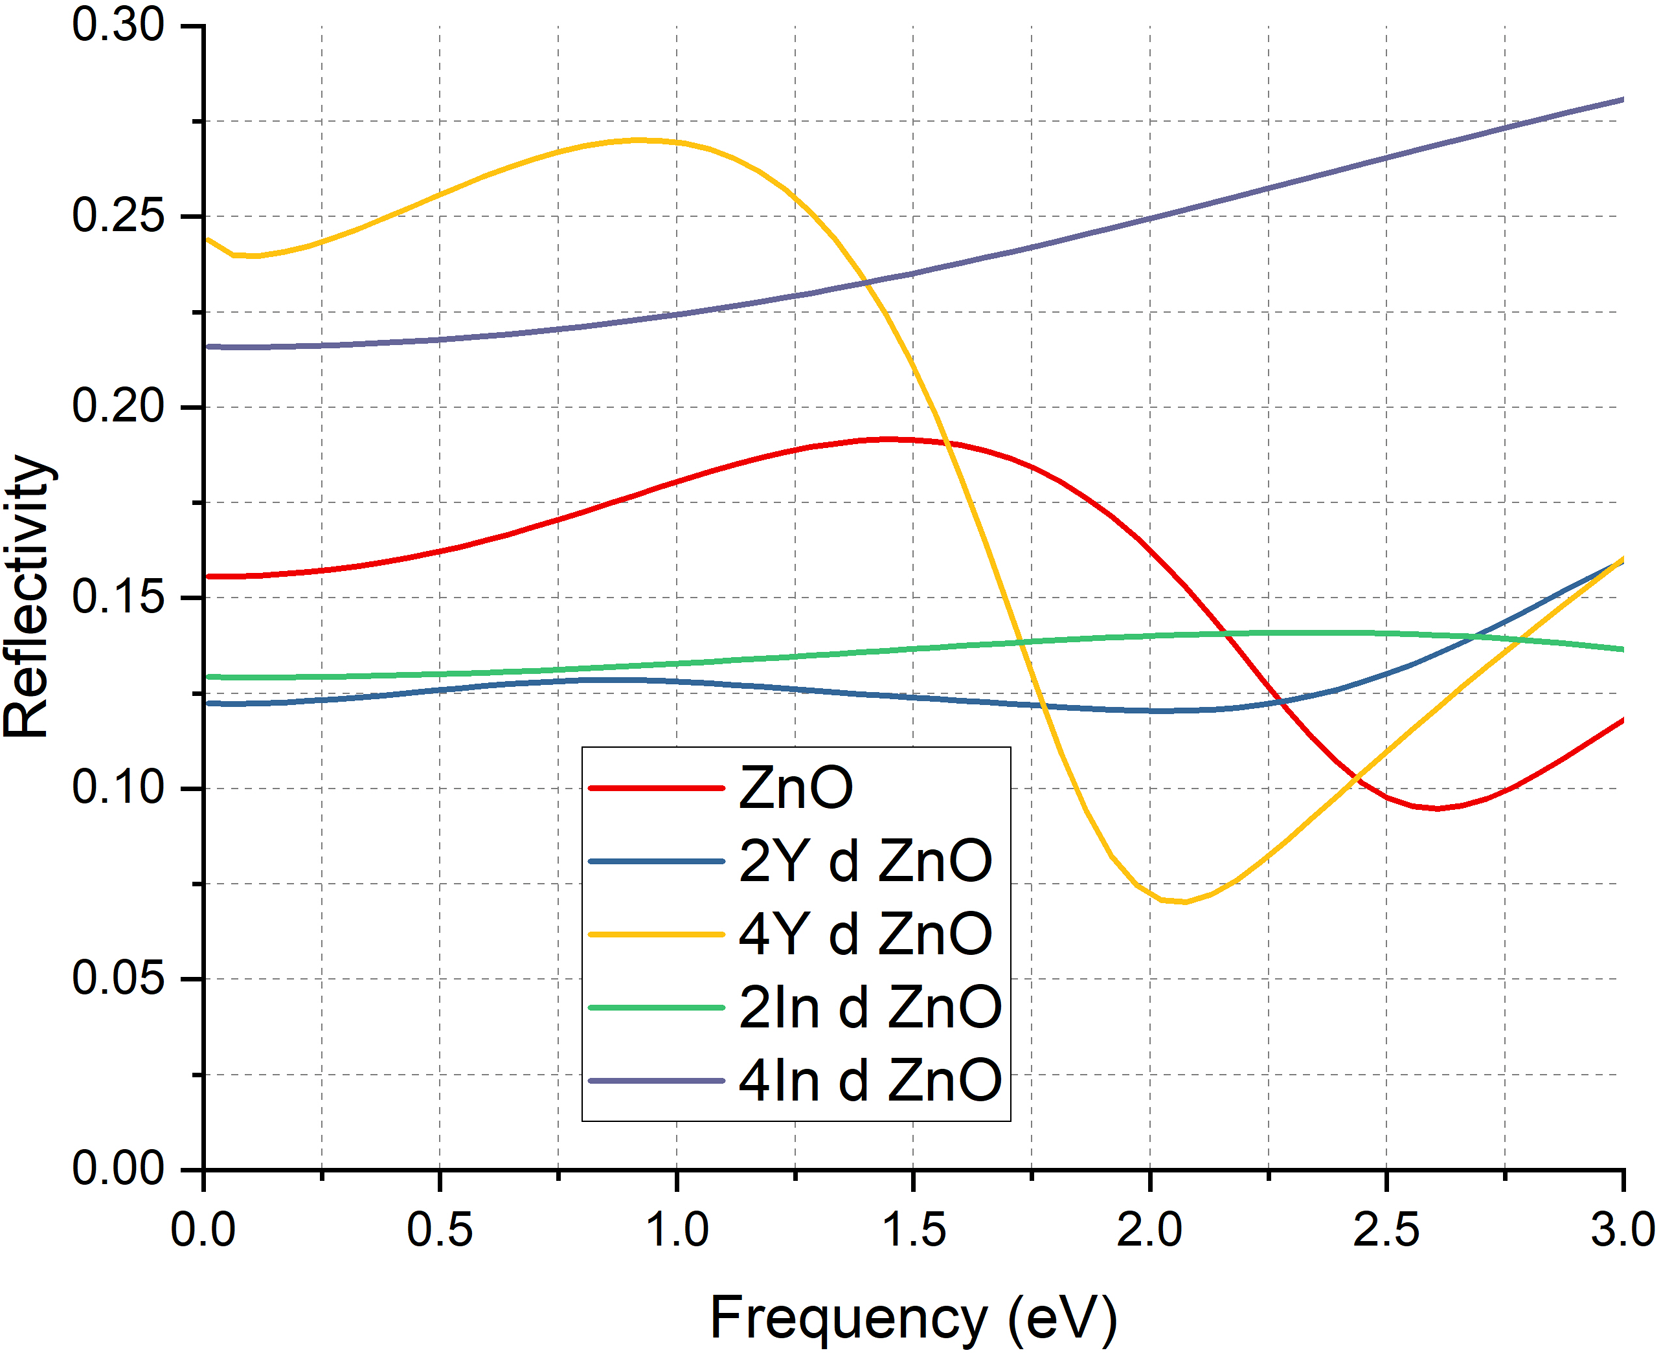
Reflectivity of pure ZnO & doped ZnO cases.
The optical conductivity spectra
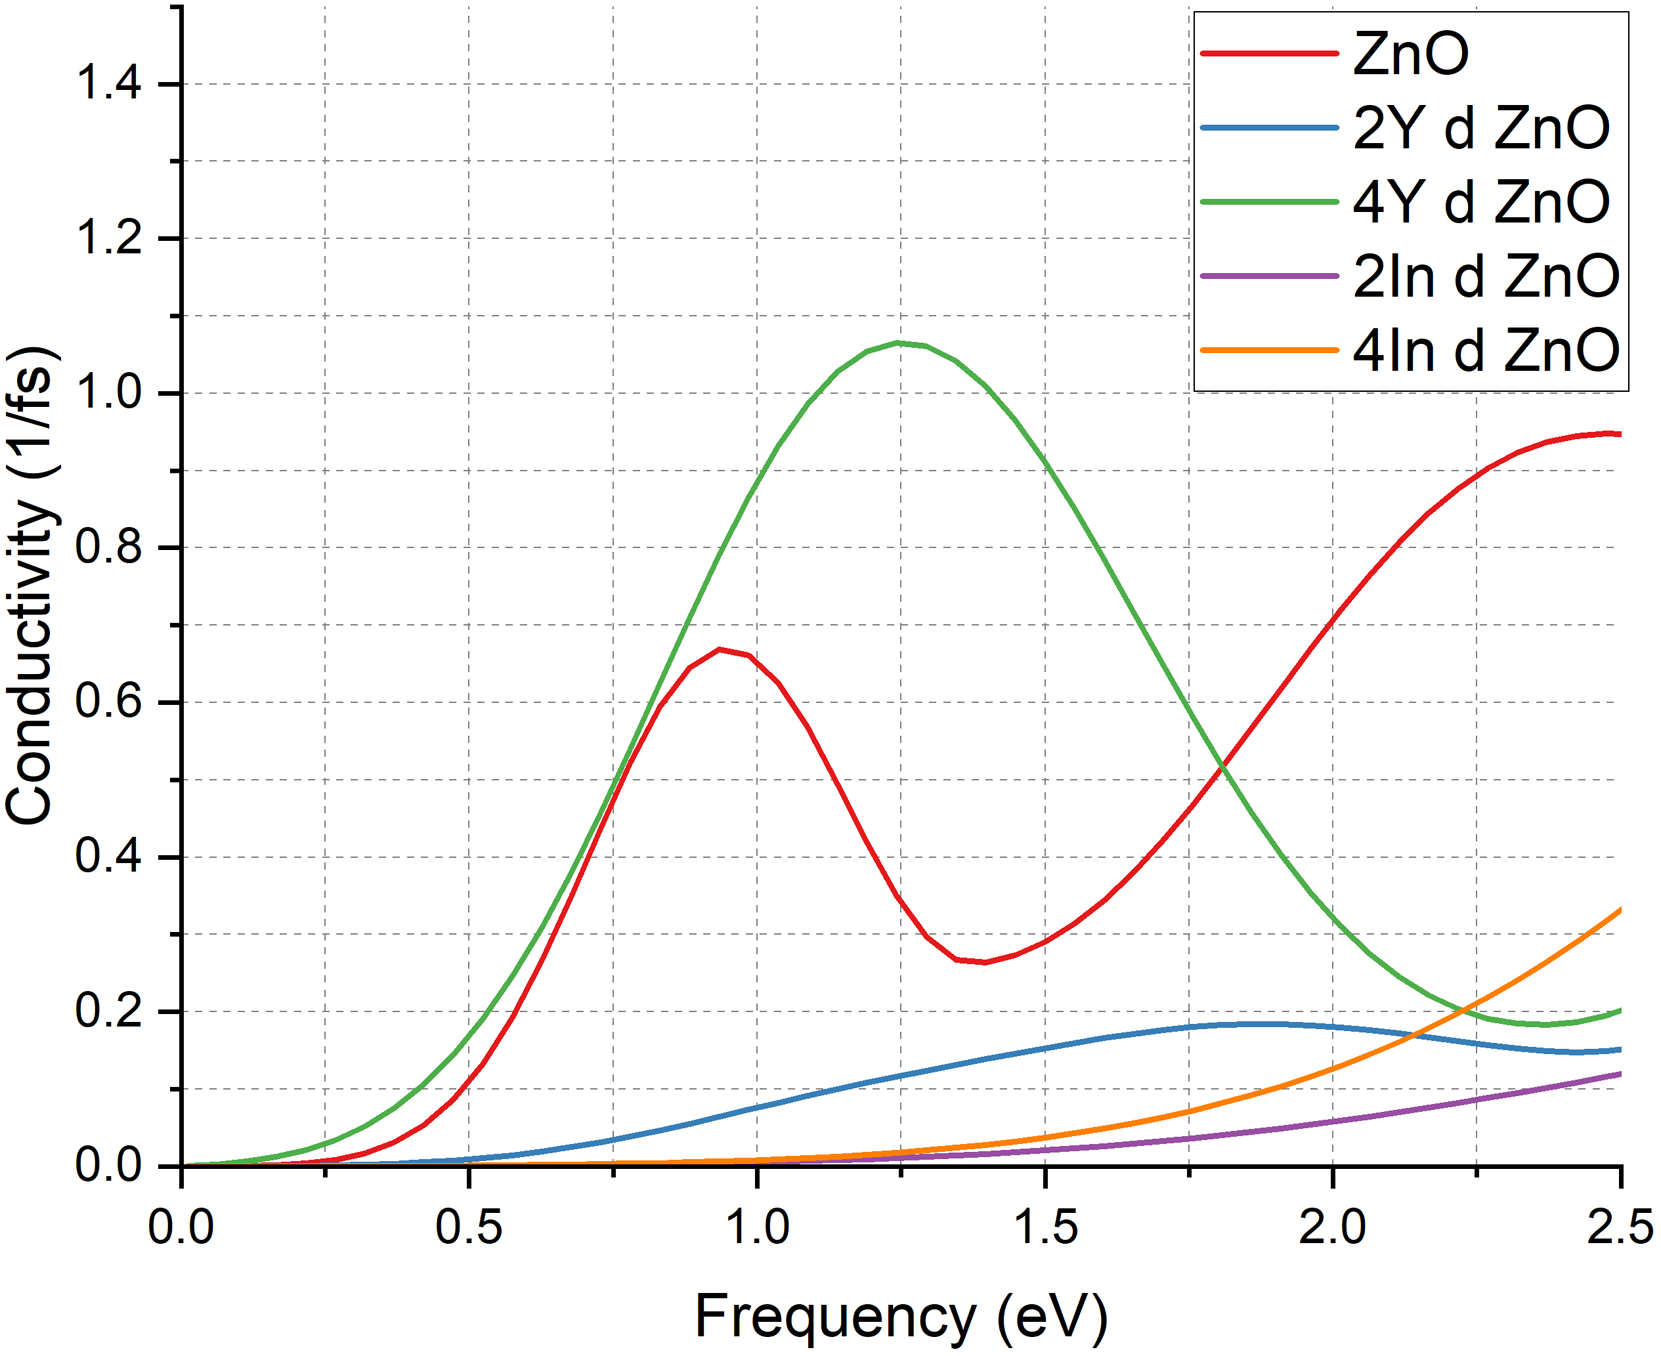
Conductivity of pure ZnO & doped ZnO cases.
The amplitude of dielectric functions shown in Figure 8 spectra gives invaluable information on the polarization behavior of ZnO in the presence of Y and In dopants. The dielectric function of the undoped ZnO system, as indicated by the red curve, is strongest at 5
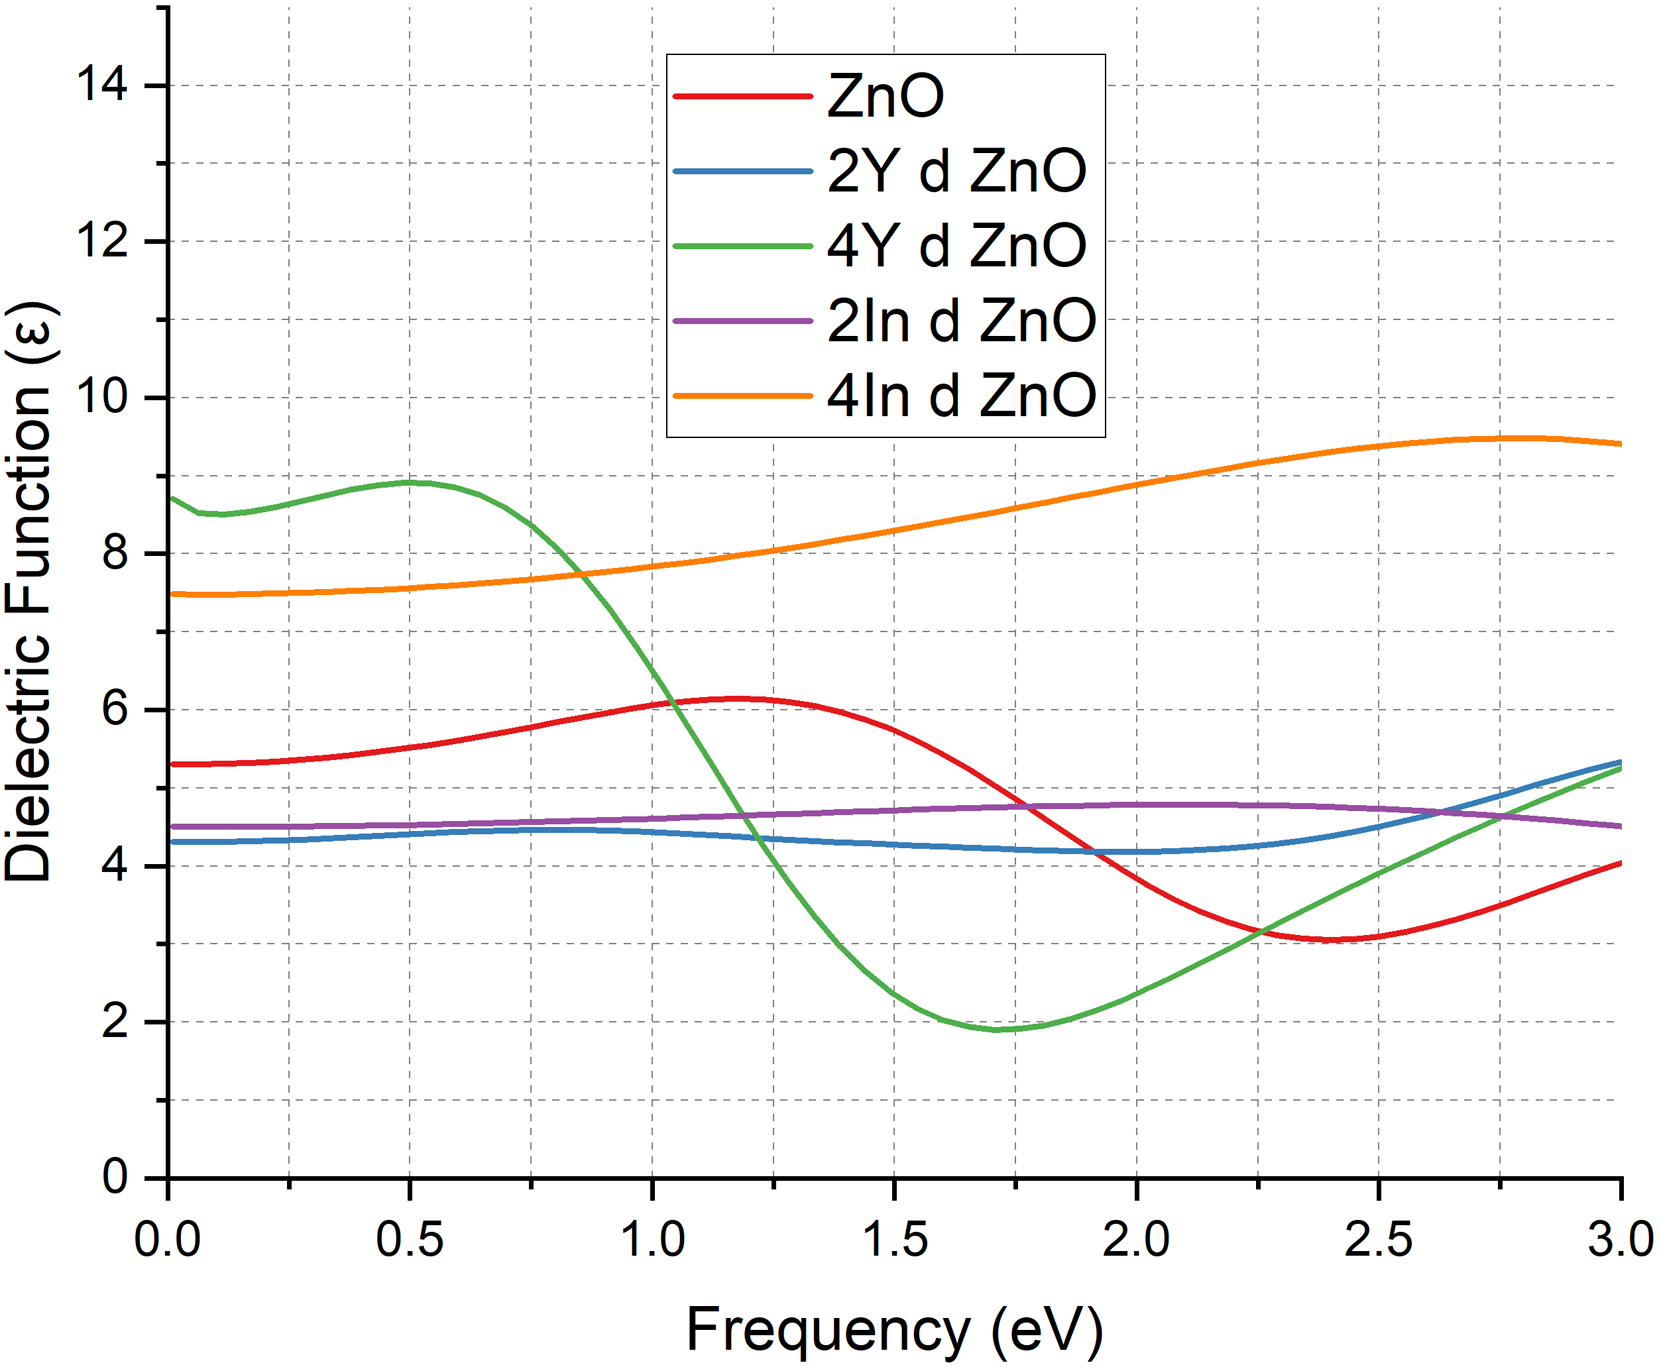
Dielectric Function of pure ZnO & doped ZnO cases.
These findings align with the previous research that indicated that doping of ZnO with transition metals improves the dielectric response of the material by altering its electronic structure and increasing the free carrier concentration.12,13,17 The monotonic growth in dielectric function of both Y and In doped systems proves that doping enhances the capability of the material to polarize when it is subjected to external fields. Nevertheless, the processes are different: Y doping increases dielectric response by defect mediated polarization and partial semiconducting behaviour whereas In doping increases it by metallic free carrier (plasmonic) effects. A combination of these findings supports the fact that doped ZnO especially at the higher Y or In concentrations has much better dielectric activity, making it a good candidate to optoelectronics, photonics, sensing, and high frequency dielectric devices.
Elastic constants
CASTEP is used to compute the elastic constants for evaluating the stability of the modified structure. Elastic constants were obtained via a finite–strain stress–strain approach by applying
The elastic constants that are determined by CASTEP, directly measure the mechanical stability of the doped and undoped structures of the ZnO given in the Table 1:7,78
Elastic constants of doped and un-doped znO systems
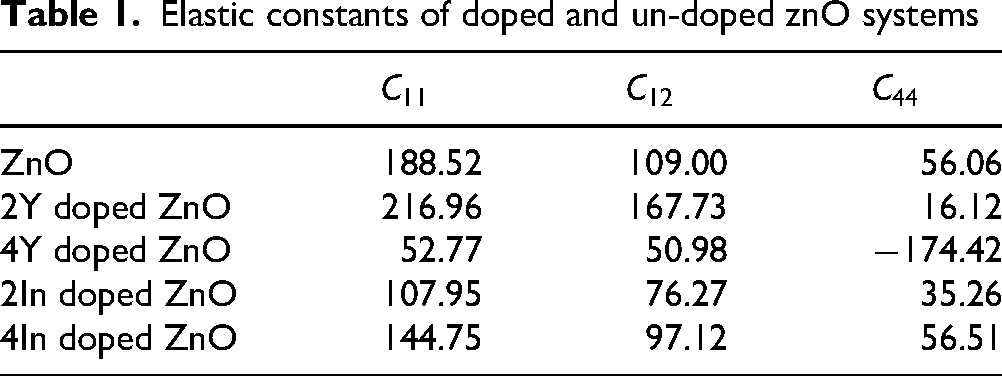
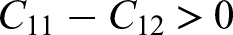
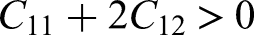
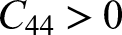
In case of a hexagonal or wurtzite type system, the following conditions are to be met to be mechanically stable. Undoped ZnO has all the criteria of stability with
XRD spectra
The structural integrity and phase behaviour of the doped systems are also justified by X ray diffraction (XRD) analysis. The undoped ZnO sample is equivalent to the JCPDS card 36 1451 and the sharp and well defined peaks are attributed to the hexagonal wurtzite structure and indicates high crystallinity that can be used as a good reference to compare with.12,13,63,64 As illustrated in Figure 9, the primary diffraction peaks in the Y doped ZnO samples are almost at the same positions that they are at the 2 theta position, which shows that the wurtzite phase is retained despite the substitution. Nevertheless, the 2Y doped ZnO exhibits slight peak broadening and slight intensity shifts, which implies that there is no significant strain on the lattice. In contrast the 4Y doped sample has more intense peak shifts, lower intensity and broadening. These effects are due to the fact that the radius of Y is much larger and therefore causing greater lattice distortion and microstrain, which is in agreement with the structural stress computed by the elastic constant analysis. The wurtzite phase still exists but the extra disorder in 4Y is the reason why it is mechanically unstable and of lower shear strength. 81

XRD Spectra of pure ZnO & Y doped ZnO cases.
The Figure 10 shows the In doped systems, 2In and 4In have diffraction peaks similar to those of undoped ZnO, and it can be affirmed that the wurtzite structure is retained. Minor changes in the position of peaks indicate effective In substitution, because of intermediate expansion of the lattice as a result of the slightly larger atomic size of In compared to Zn. The deformations in 4In are somewhat higher than in 2In, but much less extreme than those in the 4Y sample, pointing to the fact that In fits better into the ZnO lattice. The findings of the XRD are, thus, consistent with the results of the elastic constant: Y doping causes enormous strains of the lattice in high concentrations, but In doping causes tolerable distortion in high concentrations, keeping the overall structure intact.12,13
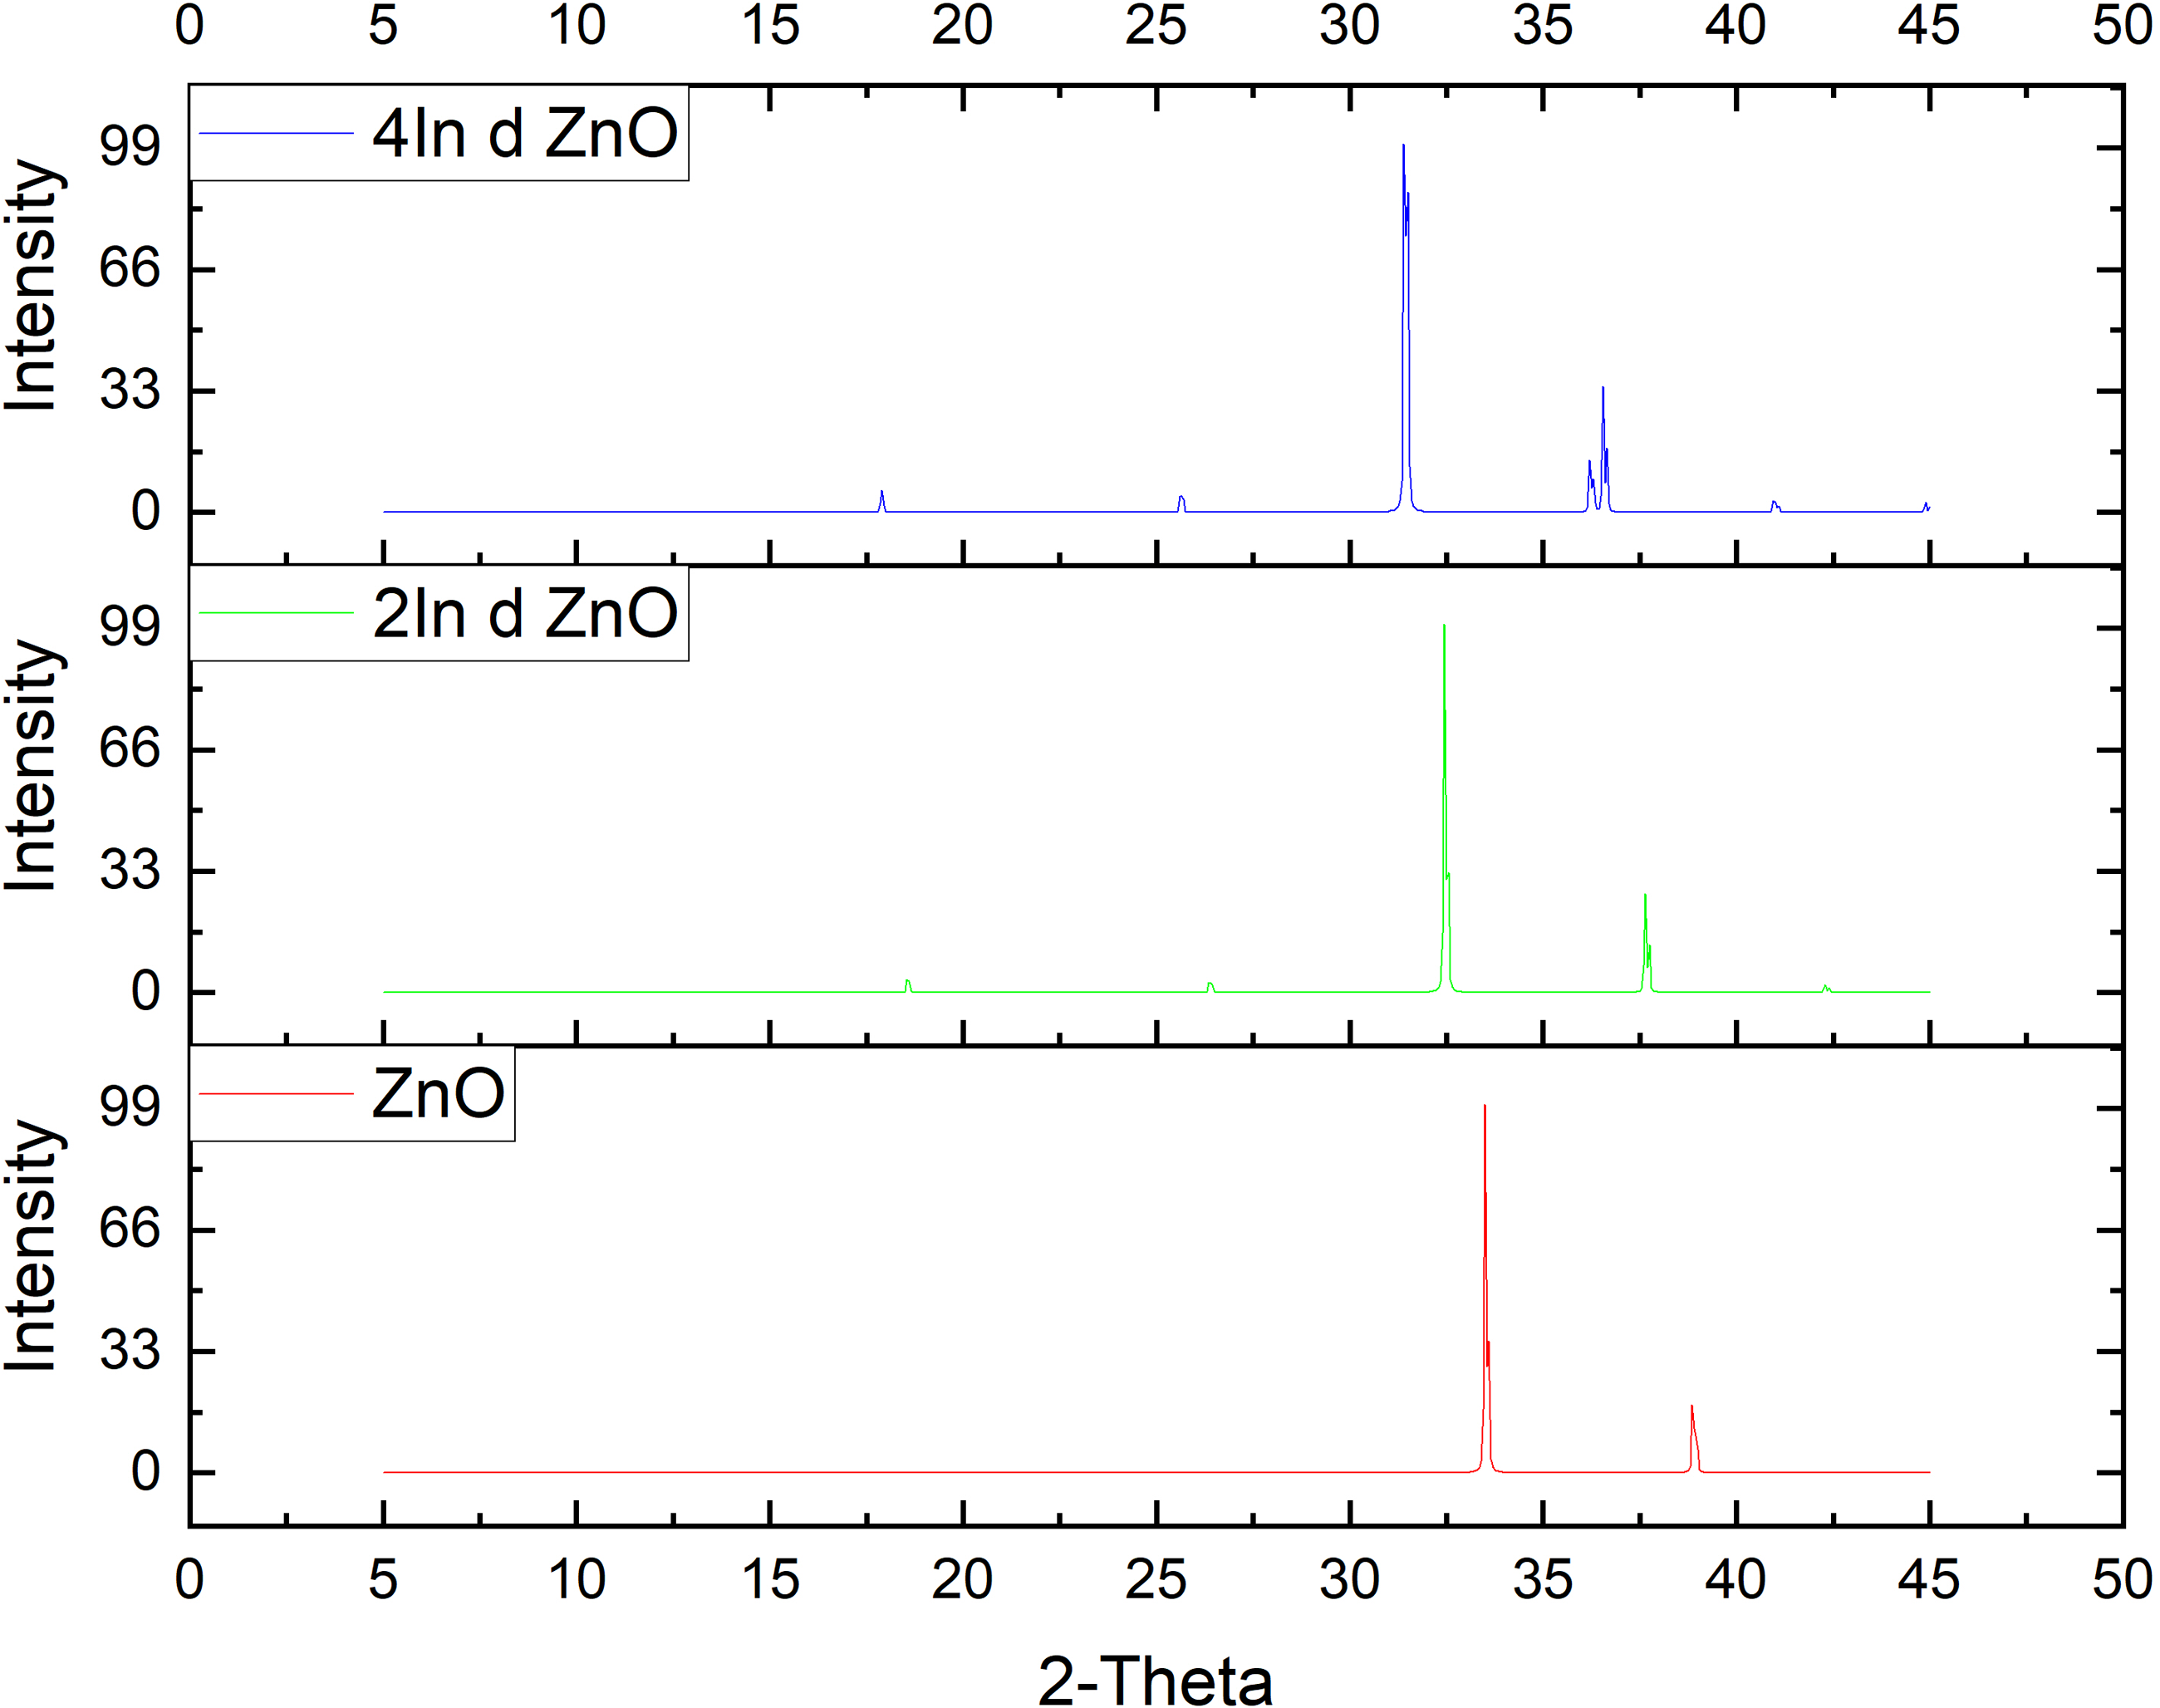
XRD Spectra of pure ZnO & In doped ZnO cases.
Thermal stability
Ab initio molecular dynamics simulations were performed in the canonical (NVT) ensemble at a target temperature of 900 K to assess thermal robustness. Figure 11 (a–d) presents the instantaneous temperature traces for the 2Y, 4Y, 2In, and 4In configurations, respectively. All trajectories display stable canonical fluctuations about the target temperature. For the Y-doped systems, the instantaneous temperature remains bounded within a 700–1200 K envelope without secular drift, indicating the absence of thermal runaway at elevated temperature; under identical thermostatted conditions, the In-doped systems exhibit essentially indistinguishable profiles, implying that indium substitution does not compromise thermal integrity. Across all doped configurations, no signatures of catastrophic structural change or irreversible disordering were observed over the simulated timescale, and the supercells retained their crystallographic registry. These results support the conclusion that both Y- and In-doped ZnO maintain structural stability at 900 K within the present simulation conditions, reinforcing their suitability for applications that demand elevated-temperature operation.12,13,17

Thermal Stability of doped ZnO cases.
Conclusion
First principles calculations link dopant type and loading (Y, In) to changes in ZnO’s mechanical stability, electronic structure, and optical response.
Elastic stability is retained for undoped and moderately doped systems; the highest Y loading becomes elastically unstable under the present modeling conditions.
Simulated XRD preserves the wurtzite phase for all samples; peak broadening and
Electronic behavior suggests moderate Y closes the band gap (metal like), while higher Y yields a narrow gap state with high DOS near the Fermi level; In doped configurations are metallic across the examined loadings.
Y doped samples exhibit a red shifted optical response with enhanced low energy absorption, increased low energy reflectivity, and higher refractive index and dielectric function.
In doped samples display stronger free carrier (plasmonic) signatures, with higher low energy reflectivity, dielectric behavior consistent with metallic screening, and flatter absorption and frequency dependent conductivity than the narrow gap Y case.
Complementary tuning as Y promotes intrinsic optoelectronic gains (absorption, conductivity, dielectric response) but requires attention to stability at high loading; In favors metallic/reflective performance.
Practically moderate Y offers a balanced stability–performance trade off; higher Y is attractive if stability can be engineered; In doped ZnO is suited to roles needing high reflectance/metallic transport (e.g., electrodes, plasmonic/photonic interfaces).
Ab initio molecular dynamics (NVT, 900 K) confirm that both Y- and In-doped ZnO preserve crystallographic order without thermal runaway or irreversible disordering, indicating robust thermal stability suitable for elevated-temperature operation.
Methodological add-on, while absolute values depend on computational choices, the trends with dopant identity and concentration are robust and provide guidance for experimental optimization.
Footnotes
Acknowledgments
This research was conducted with the support of the University of Edinburgh, the CASTEP Developers’ Group (CDG), Cambridge Enterprise, and the Higher Education Commission of Pakistan.
Author contribution(s)
Funding
The author(s) received no financial support for the research, authorship, and/or publication of this article.
Declaration of conflicting interest
The author(s) declared no potential conflicts of interest with respect to the research, authorship, and/or publication of this article.
Data Availability
Data will be made available on request.