
Abstract
High silicon (∼6.5 wt%) non-oriented electrical steel sheets were produced by hot dipping cold rolled 3.5 wt% Si steel sheets into a hypoeutectic Al-8 wt% Si melt followed by diffusion annealing. The microstructure and element diffusion of the processed sheets were characterized and simulated. It is demonstrated that the Al and Si contents across the sheet thickness are largely increased, and the elements are fairly uniformly distributed, which significantly reduced the core loss of the steel sheets, i.e., close to that of the 6.5 wt% silicon steel manufactured by chemical vapor deposition. This manufacturing route features low capital investment and easy process control and has great potential to become a viable technique to produce high silicon electrical steels.
Keywords
Introduction
Non-oriented electrical steels (NOES) are widely used in electrical machines, power generators, automobiles, etc., to enhance the magnetic flux during energy conversion.1–3 They are characterized by relatively low coercivity, high magnetic permeability and relatively high saturation magnetization.4,5 NOES with lower than about 3.5 wt% Si are the common products produced by steel companies, although NOES with higher silicon contents show lower core losses,6,7 especially at high frequencies. NOES with 6.5 wt% Si exhibit the highest maximum permeability, near-zero magnetostriction, and very low core losses, and are particularly suitable for high-frequency applications such as traction motors in electric vehicles.5,7 However, when the Si content is over ∼5.0 wt%, the ductility of the steel drops to nearly zero 8 due to the formation of the ordered B2 (FeSi/Al) and DO3 (Fe3Si/Al) phases,1,9 which makes it nearly impossible to cold roll the steel.10–13 Hence, commercial production of 6.5 wt% Si electrical steels using conventional routes has not been realized, although numerous studies in laboratories have been reported in the literature.6,8,14–17
Various unconventional methods have been developed to produce 6.5 wt% Si steel, e.g., rapid quenching, 18 directional solidification,5,19,20 spray forming, 21 melt spinning,22,23 strip casting,7,24 unconventional alloying,7,8,21,25 etc., which, however, 26 have not been accomplished in mass production. Chemical vapor deposition (CVD) is a technique that has been developed and adopted by the industry27,28 to commercially produce 6.5 wt% Si steel from cold rolled, thin 3.0 wt% Si steel sheets, which involves a chemical reaction, SiCl4 + 5Fe → Fe3Si + 2FeCl2, and requires special equipment and precise process control. In addition, it poses environmental hazards due to the use of harmful chemicals like SiCl4. 29
Hot dipping is a common process used in the steel industry to produce galvanized or other coated steel sheets for corrosion resistance. In this process, high-melting-point steel sheets are dipped into low-melting-point molten alloys (e.g., Zn, Al, etc.) to form a coating layer on the surfaces of the steel sheets, which acts as a protective layer for the steel substrate. Similar processes have been used to dip silicon steel sheets into Al-Si alloys to produce high Si/Al steel.10–13,26,30–32 Danzo et al.10,26,31 used a hypoeutectic Al-1.0 wt% Si alloy bath to perform hot dipping followed by diffusion annealing at high temperatures and studied the formation of various Fe-Al-Si intermetallic phases. Due to the low Si content in the melt, the overall silicon in the substrate after diffusion annealing is not high (<4.5 wt%). 26 On the other hand, the effect of Si and Al concentrations on the core loss of the developed material was not reported. Ros-Yãnez et al.30,32 performed hot-dipping of an Fe-3.3 wt% Si substrate in a hypereutectic Al-27 wt% Si melt followed by high temperature annealing for different times. However, the reported core losses (measured up to 1.4 T at 50 Hz) were still relatively high (2.11 W/kg) as compared to those of the 6.5 wt% Si steel manufactured by CVD. It has been shown that using high Si hypereutectic Al-Si melt for dipping leads to the formation of the DO3 type intermetallic phases in the coating layer and forms voids along the coating/substrate interface which drastically impact the magnetic properties. 33 In addition, using a higher Si melt for dipping also requires a very high annealing temperature (around 1200 °C) to diffuse the Si into the steel substrate, causing high energy consumption.
The current work is based on the same concept of these previous studies, but uses an Al-Si alloy melt containing a moderate amount of Si (8 wt%) that is close to the eutectic point (12.6 wt% Si) of the Al-Si system, which not only reduces the dipping and annealing temperatures, but also avoids issues associated with the very high (27 wt%) or very low Si (1 wt%) Al-Si alloys mentioned above. The intermetallic phases formed in the coating layer, the distribution of elements in the substrate and the magnetic properties of the hot-dipped and diffusion-annealed steel sheets were characterized. It is shown that the use of hypoeutectic Al-8 wt% Si melt can produce electrical steel sheets with Si close to 6.5 wt%. With high enough annealing temperature (1000°C) and long enough diffusion time (8 h), a core loss of ∼0.62 W/kg at 50 Hz and 1.0 T is achieved, which is close to that (0.58 W/kg) of the 6.5 wt% Si steel manufactured by CVD. The results illustrate that the hot-dipping and diffusion-annealing route has great potential to become a viable technique to cost-effectively produce high silicon electrical steels.
Experimental
The substrate material used in the present study was a 3.5 wt% Si NOES. The chemical composition (wt%) of the steel was: 0.002 C, 3.5 Si, 0.5 Mn, 0.5 Al, 0.0019 S, 0.0029 N. The steel was melted in a vacuum induction furnace and cast into ingots of 200 mm × 200 mm. The ingot was then homogenized at 1200 °C for 2 h and roughed to 25 mm in a 2-high reversing rolling mill between 1050 and 900 °C. The roughed plates were reheated to 1040 °C and held for 1.5 h, and then rolled to a final thickness of 3.1 mm. The hot-rolled plates were subject to annealing at 750 °C for 1 h followed by grit blasting to remove the scales. The plates were then cold rolled to a final thickness of 0.5 mm. The cold-rolled sheets were cut into strips (substrates) of 200 mm (rolling direction) × 30 mm (transverse direction) for hot dipping.
Prior to hot dipping, the substrates were prepared by grit blasting to remove grease or oxides on the surfaces. The substrates were subsequently soaked in a 5% soap solution to remove any residual grease and rinsed in ethanol followed by air drying. The prepared substrates were then dipped in an Al-Si alloy melt with 8 wt% Si maintained at 740 °C for 30 s using a setup shown in Figure 1 followed by air cooling to room temperature. The hot-dipped samples were then subject to diffusion annealing in a tube furnace at 800, 900, and 1000 °C for 0.5, 1, 2, and 8 h in argon atmosphere. The samples were inserted into the pre-heated furnace and held for the designated times at the designated temperatures. They were subsequently cooled in the furnace to 200 °C before being taken out. Examples of the samples before and after hot dipping are shown in Figure 2.

Hot dipping setup used in the present study along with the schematic diagram showing different components.

Pictures of the substrates: a) before dipping, b) after dipping in an Al-8 wt% Si melt at 740 °C for 30 s.
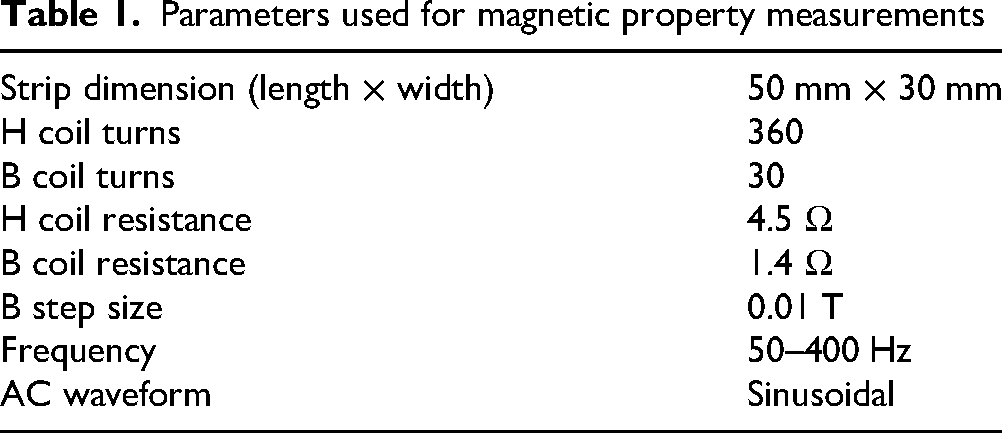
The hot-dipped and annealed samples were cut on the rolling direction (RD)-normal direction (ND) plane for microstructure characterization and composition analysis. The samples were ground using various grits of silicon-carbide paper and polished using diamond pastes and colloidal silica suspension. SEM-BSE (scanning electron microscopy-backscattered electron) imaging was performed to distinguish (elemental contrast) the intermetallics formed during the hot dipping process. The elemental distribution across the thickness of the samples and the intermetallic phases formed during diffusion annealing were analyzed using energy dispersive spectroscopy (EDS). Magnetic properties of the diffusion-annealed samples were measured using a single sheet tester, which takes small samples of 50 mm (length) × 30 mm (width) for the measurements. AC core losses at 1.0 T and 1.5 T were measured at 50, 60, 100, 200, and 400 Hz, and the testing parameters used are listed in Table 1. Samples processed at different annealing conditions were measured and the results were compared to those of the 6.5 wt% Si steel sheets produced using the CVD method. 34
Parameters used for magnetic property measurements
Results and discussion
Microstructure of the dipped strips
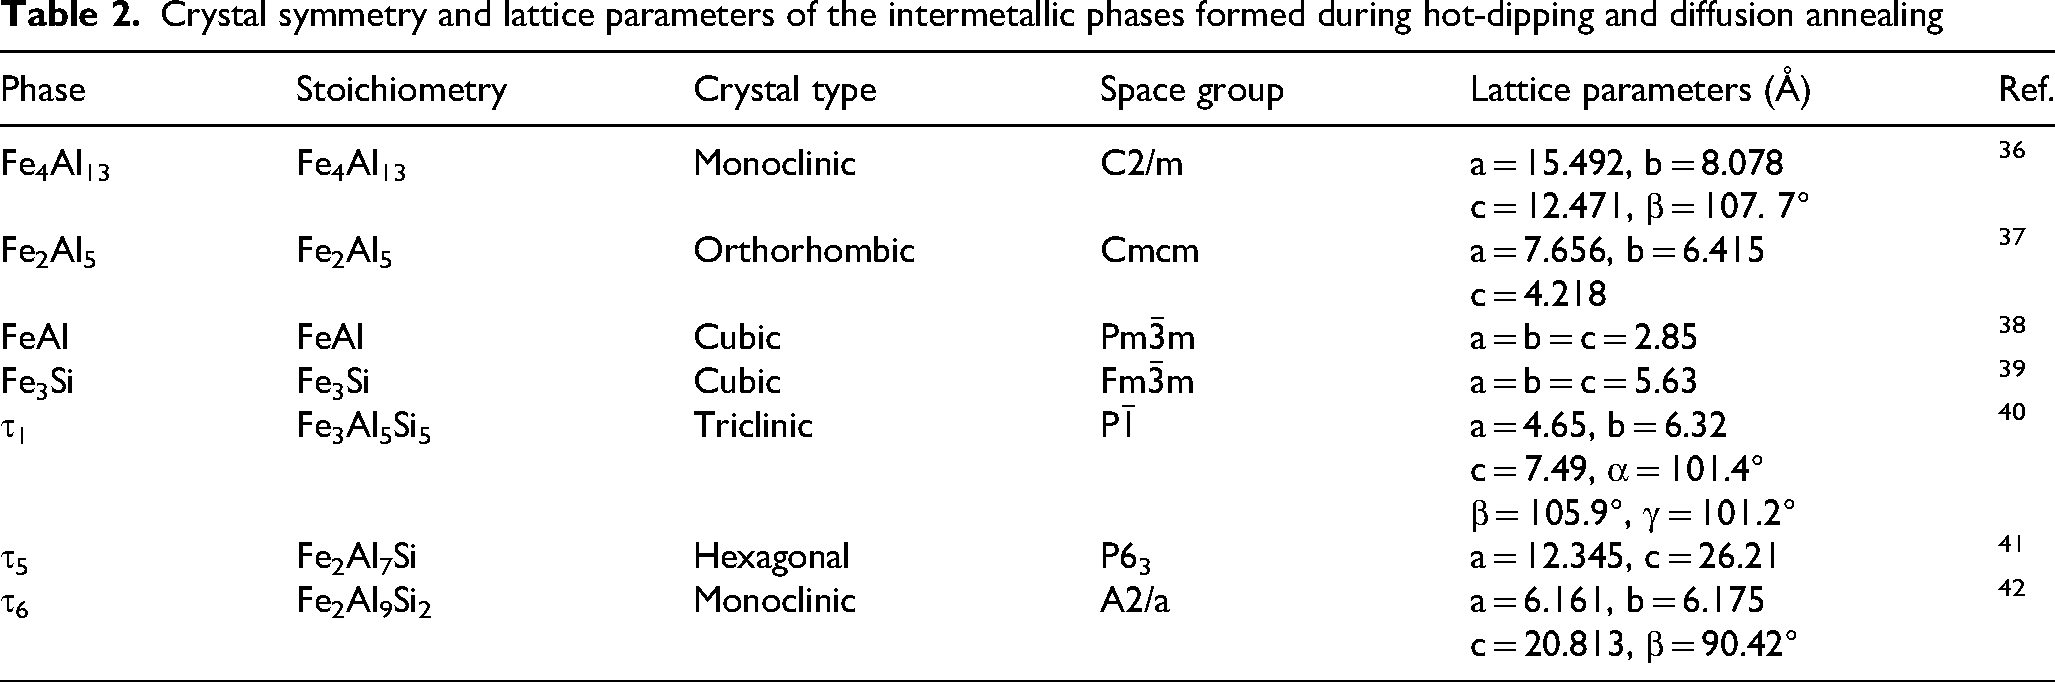
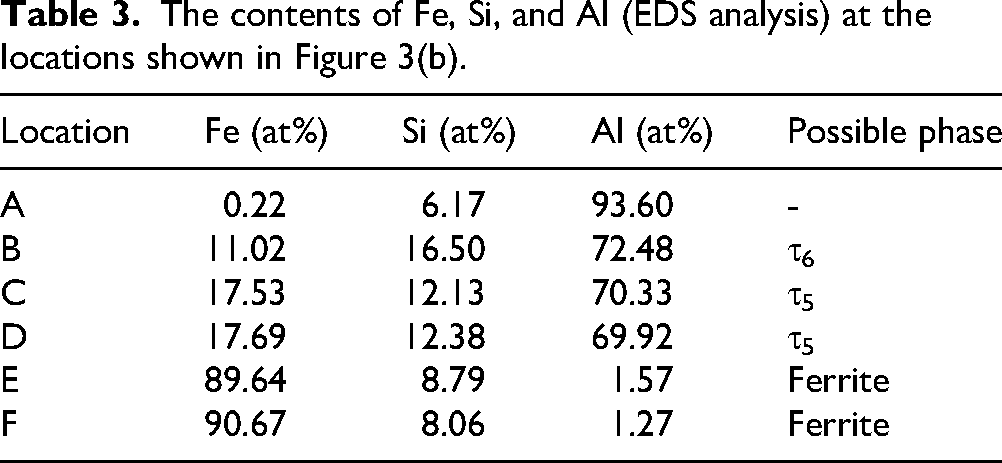
The typical cross-section microstructure of the hot-dipped strip is illustrated in Figure 3. There is an interdiffusion layer near the coating-substrate interface where the reaction between the electrical steel sheet and the Al-Si alloy takes place. As a result, needle (τ6) and massive (τ5) type intermetallic phases are formed in this region. 35 For reference, Table 2 lists the crystal symmetry and lattice parameters of the various intermetallic phases observed in this work. The presence of the τ6-Fe2Al9Si2 (Location B in Figure 3(b)) and τ5-Fe2Al7Si phases (Locations C and D in Figure 3(b)) is confirmed from the EDS measurements, and the compositions of the material at various locations shown in Figure 3(b) are listed in Table 3.
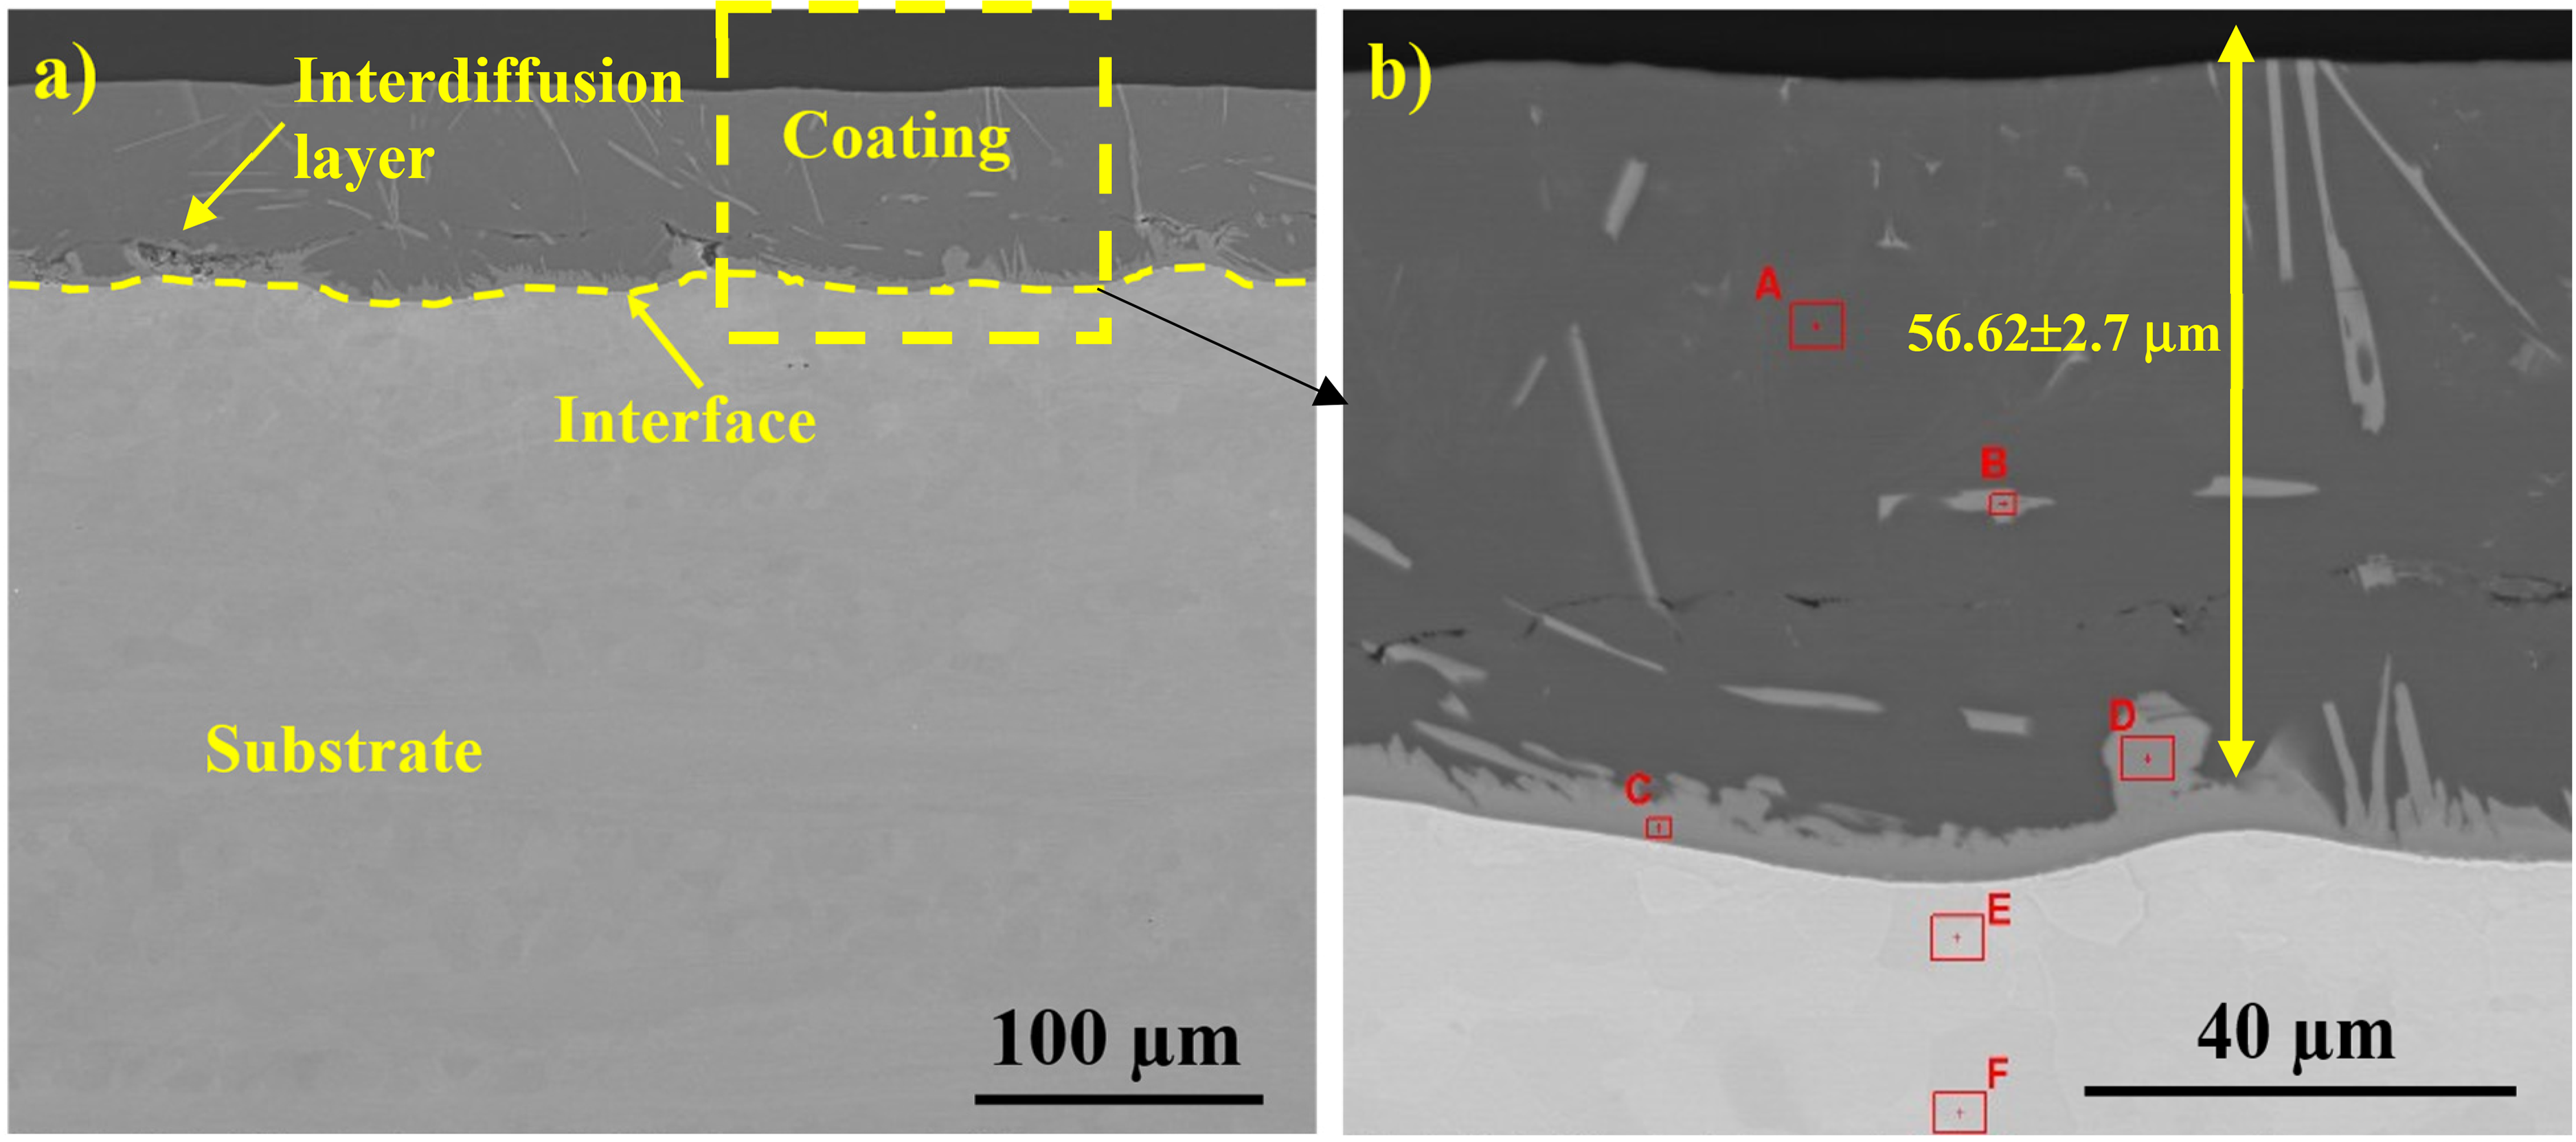
Microstructure of the 3.5 wt% Si steel hot dipped at 740 °C for 30 s: a) cross-section SEM image showing the coating, the interface, and the substrate, b) high magnification BSE image of the dashed region in (a) showing the locations (A-F) for the EDS measurements.
Crystal symmetry and lattice parameters of the intermetallic phases formed during hot-dipping and diffusion annealing
The contents of Fe, Si, and Al (EDS analysis) at the locations shown in Figure 3(b).
The formation of the specific intermetallic phases mainly depends on the chemical composition of the Al-Si melt and the composition of the substrate material. 10 As reported in previous studies,10,26 the intermetallic phases formed during hot dipping are mostly iron aluminides if the melt contains low Si. With the increase of the Si content in the molten alloy, Fe-Al-Si intermetallic phases can also form due to the incorporation of Si in the iron aluminides, which occurs through the replacement of some Al atoms by Si atoms.
Wang et al. 35 reported the formation of Fe4Al13, Fe2Al9Si2 (τ6), and Fe2Al7Si (τ5) phases when dipping a mild steel in an Al-7.5 wt% Si melt. These intermetallic phases are also formed in this study. Due to the very high solubility of Al in the iron lattice (32.6 at%), an Al rich ferrite is also formed near the interface. Location E (5.20 µm from the interface, Figure 3(b)) shows slightly higher Al and Si contents than Location F (19.60 µm from the interface), but the Al and Si contents of both locations are about 2 times higher than the original Al and Si contents of the substrate, indicating apparent diffusion of these elements into the substrate during hot dipping. The coating layer thickness after hot dipping is 56.62 ± 2.70 µm, which is about 1/9 of the substrate thickness.
Microstructure of the diffusion-annealed strips
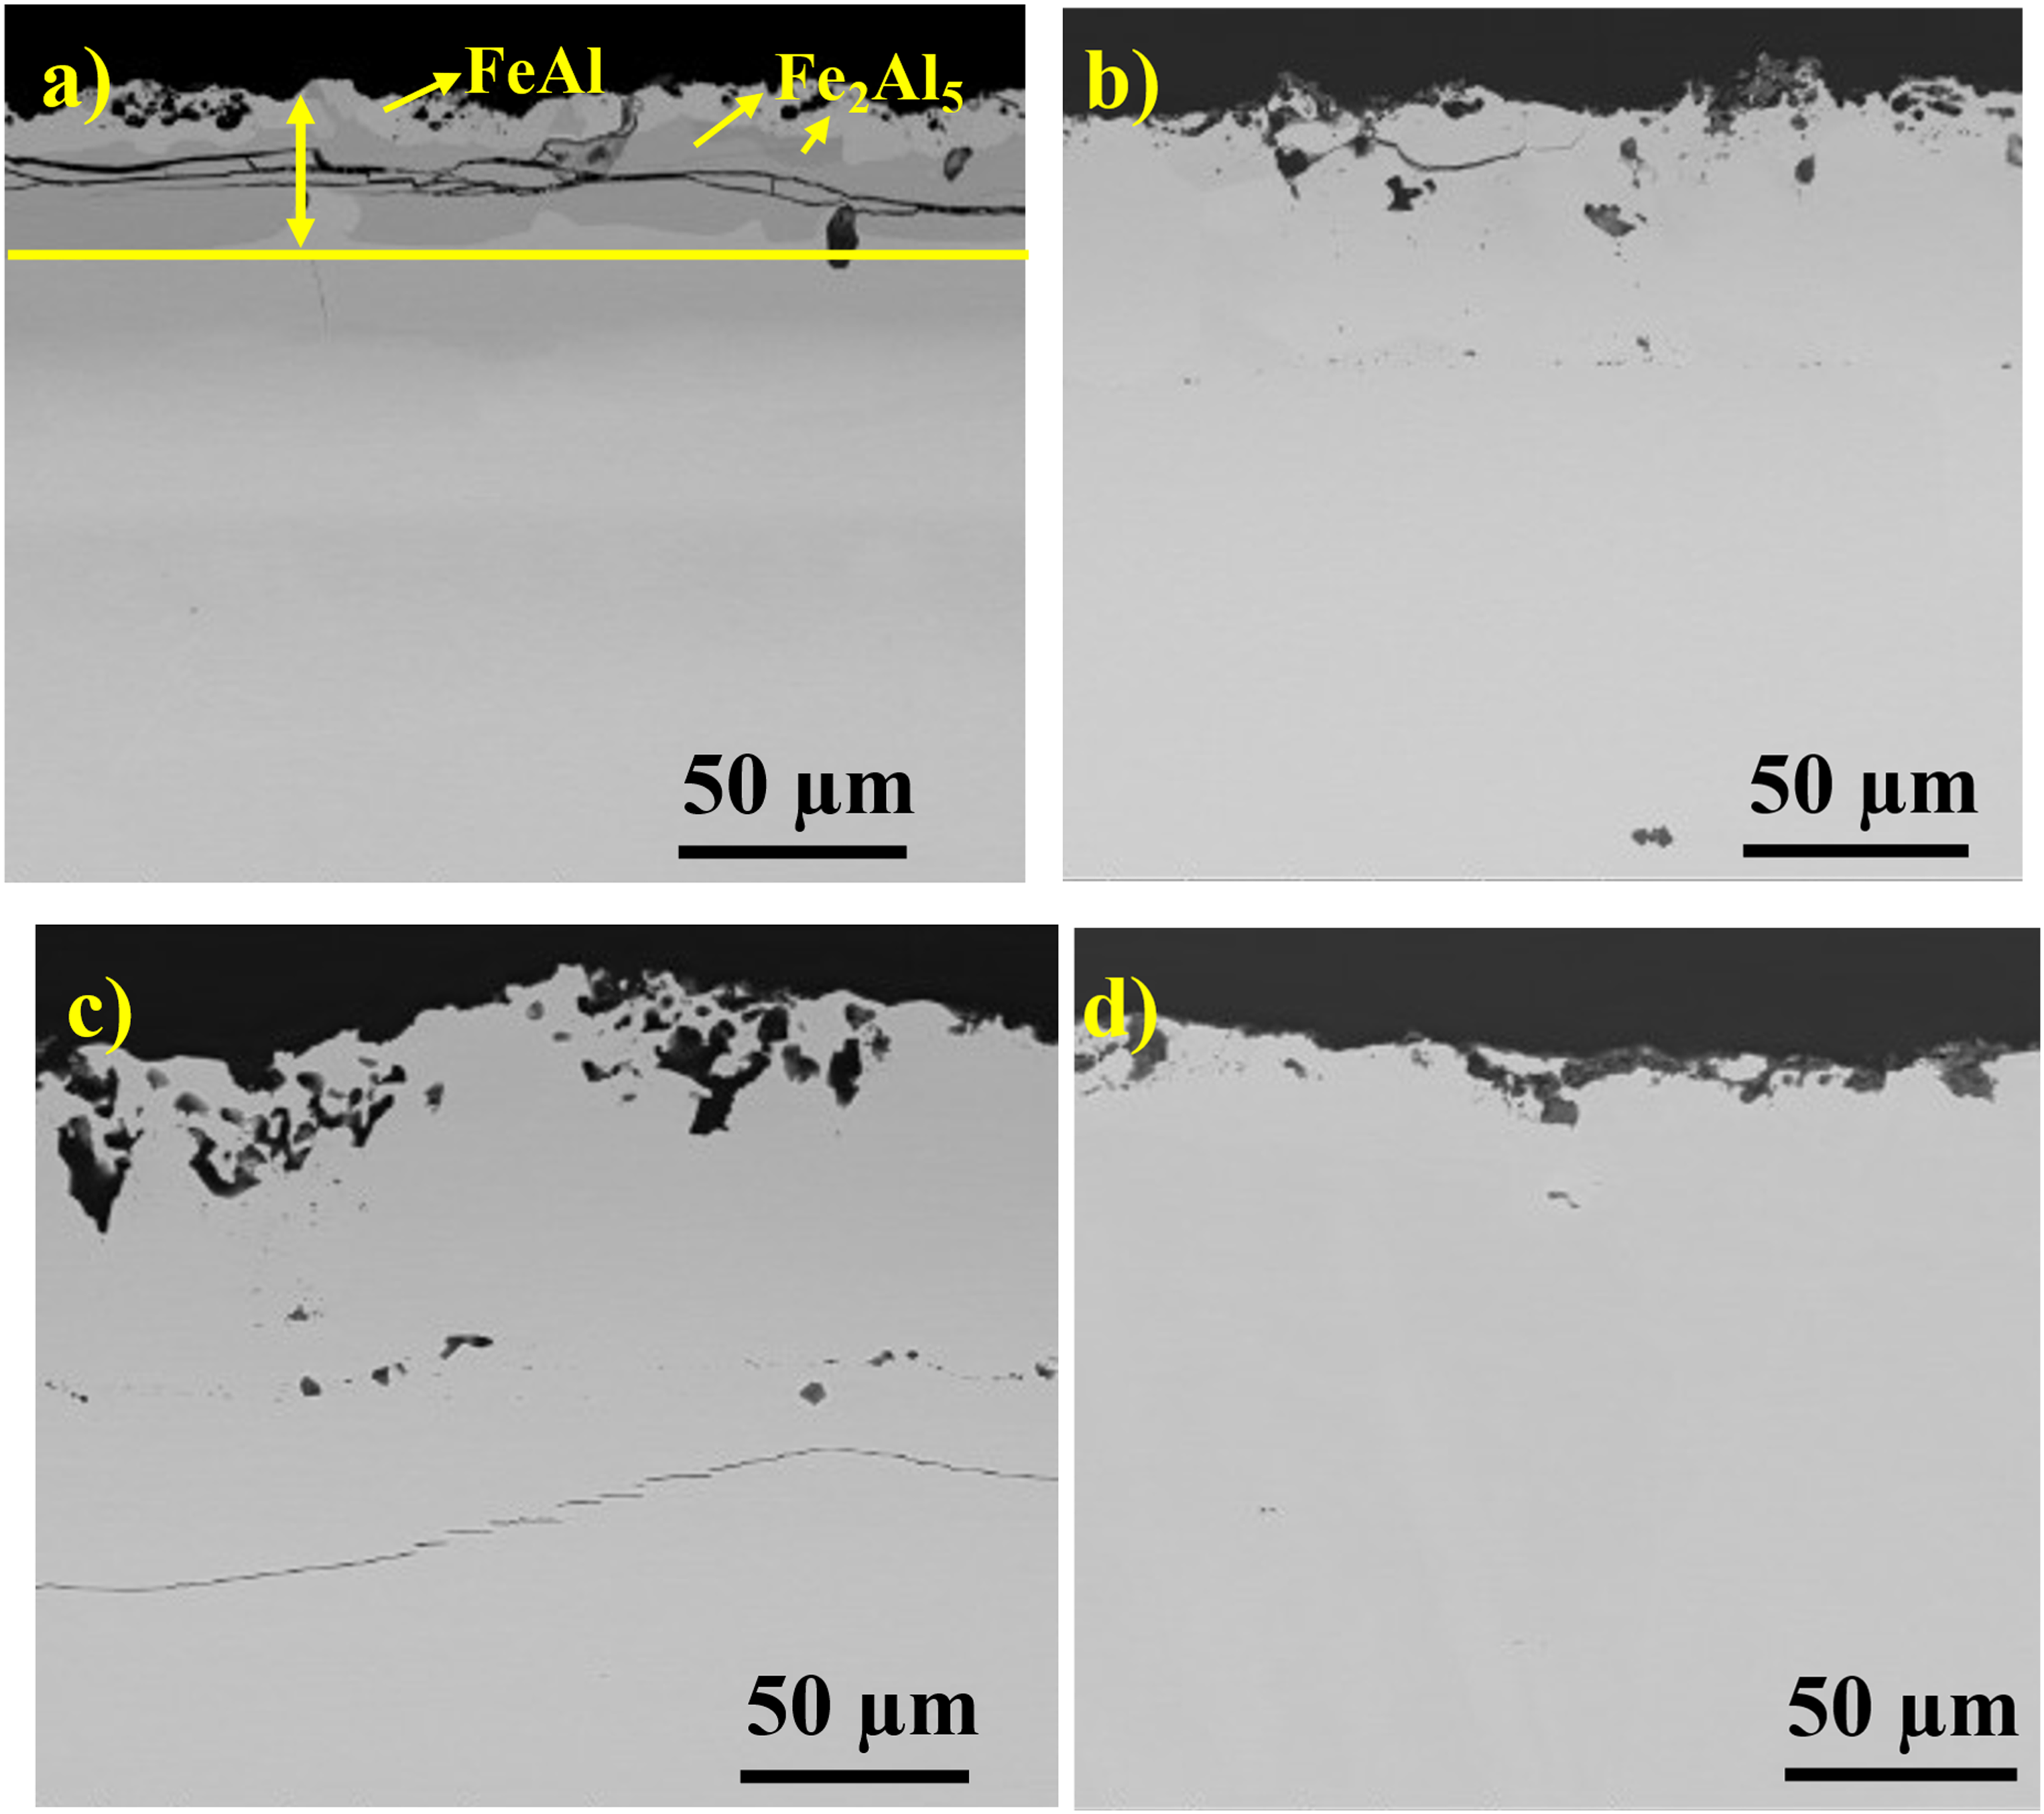
The microstructures of the samples after diffusion annealing at 800 °C for different times are shown in Figure 4. When the annealing time is short (0.5, 1, and 2 h), there is a clear interface between the coating layer and the substrate, and the formation of intermetallic phases (as confirmed by EDS analysis), e.g., Fe4Al13, Fe2Al5, Fe3Si, FeAl, and τ1, is clearly seen. The Fe4Al13 phase forms at the outer edge of the coating layer, the Fe2Al5 phase is the bulk of the coating layer (matrix), and the τ1 phase is present within the matrix as a separate layer between the coating/substrate interface and the outer edge. When the annealing time is increased to 8 h, the coating layer is completely dissolved, and no compositional variation is noticed across the thickness. Nevertheless, some small, disconnected Fe2Al5 particles can still be detected at the outer edge.

SEM images of the hot-dipped sample after diffusion annealing at 800 °C for: a) 0.5 h, b) 1 h, c) 2 h, and d) 8 h. The coating/substrate interface is shown by yellow lines.
It should be noted that the Fe4Al13 phase is only present in the sample after 0.5 h annealing, and it is absent in all the other cases (Figure 4). Wang et al. 35 have shown that this phase forms at the beginning of the phase transformation in the coating, which is then transformed to Fe2Al5 as the annealing continues. The sequence of phase formation as reported in 35 is: liquid→τ6→τ5→Fe4Al13→Fe2Al5→τ1→ferrite. Figure 4 only shows the later part of this chain of transformations, and it is not clear if the Fe2Al5→τ1 transformation has occurred or not since these two phases coexist from 0.5 to 2 h, and the phase remained (only a very small amount at the edge though) after 8 h is Fe2Al5. In addition, a part of the Fe2Al5 phase transforms to FeAl (solid solution of aluminum in α-iron) when the annealing time is 2 h. This is due to the migration of the Al atoms in the coating into the substrate and the reverse migration of the Fe atoms from the substrate to the coating.
The presence of Fe3Si is also detected (near the coating/substrate interface) during annealing at 800 °C from 0.5 to 2 h. This phase has been observed in the sample after hot dipping, and it has also been reported to exist in siliconized steel using the CVD method. 43 However, with the increase of the annealing temperature and time, this phase disappears due to the diffusion of Si into the substrate. The Si content in Fe3Si is 25 at%, and the rest is Fe; thus, the difference in concentration between the Fe3Si layer and the substrate layer facilitates the diffusion of Si into the substrate. Fe3Si is a stoichiometric phase which results in high inter-diffusivity of Si and Fe. Hence the phase disappears early in the diffusion annealing process. 44
Figure 5 shows the microstructure and intermetallic phases of the samples after annealing at 900 °C, as confirmed by EDS analysis. In this case, the coating layer is dominated by the FeAl and Fe2Al5 phases after annealing for 0.5 to 2 h (Figures 5(a), 5(b), and 5(c)), and the τ1, Fe4Al13 and Fe3Si phases are not seen. In contrast to the samples after annealing at 800°C where the matrix is Fe2Al5 and the τ1 (Fe3Al5Si5) phase is distributed between the coating/substrate interface and the outer edge, here the matrix is FeAl and the Fe2Al5 phase appears as layers between the interface and the outer edge or at the outer edge. Again, when the annealing time is increased to 8 h, the intermetallic phases disappear, and a homogenous sheet is formed (Figure 5(d)).

SEM images of the hot-dipped samples after diffusion annealing at 900 °C for: a) 0.5 h, b) 1 h, c) 2 h, and d) 8 h. The coating/substrate interface is shown by yellow lines.
If the annealing temperature is increased to 1000 °C (Figure 6), 1 h is sufficient to dissolve all the intermetallic phases, as shown in Figure 6(b). The Fe2Al5 and FeAl phases are still present after 0.5 h (Figure 6(a)), but to a lesser extent as compared to the samples annealed at lower temperatures (Figure 4(a) and Figure 5(a)). The voids present along the coating/substrate interface in samples annealed at 1000 °C are known as Kirkendall voids, which are observed during high temperature annealing due to the difference in diffusivity of the Fe and Al elements at high temperatures. The voids are created due to the coalescence of vacancies which are generated during the diffusion process. 10 The coalescence of vacancies is linked to diffusion along the c-axis of the Fe2Al5 phase, which has an orthorhombic crystal structure and has more vacancies along its c-axis.
SEM images of the hot-dipped samples after diffusion annealing at 1000 °C for: a) 0.5 h, b) 1 h, c) 2 h, and d) 8 h. The coating/substrate interface is shown by a yellow line.
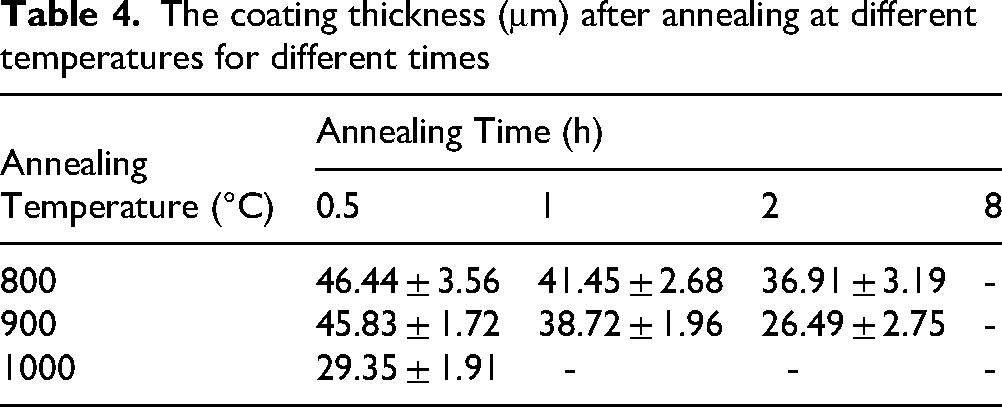
It is thus seen that, to completely dissolve the intermetallic phases formed during hot dipping, diffusion annealing can be performed at a high temperature, which needs shorter annealing times, or at a relatively low temperature, but it requires longer annealing times. The thickness of the coating layer (as determined by the coating/substrate interface in SEM) is an indication of the extent to which the Si and Al diffuse into the substrate: a smaller coating thickness after diffusion annealing means a higher Al + Si content in the substrate. With the increase of the annealing time and temperature, the coating thickness is reduced (Table 4) due to the dissolution of the intermetallic phases into the substrate. For diffusion annealing at 800 °C and 900 °C, the intermetallic phases are completely diffused after 8 h, while for annealing at 1000°C, the intermetallic phases are entirely diffused after only 1 h.
The coating thickness (μm) after annealing at different temperatures for different times
The Fe-Al-Si ternary system
The formation of intermetallic phases in the Fe-Al-Si system is governed by the migration of the Fe, Al, and Si atoms, which is highly dependent on the temperature, composition, and grain boundary characteristics. To better understand the formation of intermetallic phases during the diffusion annealing process, the Fe-Al-Si ternary phase diagrams are calculated using the Thermo-Calc 45 software with the TCAl8 46 database. Three sections at 800, 900, and 1000°C are shown in Figure 7. Superimposed on these figures are the intermetallic phases observed in the experiments. It should be noted that the same phases (e.g., Fe2Al5 and FeAl) may be present at all the annealing temperatures, but their compositions are different (as seen in different locations of the phase diagram). As mentioned earlier, the predominant intermetallic phases at 800 °C are Fe2Al5, Fe4Al13, Fe3Si, FeAl and τ1. For samples annealed at 900 °C, the number of intermetallic phases is reduced, i.e., only Fe2Al5 and FeAl are detected if the annealing time is 0.5–2 h. For annealing at 1000 °C, Fe2Al5 and FeAl are also the intermetallic phases formed, but they are only observed in the sample after 0.5 h annealing.

Sections of the Fe-Al-Si ternary phase diagram at: a) 800 °C, b) 900 °C, and c) 1000 °C. The observed phases are superimposed on the diagrams to illustrate their compositions. Some phases have been observed at different temperatures and times.
Distribution of Al and Si in the strips
To characterize the composition across the thickness of the dipped and annealed samples, EDS line scans are performed up to the half thickness of the sheets and the average values (two measurements) of Al and Si are reported, as shown in Figure 8. In all cases except when the annealing time is 8 h, there is a sharp drop of the Al concentration at the coating-substrate interface (about 50 to 75 μm from the surface). When the annealing temperature is relatively low (800 and 900°C) or the annealing time is short (0.5–2 h), apparent fluctuations in the Al and Si concentration are observed up to the interface. These fluctuations are due to the Fe-Al-Si intermetallic phases which show varying amount of Al in decreasing order as follows: Fe4Al13, Fe2Al5, τ5, and τ6. 35 At these temperatures, if the annealing time is within 0.5–2 h, the concentrations of Al and Si in the substrate are almost the same across the thickness, i.e., ∼0.8 wt% and 4.6 wt% for Al and Si, respectively (see the inset in Figures 8(a) and 8(b)), and they are only moderately higher than the initial concentrations in the steel. When the annealing time is increased to 8 h, the distribution of Al becomes smoother, and no sharp drop or fluctuation is observed. The highest concentration in the coating layer is reduced to about 15–20 wt%, while the lowest concentration in the substrate is increased to 1–2%. The Si content in the substrate is increased to ∼5.5 wt% (800°C) and ∼6.0 wt% (900°C), respectively, although there are apparent variations across the thickness.

Profiles of the Si and Al concentrations after diffusion annealing at: a) 800 °C, b) 900 °C, and c) 1000 °C; d) average Al and Si contents vs annealing time and temperature.
When the annealing temperature is 1000°C (Figure 8(c)), a sudden drop of the Al content is also noticed (except for the sample after 8 h annealing), but it is moved to about 75 μm. Again, for 0.5–1 h annealing, the overall Al content is ∼0.8 wt% (from 120 μm to the center), while the overall Si content is ∼4.6 wt% (from 150 μm to the center), almost the same as those after annealing at 800 and 900°C. After annealing for 2 h, the Al content gradually drops from about 25 wt% at the surface to about 0.8 wt% at the center, while the Si content maintains about 5.8 wt% from the interface (75 μm) until about 150 μm and then gradually decreases to about 4.6 wt% at the center. After annealing for 8 h, the variations of both the Al and Si across the thickness are relatively small. While the Al content decreases from about 10 wt% at the surface to about 4 wt% at the center, the Si content gradually increases from about 4 wt% at the surface to about 6.4 wt% at the center. This distribution of Si across the thickness is opposite to what is expected (as has been seen in CVD processed high silicon steel 47 ), i.e., the center should have lower Si content than the surface due to the higher Si content at the coating layer. This unusual behavior is explained later in the Diffusion Simulation section.
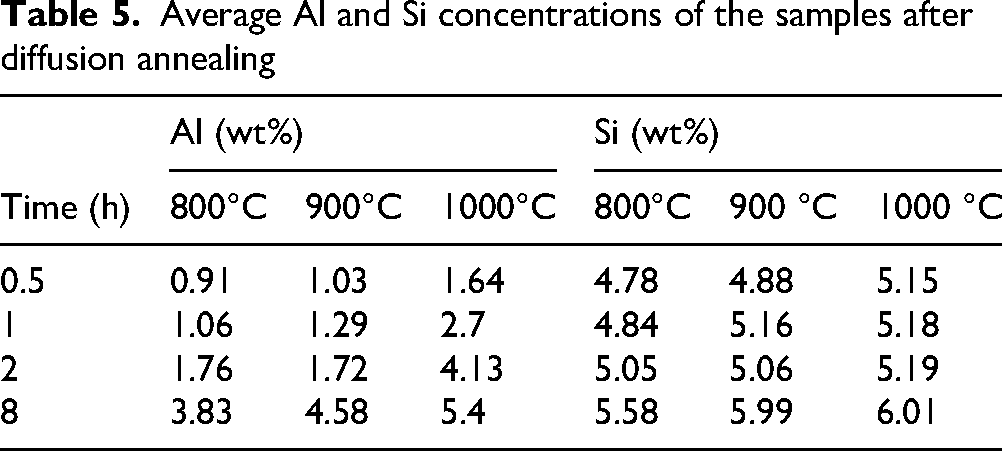
It is thus seen that it is possible to increase the silicon content in the steel sheets through hot dipping and diffusion annealing. With the increase of annealing time and temperature, the average Al and Si contents increase gradually (Figure 8(d)). The increase of the Al content is more significant than the increase of the Si, due to the significantly larger amount of Al in the melt. When the annealing temperature is 1000°C and the annealing time is 8 h, the highest Al content is 10 wt% (surface) while the highest Si concentration reaches 6.4 wt%. The highest average Al and Si contents across the thickness are 5.4 wt% and 6.01 wt% (Table 5), respectively, about 980% and 71% increases as compared to those of the original steel sheets.
Average Al and Si concentrations of the samples after diffusion annealing
Diffusion simulation
To better understand the above-observed element distribution, the process of diffusion annealing was simulated using the DICTRA software45,48 available in the Thermo-Calc package, which can simulate diffusion-controlled transformations in multicomponent alloy systems. DICTRA simulations are performed by solving multicomponent diffusion equations in one dimension utilizing the flux balancing of components across a moving planar interface and considering the gradient in chemical potential as the driving force for diffusion, 49 which remains in a state of local equilibrium. The present problem is like a diffusion couple, where the diffusion is considered to proceed via a vacancy migration mechanism that involves atom jumping to the nearest vacancy site.
The DICTRA simulations in the present study were carried out using the TCFE12 and MOBFE7 databases, where a diffusion couple was set up with a coating layer attached to a substrate layer. The thickness of the coating layer was taken to be 50 µm and the substrate 250 µm, which resembles the system in this study. A linear grid was chosen for the current system with 250 and 50 points for the substrate and coating layer, respectively. A ternary system was chosen for simplicity where the composition of the coating represented the composition of the solidified Al-Si melt (87 wt% Al, 9 wt% Si and 4 wt% Fe) and the substrate composition was 96 wt% Fe, 3.5 wt% Si and 0.5 wt% Al. The presence of Fe (4 wt%) in the Al-Si melt is due to the interfacial reaction between the melt and the steel substrate during dipping. 26 The simulations were carried out at 800, 900 and 1000 °C for 0.5 h and 8 h. The homogenization model available in DICTRA was used to simulate the system. The results obtained along with the EDS measurements for samples subject to the same diffusion annealing conditions are shown in Figure 9.
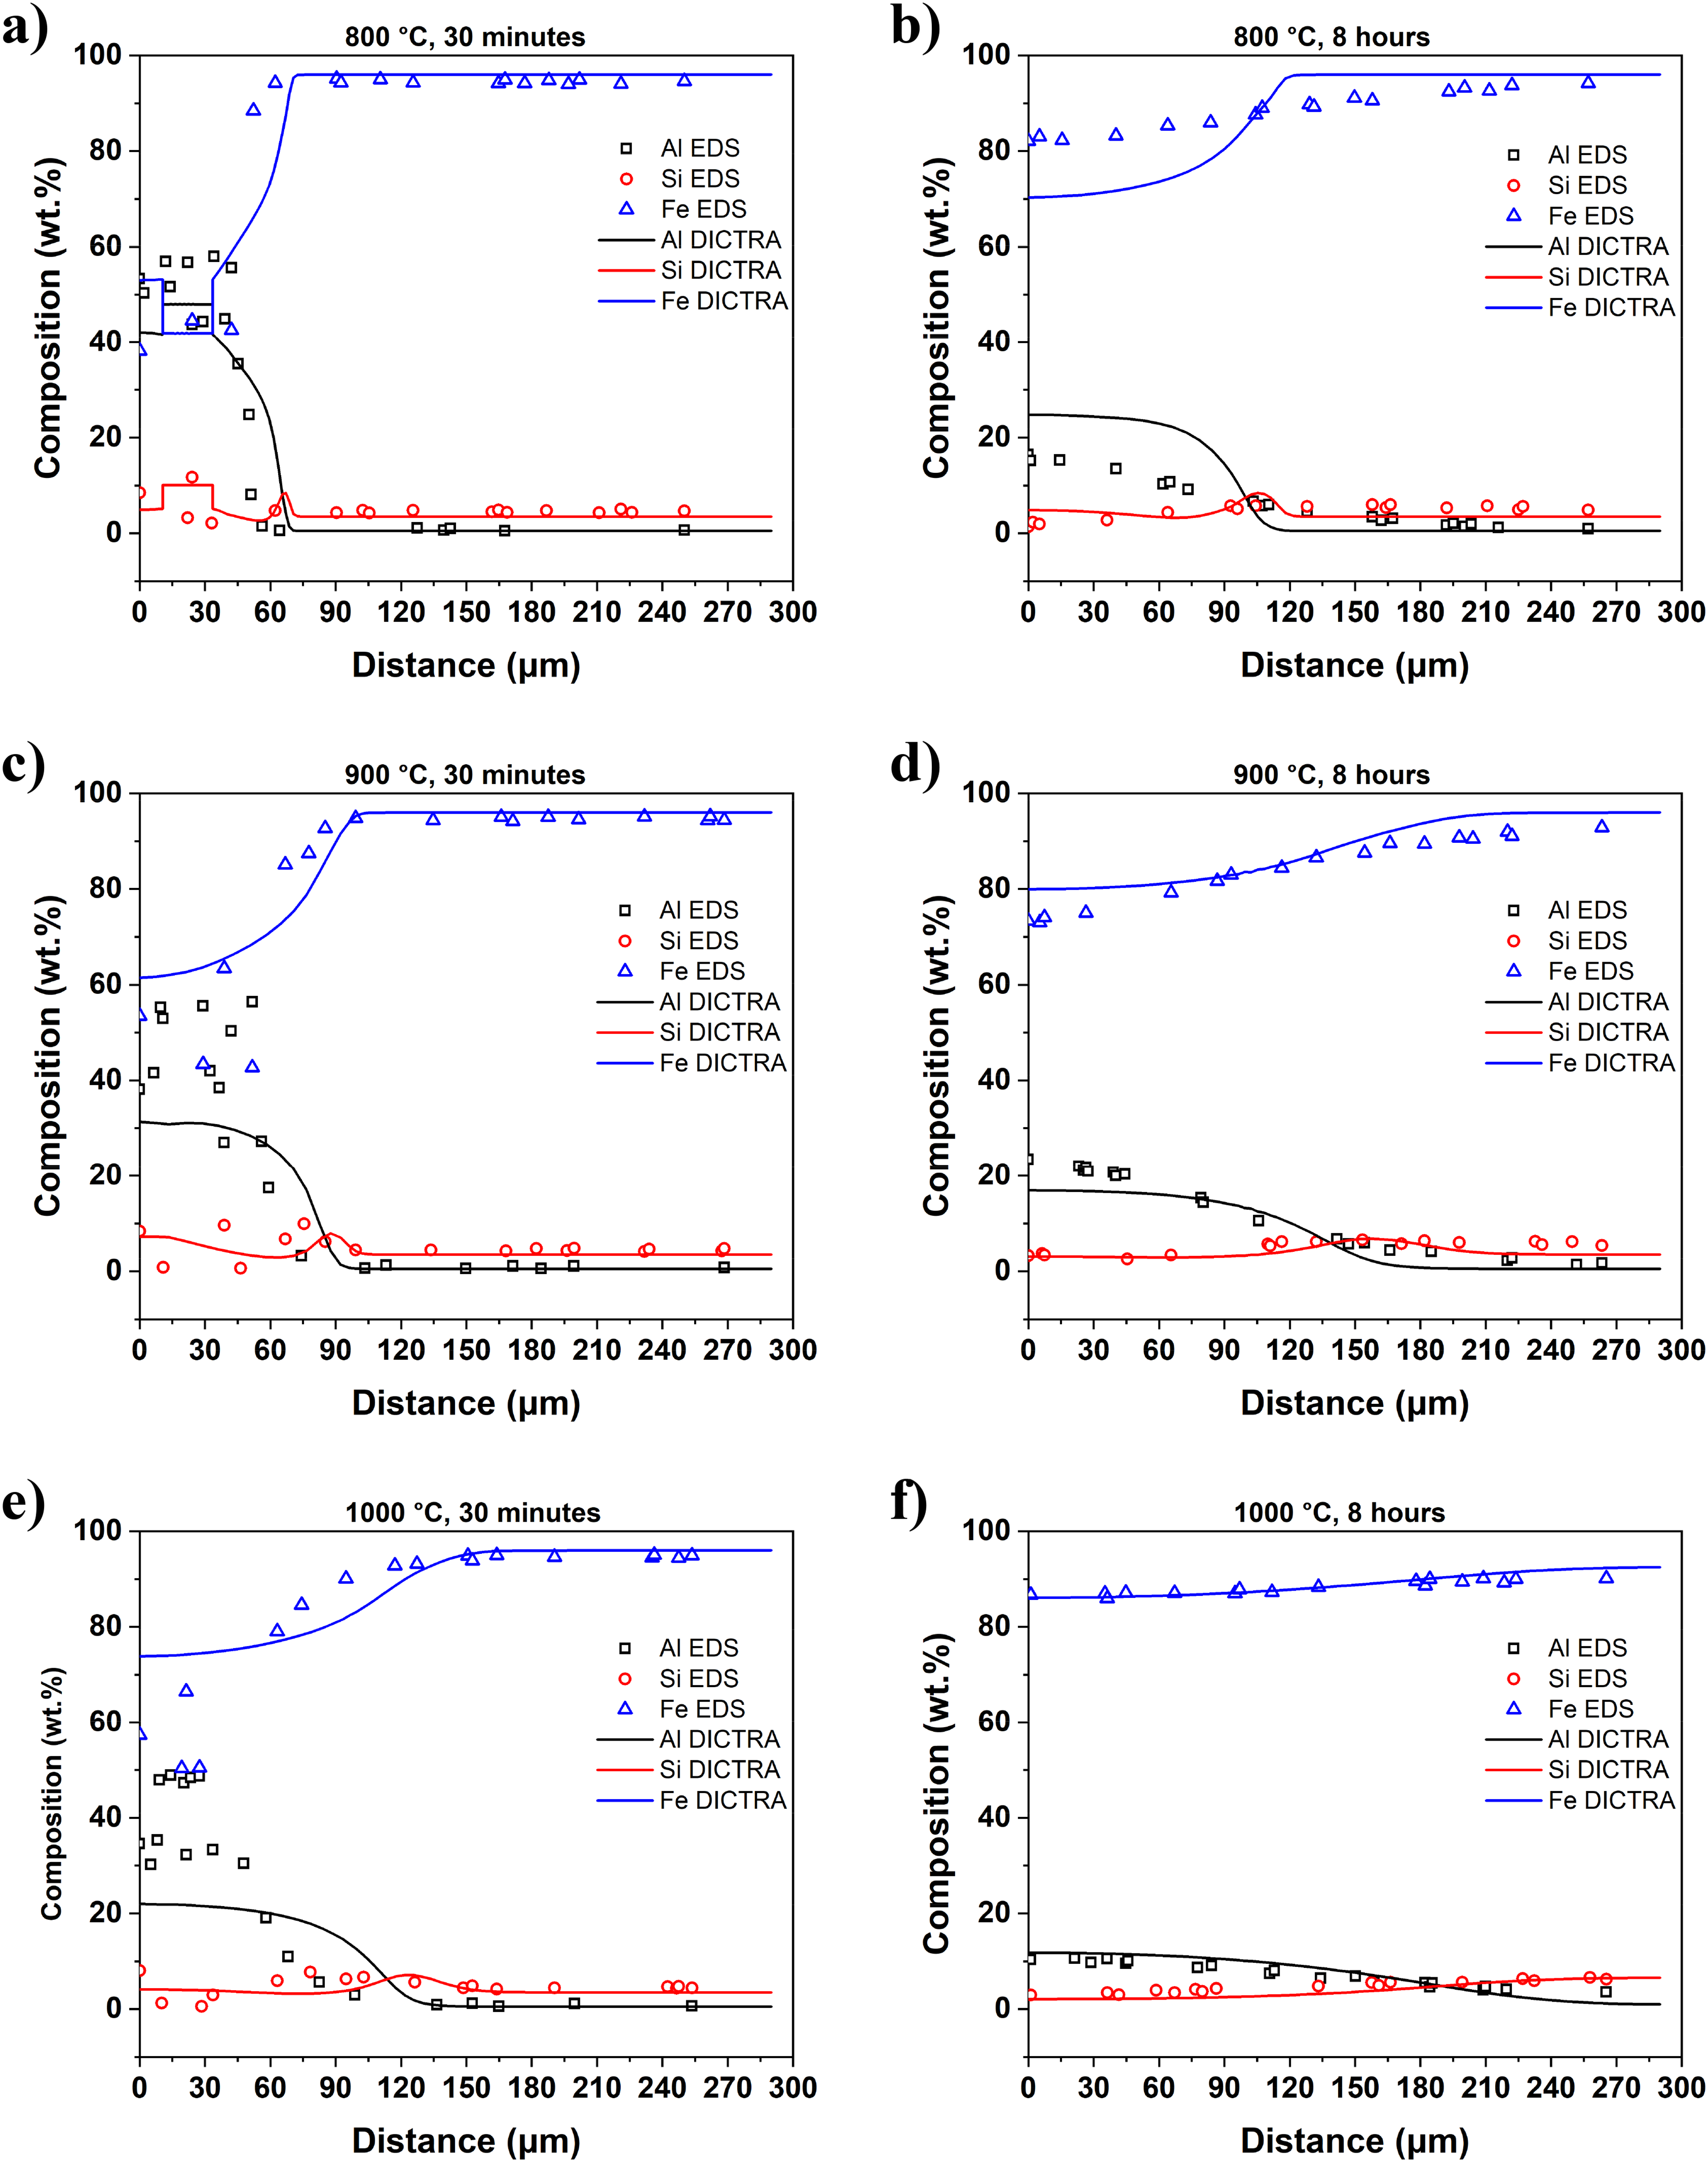
Simulated element distribution profiles as compared to those measured by EDS for samples diffusion annealed at: (a, b) 800 °C, (c, d) 900 °C, and (e, f) 1000 °C. a), c), e) annealed for 0.5 h, and b), d), f) annealed for 8 h. Note the coating layer starts from distance = 0 µm.
Generally, DICTRA simulations can roughly predict the trend of diffusion for most of the conditions, and the simulations are more accurate when the annealing time is 8 h. The diffusion of Si can be more accurately predicted than Al and Fe in all cases. The simulated profiles of Fe, Al, and Si at 900 and 1000 °C for 8 h match quite closely to the EDS measurements, but the simulation results for 800 °C and for 0.5 h deviate largely from the measurements in the coating layer. The large difference between the simulated and measured concentration profiles in the coating layer can be attributed to the Fe-Si-Al intermetallic phases and the interdiffusion layer, which largely affect the diffusion of Fe/Al/Si atoms,50,51 but the DICTRA simulations cannot catch it as the software relies on accurate diffusion data (which is absent) for individual components in a multicomponent system and in different thermodynamically stable phases. In addition, the DICTRA simulation is a very simplistic representation of the system, which does not consider the presence of grain boundaries or dislocations, which also largely affect the diffusion process. 51
It is noted that almost every Si profile in Figure 9 (except Figure 9(f)) shows a clear hump at the coating-substrate interface, and the position of this hump depends on the annealing temperature and time. This may be attributed to the diffusion of the Si atoms in the intermetallic phases (mainly τ5 and τ6) formed in the coating layer (Figure 3). τ5 and τ6 phases have a higher Si concentration (Table 3) than the substrate, which tend to diffuse Si into the substrate. As the annealing time increases, other intermetallic phases with lower Si content than the substrate, e.g., Fe2Al5, Fe4Al13 and FeAl,, 52 may form, which causes the diffusion of the Si from the substrate towards these phases and generates a peak Si near the interface (Figure 9). Xia et al. 53 have attributed the aggregation/hump in the Si concentration (as observed in Figure 9) to the reduced chemical potential of Si in the Fe-Al intermetallic (in the Fe-Al-Si ternary system) as compared to the steel substrate. Hence, the uphill diffusion of Si as observed in the present study (Fe-Al-Si multi-component system) may be attributed to the chemical potential reduction, which is the driving force for the diffusion to continue, unlike in the binary alloy where the diffusion proceeds due to concentration gradient. In other words, the diffusion of Fe, Al, and Si across the coating-substrate takes place in a way to minimize the overall free energy of the system.54,55 The formation of such a peak in the Si concentration has also been observed during the diffusion annealing after cladding of Fe-Al onto steel by Křivská et al. 56 and by Barros et al. 57 during diffusion annealing after hot dipping a 3.0 wt% Si steel substrate in an Al-25 wt% Si melt.
As mentioned before, the sample annealed at 1000 °C for 8 h (Figure 9(f)) shows a higher Si content in the center than in the surface, which is opposite to the distribution observed in the CVD processed 6.5 wt% Si electrical steels (with higher Si concentration at the surface). This is due to the same reason discussed above. The dissolution and formation of intermetallic phases during the annealing process forms a local hump of Si and the location of the hump depends on the annealing temperature and time. The higher the temperature, the closer the hump to the center and the smoother the hump (smaller height). After annealing at 1000°C for 8 h, the hump is located at the mid-thickness of the substrate (300 μm from the surface, Figure 9(f)), which shows a slightly higher Si concentration than its neighboring regions (Figure 9(f) only shows the left side). Due to the flattening of the hump at high temperature, it appears as an almost smooth Si profile if only the left side of the hump is looked (Figure 9(f)). It is expected that, when the annealing time is further increased, the Si content (and the Al and Fe as well) will eventually become uniform across the entire thickness when final equilibrium is reached.
Magnetic properties
The core losses of the hot-dipped and diffusion-annealed samples measured at 50 and 60 Hz (1.0 and 1.5 T) are shown in Figure 10. In most cases, increasing the annealing temperature or time decreases the core loss; when the annealing time is increased to 8 h, the core loss is significantly decreased at all annealing temperatures. However, when the annealing time is 8 h, increasing the annealing temperature from 800°C to 900°C slightly increases the core loss at 1.0 T (Figures 10(a) and 10(c)). Also, when the annealing temperature is 1000°C and the annealing time is 0.5–2 h, the core losses at 1.5 T are quite close to each other, and a longer annealing time may not lead to a lower core loss (Figures 10(b) and 10(d)).

Core losses of hot-dipped and diffusion-annealed samples measured at 50 and 60 hz: 1 T (a, c) and 1.5 T (b, d).
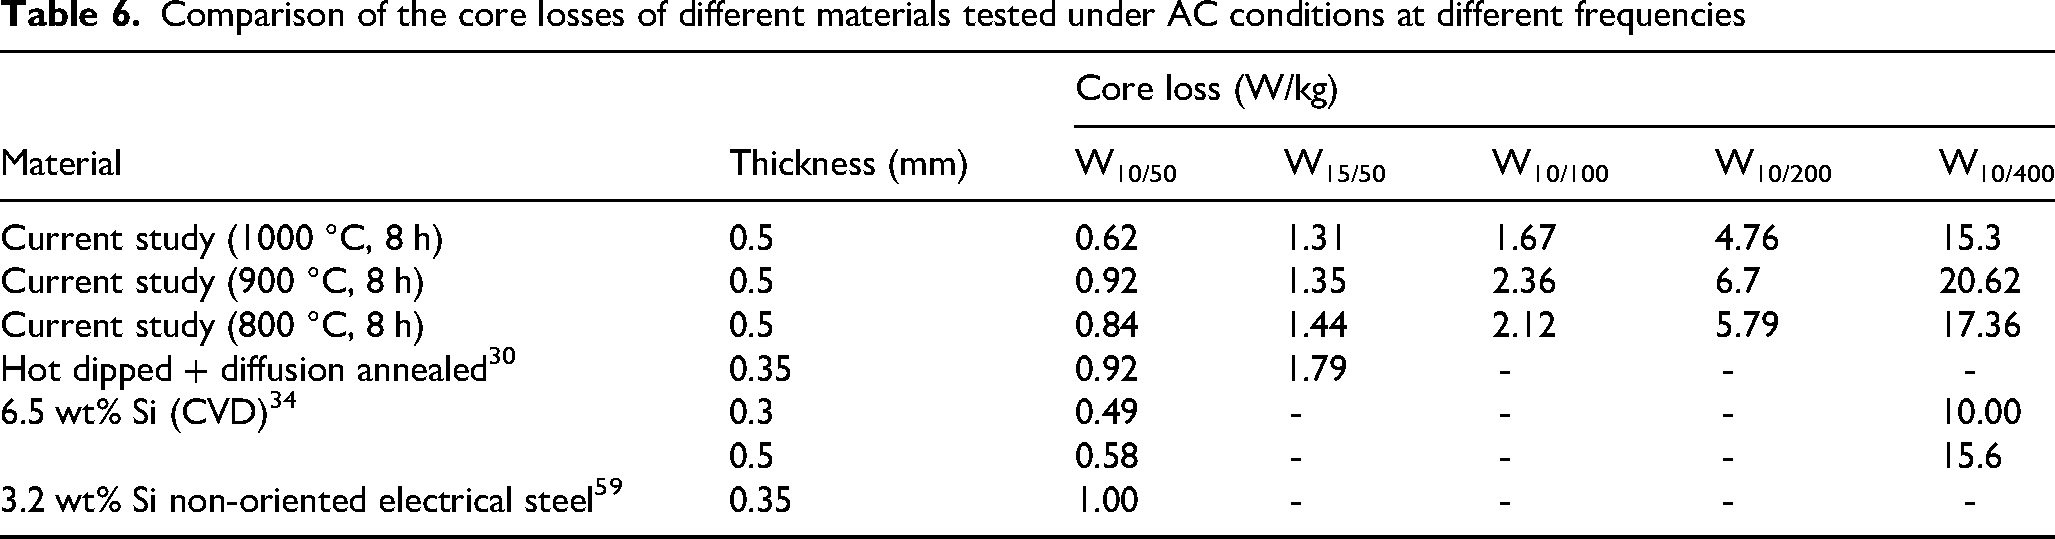
The decrease of the core loss by diffusion annealing is mainly caused by the increase of the Si and Al contents in the steel, which increases the resistivity of the material,21,33,58 hence reducing the eddy current loss. Diffusion annealing releases the residual stress accumulated in the material during cold rolling and also leads to the recrystallization of the microstructure, both significantly reducing the core loss. As has been shown before, when the annealing temperature is relatively low (800 and 900°C) and the annealing time is short (0.5–2 h), the Al and Si contents in the steel are moderately increased to about 0.8 wt% and 4.6 wt% from 0.5 wt% and 3.5 wt%, respectively, which leads to the moderate decrease of core losses. The samples annealed for 8 h show much lower core losses than those annealed for shorter times, due to the largely increased Al and Si contents in the steel (5.4 wt% and 6.01 wt% respectively). As shown in Table 6, the core loss (0.62 W/kg) of the sample after annealing at 1000°C for 8 h (50 Hz/1.0 T) is comparable to that (0.58 W/kg) manufactured using the CVD method (the same thickness of 0.5 mm). 43 It is also noted that this core loss is much lower than that of the commercial 3.2 wt% Si steel (1.0 W/kg) and that (0.92 W/kg) of the steel produced by Ros-Yanez et al. 30 using a similar hot dipping and diffusion annealing process (even with a smaller thickness of 0.35 mm). At 400 Hz/1.0 T, the core loss (15.3 W/kg) of the sample annealed at 1000 °C for 8 h is even lower than that (15.6 W/kg) of the 6.5% Si steel produced by CVD (0.5 mm thickness).
Comparison of the core losses of different materials tested under AC conditions at different frequencies
It is thus seen that hot dipping and diffusion annealing can produce non-oriented electrical steel sheets with very good magnetic properties. Due to its simple processing procedure and low cost, it could become a viable manufacturing technology to produce high silicon electrical steels. However, further studies are still needed to assess the impact of the intermetallic phases formed during the diffusion annealing on the mechanical and magnetic properties of the steel sheets. In addition, the high Al and Si concentration in the sheet is expected to induce brittleness to the steel, which will negatively impact the fabrication of electrical steel cores from the steel sheets, which also needs to be addressed.
Conclusions
Cold rolled 3.5 wt% Si steel sheets are hot dipped in an Al-Si melt and diffusion annealed to increase the silicon content to about 6.5 wt%, which provides a cost-effective route to produce high silicon electrical steels. Using a hypoeutectic Al-Si alloy with moderate Si content (8 wt%) can reduce the hot-dipping temperature, increase the overall Si in the substrate, and lead to optimal magnetic properties. Diffusion annealing at 1000°C for 8 h increases the Si content from 3.5 wt% to an average of 6.0 wt% (maximum 6.4 wt%) and the Al content from 0.5 wt% to an average of 5.4 wt%, which increases the electrical resistivity of the steel and reduces the eddy current loss. The core loss (0.62 W/kg) of the hot-dipped and diffusion-annealed steel sheet at 50 Hz/1.0 T is comparable to that (0.58 W/kg) of the 6.5 wt% Si steel produced by CVD, while the core loss at 400 Hz/1.0 T (15.3 W/kg) is even lower than that (15.6 W/kg) produced by CVD. With appropriate annealing temperature and diffusion time, the various intermetallic phases formed during hot dipping can be relatively uniformly diffused into the substrate and form high silicon electrical steel sheets.
Footnotes
Acknowledgments
Jian Li and Renata Zavadil are gratefully thanked for SEM and EDS characterization. Maciej Podlesny is thanked for assistance in the hot dipping and diffusion annealing experiments. Peter Newcombe, Bruce Ingram, and David Saleh are thanked for casting the 3.5 wt% electrical steel and Michael Attard is acknowledged for rolling the steel.
Author contribution(s)
Funding
The authors disclosed receipt of the following financial support for the research: This work was supported by the Program of Energy Research and Development, Natural Resources Canada [grant number CMAT-23-108]; Natural Sciences and Engineering Research Council of Canada Alliance Program [grant number ALLRP-568545]; Natural Resources Canada's Energy Innovation Program [grant number EIP-OTD-249].
Declaration of conflicting interest
The authors declared no potential conflicts of interest with respect to the research, authorship, and publication of this article.
Data availability
Some experimental data can be made available on request