
Abstract
This study investigates the use of a copper (Cu) interlayer in dissimilar laser welding between AA7075 and Ti6Al4V alloys. The primary purpose of the Cu interlayer is to reduce the formation of brittle intermetallic compounds (IMCs), which can weaken the mechanical integrity of the welded joints. Corrosion performance was examined using potentiodynamic polarization and electrochemical impedance spectroscopy (EIS) tests. The findings reveal that incorporating the Cu interlayer significantly enhances the fusion between the dissimilar alloys, resulting in joints with improved mechanical strength (240 MPa) and corrosion resistance. Corrosion tests showed the joint had intermediate corrosion resistance (corrosion current density iCorr of 1.0297 × 10<συπ>−5</sup> A/cm² and polarization resistance Rp of 3.07 K Ω.cm2) compared to the base material.
Introduction
For vehicle weight reduction, the aerospace and automotive industries are increasingly employing lightweight structural materials, particularly titanium and aluminum alloys, for component fabrication. These materials enhance fuel efficiency along with contributing to environmental sustainability. Furthermore, there is a prominent trend towards integrating the advantageous properties of titanium and aluminum alloys within singular vehicle structures. However, the fusion of titanium alloys with other metals poses significant challenges in conventional welding due to the formation of a strong t-oxide layer on titanium surfaces and its minimal solubility in other metals. Consequently, mechanical fastening techniques such as riveting and bolting are predominantly utilized, as these methods prevent the complexities associated with metallurgical bonding. In response to these challenges, research and development efforts are being directed toward new dissimilar metal welding technologies, leveraging processes such as friction stir welding, explosive welding, laser welding, electron beam welding, and diffusion bonding, to enable the effective joining of these materials.1–5
Joining Al/Ti alloys is challenging due to their differing physical properties and the formation of IMCs that cause cracking upon cooling and solidification.6–8 For successful aluminum-to-titanium bonding, it is essential to minimize the IMC layer at the interface and reduce IMC particles in the fusion zone. 9 While IMCs in the Ti-Al combination offer high-temperature strength, their presence limits deformation possibilities and leads to increased strength but decreased ductility and fracture toughness. 10 Adding an interlayer during Ti/Al dissimilar alloy laser welding is a commonly employed and effective strategy to alter the interfacial metallurgical reactions. Studies have shown that using interlayers can effectively reduce or eliminate the formation of Ti–Al IMCs, thereby enhancing the mechanical performance of the welded joints.
Laser welding is an effective method for joining Al/Ti alloys, offering precision in weld pool size and location due to the narrow focus of the laser beam. This technique allows variations in chemical composition and intermetallic layer thickness. 11 Several studies have addressed laser welding challenges with significant advancements. Kreimeyer et al. 12 found that the thickness of intermetallic layers in welded Ti-6Al-4V and AA6016 T4 alloys slightly varied with heat input. Peyre et al. 13 demonstrated that variation in laser welding-brazing, energy parameters had minimal impact on the strength of welded T40 titanium and AA5754 aluminum alloys, regardless of using Al5Si filler wire. Failures in tensile tests consistently occurred at the aluminum alloy fusion zone's interfacial layer, containing TiAl3. Jiang et al. 14 identified that the interface of laser-welded dissimilar 5083 Al-Mg and Ti-6Al-4V alloys had multiple intermetallic phases, indicating that increased IMC concentration weakened the joint. Chen et al. 15 modified the laser beam's power distribution to enhance the uniformity of the metal at the Ti-Al intermetallic layer, improving the mechanical properties of the dissimilar welds. Previous research on high-speed keyhole Yb: YAG laser welding of Ti-6Al-4V and AA5754 alloys revealed three interface types with varying intermetallic phases, including TiAl, Al3Ti, and Ti3Al, which are influenced by welding parameters. 16 Tomashchuk et al. 17 examined how filler wire composition and edge shapes affect welded-brazed laser joint properties between T40 titanium and AA5754 aluminum alloys. The results showed that tensile strength is influenced by the reaction zone's development at the interface, with 2–25 μm wide interlayers of Ti5Si3, τ2 (Al21Si46Ti33), and Ti(Al, Si)3 IMCs enhancing the strength. Kuryntsev et al. 18 explored CP Ti and AA2024 overlapped laser welds, achieving tensile strengths of 80–120 MPa based on energy input.
The metallurgical reactions at the Ti/Al interface significantly affected the formation and growth rate of the Ti-Al IMC layer. It was suggested that Al3Ti forms through crystallization during the cooling phase of the welding-brazing process. 19 Introducing elements into the Ti/Al interface reaction could alter the formation of Ti-Al IMCs. In the case of Ti/Al joints using Al12Si filler metal, a Ti7Al5Si12 layer was observed to initially develop at the Ti/Al boundary, which is controlled by the dissolution of Ti and the segregation of Si at the interface. This formation subsequently prevented the growth of the Al3Ti layer due to the Ti7Al5Si12 layer acting as a barrier to Ti dissolution, ultimately reducing the brittleness of the Ti/Al joints.20,21
Various studies suggest that using an interlayer is often seen as an efficient method to enhance the strength of dissimilar joints.22,23 The interlayer should exhibit high solid solubility with the base metals. 24 Thus, the ideal interfacial joint is achieved with fully diffusion, resulting in the interfacial compounds being solid solutions. Consequently, introducing an interlayer is anticipated to help prevent the creation of IMCs at the interface. Several interlayers such as silver Ag, 25 Ni, 26 Cu, 27 and Ti 28 have been widely utilized in the joining of dissimilar materials.
The novelty of this study lies primarily in its examination of the interfacial microstructure and electrochemical behavior resulting from Cu addition. Unlike more commonly used alloys such as AA6061 or AA2024, AA7075 presents significant challenges due to its higher Zn and Mg content, which promotes hot cracking and increases susceptibility to brittle intermetallic compound (IMC) formation. The Cu interlayer in our research effectively modifies the interfacial reaction zone by limiting the formation of brittle Ti–Al IMCs, contributing to improved joint strength and microstructural stability. The analysis of the interfacial microstructure in this context offers new insights into how Cu behaves at the Al/Ti interface during rapid solidification in laser welding.
This study presents an innovative method for creating dissimilar welds between AA7075 and Ti6Al4V alloys using a Cu interlayer. It explores the impact of the Cu interlayer on the joint's morphology and examines the mechanical properties of various zones and phases within the Ti6Al4V/AA7075 welds. The research includes a detailed analysis of the joints’ tensile strength and fractography, comparing their performance to that of the base alloys. Additionally, corrosion tests were conducted to evaluate the durability of the welded joints in challenging environments. The results provide valuable insights for designing and enhancing dissimilar metal composites, highlighting the Cu interlayer's potential to improve joint performance.
Methodology
Laser beam welding (LBW) and sample description
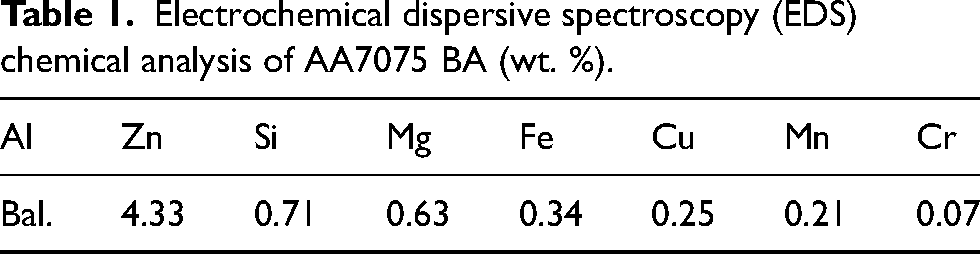
Full penetration Bead-on-Plate (BoP) welding was conducted on AA7075 and Ti6Al4V sheets measuring 100 × 80 × 1.6 mm in their as-received condition, using fiber laser welding as shown in Figure 1. A Cu interlayer, approximately 380 µm thick, was inserted between the AA7075 and Ti–6Al–4V sheets. The chemical composition of the base alloys is detailed in Table 1 and Table 2. Figure 1 shows the schematic representations of the laser beam welding (LBW) process. Table 3 indicates the optimized welding parameters used for the current study to achieve better joints. Leyens and Peters 29 observed that for sheet thicknesses below 3 mm, neither joint preparation prior to welding nor the addition of filler materials is necessary.

(a) schematic of dissimilar welding configuration with an interlayer, (b) Laser welding setup (model: YLS-3000-ST2).
Electrochemical dispersive spectroscopy (EDS) chemical analysis of AA7075 BA (wt. %).
EDS chemical analysis of Ti6Al4V BA (wt. %).

Optimized laser welding parameters used for laser welding of AA7075/Ti6Al4V dissimilar joint with cu interlayer.

The welding was conducted using a fiber laser from IPG Photonics, specifically the Ytterbium Laser Systems model YLS-3000-ST2. This laser is categorized as a class 4 device, having a maximum power capacity of 3 kW. It functions by generating continuous wave output at a wavelength of 1070 nanometers. The system integrates the laser source with a BIMO HIGHYAG laser head via high-performance optical fibers that are 100 µm and 600 µm in diameter. The laser head features a lens with a fixed 310 mm focal length, a focusing module marked Mfoc = 1.50 and an adjustable zoom collimator. The process results in a circular focal point, with a diameter ranging from 0.3 to 1.53 mm depending on the focusing module, collimation module, and the fiber diameter.
Microstructural and fractography analysis
The metallographic and tensile samples were extracted from the welded plate through electric discharge machining (EDM), as depicted in Figure 2. To analyze the microstructure of the welded sections, metallographic specimens were initially ground with abrasive paper up to 4000 grits, then mechanically polished with 1μm diamond suspension paste. Moreover, these samples were etched with Kroll's solution (6% HNO3 and 2% HF by volume in distilled water). The microstructure was observed using an Olympus BH2-UMA optical microscope (OM) equipped with a sensitive tint filter. Fractography analyses were made using an SEC SNE-4500 M scanning electron microscope (SEM) equipped with a Bruker Esprit EDS sensor.

Representative schematic illustration of the metallographic and tensile specimens.
Mechanical behavior characterization
The micro-hardness profiles across the weld area were evaluated using a CLEMEX CTM Vickers hardness tester, applying a force of 200 gf and a holding period of 10 s. For microhardness testing, samples shown in Figure 2 prepared for microstructure analysis were used. Additionally, ASTM standard E8M-04 was followed for preparing tensile test specimens with a gauge length of 25 mm. The tensile tests were performed on a 100 kN MTS machine at a strain rate of 2.5 mm/min. Moreover, the impact testing was performed as per ASTM Standard E23–12c. To ensure statistical reliability, three specimens were tested for each mechanical (tensile, impact, and microhardness).
Corrosion testing
In order to assess the corrosion performance of the samples, three specimens were prepared: Ti6Al4V BA, AA7075 BA, and the joining area of Ti6Al4V / AA7075 (including fusion zone and heat-affected zone regions). Samples were cut from the welded plates using electrical discharge machining (EDM). These samples were then ground with silicon carbide (SiC) paper and polished to achieve a smooth surface. They were mounted in polymer resin, ensuring that only the specific weld area being studied was exposed to the electrolyte during testing. These were machined to a 0.5 cm2 area, and their surfaces were abraded using SiC sandpaper and cleaned with deionized water and ethanol. Corrosion tests were conducted using a Potentiostat device (Gamry Reference-3000) in a three-electrode cell, with an Ag/AgCl electrode as the reference, a platinum electrode as the counter, and the prepared specimens as the working electrode, all in a 3.5% NaCl solution. To stabilize the specimens in the test solution, an open circuit potential (OCP) test was conducted for 1 h. Potentiodynamic polarization and cyclic polarization tests were then performed within a potential range of −1 to 1.5 V vs OCP at a scan rate of 1 mV/s. Analysis of the potentiodynamic polarization and cyclic polarization curves was performed using the Gamry Echem Analyst™ software. The potentials were standardized based on reversible hydrogen potential (RHE) using Equation 1. Finally, electrochemical impedance spectroscopy (EIS) tests were conducted at a voltage amplitude of 10 mV and a frequency range of 10 mHz to 100 kHz to assess the specimens’ resistance to corrosion. The Zview software was used to fit the EIS data and find the equivalent circuit model. Three samples for each area were tested for repeatability and reproducibility.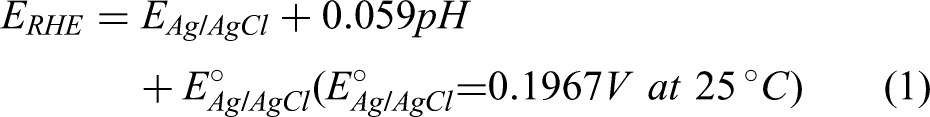
Results and discussion
Microstructural characterization
In this research, sheets of Ti-6Al-4V and AA7075 alloys, each 1.6 mm in thickness, were joined using a welding method that included a 0.4 mm Cu interlayer. The microstructure of the AA7075 alloy is mainly characterized by spherical aluminum cubic (fcc) phase structures with some small pits, which are likely due to the removal of MgZn2 precipitates during the etching process, as depicted in Figure 3(a). On the other hand, the Ti-6Al-4V alloy is composed predominantly of rounded hexagonal close-packed (hcp) α-phase grains, accompanied by a minor presence of intergranular cubic body-centered cubic (bcc) β-phase, as shown in Figure 3(b). Figure 4 depicts the cross-sectional microstructure of a dissimilar butt joint between AA7075 and Ti6Al4V, manufactured using laser welding with a Cu interlayer. The joint shows the Ti6Al4V/Cu interface, with minimal melting of the titanium alloy and a flat joint interface. The limited melting of titanium is key as it prevents extensive mixing with aluminum, significantly reducing the risk of brittle Ti/Al intermetallic formations and thus preserving the base materials’ properties, which ensures a stronger, more ductile weld joint. The investigation primarily focused on the interfaces between AA7075/Cu and Ti6Al4V/Cu, where the joint formation is attributed to eutectic liquid formation and constrained Cu diffusion into Ti6Al4V, respectively. Cu diffusion into AA7075 leads to a pronounced diffusion zone with some sporadic minor cracks visible in the AA7075 fusion zone as shown in Figure 5. In LBW, rapid cooling rates cause considerable local undercooling, 30 resulting in rapid nucleation and the growth of fine grains and dendrites as depicted in Figure 5. The FZ predominantly consists of AA7075, Ti6Al4V, and Cu with the formation of a Vanadium-solid solution enhancing joint robustness. Vanadium aids in strengthening by creating lattice distortions that hinder dislocation movement and potentially forming secondary phases that further impede dislocations, enhancing material strength. 31 Figure 4 and Figure 5 also highlight porosity which is typical in LBW of 7xxx series Al alloys. The porosity arises from entrapped gases like hydrogen, which is highly soluble in molten aluminum and primarily originates from oxides or impurities in the filler or base materials, dissolving into the material. 32 Porosity exists in various forms such as necking, swelling, and collapsing (Figure 4 and Figure 5), often due to inconsistent vaporization of volatile elements like Zn and Mg, which exhibit different vapor pressures. 32 Table 4 shows the porosity analysis of Figure 4 and Figure 5.

(a) AA7075 base alloy, (b) Ti6Al4V base alloy.

Microstructural evolution in dissimilar AA7075/Ti6Al4V joint depicting zones/interfaces depicting fusion zone (fz), heat affected zone (HAZ), and base alloys (bas). 33

(a) middle of fz of the joint, and (b) bottom image of fz of the joint.
Visible pores from fig. 4 & 5 were measured to estimate their average size and area fraction.

Mechanical properties
Tensile tests
Figure 6 shows the stress-strain results for three different materials: AA7075 BA, Ti6Al4V BA, and a joint composed of AA7075/Ti6Al4V with a Cu interlayer. The AA7075 BA material, shows a significant increase in stress with strain up to a point of peak stress, after which it rapidly fails, indicating a brittle failure after the elastic limit. The Ti6Al4V BA, shows a more gradual increase in stress with increasing strain, indicating a more ductile material with a higher strain at failure compared to the AA7075 BA. The joint material (AA7075/Ti6Al4V with Cu interlayer) exhibits a significant stress-strain response. Initially, it follows a similar pattern to the Ti6Al4V BA, suggesting that the joint's behavior is largely influenced by the Ti alloy. However, the stress peaks at a lower value than either of the base materials before it drops, indicating the joint's maximum stress capacity is lower than that of the individual alloys, and it may be the weakest link in terms of mechanical strength. This graph is useful for comparing the mechanical properties of the materials and understanding how they would behave under tensile loads.

Engineering stress-strain result of the AA7075 BA, Ti6Al4V BA, and their joint with cu interlayer. 33
The study 34 investigated laser beam offset effects on welding titanium alloy VT-20 with aluminum alloy AA1461. Specimens without heat treatment and a 1 mm offset had the highest tensile strength, while heat treatment reduced strength, with a 1 mm offset retaining 168 MPa at 490°C. The authors of 35 investigated the effects of low-temperature heat treatment (350°C for 336 h and 450°C for 138 h) on Ti-6Al-4V/AA5754 laser-welded butt joints with 1 mm laser beam offset and linear energies of 36 and 72 J/mm, finding that 350°C treatment maintained tensile strength (90–100 MPa) with slight elongation improvement and no IMC thickness change, while 450°C treatment increased IMC thickness and reduced tensile strength (55–75 MPa), supported by chemical analysis, nanohardness, grain size, and fractography studies. In comparison, our study on laser welding of Ti-6Al-4V/AA7075 using a Cu interlayer demonstrated significantly higher tensile strength, reaching approximately 240 MPa, outperforming the results of both studies. The values are also shown in Table 5.
Approximate strain-at-failure values have been extracted from the stress-strain curves of figure 6.

Microhardness tests
Figure 7 presents the microhardness values, for different zones in a dissimilar joint between AA7075 and Ti6Al4V with a Cu interlayer. Microhardness is a measure of a material's resistance to local deformation, typically indentation. From left to right, the graph displays the microhardness values for the base material of AA7075 BA, the HAZ of AA7075, the fusion zone (FZ, where the actual joining occurs), the HAZ of Ti6Al4V, and the Ti6Al4V BA. The AA7075 alloy has a relatively low hardness compared to the other zones, with the HAZ of AA7075 showing a slight increase in hardness. The FZ exhibits the highest microhardness value, which could be due to the presence of the Cu interlayer and the formation of new phases during the welding process. Following the fusion zone, the HAZ of Ti6Al4V has a microhardness value that is lower than the FZ but higher than the base materials. Finally, the Ti6Al4V base material shows a substantial hardness, though not as high as the fusion zone, which indicates it's inherently a harder material compared to AA7075 but may not resist deformation as well as the weld zone with the Cu interlayer. This graph is essential for evaluating the consistency and quality of the joint between the dissimilar AA7075/Ti6Al4V materials.

Microhardness values of all the zones in AA7075/Ti6Al4V dissimilar joint with cu interlayer. Error bars indicate standard deviation on three measurements.
Impact testing
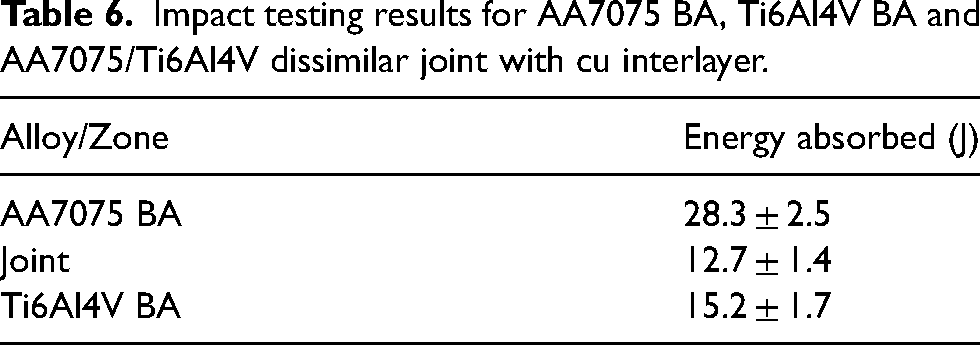
Table 6 presents the impact testing results for AA7075 BA, the FZ, and Ti6Al4V alloy, focusing on the energy absorbed during testing, which is indicative of the material's toughness. For the AA7075 BA, the energy absorbed was recorded at 28.3 Joules with a standard deviation of ±2.5, suggesting relatively high toughness compared to the other samples. The joint with FZ, which includes the Cu interlayer, showed a lower energy absorption of 12.7 J with a standard deviation of ±1.4, indicating a reduction in toughness in this area. The Ti6Al4V sample absorbed an energy of 15.2 Joules with a standard deviation of ±1.7, highlighting its lower toughness relative to the AA7075 BA. The impact testing results are consistent with the results shown in section 3.2.1.
Impact testing results for AA7075 BA, Ti6Al4V BA and AA7075/Ti6Al4V dissimilar joint with cu interlayer.
Fractography analysis
Figure 8 shows the physical appearance of fractured samples after tensile testing. Figure 9 is an overview of the fracture surface. The yellow dashed box indicates a specific area of interest that will be examined in greater detail in subsequent images. This kind of overview is critical for understanding the general fracture pattern, which can provide initial features about the fracture mechanism (e.g., fatigue, overload, stress corrosion cracking). In the next image, finer details of the fracture surface can be seen. The features observed can be interpreted as dimples or pits, which are indicative of a ductile fracture mechanism. Ductile fractures occur when a material undergoes plastic deformation before failure, leading to the formation of these characteristic dimples as voids in the material nucleate, grow, and coalesce. Consistent dimple patterns across the surface support the conclusion of a ductile fracture mechanism, whereas variations might suggest different mechanisms or material inconsistencies. In all these images, the appearance of dimples suggests that the material has undergone considerable plastic deformation, which is a characteristic of ductile failure. Brittle fractures, in contrast, would show flat facets and ridges corresponding to specific crystallographic planes. The presence of pits, as mentioned in section 3.1, can be associated with the presence of inclusions or precipitates in the material that were pulled out or detached from the matrix during the fracture. This can be particularly common in alloys where secondary phase particles are present.

Physical appearance of fractured tensile specimens (a) AA7075/Ti6Al4V joint, (b) AA7075 BA and (c) Ti6Al4V BA.

SEM fractography images of AA7075 BA tensile test fractured specimen.
Figure 10 shows a broad overview of the fracture surface of AA7075/Ti6Al4V joint. In this case, the rough and jagged texture with a tangled appearance suggests a highly deformed area, which is characteristic of a partially ductile fracture. This indicates that the material experienced significant plastic deformation before failure. Further magnification provides an even closer look at the fracture surface. The appearance of dimpled rupture, with many small, rounded features (dimples), is a hallmark of ductile fracture. Furthermore, the last image shows similar rough and irregular features, indicating the ductile nature of the fracture. The consistency of this ductile texture across different areas of the surface reinforces the conclusion that the material has undergone significant plastic deformation.

SEM fractography images of AA7075/Ti6Al4V joint tensile test fractured specimen.
Figure 11 shows a broad overview of the fracture surface of the Ti6Al4V BA. The surface is rough and irregular, which is consistent with a ductile fracture. The presence of many small voids and dimples indicates that the joint underwent significant plastic deformation before failure. The dimples are formed by the growth and coalescence of microvoids within the material as it was deformed plastically under tensile stresses. The shape and size of the dimples and the consistency of the ductile fracture features across different regions suggest that the material failed under similar stress conditions throughout the fracture surface. The rough and torn appearance supports the conclusion that the fracture occurred through ductile mechanisms.

SEM fractography images of Ti6Al4V BA tensile test fractured specimen.
Evaluation of corrosion behavior
Potentiodynamic polarization test (tafel test)
The potentiodynamic polarization test was employed to estimate corrosion potential (ECorr) and corrosion current density (iCorr). Figure 12 illustrates the potentiodynamic polarization curves of samples AA7075 BA, Ti6Al4V BA, and the joining area of Ti6Al4V/AA7075 in a 3.5% NaCl solution. Using the Tafel extrapolation method, the ECorr and iCorr of the specimens were determined. Additionally, polarization resistance (Rp) is calculated using equation 2, where βa, βc, and iCorr show the anodic Tafel slope, the cathodic Tafel slope, and the corrosion current density, respectively.36–39 The results obtained from the potentiodynamic polarization test are presented in Table 7.


Potentiodynamic polarization plots of Ti6Al4V, AA7075, and joining area in 3.5 wt.% NaCl solution at a pH of 7.
Electrochemical parameters extracted from the potentiodynamic polarization plots in figure 12.

The ECorr signifies the thermodynamic tendency for corrosion reactions, while the iCorr reflects the kinetics of corrosion reactions and the corrosion rate. A more positive ECorr and lower iCorr correspond to greater resistance against corrosion. 40 Sample Ti6Al4V BA demonstrates superior corrosion resistance with the most positive ECorr (0.2663 V vs RHE), the least iCorr (6.7903 × 10⁻⁷ A/cm²), and a relatively stable passive region when compared to other samples, as indicated by Figure 12. Conversely, the Sample AA7075 BA, exhibits a more negative ECorr and a higher iCorr, implying it is more susceptible to corrosion. The Ti6Al4V/AA7075 joint sample exhibits an ECorr of −0.0555 V vs RHE and an iCorr of 1.0297 × 10⁻⁵ A/cm², indicating intermediate corrosion resistance between the two base materials. The corrosion rate and polarization resistance (Rp) values have an inverse relationship. This confirms the findings that the sample of Ti6Al4V BA with the lowest iCorr has the highest Rp value, while the sample of AA7075 BA with the highest iCorr has the lowest Rp. The joining area exhibits intermediate values for both iCorr and Rp, indicating its position between the two base materials in terms of corrosion resistance.
Electrochemical impedance spectroscopy (EIS) test
To evaluate corrosion behavior more accurately, the specimen underwent electrochemical impedance spectroscopy (EIS) after 24 h of immersion in a 3.5% NaCl aerated solution. Figure 13 displays Nyquist and Bode plots for Ti6Al4V BA, AA7075 BA, and the joining area. A larger semi-circle diameter in the Nyquist plot (Figure 13(a)) indicates higher corrosion resistance. In the Bode plot (Figure 13(b)), corrosion resistance can also be determined by the impedance value at 0.01 Hz (|Z|0.01Hz). 41 The |Z|0.01Hz values for Ti6Al4V BA, AA7075 BA, and the joining area are 37169, 8435.5, and 309.6 Ω.cm2, respectively. This means that the corrosion resistance follows this order: Ti6Al4V BA > AA7075 BA > Joining area.

(a, b) Nyquist, (c) bode Z, and (d) bode-phase plots for Ti6Al4V, AA7075, and joining area samples in 3.5 wt.% NaCl solution at a pH of 7.
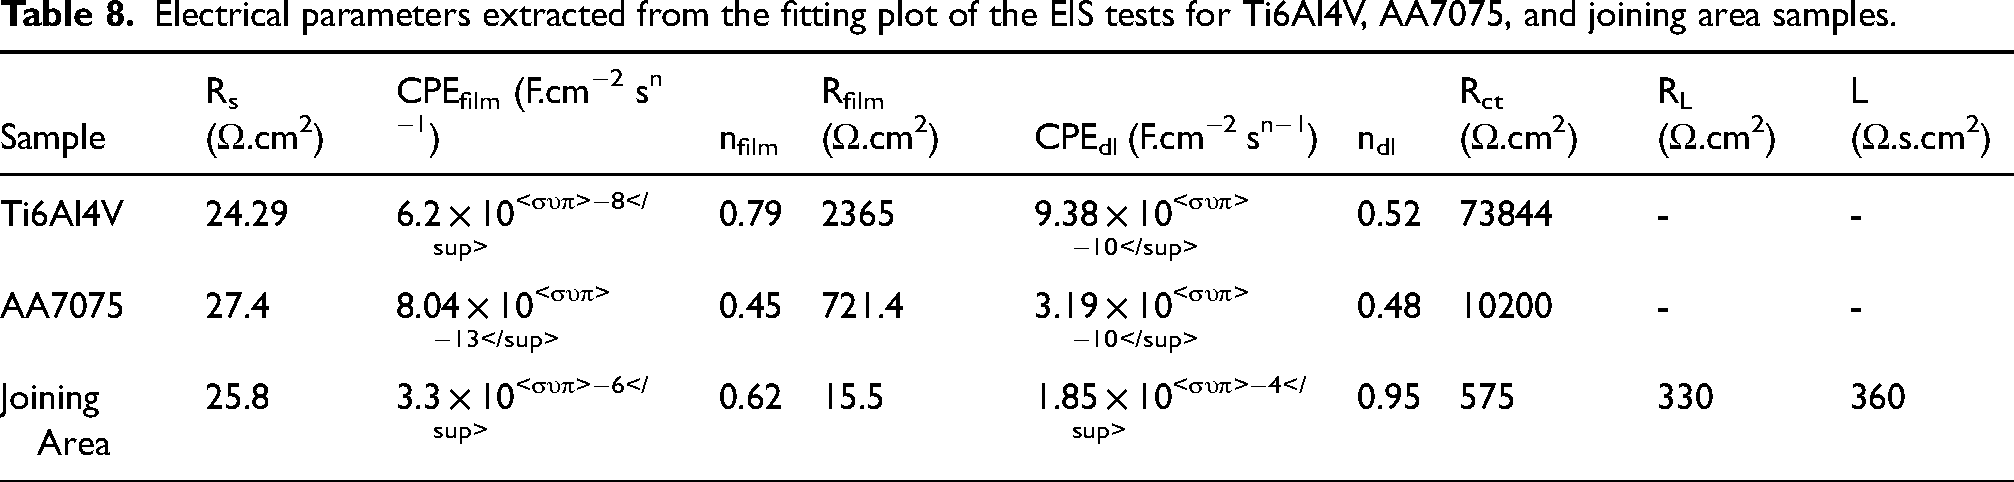
Based on the Bode phase diagrams (Figure 13(c)), all three samples, Ti6Al4V BA, AA7075 BA, and the Joining area, exhibit two-time constants and thus two capacitive loops in their equivalent circuits. In the Nyquist plot, two semi-circles are also observed, where the first semi-circle at high frequencies corresponds to the oxide film and the second semi-circle at low frequencies corresponds to electric double-layer capacitances. The parameters of various circuit elements for the samples of Ti6Al4V, AA7075, and Joining area are listed in Table 8. In all samples, Rs, Rfilm, CPEfilm, Rct, and CPEdl are the solution resistance, the oxide film resistance, the oxide film constant-phase element, the double-layer charge transfer resistance, and the double-layer constant-phase element, respectively. The constant-phase element) CPE(is used as a non-ideal capacitance. In the Joining area sample, an inductive loop was observed at low frequencies, in which L and RL were the inductor and the inductor resistance, respectively. In this case, the discharge reactions are mainly controlled by the electrochemical polarization. Rs represents the solution resistance, and since the solution is uniform across all tests, its value remains approximately constant in all samples. The Rfilm value is higher in the Ti6Al4V BA sample compared to the other two samples, indicating the formation of a passive and corrosion-resistant oxide layer. The oxide layer in the AA7075 BA sample, with a lower Rfilm compared to the Ti6Al4V BA sample, exhibits less resistance to corrosion due to the formation of an unstable oxide layer. Considering that the Rct value in the Ti6Al4V BA sample is higher than in the other samples, the charge transfer from the alloy to the corrosive solution occurs less frequently. In the Joining area sample, the lower Rfilm and Rct values compared to the base metal samples could be attributed to the formation of IMCs and the creation of galvanic couples resulting from the connection of dissimilar metals. This has been exacerbated by the presence of Cu as an interlayer. The additional inductive resistance (RL) in the Joining area sample suggests localized micro-galvanic interactions within the joint area. 42 There are distinct differences in the corrosion characteristics of the joint compared to the parent metals., likely due to microstructural changes and the presence of the Cu interlayer, affecting the overall corrosion resistance and electrochemical behavior (Figure 14).

Electrical parameters extracted from the fitting plot of the EIS tests for Ti6Al4V, AA7075, and joining area samples.
Cyclic polarization test
Cyclic polarization is a widely utilized method for assessing the pitting corrosion resistance of welded joints. 47 Pitting corrosion is characterized by severe localized damage in the form of deep pits, making it more destructive than general corrosion, and is particularly concerning for structures in marine environments. 48 Figure 15 shows the cyclic polarization plots for Ti6Al4V, AA7075, and Joining area samples in 3.5 wt.% NaCl solution at a pH of 7. These plots are instrumental in understanding the corrosion behavior of these materials. The graph for Ti6Al4V indicates that the material has a passive behavior over a wide range of potentials, as seen by the broad, flat region in the anodic branch. This flat region signifies stable passivity and resistance to localized corrosion. However, there is a breakdown potential (Eb) after which the current increases sharply, indicating the initiation of pitting corrosion. The reverse scan from the transpassive region shows a hysteresis loop, which is typical for materials that undergo repassivation of pits. For AA7075, the curve is characterized by a more pronounced active-passive transition. The absence of a pronounced passive region suggests this alloy is more prone to continuous corrosion in the test environment. The pitting potential (Epit) is marked, beyond which the current increases rapidly due to the onset of pitting. The return path of the loop indicates that the pits might repassivate as the potential decreases, suggesting some self-healing properties of the oxide film. The Joining Area, representing the interface between Ti6Al4V and AA7075 using a Cu interlayer, exhibits a different corrosion mechanism. The plot shows a shift towards more negative potentials for both the pitting potential (Epit) and the repassivation potential (Eprot), indicating a lower resistance to the initiation and growth of corrosion pits compared to the base metals. This could be due to microgalvanic corrosion processes occurring between the dissimilar metals and the Cu interlayer, or due to the presence of IMCs that are more reactive in the corrosive environment. The presence of a broad hysteresis loop on the reverse scan suggests that once corrosion initiates, it is more difficult for the material in the Joining Area to repassivate, leading to more severe localized corrosion. The cyclic polarization plots demonstrate the varying resistance to corrosion of the two base materials and their joining area. Ti6Al4V shows superior corrosion resistance with a broad passivity range, while AA7075 is more susceptible to corrosion, as seen by the absence of a wide passive region and a more negative pitting potential. The joining area shows the most negative pitting potential and a wide hysteresis loop, highlighting the challenges in maintaining corrosion resistance in welded joints of dissimilar alloys.

Cyclic polarization plots for Ti6Al4V, AA7075, and joining area samples in 3.5 wt.% NaCl solution at a pH of 7.
SEM analysis after corrosion testing
In the SEM micrographs and corresponding EDS analyses provided in Figure 16, Figure 17, and Figure 18, the oxygen content revealed in the EDS spectra offers insights into the oxide layer formation on the surface of each material following corrosion tests. The EDS analysis of the joining area (Figure 16) indicates a higher oxygen content, suggesting extensive oxide layer formation which is a result of the aggressive corrosion process facilitated by the interaction of the Cu interlayer with the dissimilar metals. This oxide layer is typically non-uniform and signifies potential weak spots where corrosion could penetrate deeper into the material as explained in section 3.4.2. For the Ti6Al4V alloy (Figure 17), the EDS spectra show a moderate increase in oxygen content, reflecting a more passive and protective oxide layer that contributes to the alloy's superior corrosion resistance. The oxide layer is more uniform and stable, offering effective protection against the corrosive environment. Meanwhile, the AA7075 alloy (Figure 18) exhibits significant oxygen presence in the EDS analysis, indicating a thick but potentially porous and less protective oxide layer. This aligns with the observed extensive surface roughness and suggests that the oxide layer on AA7075 does not effectively prevent the underlying metal from further corrosion, especially compared to the more resilient oxide film on Ti6Al4V BA.

(a) SEM micrograph after corrosion analysis of joining area (b) EDS spectra of joining area after corrosion tests.

(a) SEM micrograph after corrosion analysis of Ti6Al4V BA (b) EDS spectra of Ti6Al4V BA after corrosion tests.

(a) SEM micrograph after corrosion analysis of AA7075 BA (b) EDS spectra of AA7075 BA after corrosion tests.
Conclusions
This study conclusively demonstrates that using a Cu interlayer in laser welding of AA7075 and Ti6Al4V alloys significantly enhances the mechanical and corrosion properties of the joint. Based on the detailed analysis of the current study, following key conclusions can be drawn:
The microstructural examination revealed a well-bonded interface with minimal defects, indicating that the Cu interlayer effectively mitigates the challenges typically associated with welding dissimilar materials AA7075 and Ti6Al4V. The joint exhibited a notable increase in microhardness within the fusion zone, with values peaking significantly (220 ± 10 HV) higher than those of the base alloys. The introduction of a Cu interlayer in laser welding between AA7075 and Ti6Al4V alloys resulted in improved mechanical properties. The tensile strength for the joint with the Cu interlayer was found to be enhanced (240 MPa). The use of a Cu interlayer significantly controlled the thickness and composition of the intermetallic layer at the welding interface, which is crucial for reducing brittleness and enhancing joint ductility. The Potentiodynamic polarization test (Tafel test) of the joint area showed a corrosion potential (Ecorr) of −0.0555 V versus Reversible Hydrogen Electrode (RHE) and a corrosion current density (icorr) of 1.0297 × 10⁻⁵ A/cm², indicating intermediate corrosion resistance between the two base alloys.
Footnotes
Author contribution(s)
Declaration of conflicting interests
The authors declared no potential conflicts of interest with respect to the research, authorship, and/or publication of this article.
Ethics approval
This study follows the ethical standards and corresponding guidelines.
Funding
The authors received no financial support for the research, authorship, and/or publication of this article.