
Abstract
Post-mechanical plating heat treatment on zinc and zinc–tin coatings resulted in the formation of an iron–zinc-rich intermetallic layer between the substrate and the coatings, while the outer coating layer became tin-rich in the case of heat-treated zinc–tin coatings. The novel use of grazing incidence wide-angle X-ray scattering detected not only ζ-FeZn13, δ1p-Fe13Zn126 and δ1k-FeZn6.67 phases but also Γ1-Fe11Zn40 and Γ-Fe4Zn9 phases due to the higher resolution and signal-to-noise ratio of synchrotron X-ray diffraction (XRD) compared to traditional XRD. Microstructure evolution models during the heat treatment of mechanically plated zinc and zinc–tin coatings are proposed. The formation of iron–zinc intermetallic phases was in the sequence of ζ-FeZn13, δ1p-FeZn10, δ1k-FeZn7, Γ-Fe3Zn10 and Γ1-Fe5Zn21 phases when the heat treatment duration increased.
Keywords
Introduction
Mechanical plating uses kinetic energy to deposit metallic coatings on small metallic workpieces such as fasteners, bolts, washers and nails at room temperature.1–3 Metallic workpieces, glass beads, metal powders, water and chemical promoter are placed into a tumbling barrel, which is then rotated to generate impact energy that causes the metal powders to peen together and onto the surface of the metallic parts to form a layer of coating. 4 The process is energy efficient and environmentally friendly because it operates at room temperature and does not consume toxic chemicals, 5 such as cyanide baths. 6 Hence, further waste treatment costs are minimised. 3 Mechanical plating can coat all surfaces and features of the small components, but the deposits are generally porous, and coating thicknesses are usually not uniform.7,8
A recent literature review of the coatings deposited on steel fasteners showed that more research needs to be published on the development of mechanically plated coatings. 9 Mechanical plating is commonly used as an alternative to electroplating to coat high-strength steel fasteners because it does not induce hydrogen embrittlement,5,10,11 which causes premature failure in high-strength steels. To reduce the risk of hydrogen embrittlement, post-electroplating heat treatment is required as per ASTM B850 12 and ASTM F1941. 13 On the other hand, heat treatment after mechanical plating is not mandatory, but recent works14–17 showed that heat treatment of mechanically plated Zn and ZnSn coatings on steel screws significantly improved the corrosion resistance of the components. In these works,15–17 the metallurgical characterisation of Zn and ZnSn coatings on steel fasteners was performed using standard techniques such as light optical microscopy (LOM), scanning electron microscopy (SEM) with energy dispersive X-ray spectroscopy (EDS) and X-ray diffractometry (XRD). An interfacial layer was formed in heat-treated Zn and ZnSn coatings. To identify the phases in the interfacial layer by XRD, samples were mounted and polished to remove the top layer because the X-ray could not penetrate the Sn-rich outer coating. The XRD peaks confirmed the presence of ζ-FeZn13, δ1p-Fe13Zn126 and δ1k-FeZn7 phases. However, Γ1-Fe5Zn21 and Γ-Fe3Zn10 phases, which were expected to occur according to the equilibrium phase diagram, 18 were not detected. This may have been related to the sample preparation (insufficient polishing), the volume fraction of those phases being below the XRD detection limit or the XRD spatial resolution unable to separate the peaks of Γ1 and Γ phases from those of δ and ζ phases.
Previous works15–17 have identified that using advanced diffraction techniques is necessary to validate the phase evolution in heat-treated coatings because the outer Zn and Sn coating's thickness prevented the penetration of X-ray through to the intermetallic layer. The application of serial sectioning/polishing to remove the outer coating and expose the interfacial layer possibly induced some plastic deformation, leading to signal-to-noise ratio reduction in the XRD, and possible peak broadening and peaks’ shifts. In addition, as the coatings were heterogeneous, with significant porosity and deposited on fasteners with an irregularly shaped surface, it was difficult to extract representative specimens for analysis by transmission electron microscopy (TEM).
Grazing incidence diffraction is a high-resolution technique to study thin films. Grazing incidence wide-angle X-ray scattering (GIWAXS) was used to identify the intermetallic phases in this study because the ideal substrate (e.g. thin flat sheet) is not necessary, and the coated fasteners that have irregular shape can be cross-sectioned for the measurements, so the results obtained will reflect the actual conditions on coated fasteners.
Though small-angle or wide-angle X-ray scattering (SAXS or WAXS) has been primarily used for research on soft matter, their application to metals research is expanding. The published literature shows that SAXS/WAXS has been successfully used to gain quantitative information about the size distribution of precipitates in Maraging steel at different ageing conditions, 19 in Mg-Zn alloy 20 and in Al–Zn–Cu–Mg alloy. 21 Grazing Incidence SAXS (GISAXS) has been used to study pores’ shape and size distribution in ZnO thin film at nanoscales.22–24 The combined use of GISAXS and WAXS has also enabled in situ studies of the crystallisation of corrosion products during CO2 corrosion of steel. 25
This article presents the results of the innovative use of an advanced diffraction characterisation technique to resolve the identification of phases in the interfacial layer of heat-treated mechanical platings. The published literature indicates that WAXS and GIWAXS techniques have yet to be applied to investigate mechanically plated coatings. The findings from this study provide a new insight into the formation of mechanically plated coatings’ microstructures.
Materials and methods
Materials
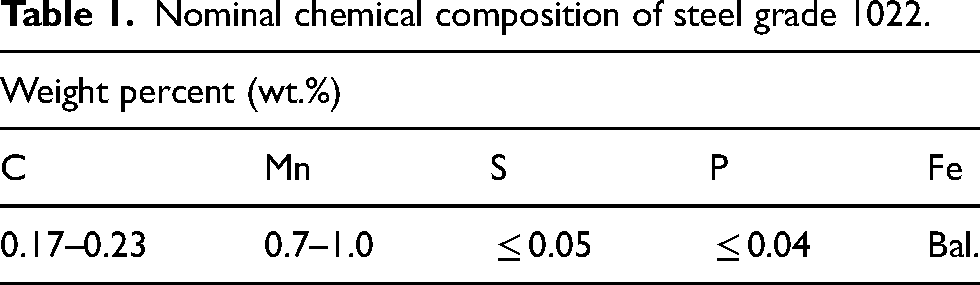
Grade 1022 steel fasteners (Table 1) that are commonly used in building and construction applications were used in this study as the substrates for the mechanically plated Zn and ZnSn coatings. The particle size of Zn and Sn powders was determined using a Horiba LA-950 laser particle size analyser equipped with a 650 nm red laser and a 405 nm blue LED.
Nominal chemical composition of steel grade 1022.
Coating deposition
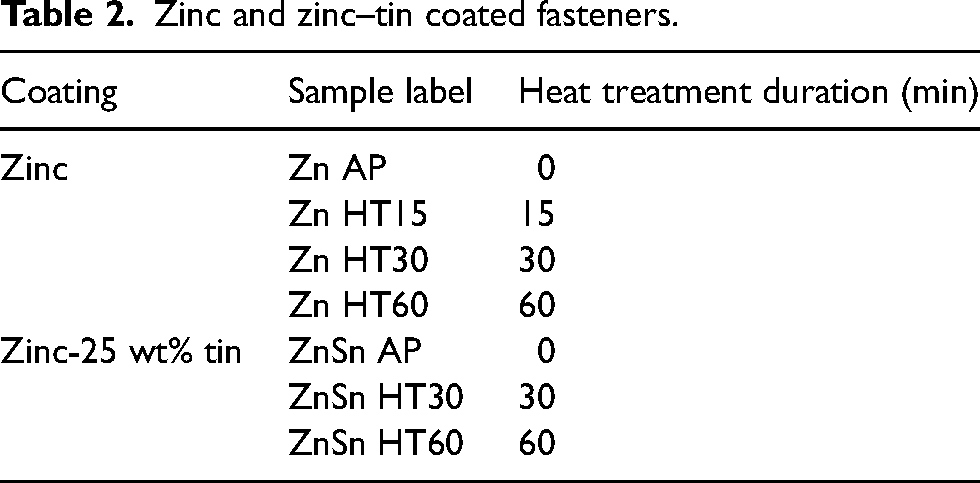
Zn and ZnSn coatings were deposited on grade 1022 steel fasteners (Table 1) by adding the fasteners, glass beads and water into the tumbling barrel, following the standard mechanical plating procedure described in Figure 1. After surface cleaning, consecutive applications of copper flash and tin flash were employed as a base coat to provide adhesion sites for subsequent metal powders. The thickness of the coating was checked using an electromagnetic thickness gauge before the fasteners were rinsed and discharged from the barrel. After the mechanical plating process, the coated fasteners were heat treated to 340 ± 10°C for 15–60 min in an air atmosphere, then cooled naturally to room temperature. Table 2 shows the list of samples prepared.

Mechanical plating procedure.
Zinc and zinc–tin coated fasteners.
Metallographic preparation
Coated samples with and without heat treatment were cross-sectioned and cold-mounted with epoxy (30 mm diameter and 15 mm thick). The cross sections were ground using 1200 grit SiC abrasive papers and finely polished using 9, 6, 3 and 1 μm diamond suspensions, respectively, with ultrasonic cleaning in ethanol in between the polishing. The cross-sectional area of the sample was approximately 10 mm × 4 mm. The polished samples were etched for 15 s with 1% amyl nital, flushed with ethanol and dried with compressed air.
Metallurgical characterisation
The microstructures of coatings were examined by electron microscopy using a ZEISS SUPRA 40VP field emission scanning electron microscope (FESEM) equipped with an Oxford INCA 250 energy dispersive X-ray spectrometer (EDS). Elemental distributions from the substrate to the coating surface were determined by EDS analogue line scans performed on polished and un-etched cross-sections.
The nature and type of phases formed were analysed using a Bruker D8 Advance XRD with Cu Kα radiation (λ = 1.5406 Å). Since the X-ray could not penetrate the outer coating and reach the interfacial layer due to the limited X-ray penetration depth,15–17 specimens of the heat-treated samples were carefully polished to remove the top coating layer before the XRD scan. Samples were scanned at a step size of 0.05° within 2θ range of 30° to 90° and a dwell time of 5 s per step. The tube voltage and current were 40 kV and 30 mA, respectively. The XRD peaks were compared with the Powder Diffraction File (PDF) database from the International Centre of Diffraction Data.
Grazing incidence wide-angle X-ray scattering (GIWAXS)
The GIWAXS experiments were performed using grazing incidence geometry on SAXS facilities at the Australian Synchrotron of the Australian Nuclear Science Technology Organisation (ANSTO). A camera length of 350 mm was used at a beam energy of 20 keV with a wavelength λ of 0.61992 Å to obtain a wide Q-range from 0.19 to 7.10 Å−1 that justifies the 2θ range of 30° to 90° performed in XRD. The incident beam impinged the mounted cross-sectional sample surface at a grazing incidence angle αi (Figure 2(a)). The grazing incidence angle αi was set as 5° to obtain a beam footprint of 300 μm in horizontal × 25 μm in vertical (FWHM).
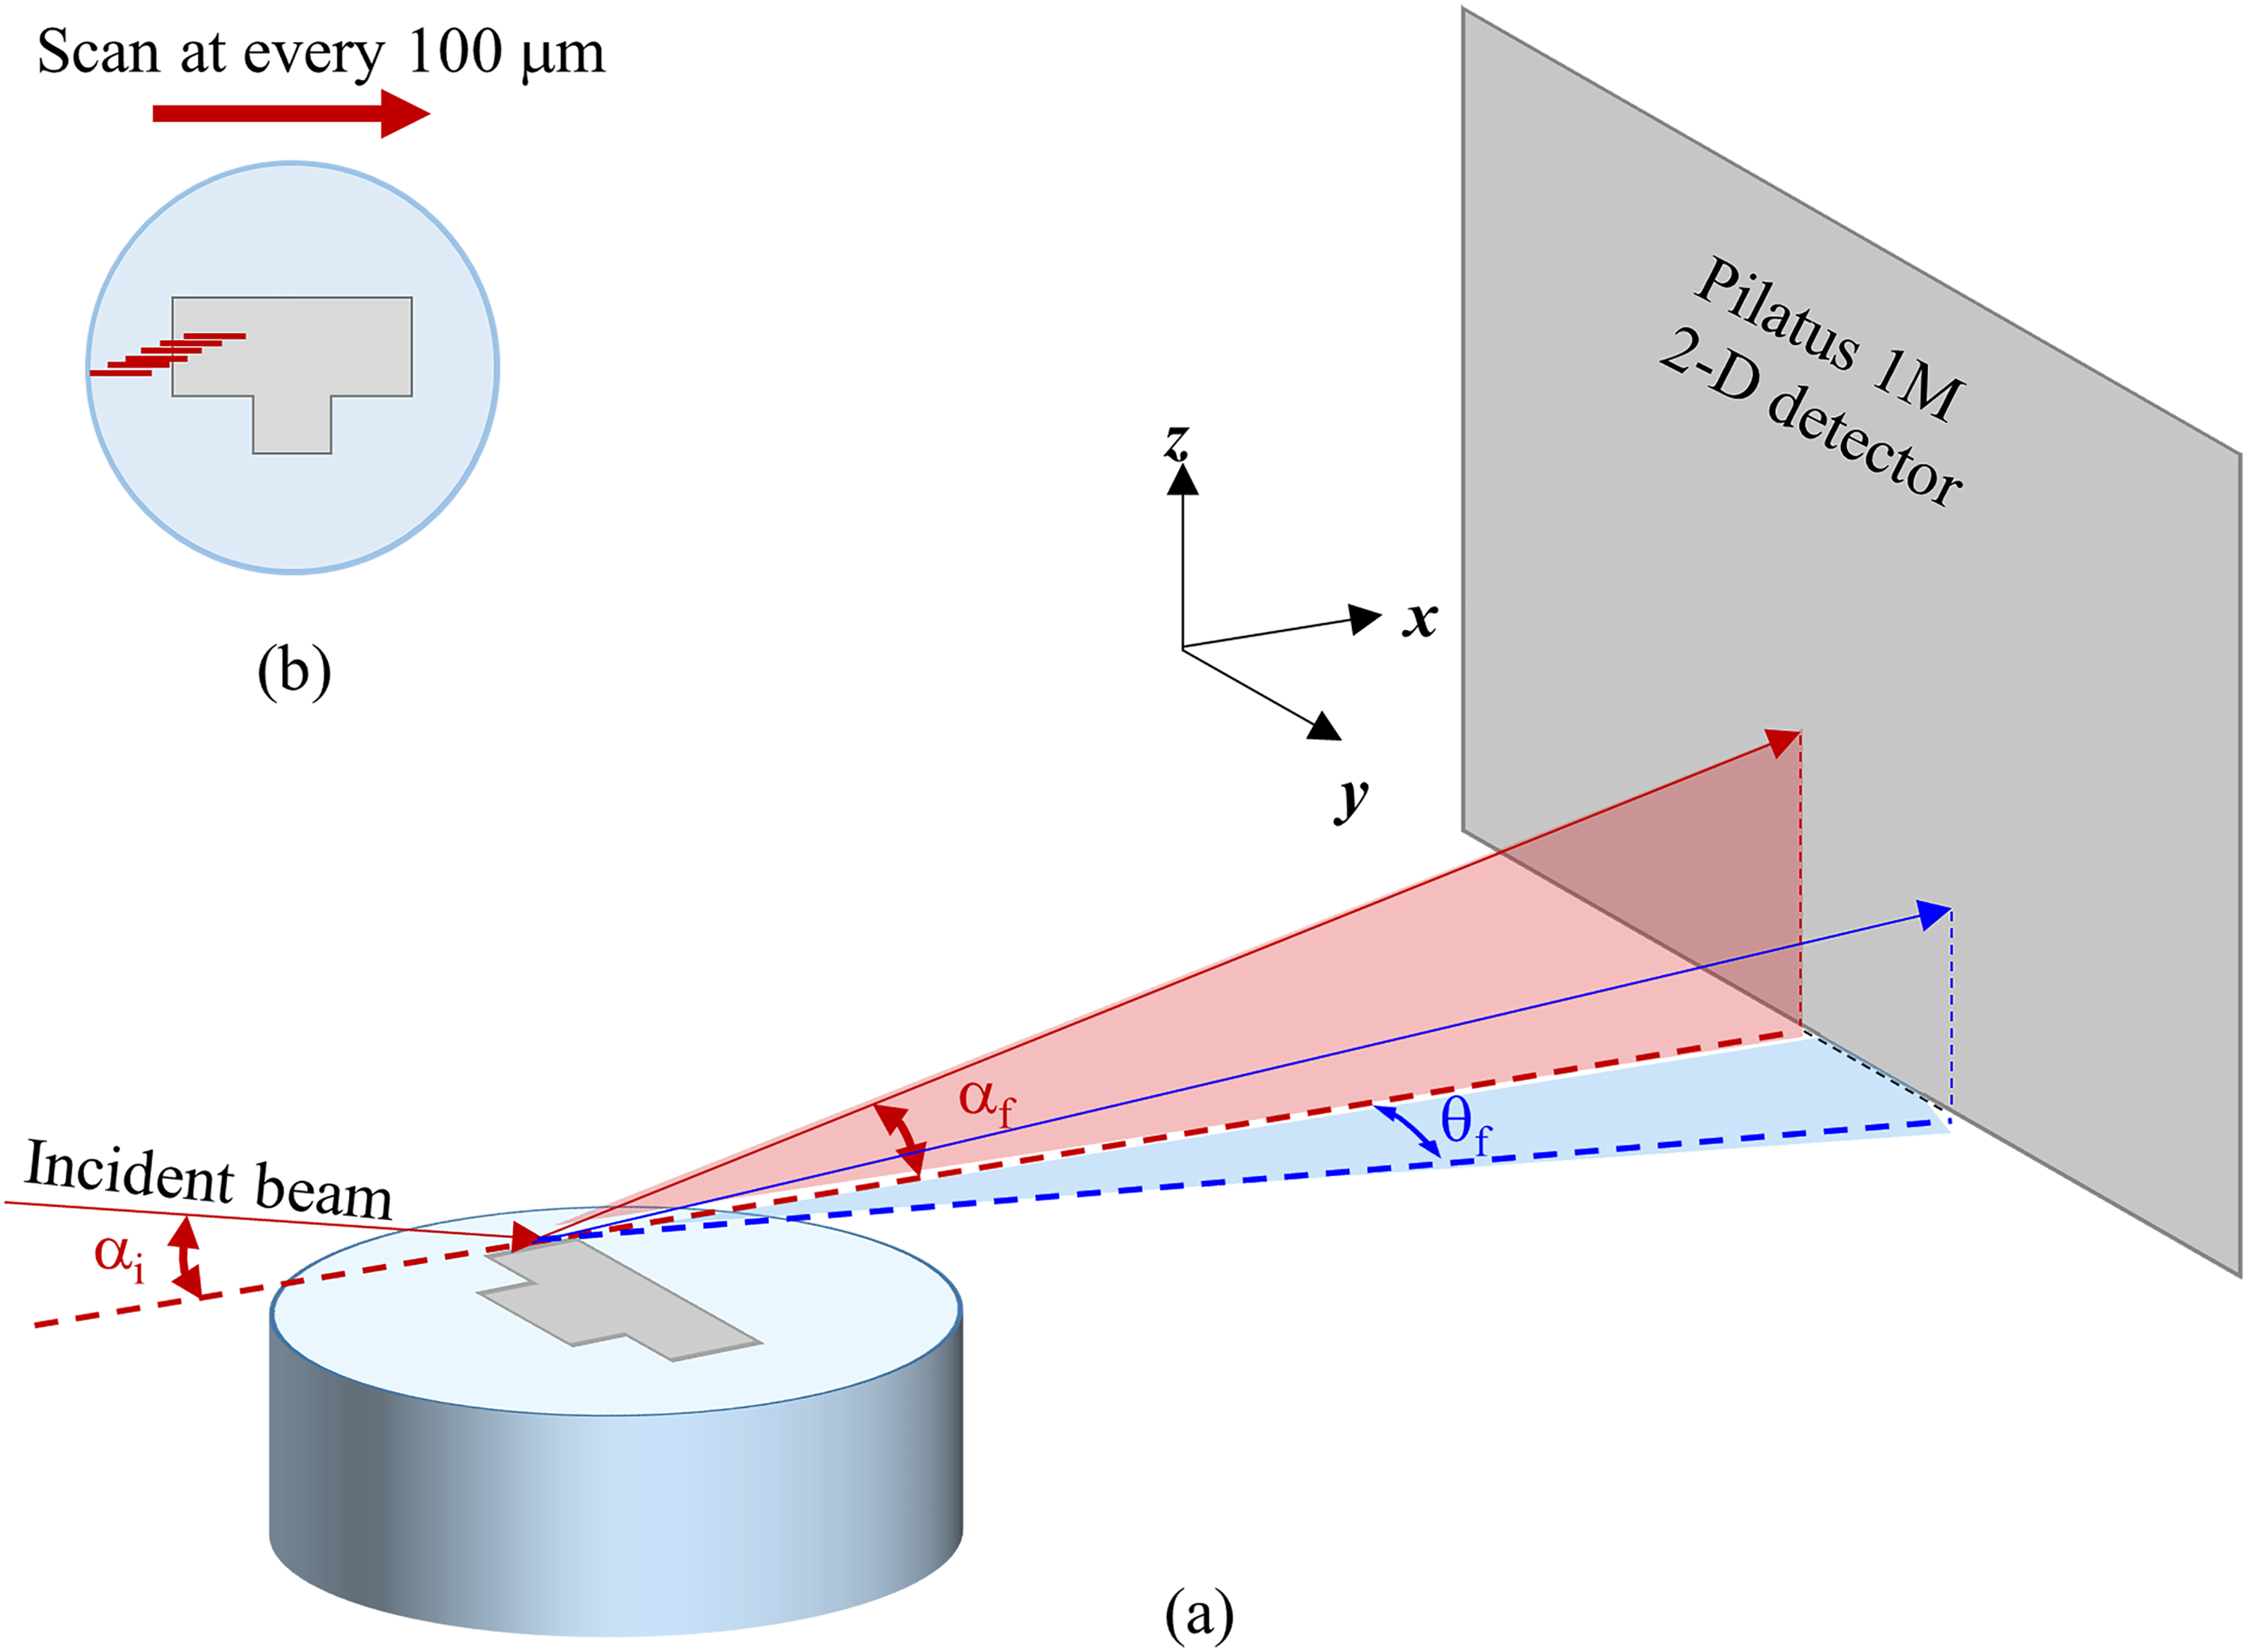
Schematic of GIWAXS experimental setup where (a) the incident beam impinged the mounted sample surface at a grazing-incidence angle αi and the scattering angles αf and θf in the out-of-plane and in-plane directions and (b) the continuous scans were performed across the polished sample surface at 100 μm step from the region near the mounting resin towards the middle of the sample.
Continuous scans were performed every 100 μm across the sample's surface, beginning from the epoxy region near the edge of the fastener's head towards the middle of the sample, as illustrated in Figure 2(b). The measurements were conducted at room temperature, and each measurement's exposure time was 5 s. The 2D diffraction pattern was recorded simultaneously using Pilatus 1M SAXS detector. The 1D data were acquired from the 2D diffraction patterns using the Scatterbrain software. To compare the 1D GIWAXS profiles with the International Centre of Diffraction Data PDF database, the collected Q data were converted to d-spacing using d = 2π /Q.
Results and discussion
Zn and Sn particle size
Zn and Sn powders were initially examined using FESEM, revealing that Zn particles (Figure 3(a)) were remarkedly smaller than Sn particles (Figure 3(b)). The particle size distributions (PSD) for each powder are illustrated in Figure 4. Zn particles ranged from 1.3 to 10.1 μm, with an average size of 3.7 ± 0.2 μm and a median size of 3.6 ± 0.2 μm. Meanwhile, Sn particles exhibited sizes ranging from 3.9 to 67.5 μm, with mean and median values of 14.3 ± 0.1 μm and 12.8 ± 0.06 μm, respectively.
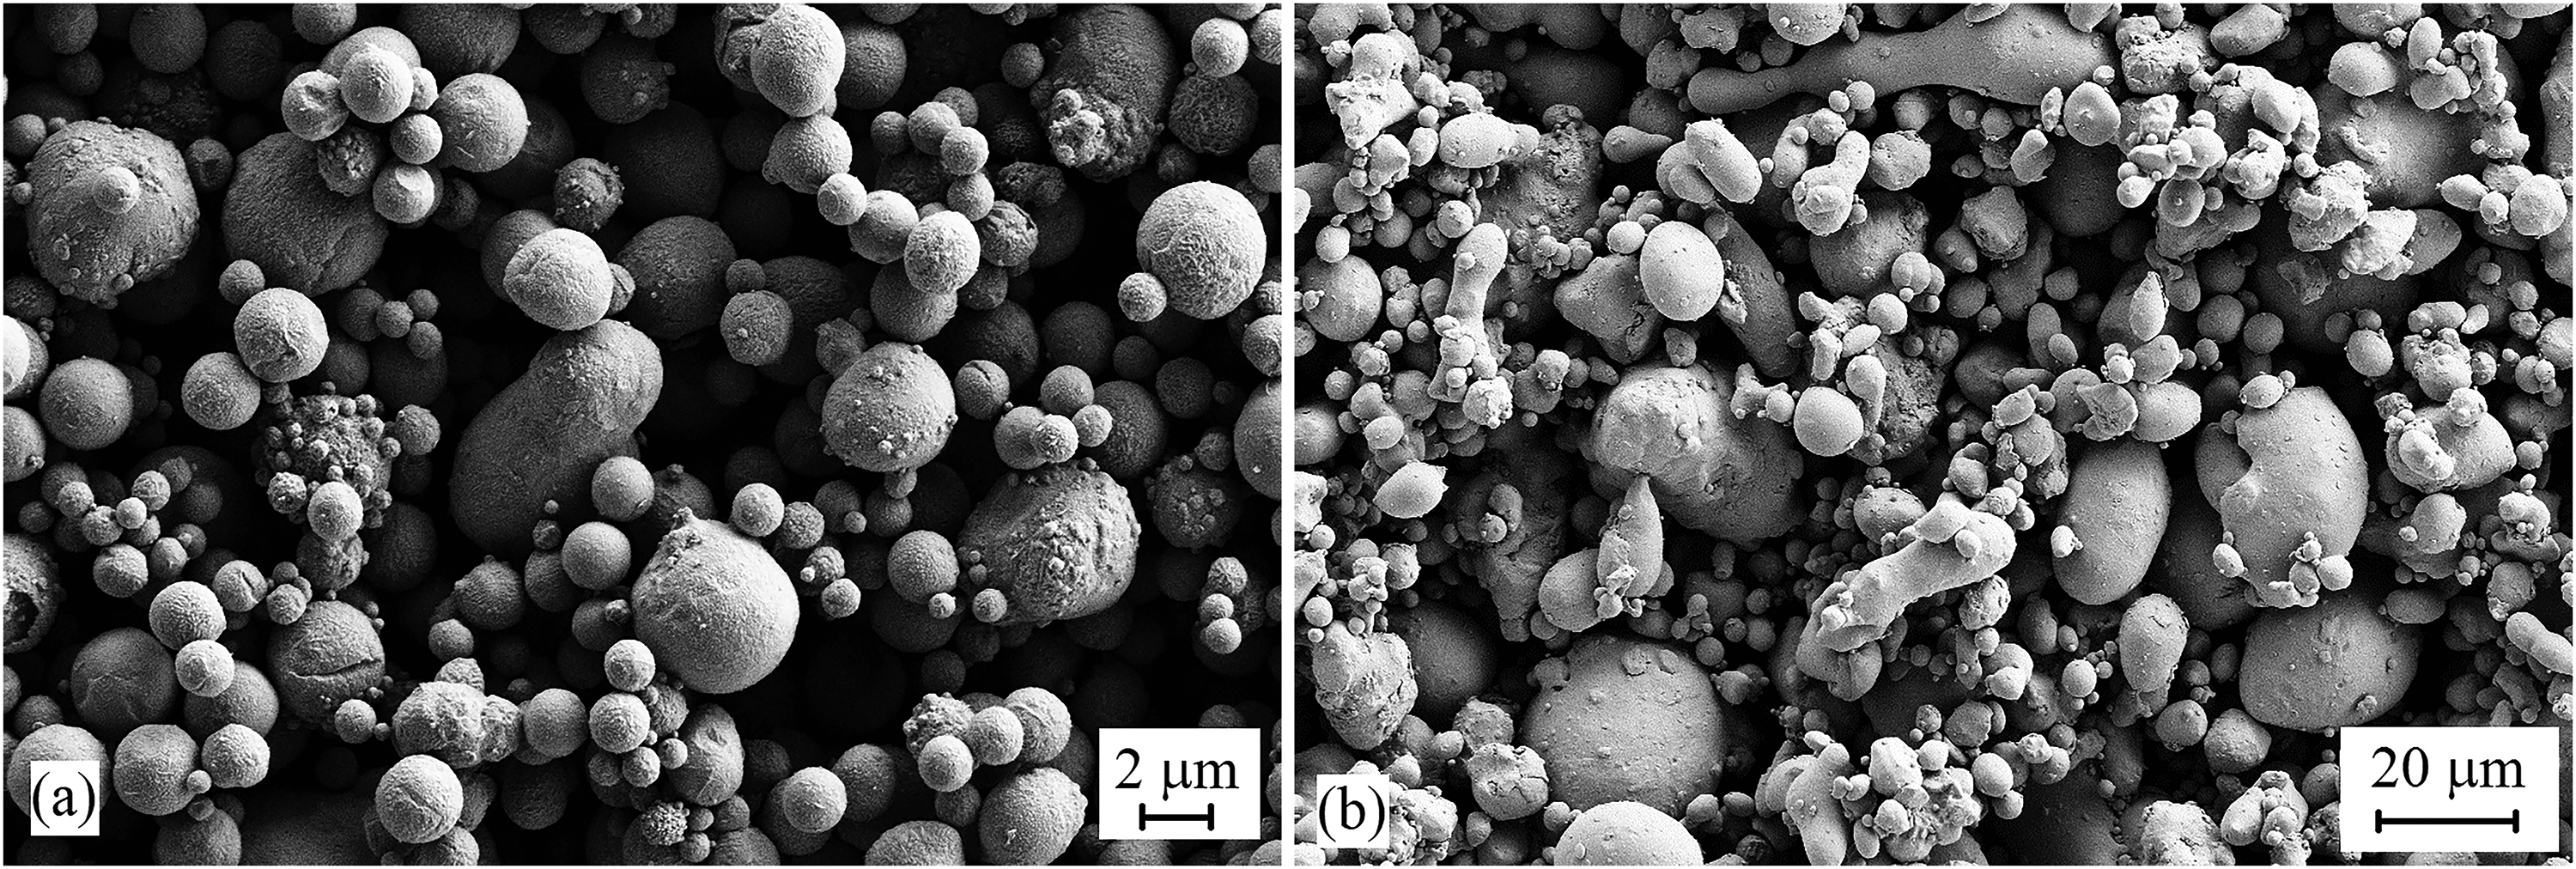
Scanning electron micrographs depicting the morphology of the utilised powders: (a) Zn and (b) Sn.
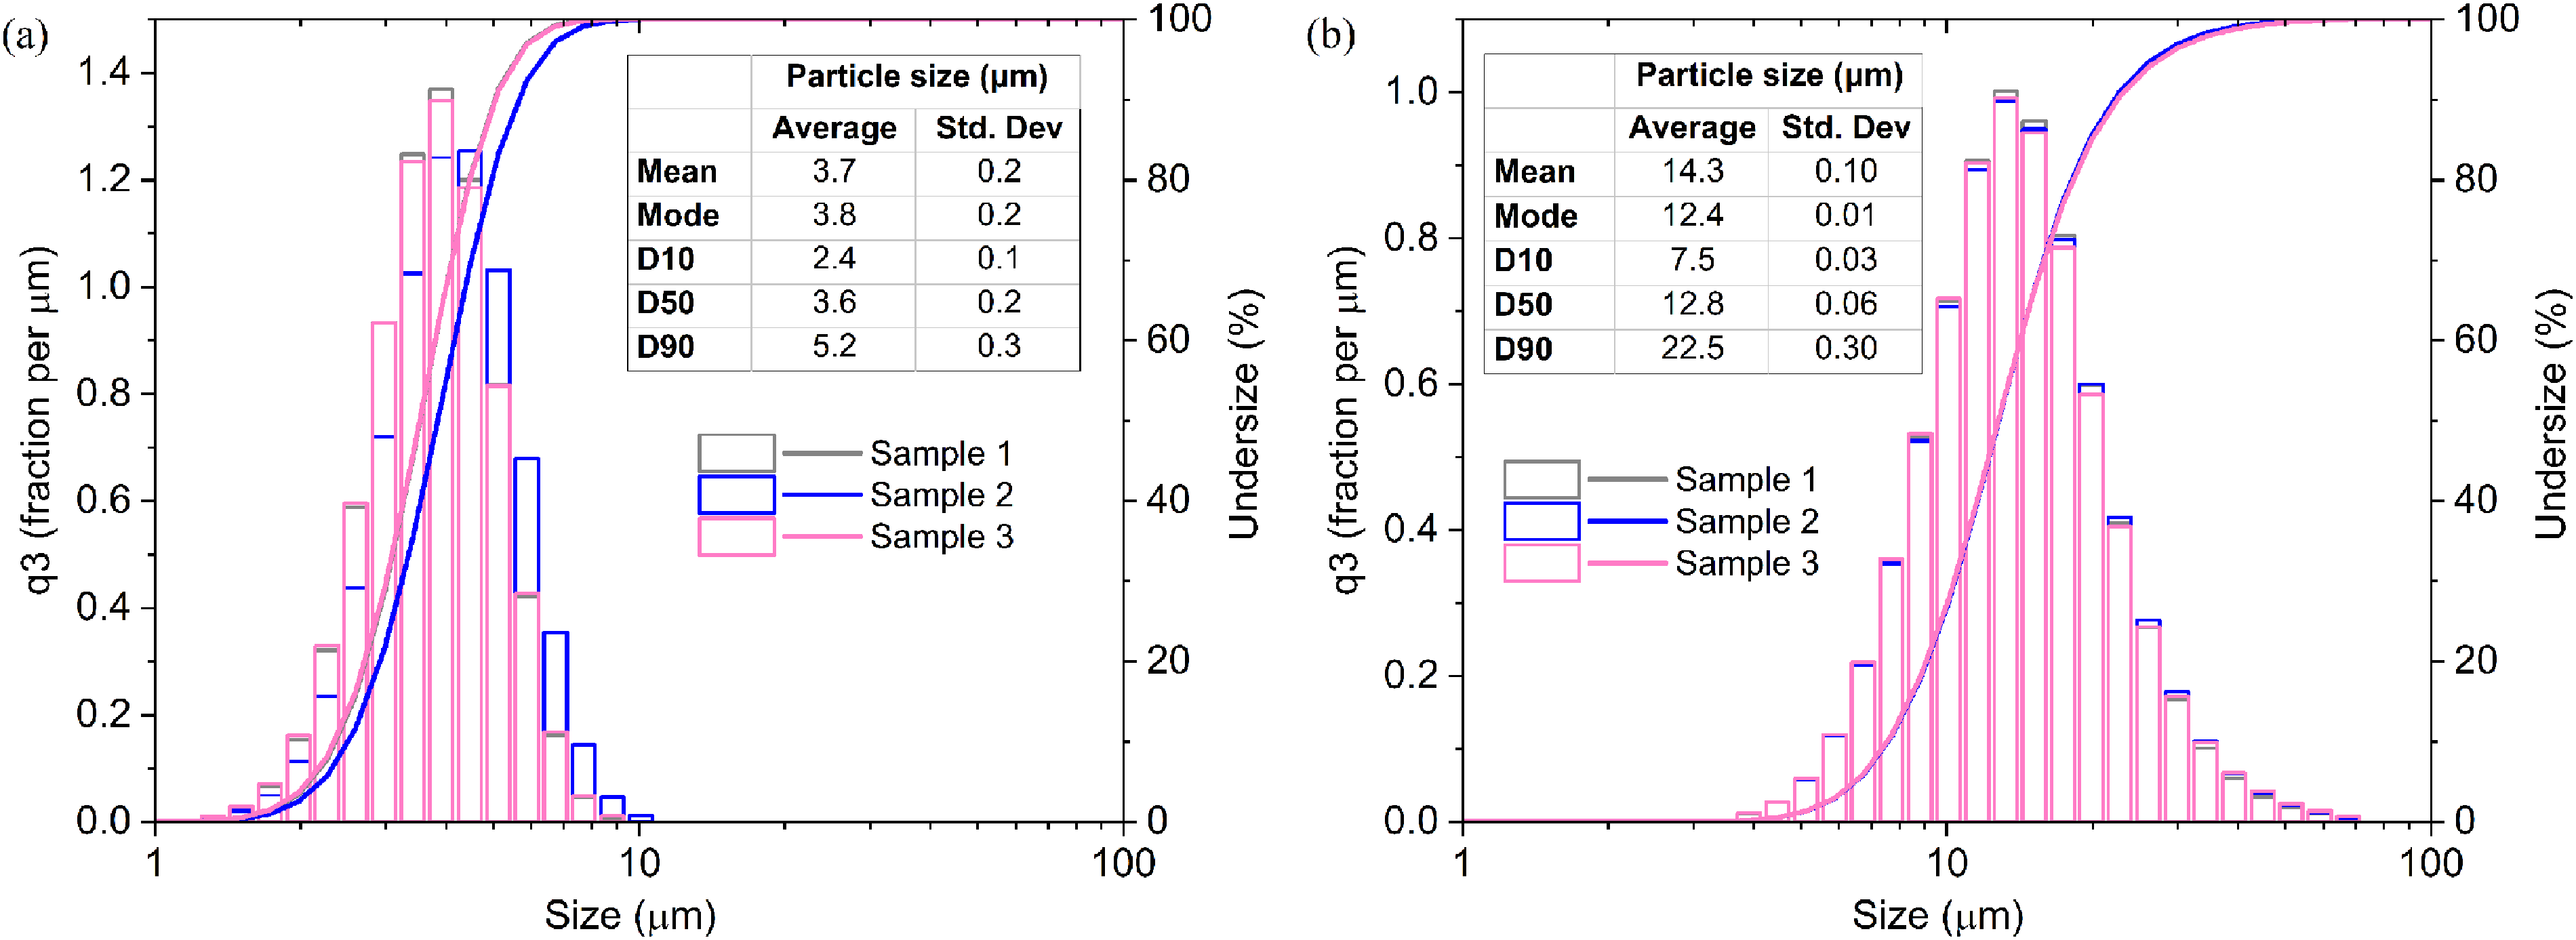
PSD of the utilised powders: (a) Zn and (b) Sn.
Effects of heat treatment on microstructures
Figure 5 illustrates the effect of heat treatment on the morphology of particles in ZnSn coatings. In the pre-heat treatment state (Figure 5(a)), the particles exhibited porous and flat surfaces, attributed to impingement effects during the mechanical plating process. Following 30- and 60-min heat treatments (Figure 5(b) and (c)), the PSD remained similar, but shrinkage effects became apparent, and some interfaces became obscured. This phenomenon was attributed to the diffusion effects during low-temperature heat treatment on the porous coating. 26 Similar shrinkage and obscuring effects were observed in heat-treated Zn coatings; however, this article only presents those observed in ZnSn coatings. From the cross-sectional view, before heat treatment, a distinct interface was observed between the steel substrate and the coating (Figures 6(a) and 7(a)), and Zn and Sn particles were distributed randomly in the ZnSn coating layer (Figure 7(a)). With heat treatment, an interfacial layer formed between the steel substrate and the coating (Figures 6(b) and 7(b)). The interfacial layer was formed in all heat-treated Zn and ZnSn coatings, but this article only presents the 60-min heat-treated coatings. The interfacial layers formed in 15- and 30-min heat-treated Zn and ZnSn coatings were similar to those reported in previous works.15–17
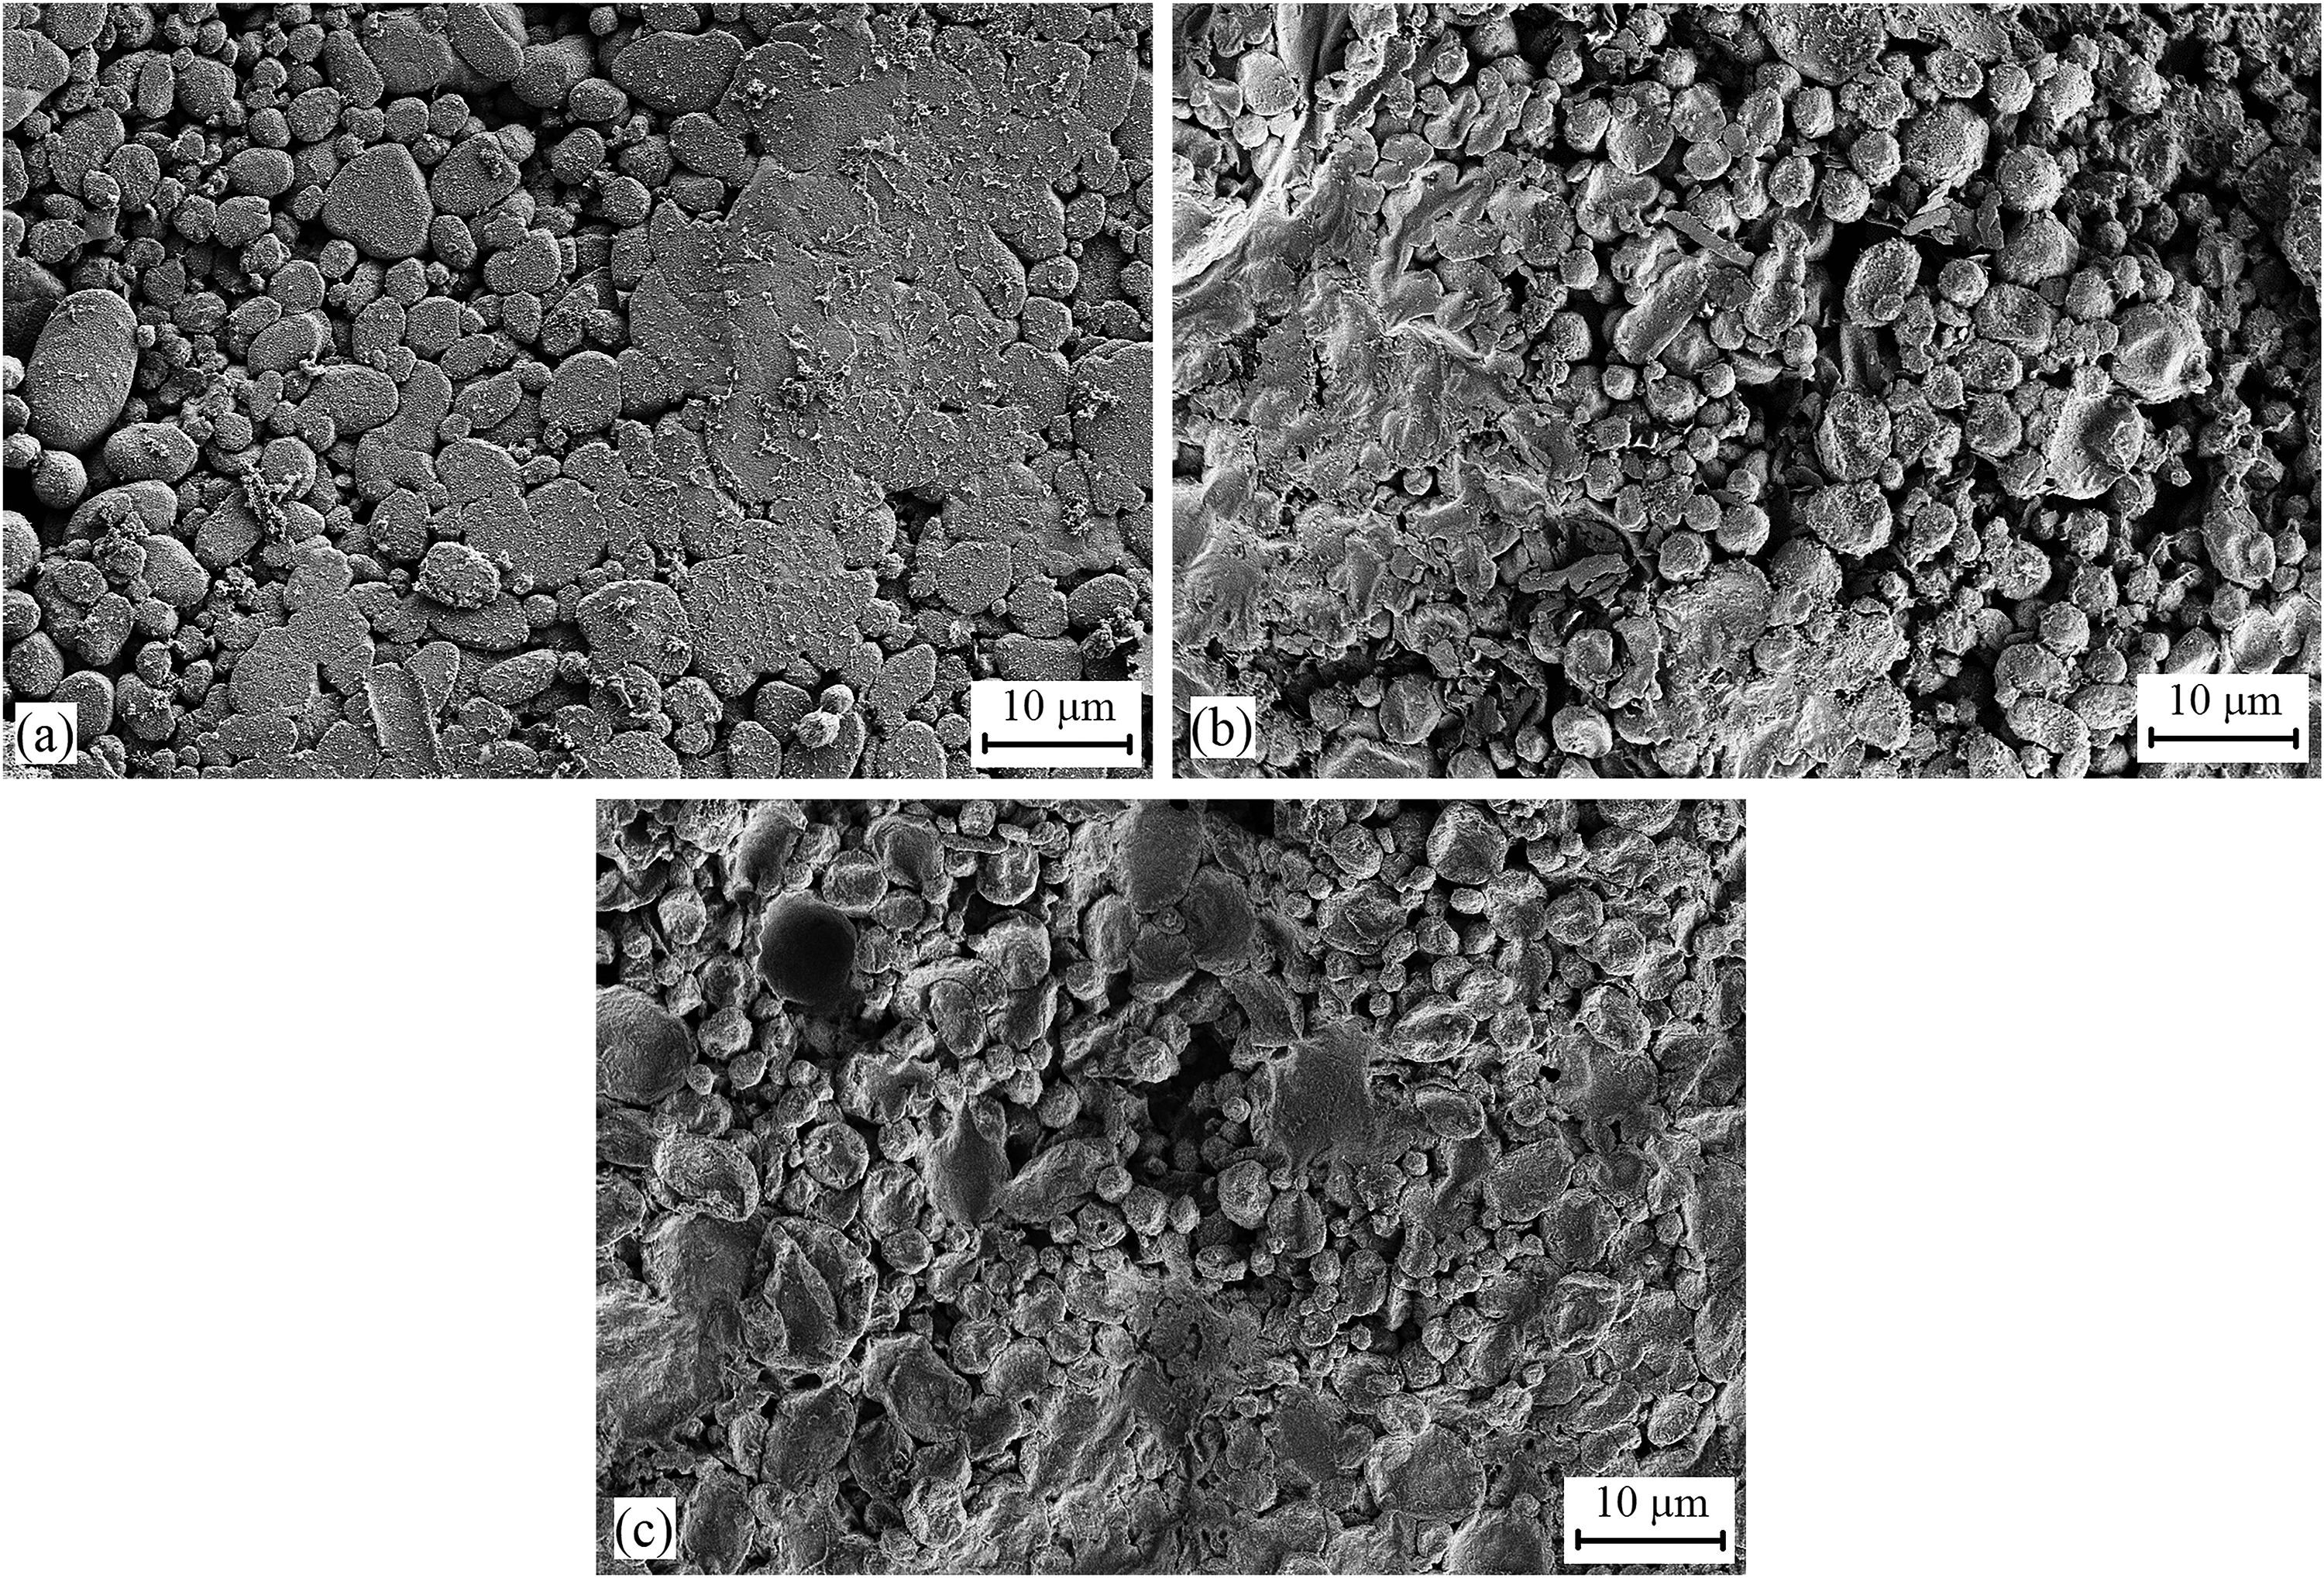
Scanning electron micrographs of the surface morphology ZnSn coating (a) before heat treatment, (b) after 30 min heat treatment and (c) after 60 min heat treatment.
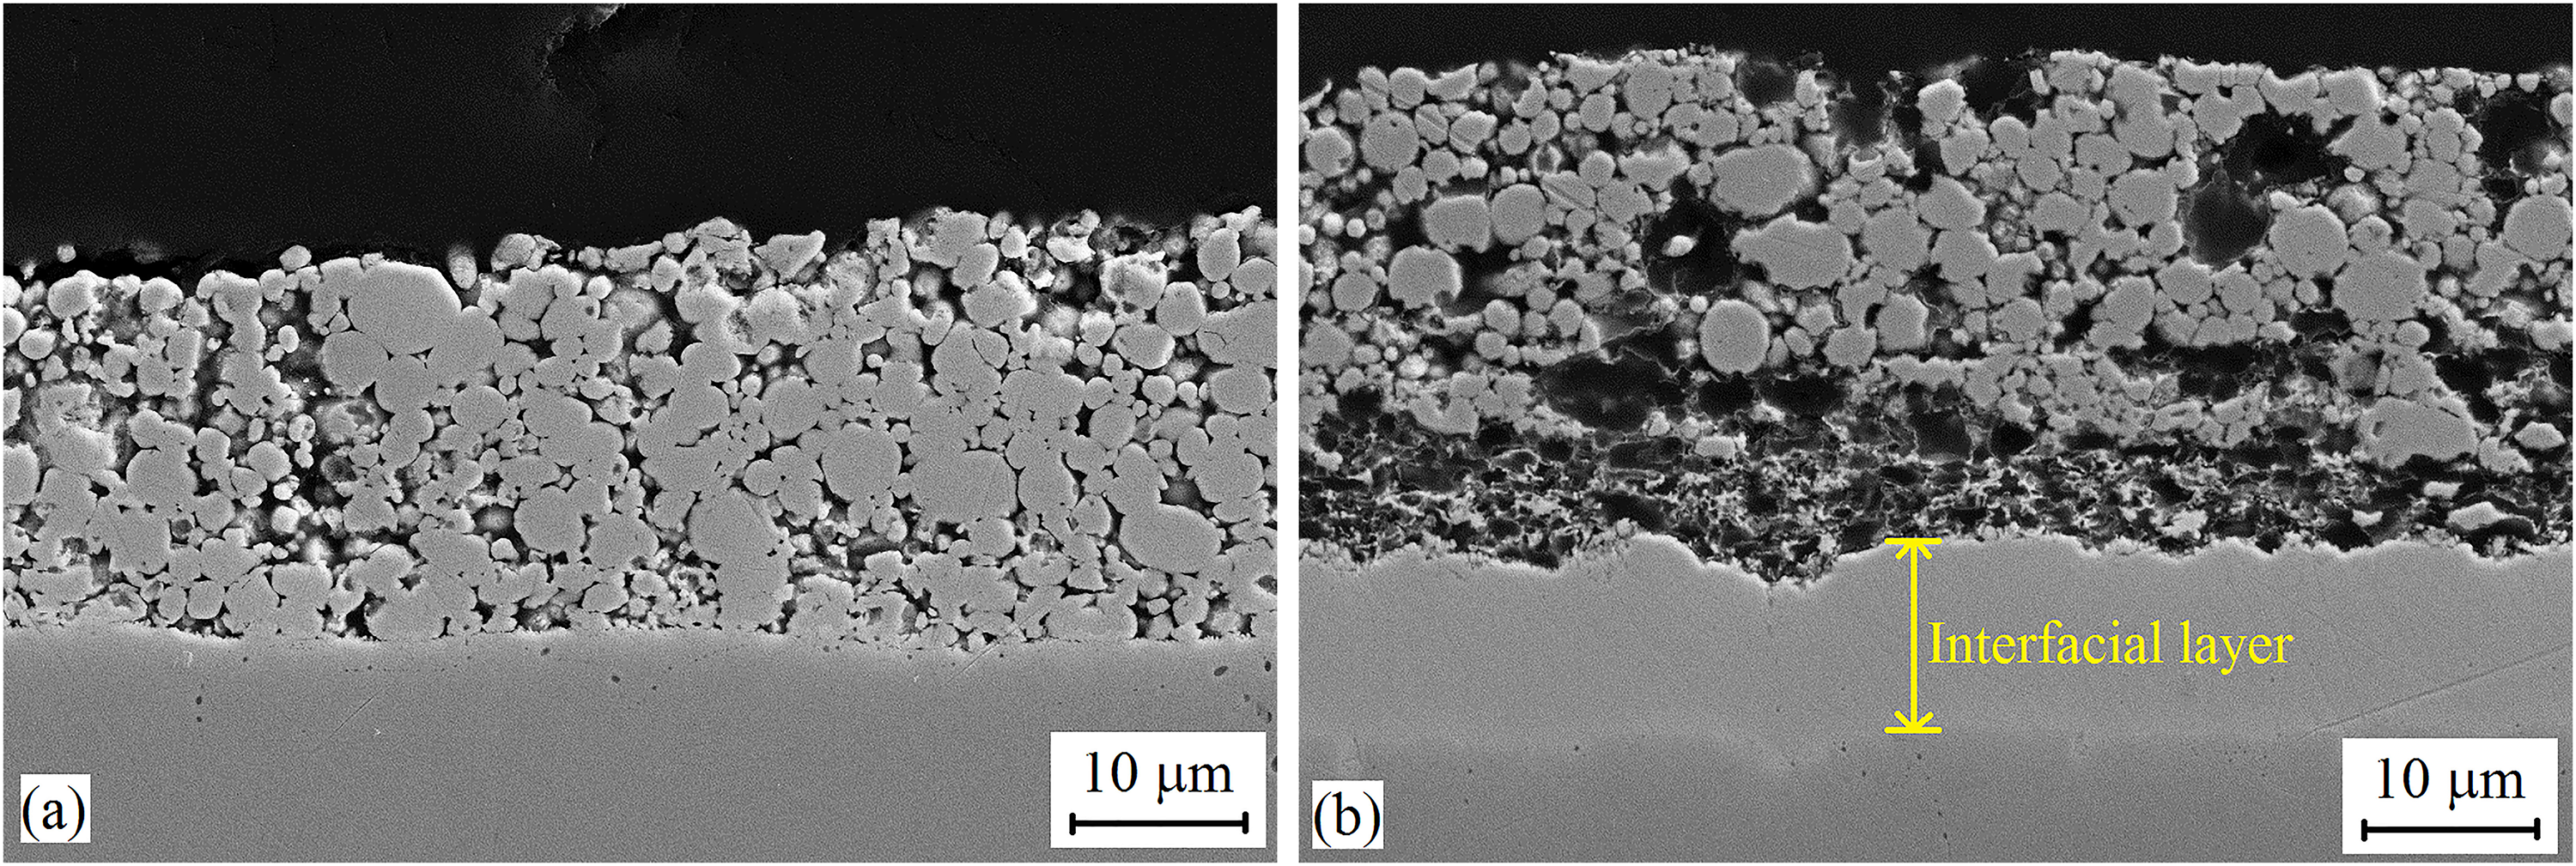
Scanning electron micrographs of the unetched cross-section of Zn coating (a) before heat treatment and (b) after 60 min heat treatment.
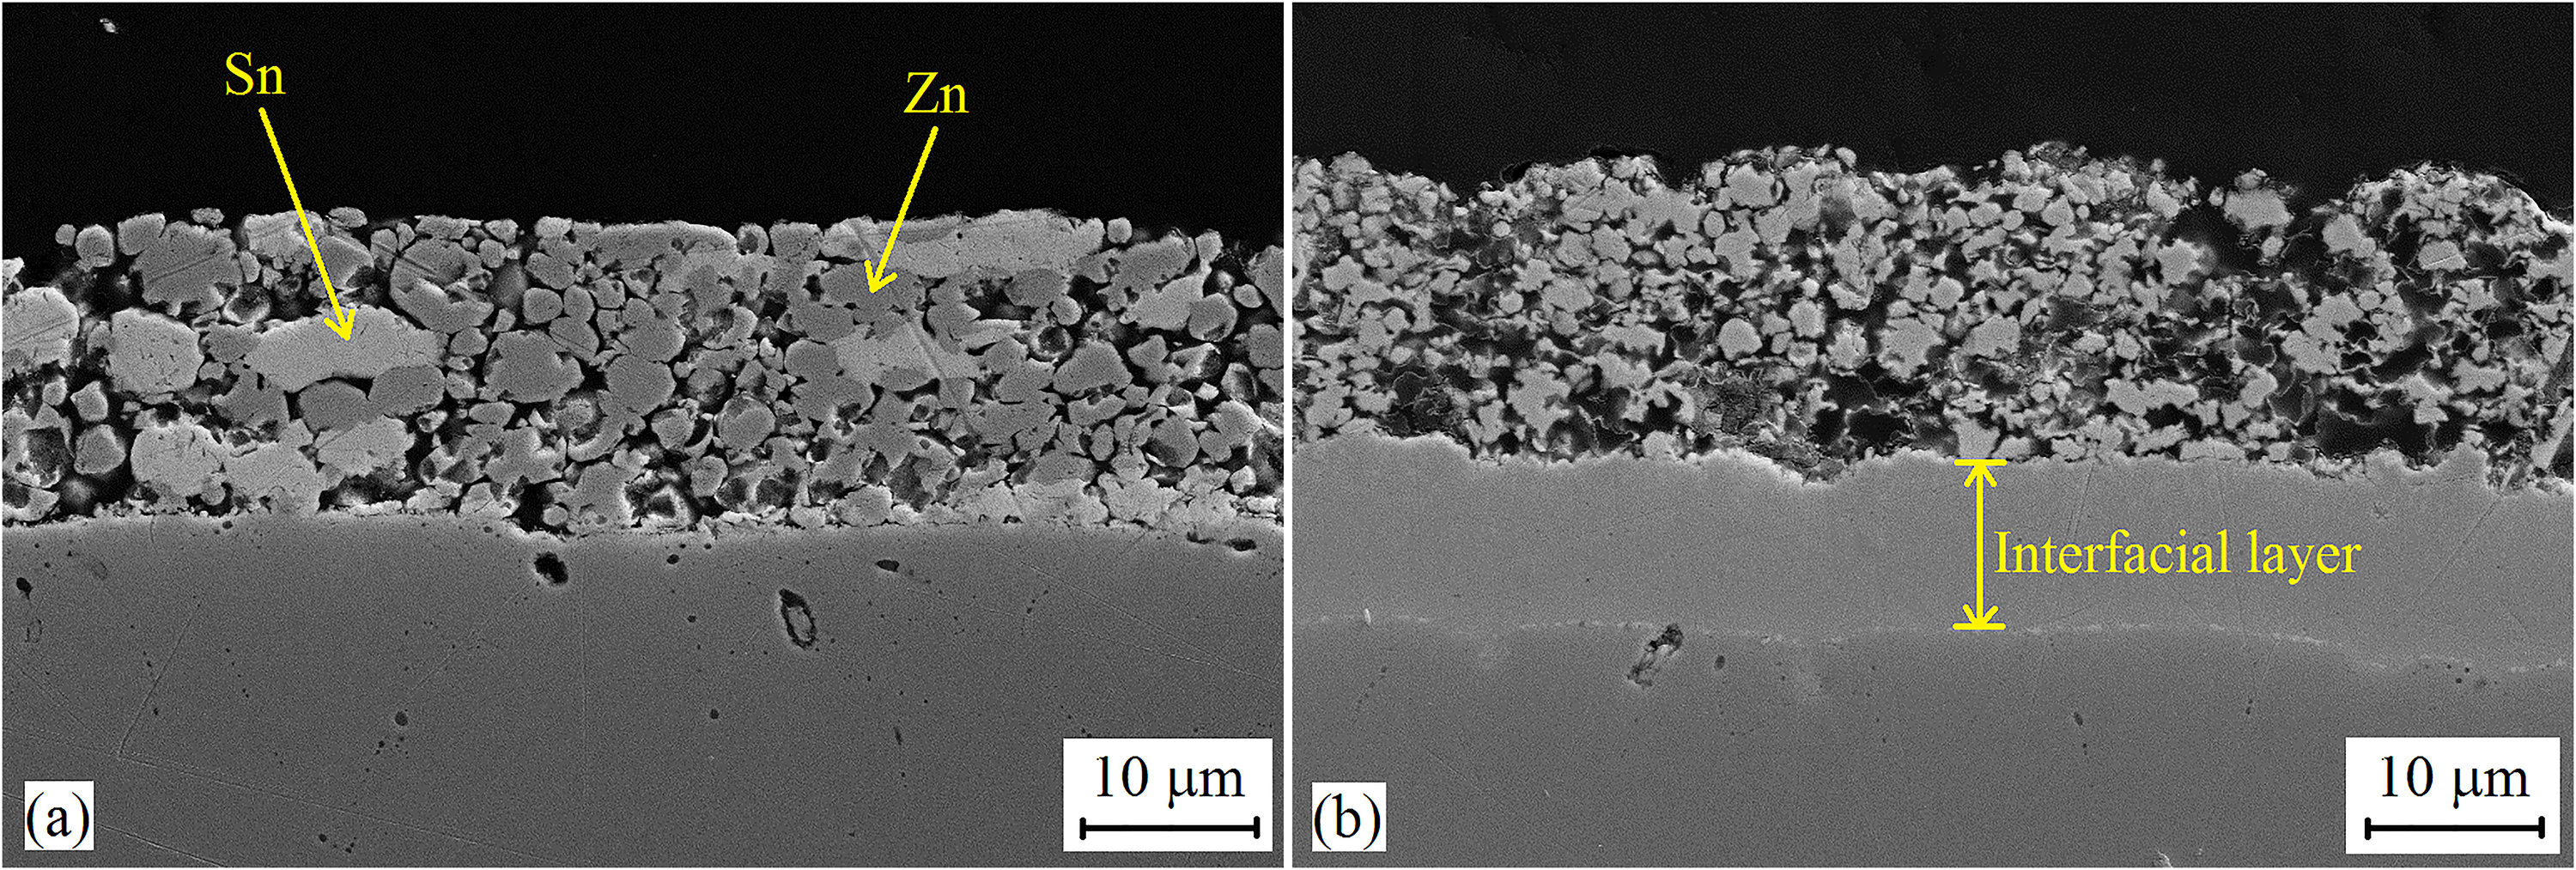
Scanning electron micrographs of the unetched cross-section of ZnSn coating (a) before heat treatment and (b) after 60 min heat treatment.
Elemental distributions and phases formed after heat treatment
The elemental distributions in all heat-treated coatings showed that the interfacial layer was Fe–Zn-rich (Zn and ZnSn coatings), while the outer coating for heat-treated ZnSn coatings was Sn-rich. Figure 8 shows the distributions of Fe, Zn and Sn in 60-min heat-treated Zn and ZnSn coatings (Zn HT60 and ZnSn HT60, respectively), while the elemental distributions in 15- and 30-min heat-treated coatings were similar to those reported in the previous works.15–17 Averages of atomic percentage data in Figure 8 were obtained from several point analyses taken at locations specific to those regions of interest. Results show that the intermetallic Fe–Zn-rich layer contained on average 91.4 at% and 89.0 at% Zn in heat-treated Zn and ZnSn coatings, respectively, while the outer coating for heat-treated ZnSn coatings contained 46–83 at% Sn. Sn was detected at the interfacial layer/outer coating interface of Zn HT60 at approximately 17.2 at% because Sn was added as a base coat prior to the addition of Zn powder during the mechanical plating process.
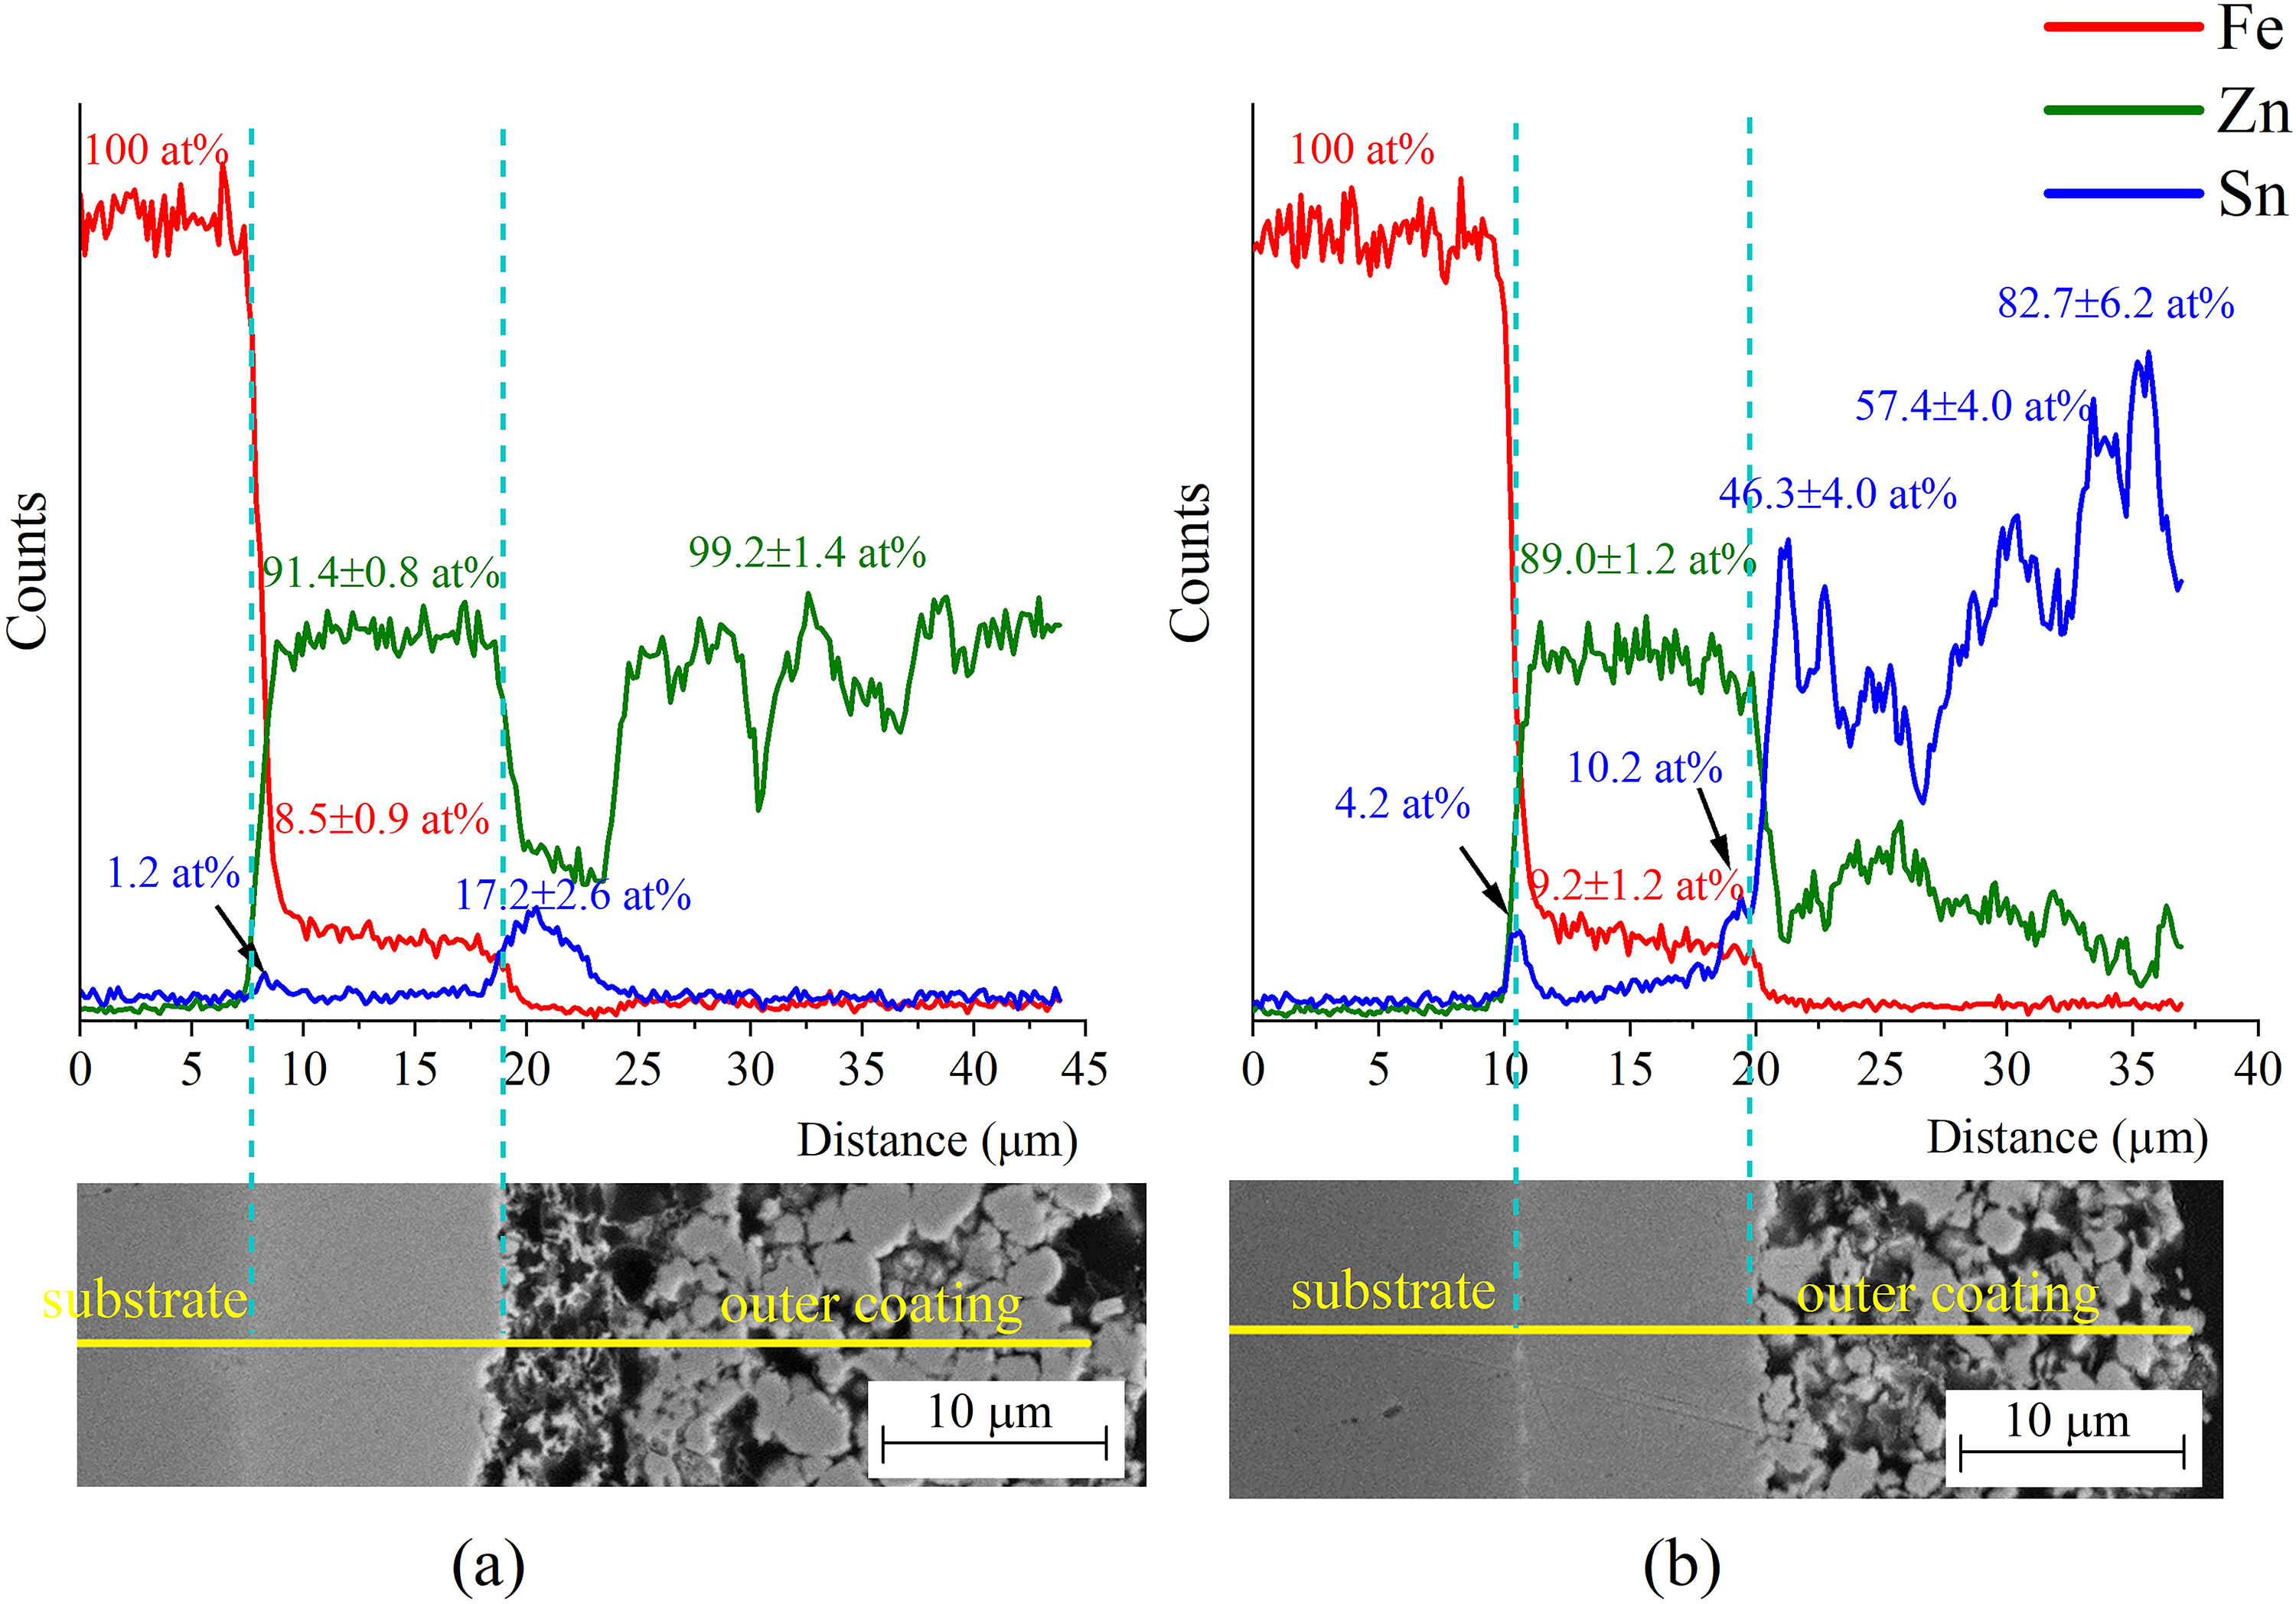
Elemental distributions in 60-min heat-treated (a) Zn and (b) ZnSn coatings.
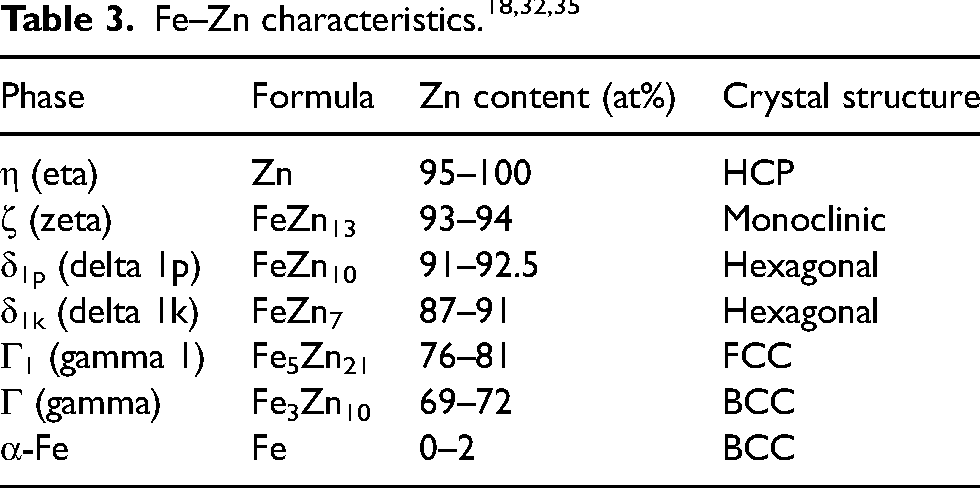
Table 3 summarises the intermetallic phases expected from the binary Fe–Zn phase diagram 18 and their approximate Zn content. δ phase is distinguished as δ1p-FeZn10 and δ1k-FeZn7 27 in this study, though δp (palisade) and δk (compact) are combined and referred to as δ-FeZn10 phase in recent publications due to their identical crystal structure.28,29 However, δ-FeZn7 has still been reported as δ or δk phase in some studies on galvannealed coatings30–32 and Fe–Zn couples.33,34 In the present work, Zn content of average 91.1–91.4 at% and 88.6–89.0 at% within the interfacial layer of heat-treated (30 and 60 min) Zn and ZnSn coatings, respectively, indicated the presence of δ1p-FeZn10 and δ1k-FeZn7 phases, as reported in previous work.16,17
Etching revealed the presence of several phases within the interfacial layer. Figures 9 and 10 show the columnar phase near the substrate interface in 30- and 60-min heat-treated Zn and ZnSn coatings, respectively. Previous works also reported such columnar structures in 30-min heat-treated coatings15–17 but were not observed in 15-min heat-treated coatings. 16
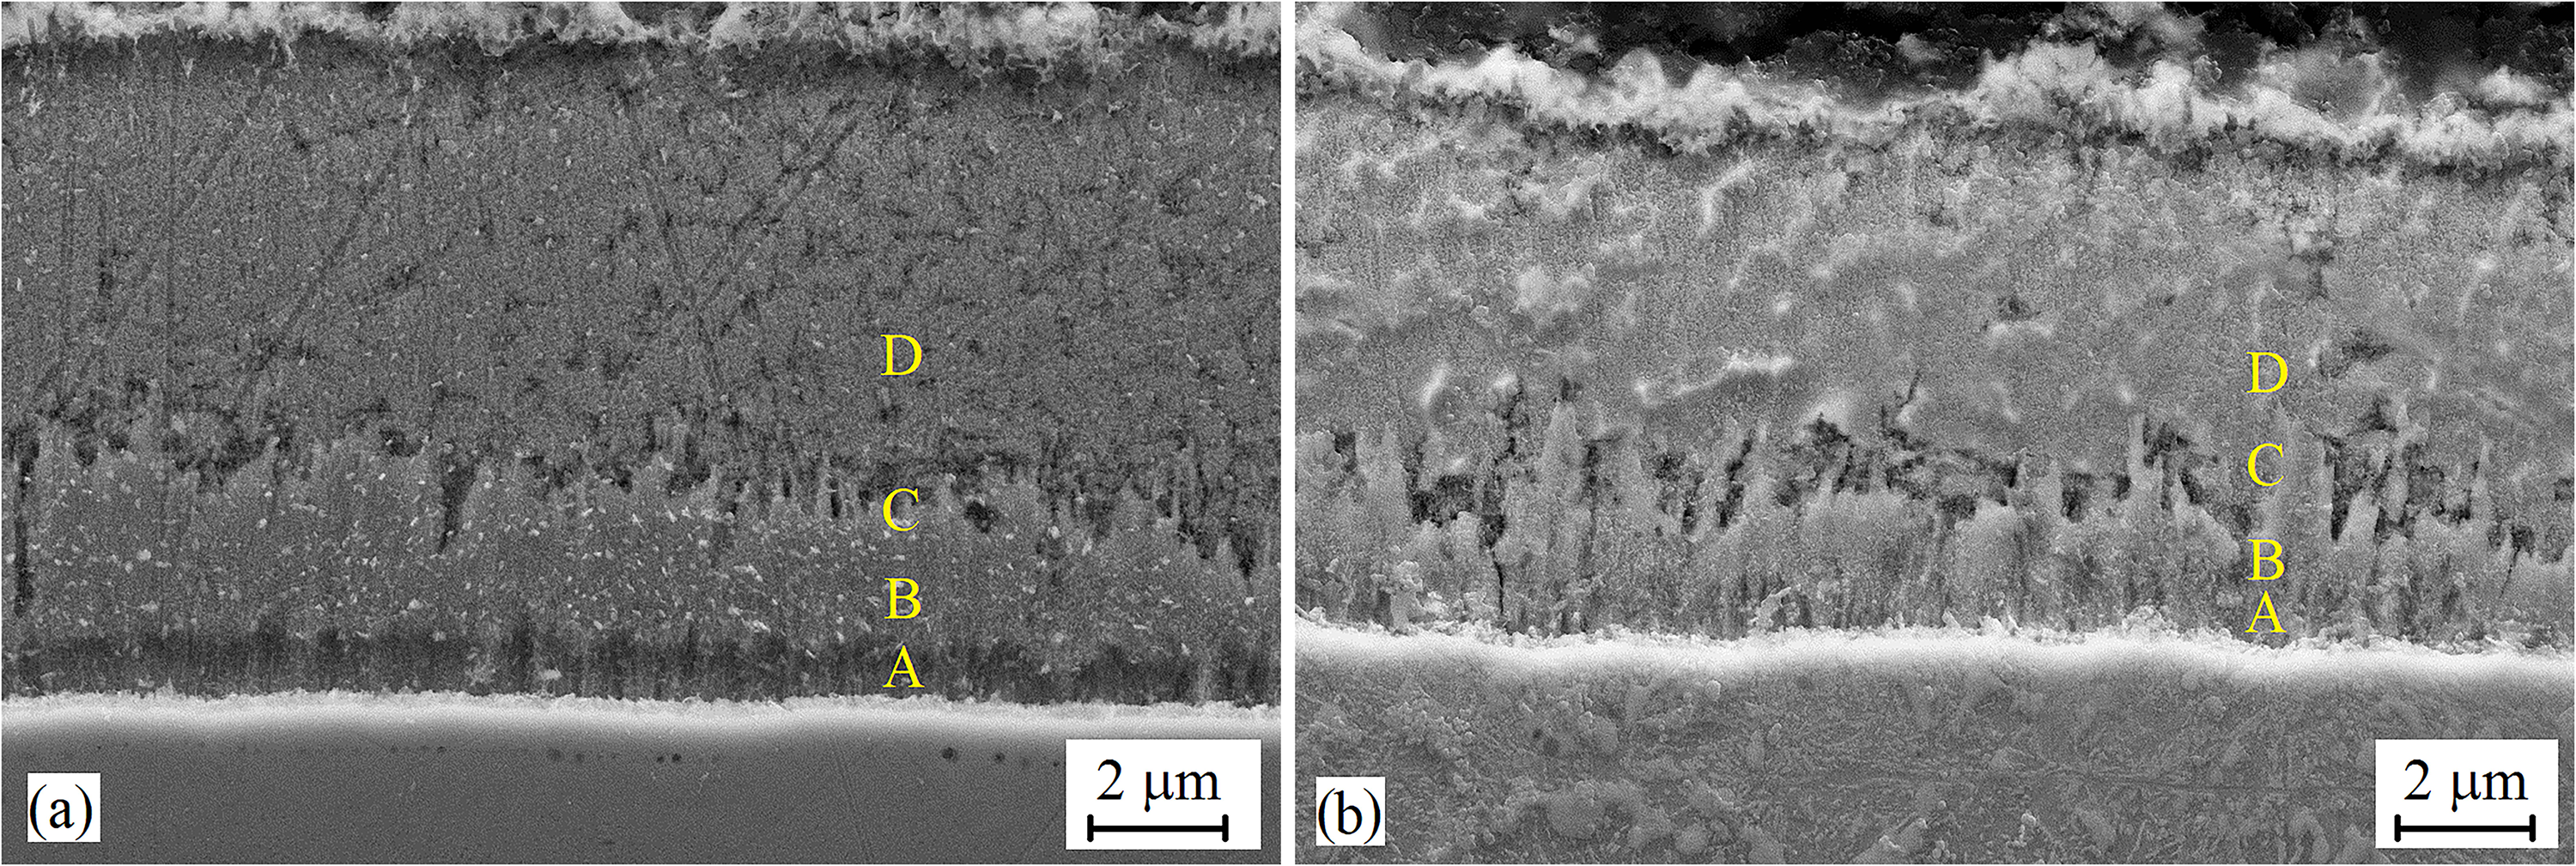
Scanning electron micrographs of columnar grains within the interfacial layer of etched (a) 30-min and (b) 60-min heat-treated Zn coatings.
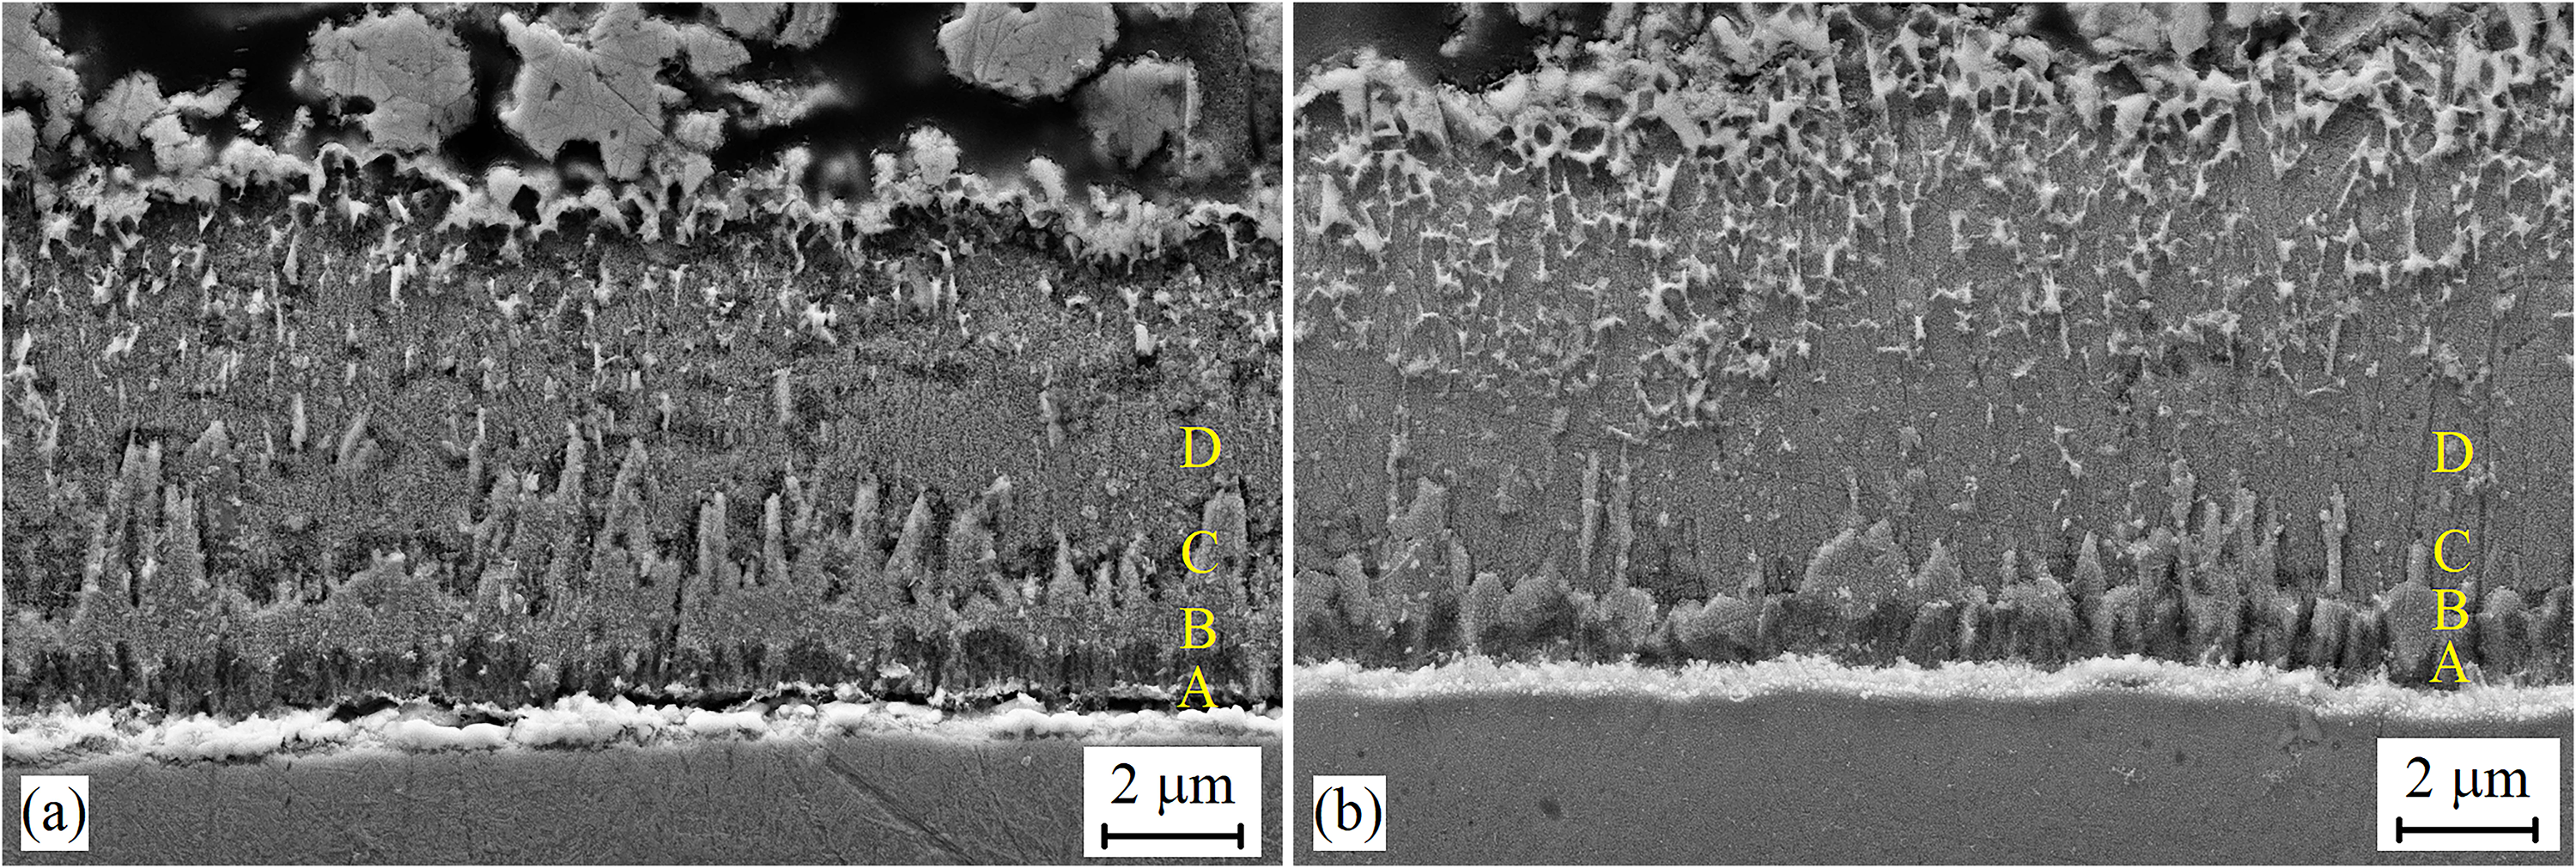
Scanning electron micrographs of columnar grains within the interfacial layer of etched (a) 30-min and (b) 60-min heat-treated ZnSn coatings.
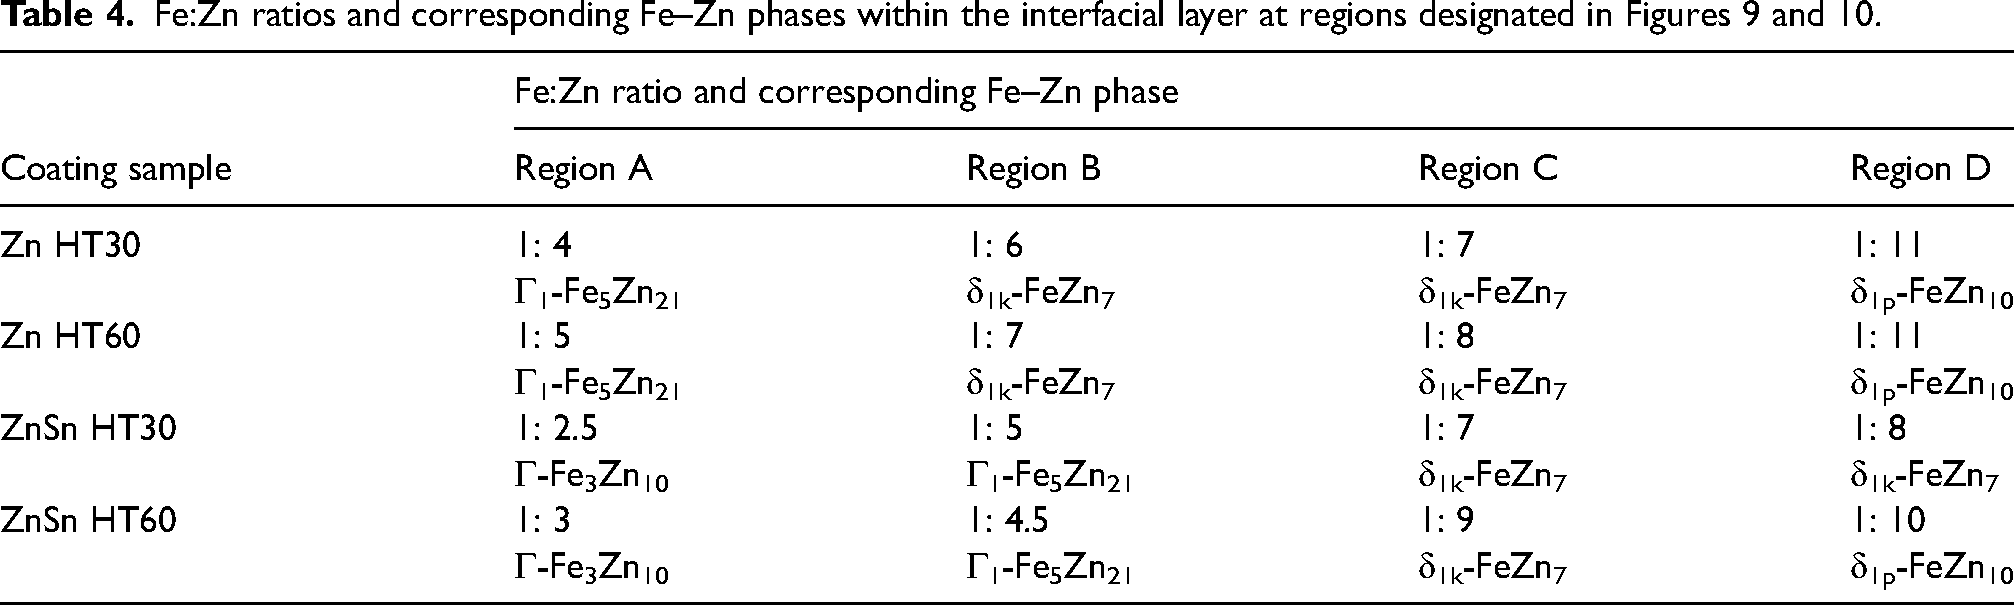
Compositional analyses within the interfacial layer were conducted at specific regions, including the columnar phase near the substrate interface and the middle region of the interfacial layer (designated as regions A, B, C and D in Figures 9 and 10), across all etched heat-treated Zn and ZnSn coatings. Table 4 summarises those regions’ Fe: Zn ratios and corresponding Fe–Zn phases. The interfacial layer exhibited the presence of the expected Fe–Zn intermetallic phases, that is, δ1p-FeZn10, δ1k-FeZn7, Γ1-Fe5Zn21 and Γ-Fe3Zn10 (Table 3). In a study of the phase evolution in galvannealed coatings that had been heat treated at 500°C for 20 and 30 s, EDS elemental composition analyses indicated the presence of δ-phase and Γ1 and Γ phases near the steel interface. 36 These phases were then confirmed by selected area diffraction (SAD) analysis in TEM. 37 Hence, in the present work, although TEM was not used to analyse the structure of the intermetallic phases, the EDS elemental composition analyses specified the presence of δ1p-FeZn10, δ1k-FeZn7, Γ1-Fe5Zn21 and Γ-Fe3Zn10 phases in heat-treated Zn and ZnSn coatings, which are consistent with expectations from the phase diagram 18 and data published by other researchers.36,37
Grazing incidence wide-angle X-ray scattering (GIWAXS)
Data collection from GIWAXS measurements
In order to select representative data from the GIWAXS measurements, 2D GIWAXS diffraction patterns from continuous scans and their corresponding 1D profiles were compared. Figure 11(a) and (b) shows the 2D diffraction patterns and the corresponding 1D profiles (Intensity vs Q), respectively, of ZnSn HT60 coating collected at every 100 μm scan, as illustrated in Figure 11(c). The diffraction rings (Figure 11(a)) from scan #1 exhibited extremely low intensity compared to those from scans #5 and #6, and the corresponding peaks in 1D profile (Figure 11(b)) were also very weak. This is because scan #1 was taken from a region near the mounting resin, while scans #5 and #6 were taken from regions consisting mainly of the steel substrate.
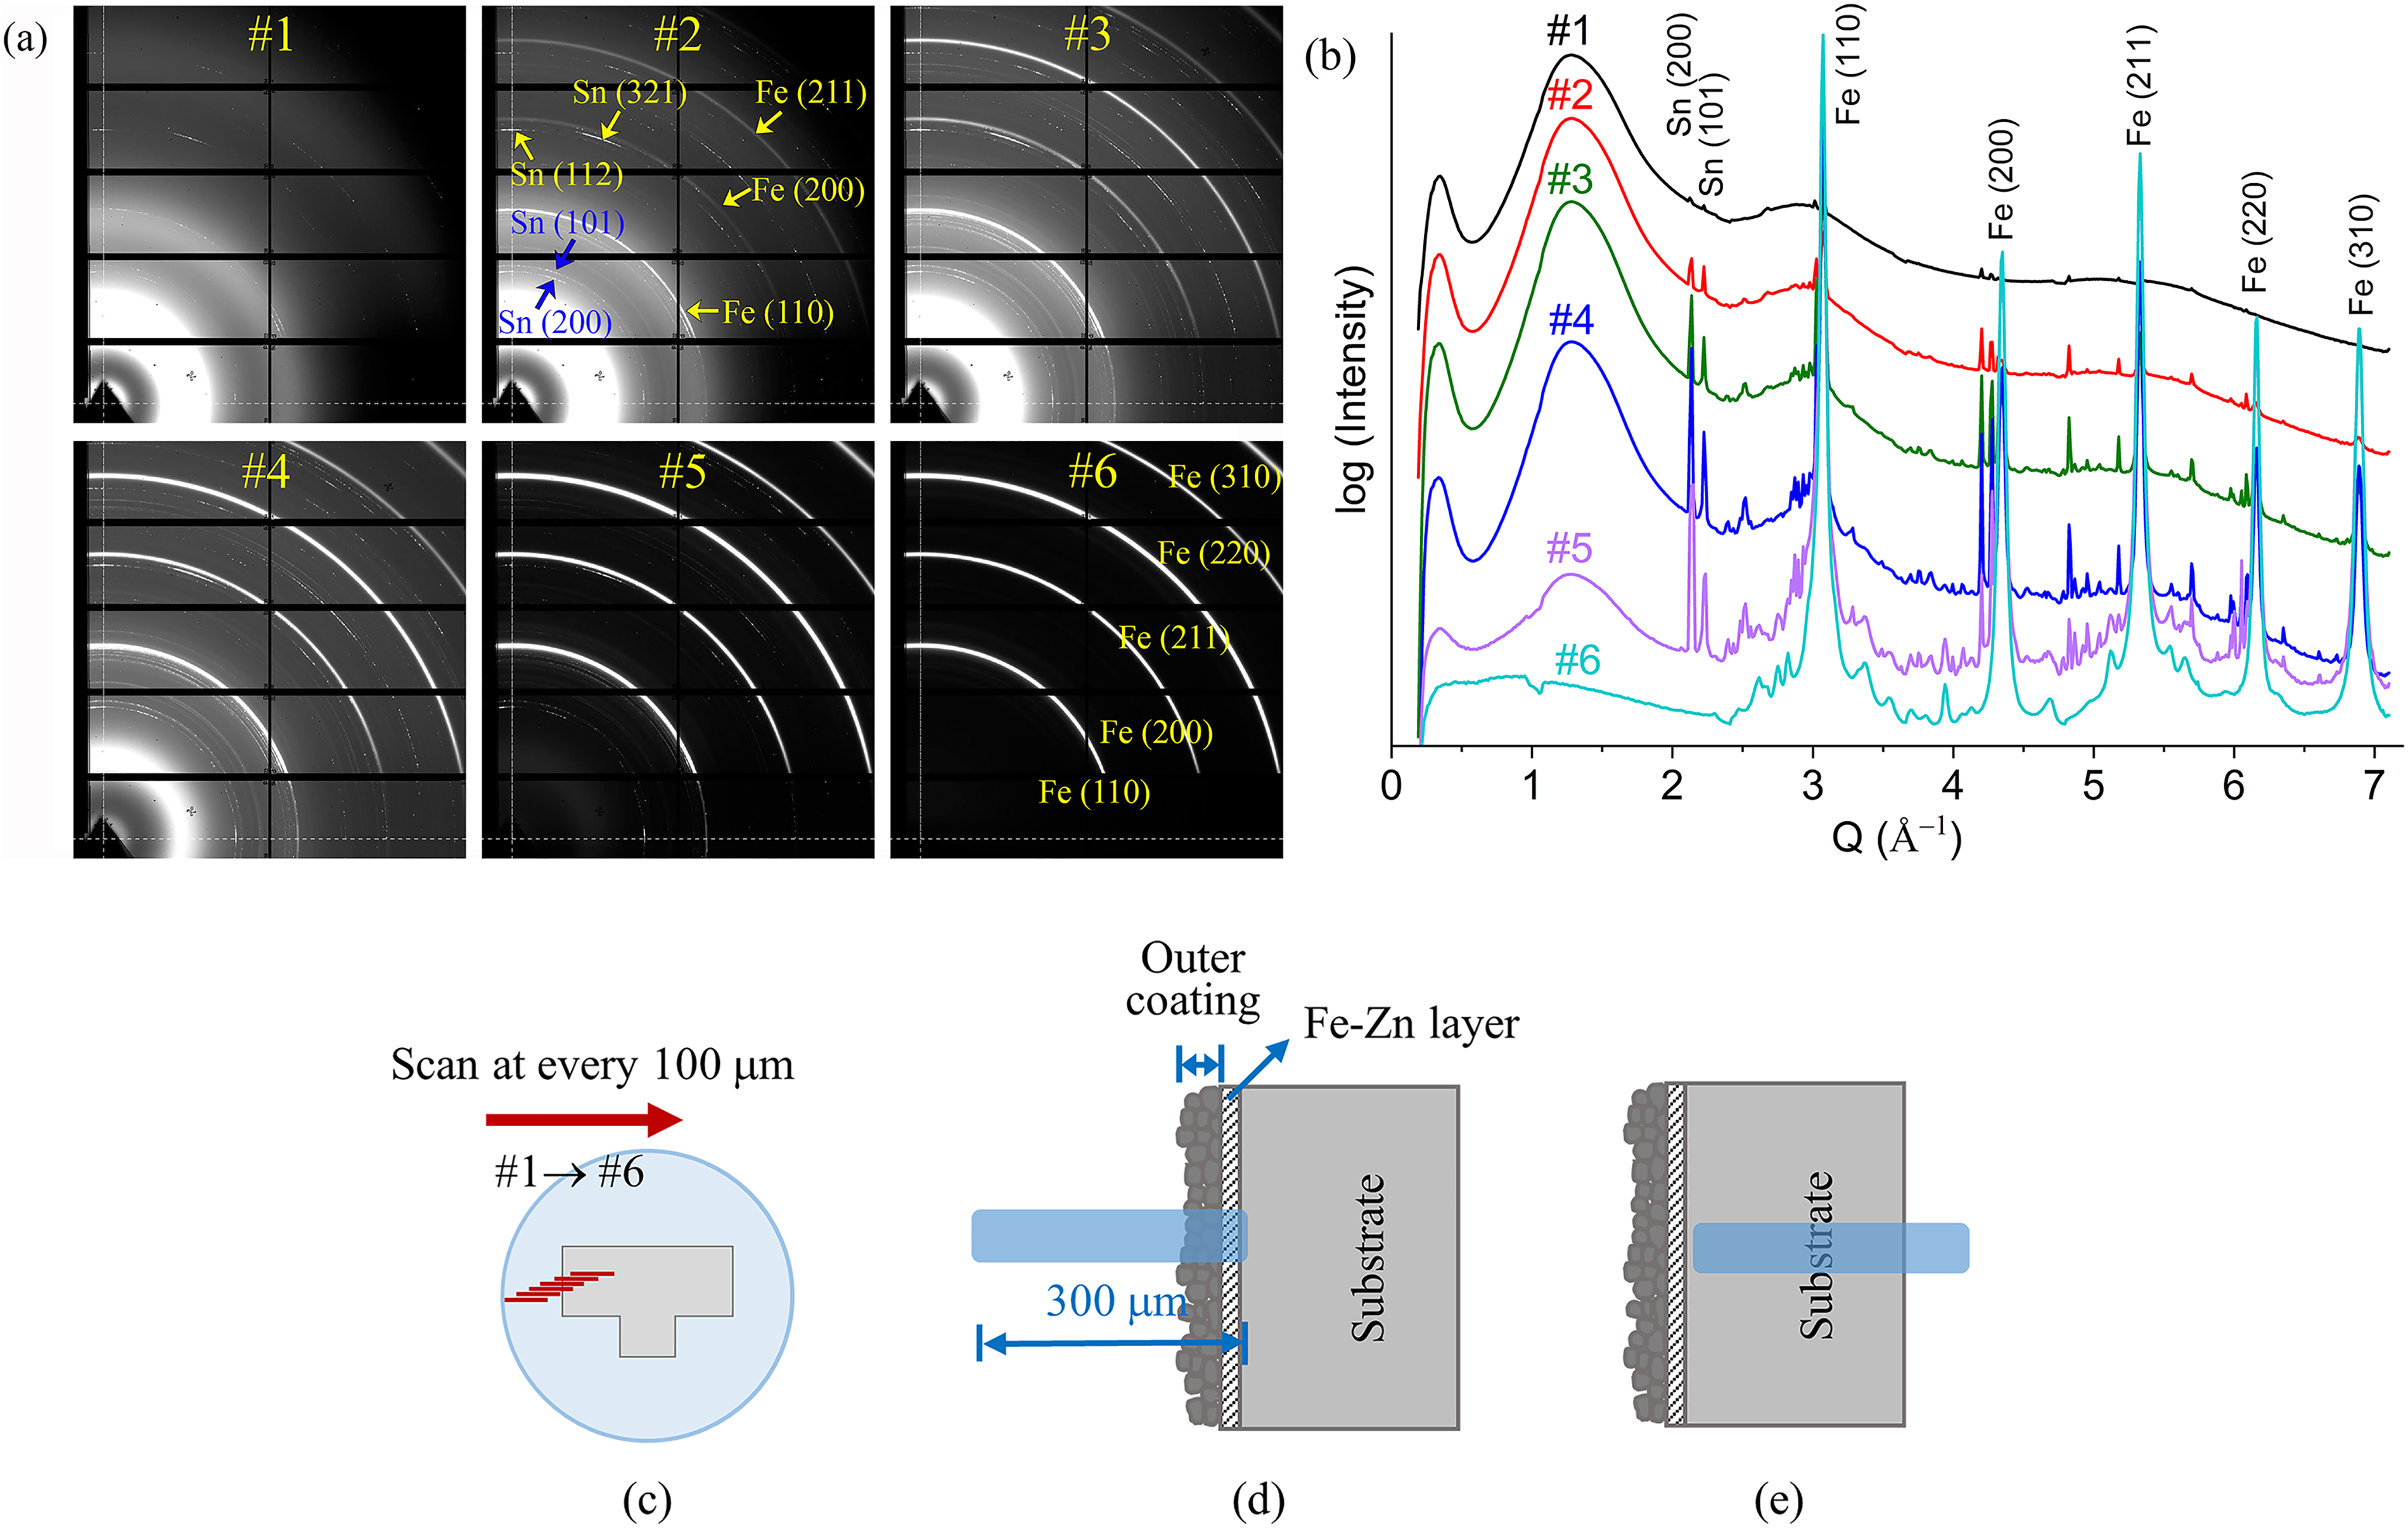
(a) 2D GIWAXS diffraction patterns and (b) corresponding 1D GIWAXS profiles of ZnSn HT60 coating collected from (c) the continuous scans performed across the cross-sectional sample at every 100 μm from the region near epoxy towards the middle of the sample. Schematic of the 300 μm beam impinging on the cross-sectional surface that consists mainly of (d) outer coating and Fe–Zn layer and (e) substrate.
By comparing the diffraction rings from scans #1 and #2 (Figure 11(a)), more continuous rings of Sn (200), (101) (112) and (321) and rings of Fe (110), (200) and (211) were observed in the pattern from scan #2. This indicates that the 300 μm beam had started to impinge on the coating and steel substrate but was still mainly on the outer coating and the Fe–Zn layer (as illustrated in Figure 11(d)). The diffraction rings of Fe (110), (200), (211), (220) and (310) became evident with increasing intensity from scan #2 to #6. The ring pattern from scan #5 indicates that the beam had impinged on the coating but mainly on the steel substrate, while the one from scan #6 indicates that the beam impinged only on the steel substrate (as illustrated in Figure 11(e)). There were more scans performed after scan #6 (Figure 11(c)) towards the middle of the sample, and these patterns/profiles duplicated each other (not shown here); hence, only pattern/profile #6 is shown as it is representative of the steel substrate. Compared with scans #5 and #6, patterns from scans #3 and #4 show comparatively less intense Fe rings but more evident and continuous rings for Sn and other elements. This indicates that the beam impinged mainly on the outer coating and the Fe–Zn layer but partly on the steel substrate (as illustrated in Figure 11(d)). By comparing the diffraction patterns and profiles collected continuously in each sample, the profiles that consisted mainly of the peaks from the outer coating and the Fe–Zn layer (i.e. profiles #3 and #4) were used for the subsequent analyses.
Comparison between GIWAXS and XRD profiles
GIWAXS and XRD profiles were compared to check whether GIWAXS profiles exhibited the same peaks as XRD profiles. The diffraction peaks from 60-min heat-treated ZnSn coating are shown in Figure 12 as an example. The d-spacings in the GIWAXS profile (Figure 12(c)) were calculated from the Q data, and the diffraction intensities are displayed using a log scale for distinct observation.
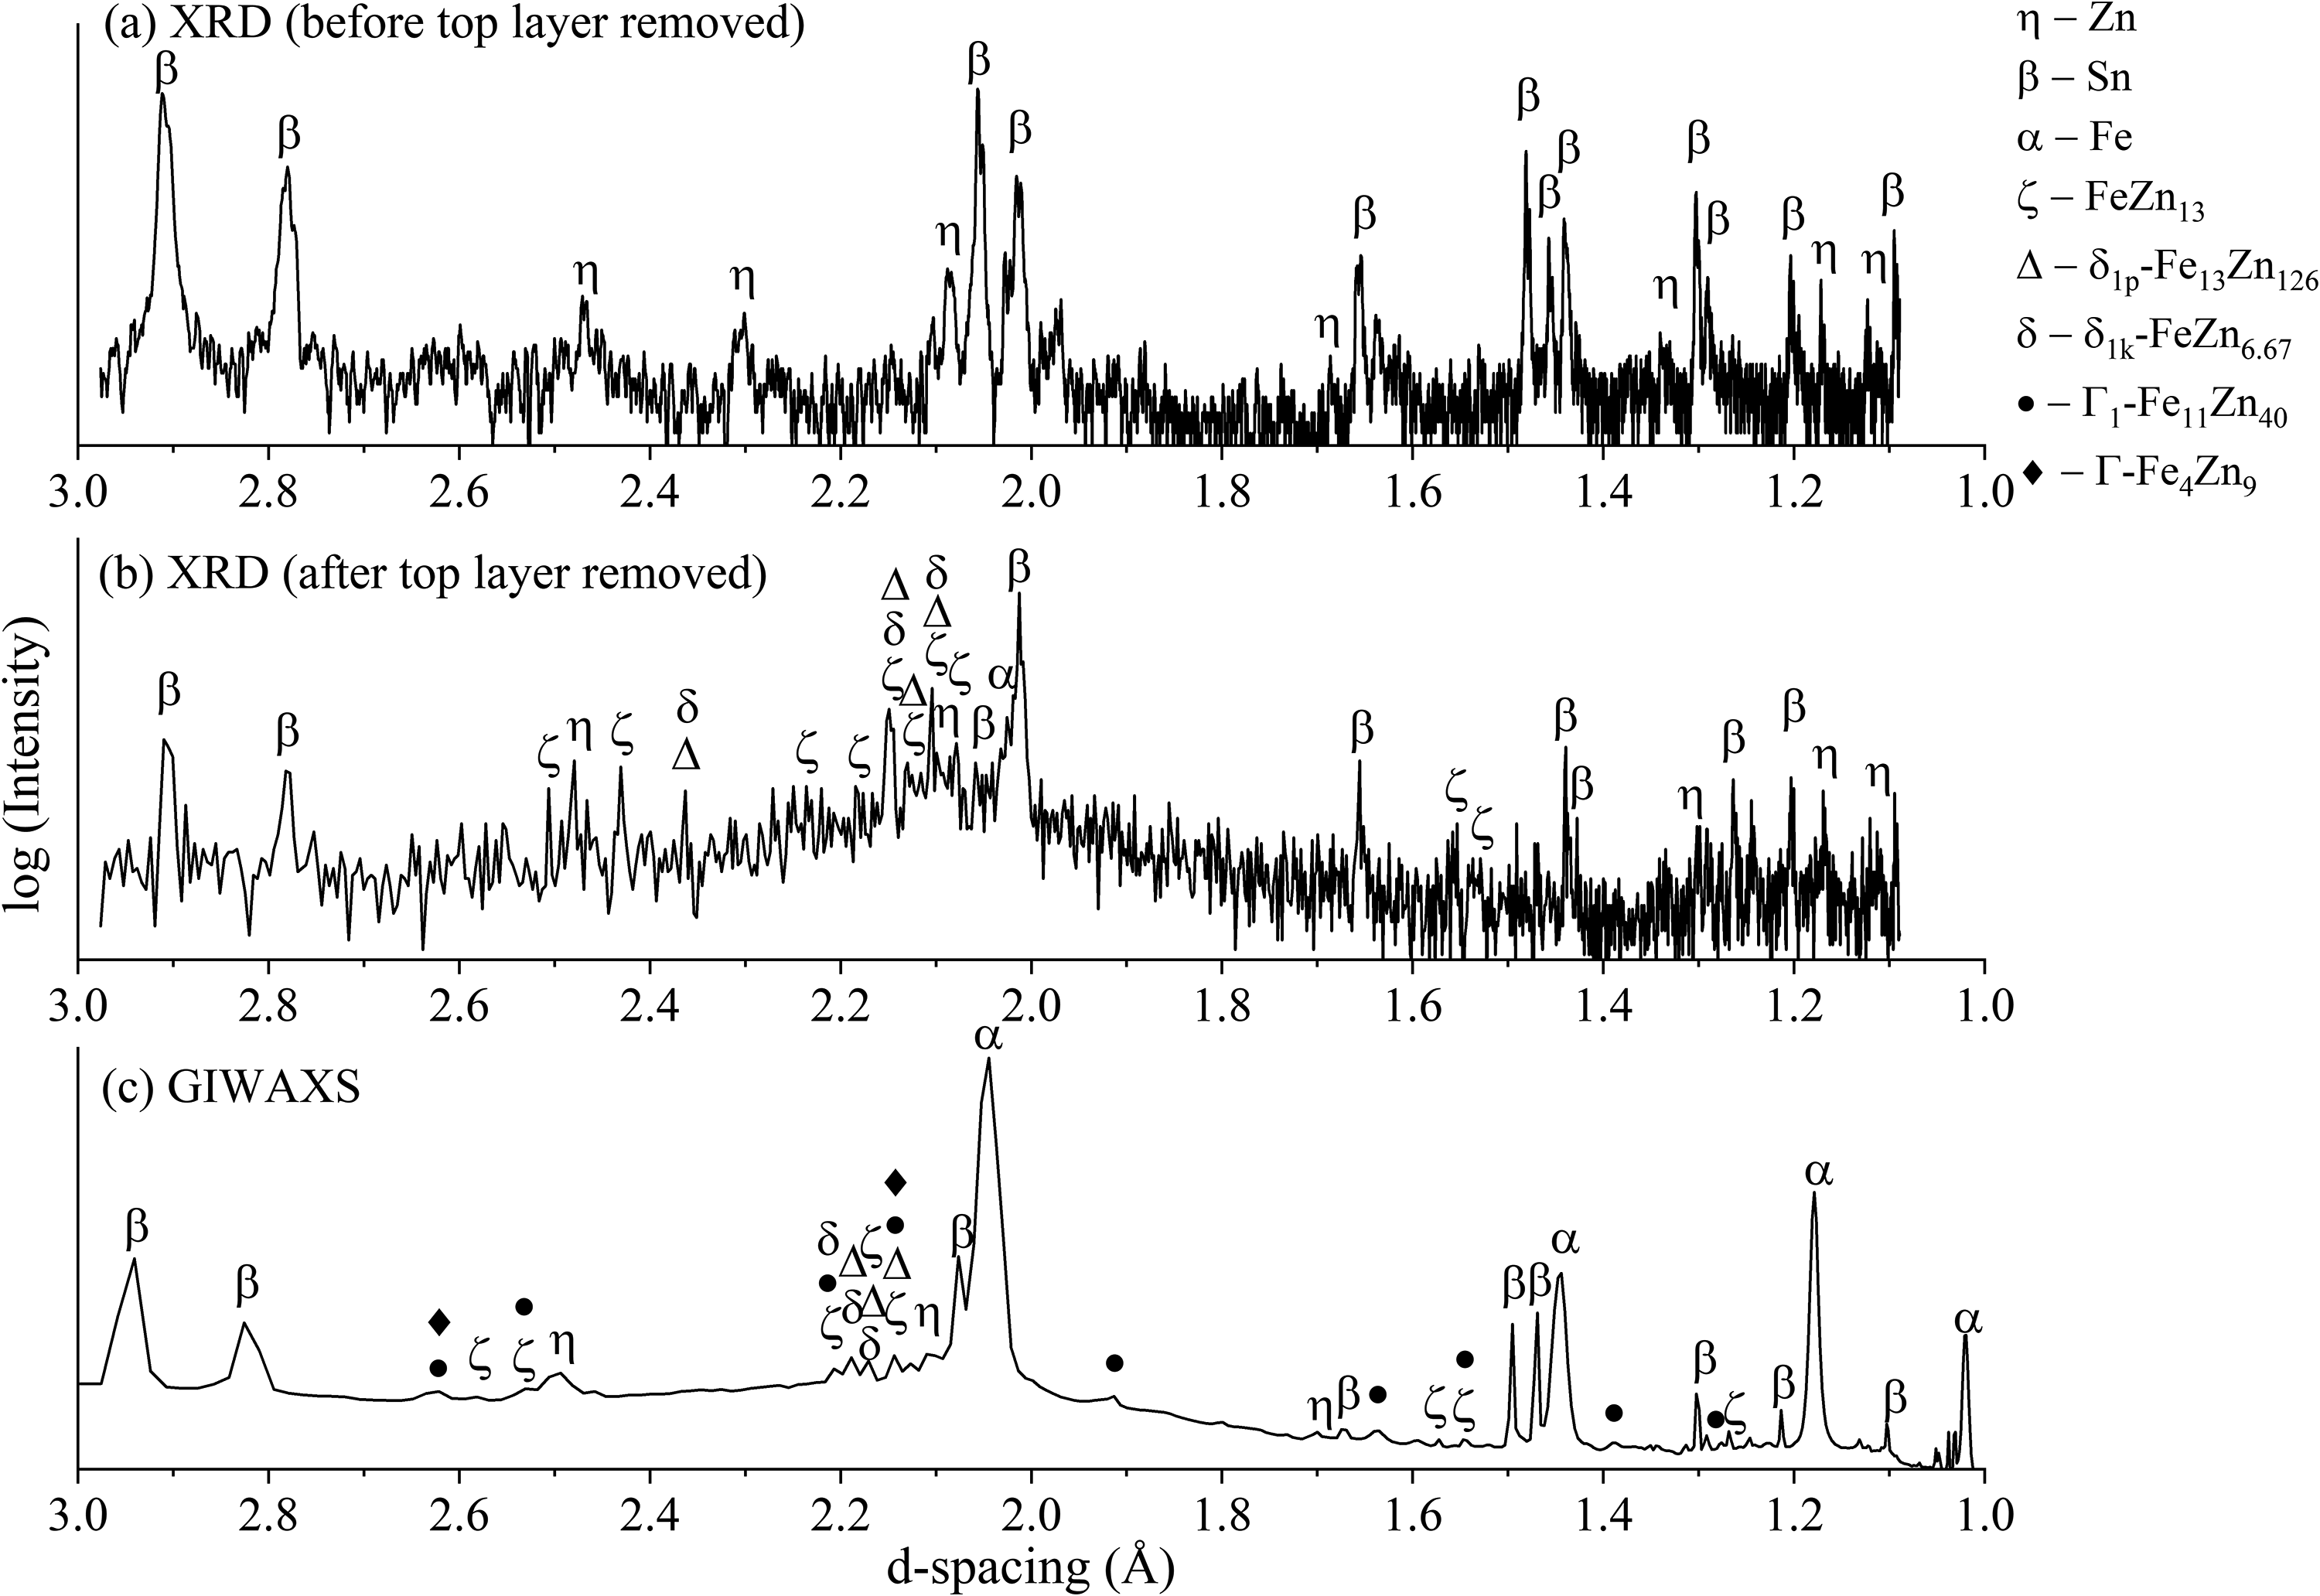
Diffraction profiles of 60-min heat-treated ZnSn coating obtained using (a) XRD before the top coating layer was removed, (b) XRD after the top coating layer was removed and (c) GIWAXS.
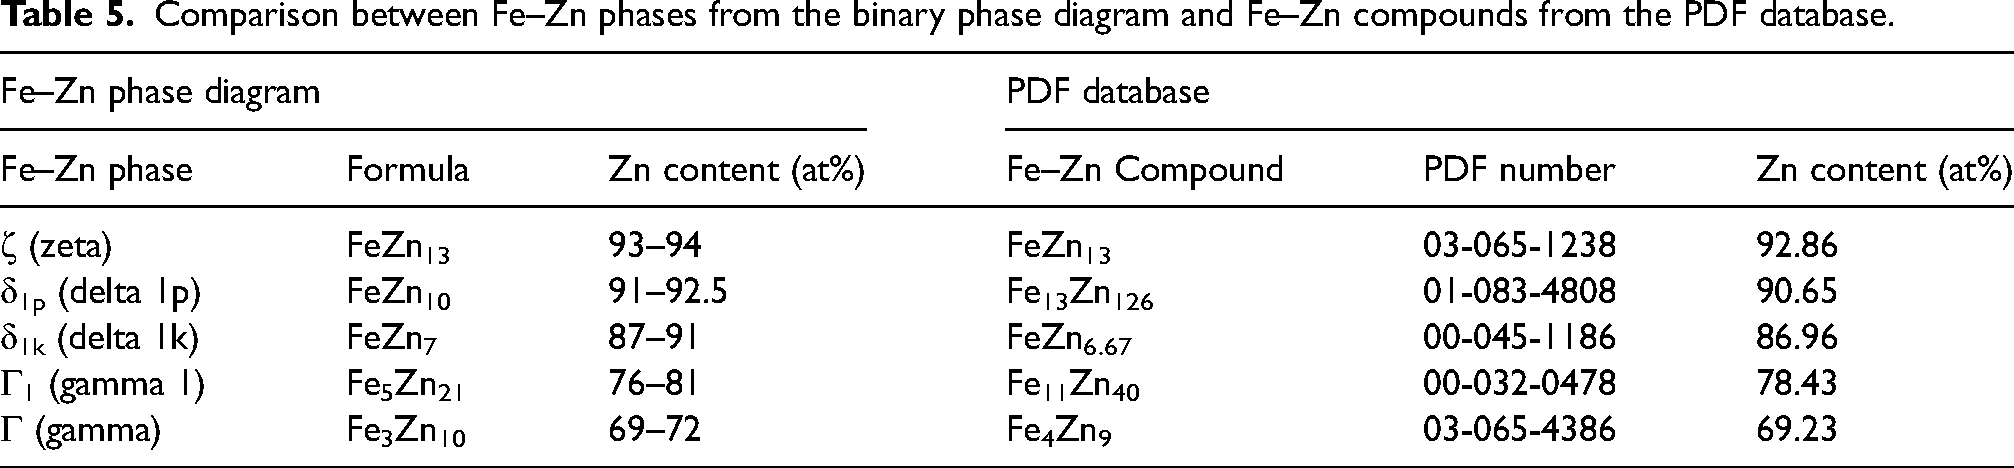
The XRD profile of ZnSn HT60 (Figure 12(a)) exhibits the peaks of Zn and Sn, but not Fe–Zn intermetallic phases because the maximum penetration depths for Zn and Sn at 2θ of 90° are 19.8 and 4.5 μm, respectively, as described in previous works.15–17 Since the outer layer of ZnSn HT60 coating consisted of approximately 15 μm Sn (Figure 7(b)), the X-ray could not penetrate the outer coating to reach the interfacial layer. After the removal of the top layer of the coating by polishing of planar sections, peaks of ζ-FeZn13, δ1p-Fe13Zn126 and δ1k-FeZn7 (Table 5) were then detected, especially in between d-spacing of 2.0 and 2.2 Å (Figure 12(b)). Table 5 compares the Zn content of the expected Fe–Zn phases from the Fe–Zn binary phase diagram 18 and the Fe–Zn compounds from the PDF database. The presence of ζ, δ1p and δ1k phases matched with the EDS elemental distribution (Elemental distributions and phases formed after heat treatment section) in which the δ-phase was detected as the major phase formed within the intermetallic layer. In addition, EDS elemental composition analyses indicate the presence of Γ-Fe3Zn10 and Γ1-Fe5Zn21 phases in heat-treated coatings (Table 4); however, XRD did not detect their phases. This may be due to their limited volume fractions below the detection of XRD or the XRD peaks overlapping with those of δ and ζ phases.15–17 Moreover, the background noise in XRD profiles also caused difficulty distinguishing real diffraction peaks, and hence, peaks of Γ1 and Γ phases may have been overlooked. Similar findings were reported from studies of galvannealed coatings where Γ/Γ1 phases were observed in SEM but were not detected by XRD.38,39
Comparison between Fe–Zn phases from the binary phase diagram and Fe–Zn compounds from the PDF database.
Unlike XRD profiles, GIWAXS profiles exhibited more distinct peaks without background noise (Figure 12(c)). This was due to its higher resolution capability, which provides a higher signal-to-noise ratio than that of XRD. Strong Fe peaks are observed in GIWAXS profiles compared to XRD profiles because the beam impinged on the cross-sectional surface that consisted mainly of Fe–substrate. In contrast, the beam in XRD measurement impinged on the surface of the coating, and due to the limitation of X-ray penetration depth, very limited X-rays had reached the Fe–substrate.
From the comparison of Fe, Zn and Sn peaks between GIWAXS and XRD profiles, a constant shift of approximately 0.015–0.025 Å to the left was observed in GIWAXS profiles. This could be due to an error related to the setup because the SAXS equipment is not commonly used for WAXS measurements. The constant shift could also be due to the discrepancies between the diffraction patterns collected with a Bragg–Brentano system (i.e. XRD) and a system with an area detector (i.e. GIWAXS). In a Bragg–Brentano geometry, the 2θ resolution depends on the divergence slit and receiving slit in the diffractometer plane. In contrast, in a diffractometer with an area detector, the 2θ resolution is controlled by the spatial resolution of the detector and the sample-to-detector distance. 40 In Bragg–Brentano geometry, the collection of the complete diffraction pattern can only be done by a single scan; however, with an area detector, several 2θ ranges can be collected simultaneously. Sulyanov, Popov 41 reported in their study using a two-dimensional detector for X-ray powder diffractometry that the shorter the sample-detector distance, the lower the accuracy of the Bragg-angle determination. In the transmission mode, the authors found that the diffraction patterns of the studied reference powders had 2θ deviations ranging from 0.001° to 0.01°, and when the sample-detector distance was shortened to 400 mm, the maximum deviation observed was Δ(2θ) = 0.02°. In the reflection mode with a sample-detector distance of 700 mm, the maximum deviation observed on the same reference powders was Δ(2θ) = 0.013°.
Hence, the shift in peaks observed in the present work could also be due to discrepancies between the Bragg–Brentano and 2-D detector systems. As a result, a correction shift of 0.015–0.025 Å was considered by using the peaks of Fe as references. This correction shift was applied in the following analyses in this study.
GIWAXS profiles of heat-treated Zn and ZnSn coatings
To examine the effects of heat treatment duration on the evolution of Fe–Zn intermetallic phases in Zn and ZnSn coatings, 2D GIWAXS diffraction patterns and corresponding 1D GIWAXS profiles of Zn and ZnSn coatings without heat treatment and with 15-, 30- and 60-min heat treatment are compared in Figures 13–16.
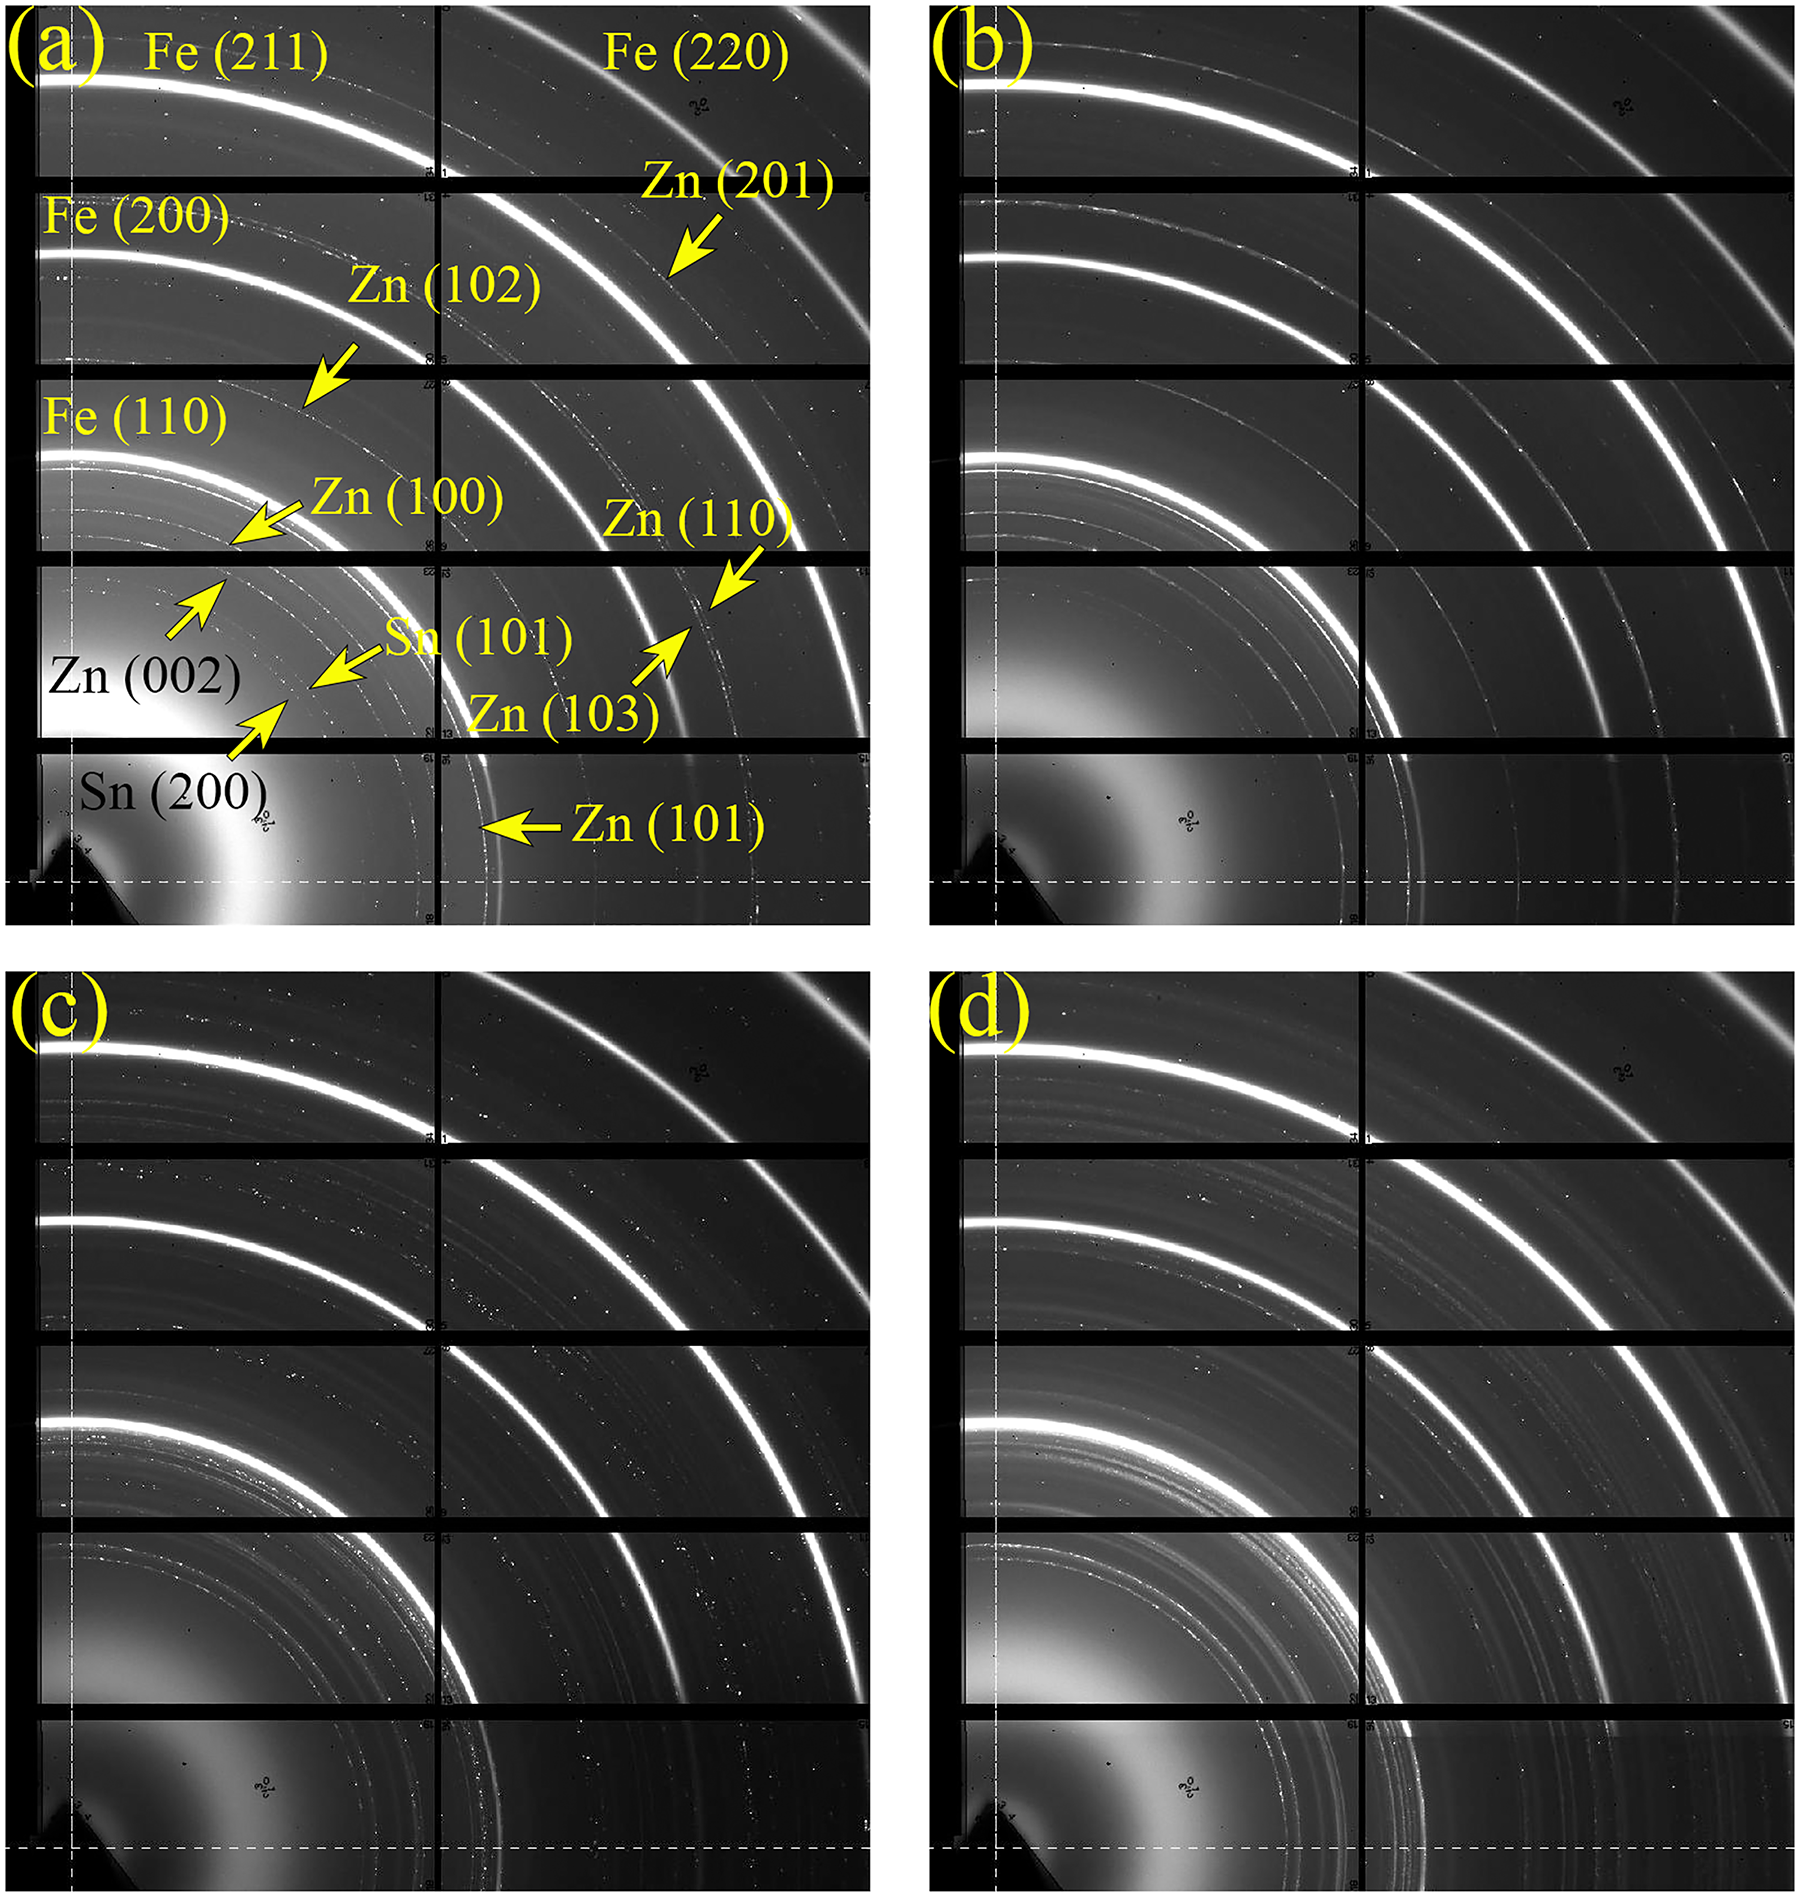
2D GIWAXS diffraction patterns of Zn coatings (a) as plated, and after heat treatment for (b) 15 min, (c) 30 min and (d) 60 min.
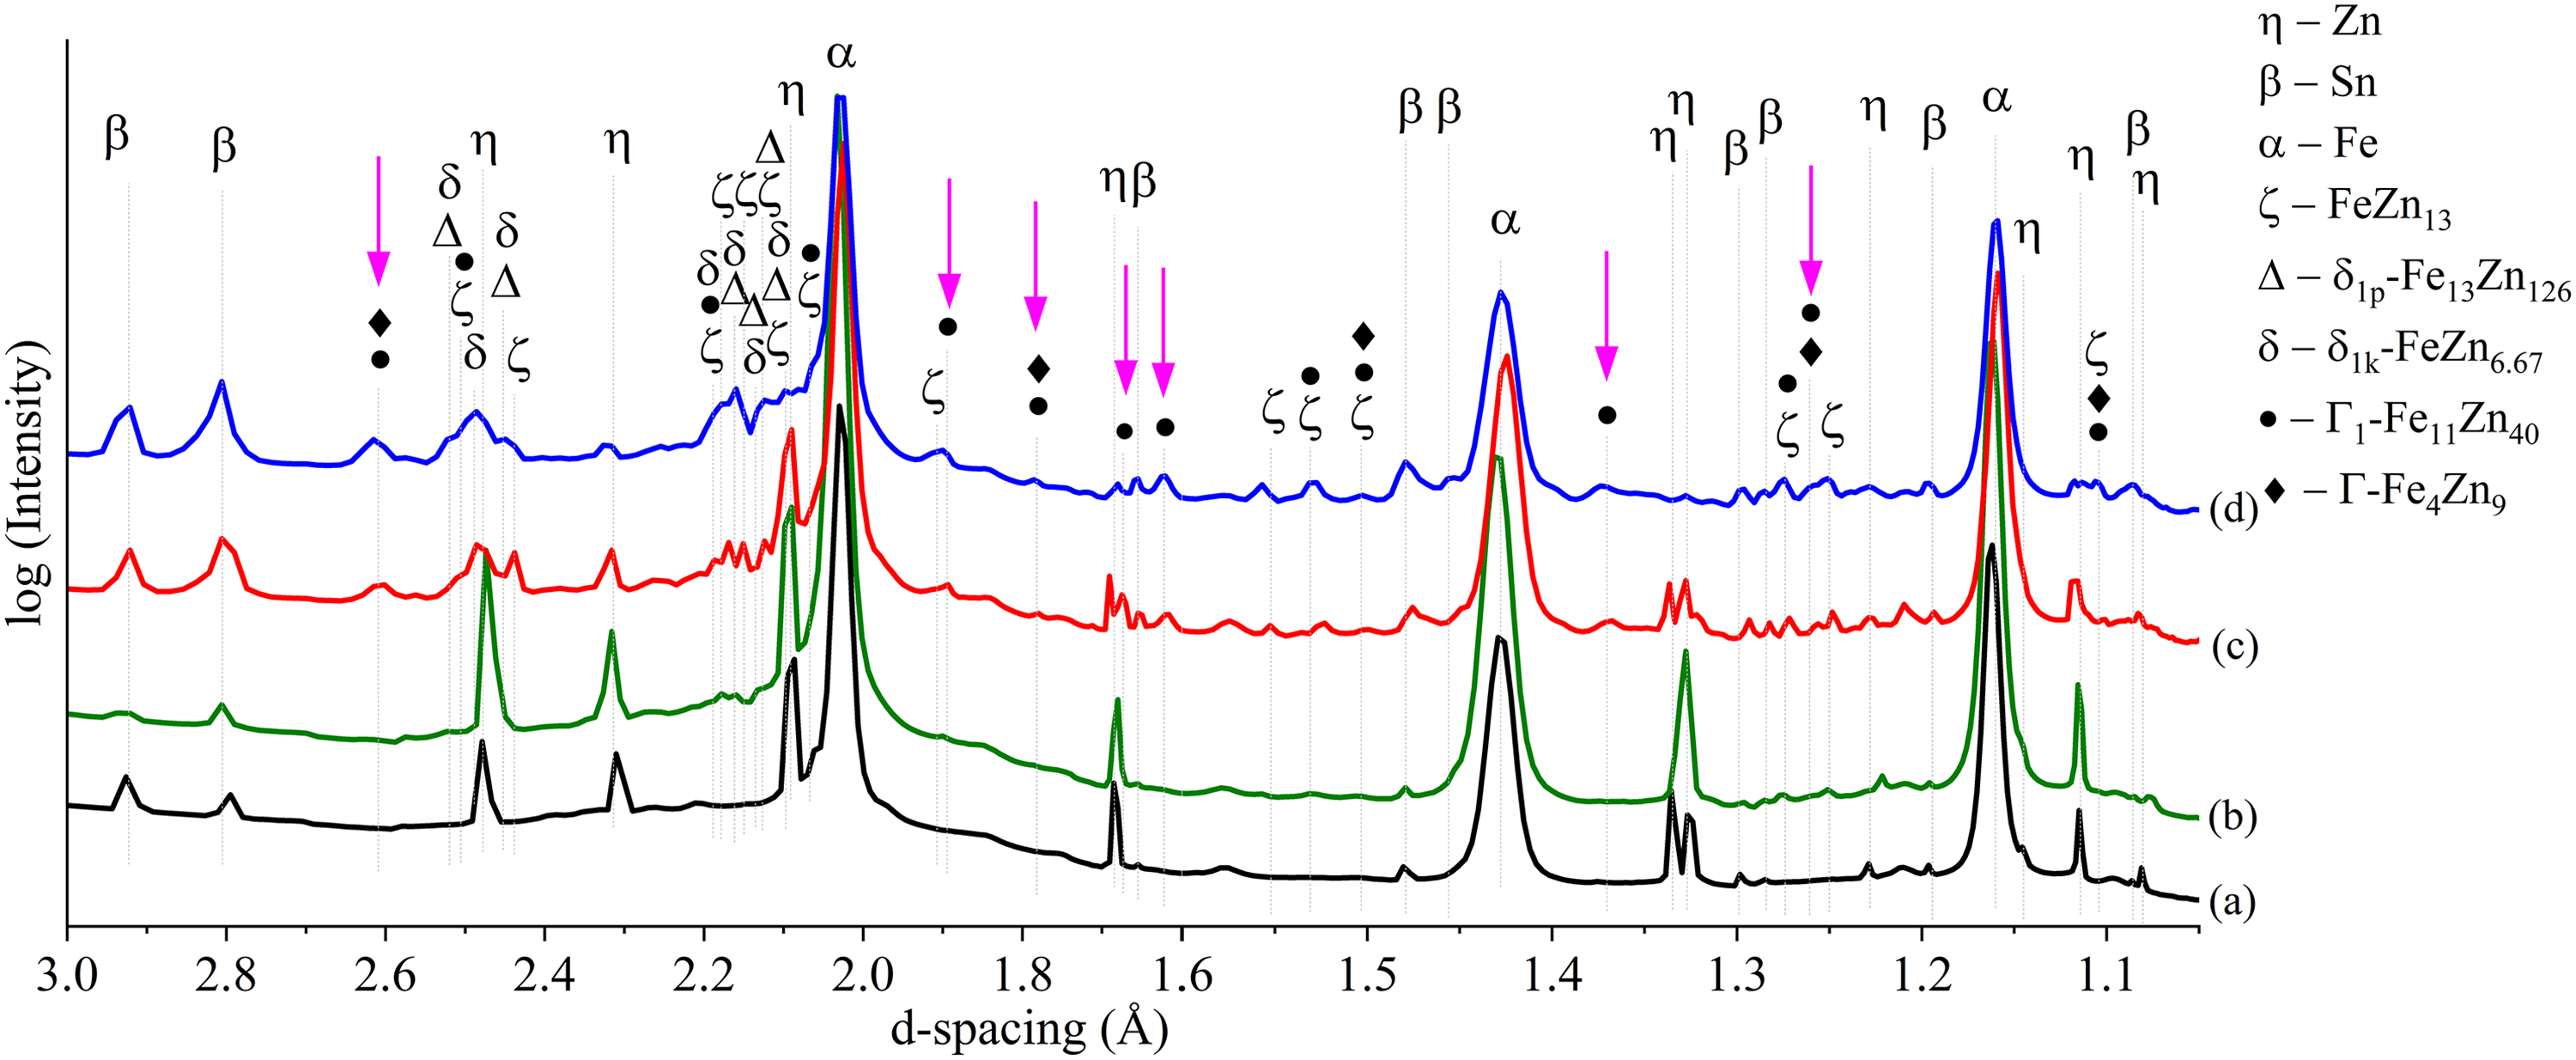
1D GIWAXS profiles of Zn coatings (a) as plated, and after heat treatment for (b) 15 min, (c) 30 min and (d) 60 min.
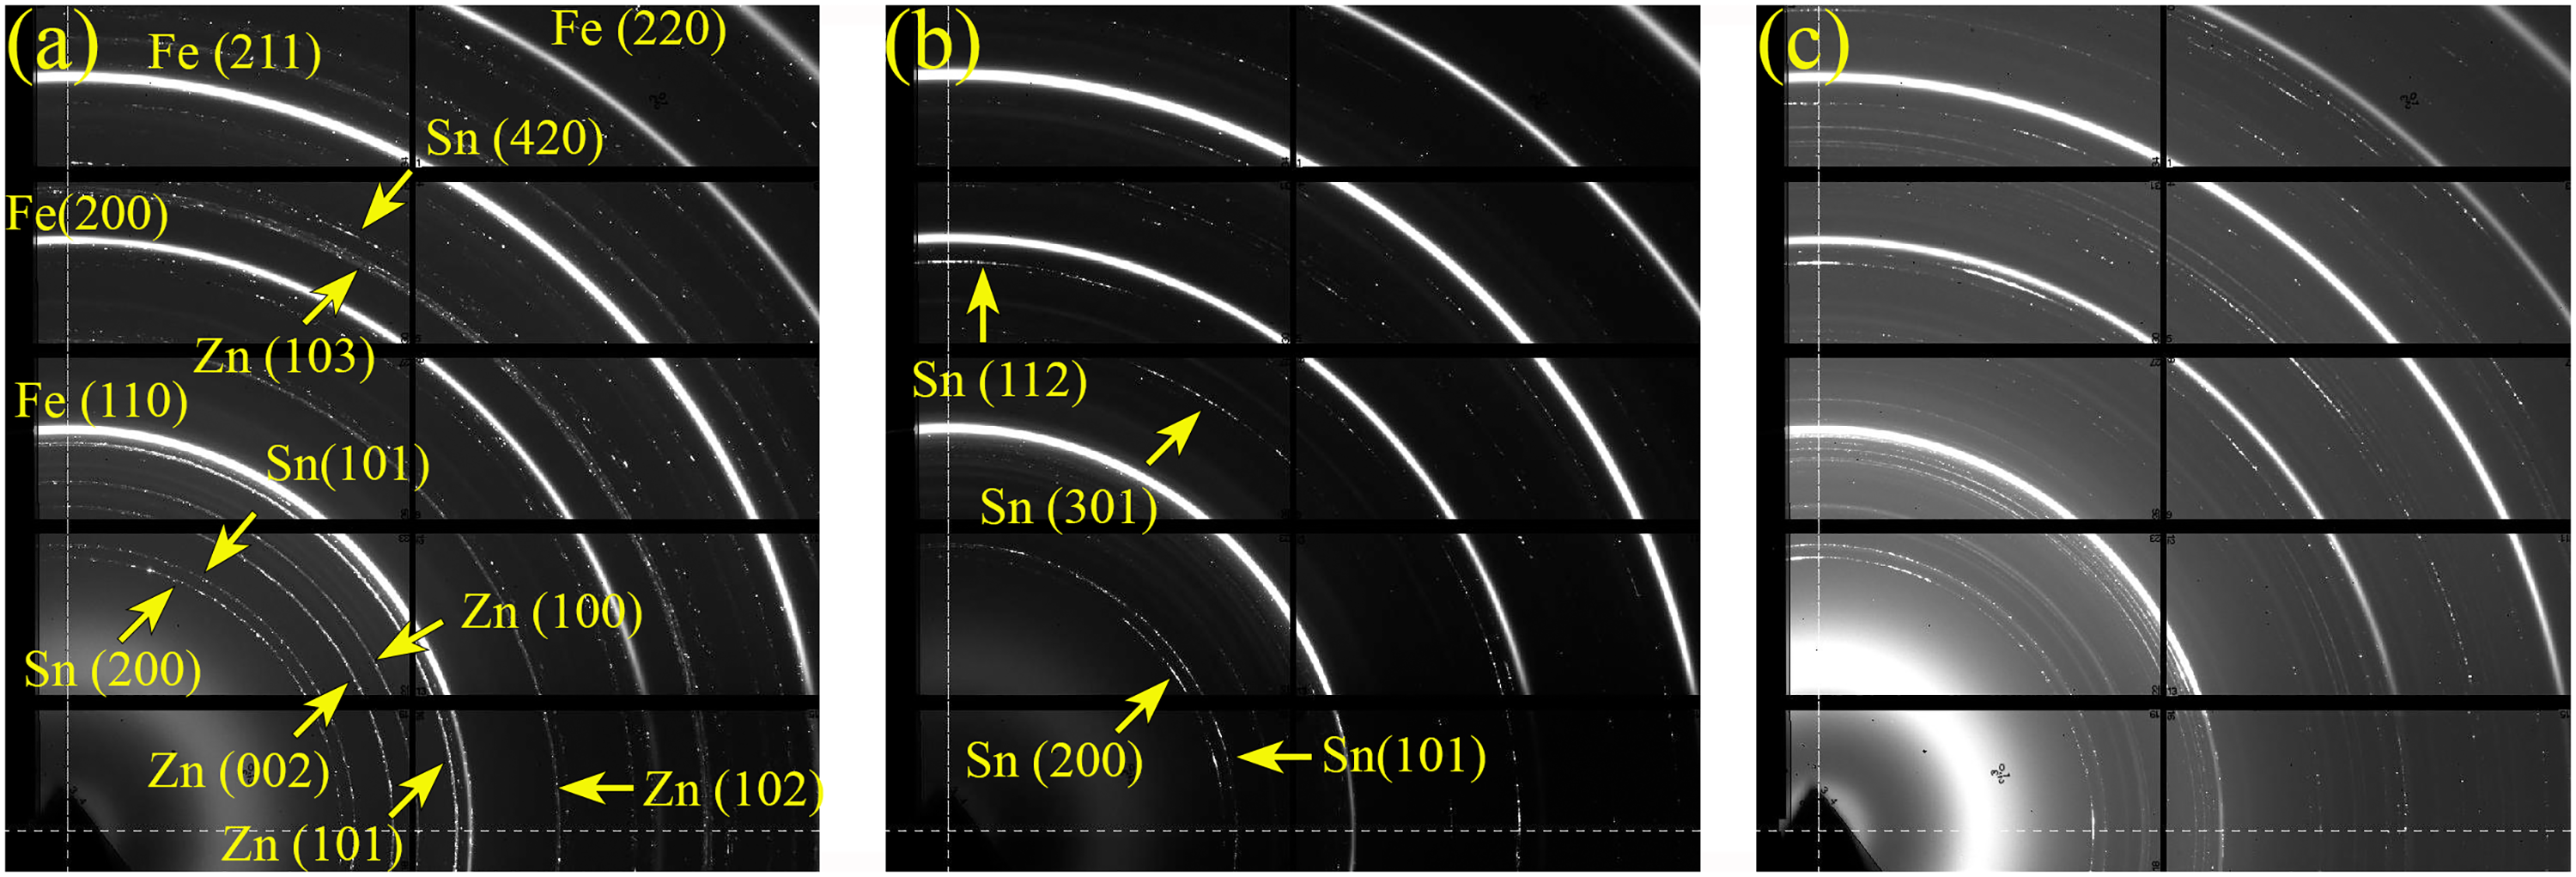
2D GIWAXS diffraction patterns of ZnSn coatings (a) as plated, and heat treated for (b) 30 min and (c) 60 min, respectively.
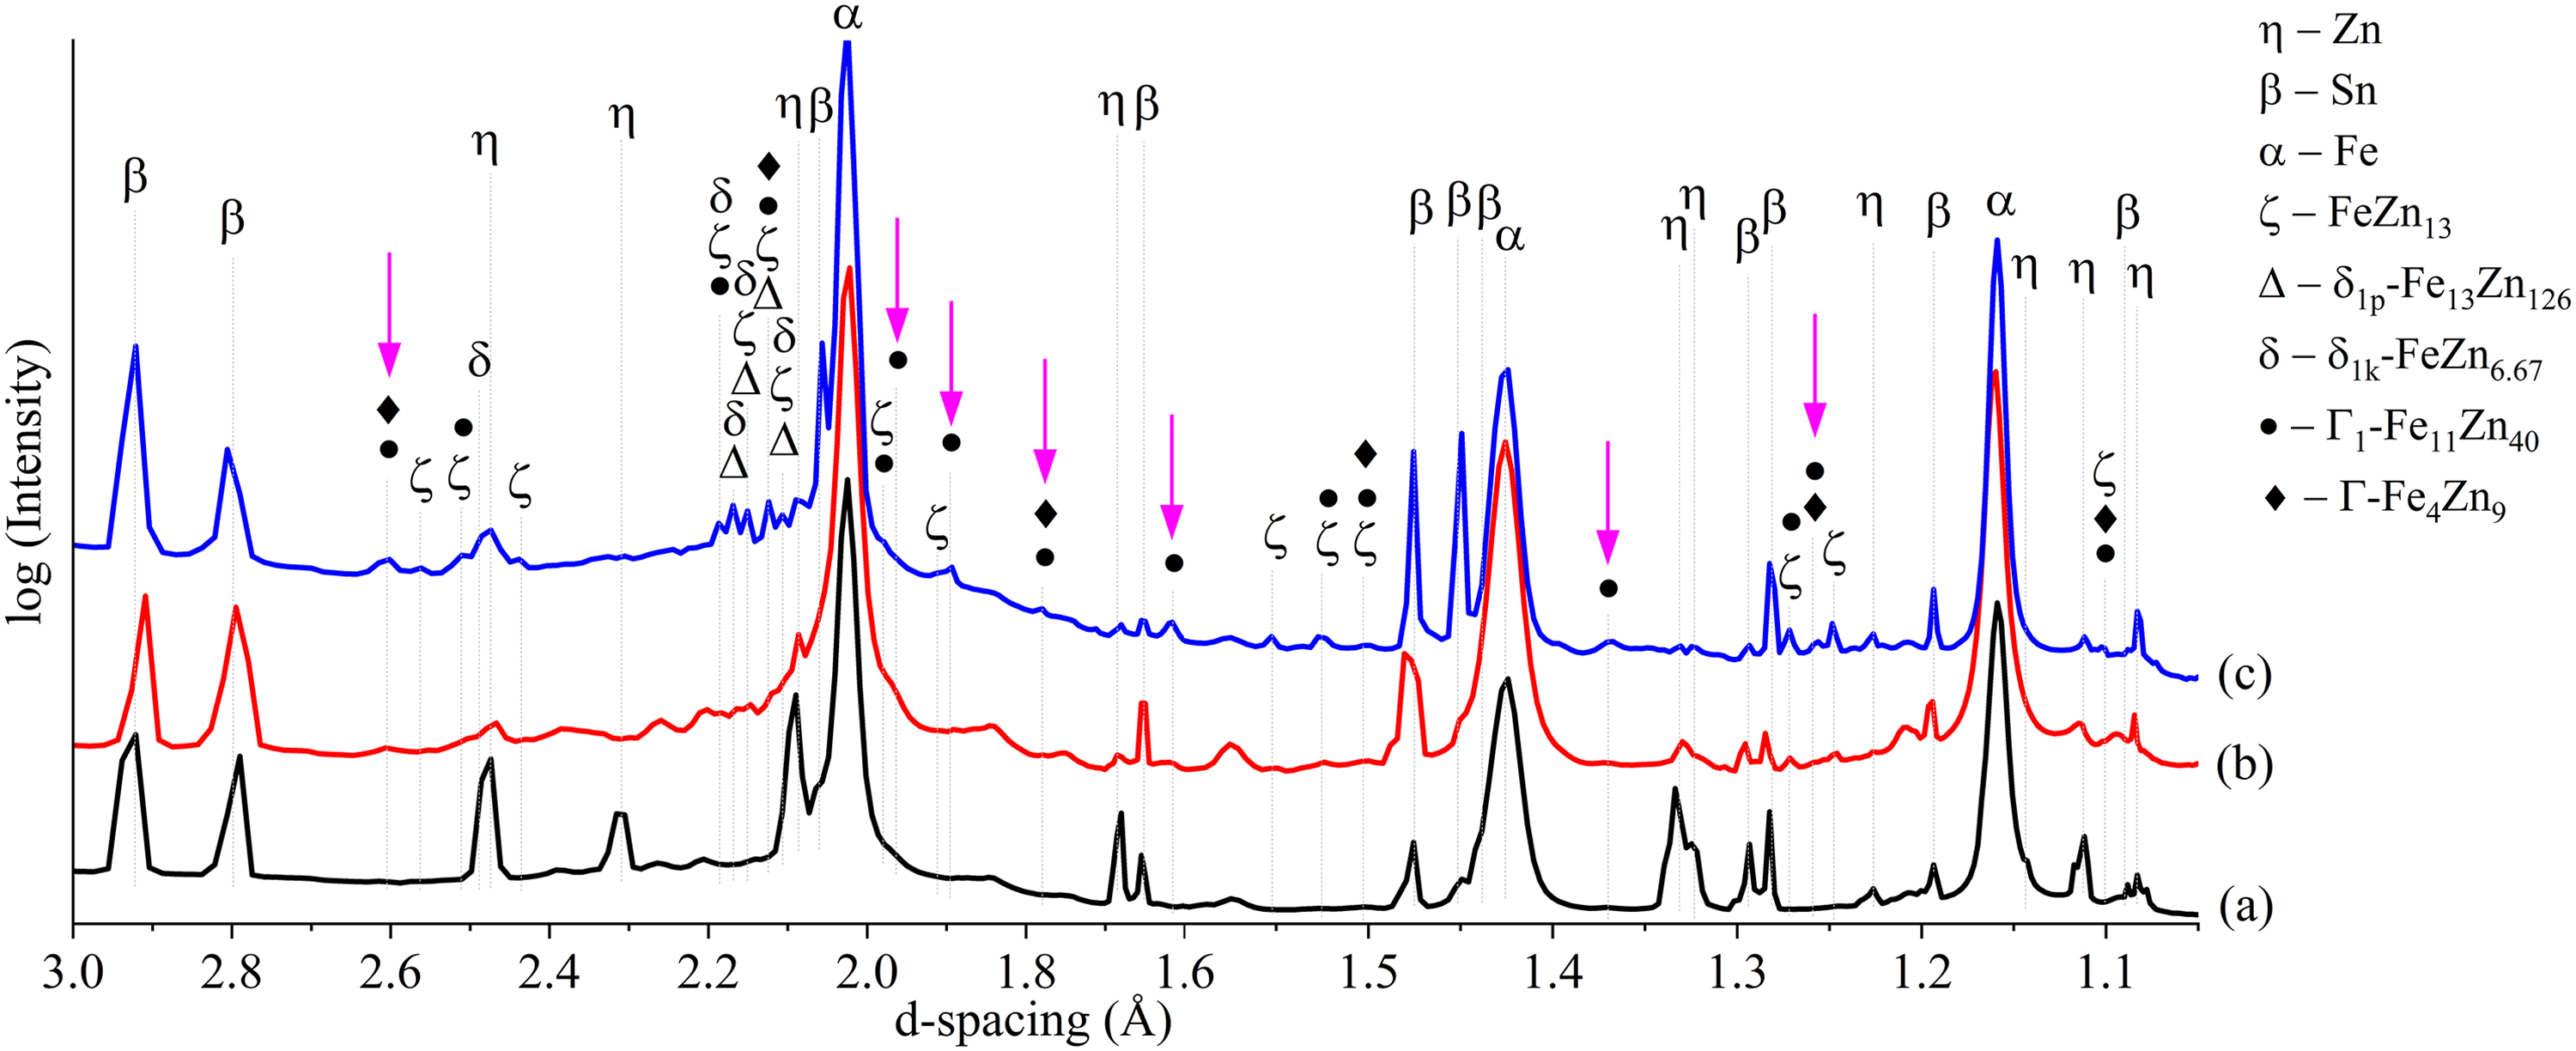
1D GIWAXS profiles of ZnSn coatings (a) as plated, and heat treated for (b) 30 min and (c) 60 min, respectively.
The 2D diffraction patterns of Zn and ZnSn coatings without heat treatment (Zn AP in Figure 13(a) and ZnSn AP in Figure 15(a)) show mainly the rings of Fe, Zn and Sn. Sn was detected in all Zn coatings (with and without heat treatment in Figures 13 and 14) because tin salt was added before adding Zn powder during the mechanical plating process to act as a base coat.
Compared to coatings without heat treatment (Figures 14(a) and 16(a)), extra peaks were observed in heat-treated coatings (Figures 14(b)–(d) and 16(b)–(c)), especially in between d-spacing of 2.05 to 2.2 Å and 2.4 to 2.6 Å. These peaks perfectly matched with those corresponding to ζ-FeZn13, δ1p-Fe13Zn126, δ1k-FeZn6.67, Γ1-Fe11Zn40 and Γ-Fe4Zn9 phases (Table 5 and Figure 17).
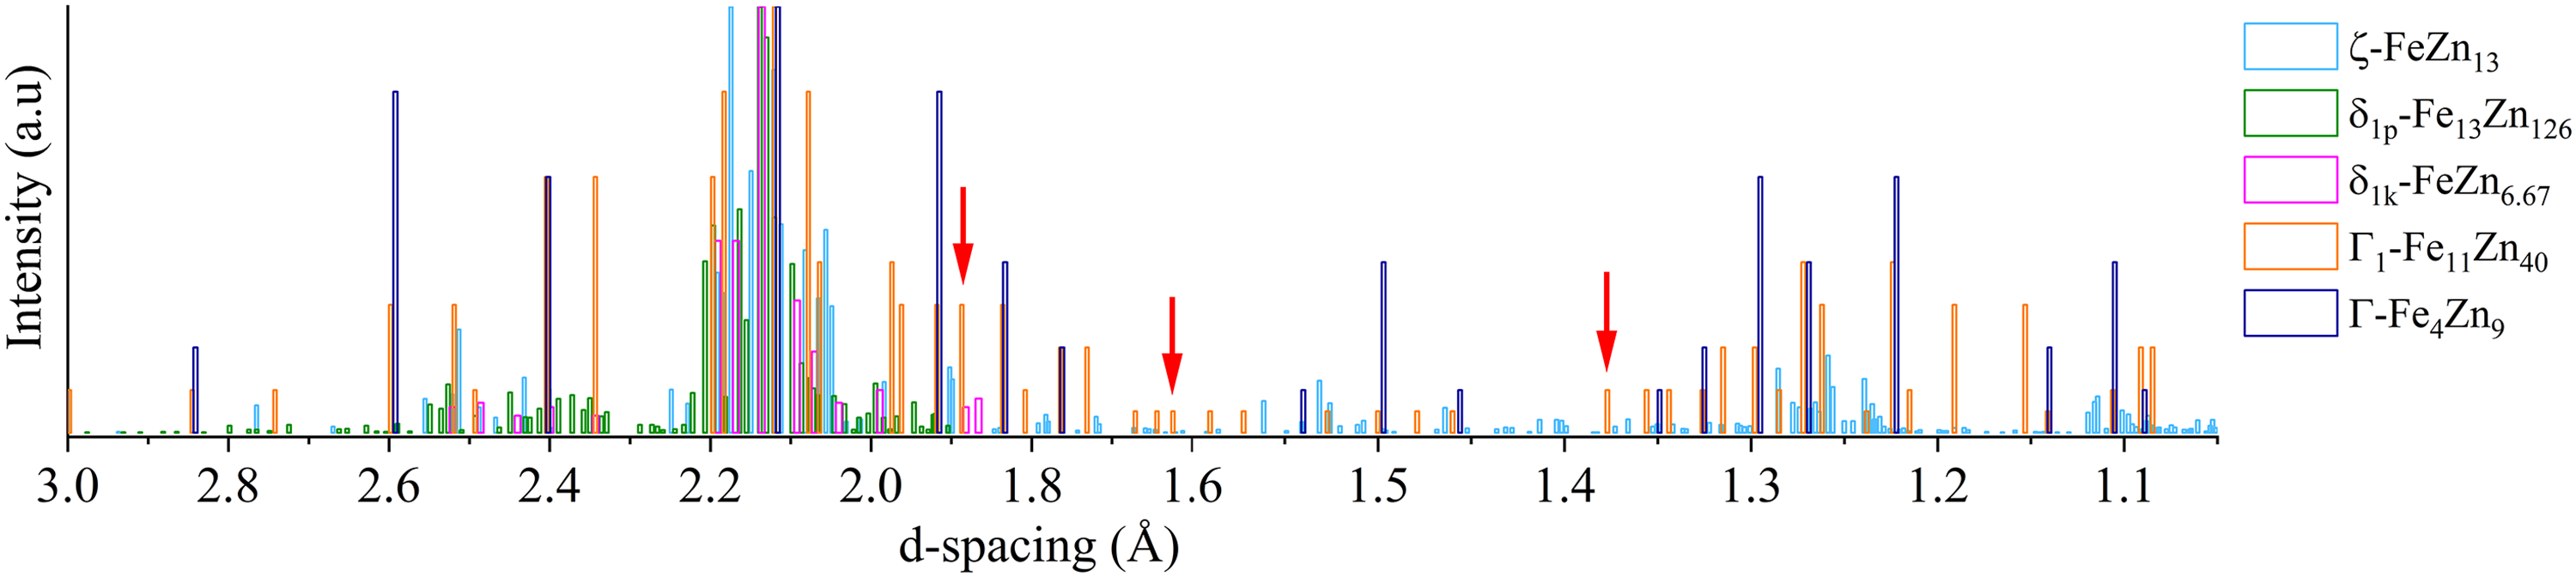
XRD peaks of Fe–Zn phases as per the PDF database listed in Table 5.
The diffraction profile of Zn HT15 (Figure 14(b)) shows small peaks of ζ, δ1p and δ1k phases but not Γ1 or Γ phases, which is consistent with SEM-EDS elemental composition and XRD analyses reported in previous work. 16 Distinct peaks of ζ, δ1p and δ1k phases were also observed in 30- and 60-min heat-treated Zn (Figure 14(c)–(d)) and ZnSn (Figure 16(b)–(c)) coatings, in agreement with the SEM-EDS and XRD analyses in the present (Elemental distributions and phases formed after heat treatment section and Figure 12(b)) and previous works.15,16
The key finding from the GIWAXS profiles is the presence of Γ1 and Γ phases (arrows in Figures 14 and 16), which were not detected by XRD in the previous15,16 and present works (Figure 12), that is, in 30- and 60-min heat-treated Zn and ZnSn coatings. Differentiating face-centred cubic (FCC) Γ1 and body-centred cubic (BCC) Γ phases (Table 3) by XRD is challenging as they have similar cubic crystal structures. 32 The XRD patterns of Γ1 and Γ phases are very similar, in which all the diffraction peaks of the Γ phase appear in the diffraction pattern of the Γ1 phase, 42 as illustrated in Figure 17. Though it was difficult to differentiate the peaks of Γ1 and Γ phases, there were peaks at 1.89, 1.62 and 1.37 Å that were observed in Zn HT30 (Figure 14(c)), Zn HT60 (Figure 14(d)) and ZnSn HT60 (Figure 16(c)). These peaks were indexed as Γ1-Fe11Zn40 (arrows in Figure 17), not Γ-Fe4Zn9, and they did not overlap with those of ζ, δ1p and δ1k phases. In a TEM study of galvannealed coatings, Γ phase exhibited a well-defined columnar structure that grew perpendicularly to the steel substrate, making it easily recognisable. 37 In the present work, a similar columnar microstructure, which grew from the steel substrate towards the outer coating and was observed in etched microstructures of heat-treated Zn and ZnSn coatings (Figure 9), is identified as the Γ phase. The Fe to Zn ratios of average 1: 2 to 1: 5 (Table 4) at the columnar grains near the substrate interface of Zn HT60 and ZnSn HT60 (regions A and B in Figure 9, respectively) also indicated the presence of Γ1 phase in heat-treated Zn coatings, and both Γ and Γ1 phases in heat-treated ZnSn coatings.
In summary, GIWAXS profiles exhibited distinct diffraction peaks with a higher signal-to-noise ratio than XRD profiles. Expected Fe–Zn intermetallic phases were detected in 30- and 60-min heat-treated Zn and ZnSn coatings, including Γ1 and Γ phases, which were not detected by XRD.
Effects of heat treatment on microstructure and phase evolution
Findings from GIWAXS corroborate the results of SEM-EDS and XRD analyses. Combining all these data enables the microstructure evolution model proposed in previous work 16 to be validated. Namely, the formation of Fe–Zn intermetallic phases in heat-treated Zn and ZnSn coatings was in the sequence of ζ-FeZn13, δ1p-FeZn10, δ1k-FeZn7, Γ-Fe3Zn10 and Γ1-Fe5Zn21.
GIWAXS profiles confirmed the presence of Γ1-Fe11Zn40 and Γ-Fe4Zn9 phases, which the XRD did not detect. These two phases were observed in the GIWAXS profiles of Zn HT30 and Zn HT60 (Figure 14(c) and (d)) but not in Zn HT15 (Figure 14(b)), confirming that they formed after ζ, δ1p and δ1k phases when the heat treatment duration increased. There were peaks of Γ1-Fe11Zn40 at 1.89, 1.62 and 1.37 Å that were only observed in the ZnSn HT60 diffraction profile (Figure 16(c)) but not in the ZnSn HT30 profile (Figure 16(b)), indicating that Γ1 phase was last to form among the intermetallic phases when the heat treatment duration increased from 30 to 60 min. Γ phase formed before the Γ1 phase because Γ is the most stable phase at a low-temperature process, having minimal Gibbs free energy of formation among the intermetallic phases.43–45 Therefore, it remains throughout the phase evolution once it is formed near the substrate.
A study of the phase evolution in coatings galvannealed at 500°C for 5–30 s revealed that the coatings form a layered structure consisting of a series of Fe–Zn intermetallic phases.36,37 The authors reported that a clear-cut phase boundary between Γ and Γ1 phases was consistently observed, and the Γ phase grew by consuming the Γ1 phase during phase evolution because the total thickness of Γ and Γ1 was constant at approximately 2 μm throughout the galvannealing process. Onishi, Wakamatsu 28 reported that for Fe–Zn couples annealed at 240–410°C for 1–90 h, the Fe–Zn intermetallic phases appeared in a sequence of ζ, δp and Γ phases. In another study of short-term annealing of clamped iron and zinc couples at 400°C for 10–50 min, the ζ phase was also found to be the first phase to form, followed by δp and Γ phases. 33 The authors also observed that Γ1 existed as a columnar structure between the δp and Γ phase in the initial stage and dissolved at the Γ/δp interface when the annealing duration increased.
Hence, the combined findings from SEM-EDS elemental composition analyses and GIWAXS in the present work confirmed that the formation of Fe–Zn intermetallic phases on mechanically plated coatings was in the sequence of ζ-FeZn13, δ1p-FeZn10, δ1k-FeZn7, Γ-Fe3Zn10 and Γ1-Fe5Zn21 when the heat treatment duration increased. Figures 18 and 19 provide schematics of the phase evolution in heat-treated Zn and ZnSn coatings, respectively.
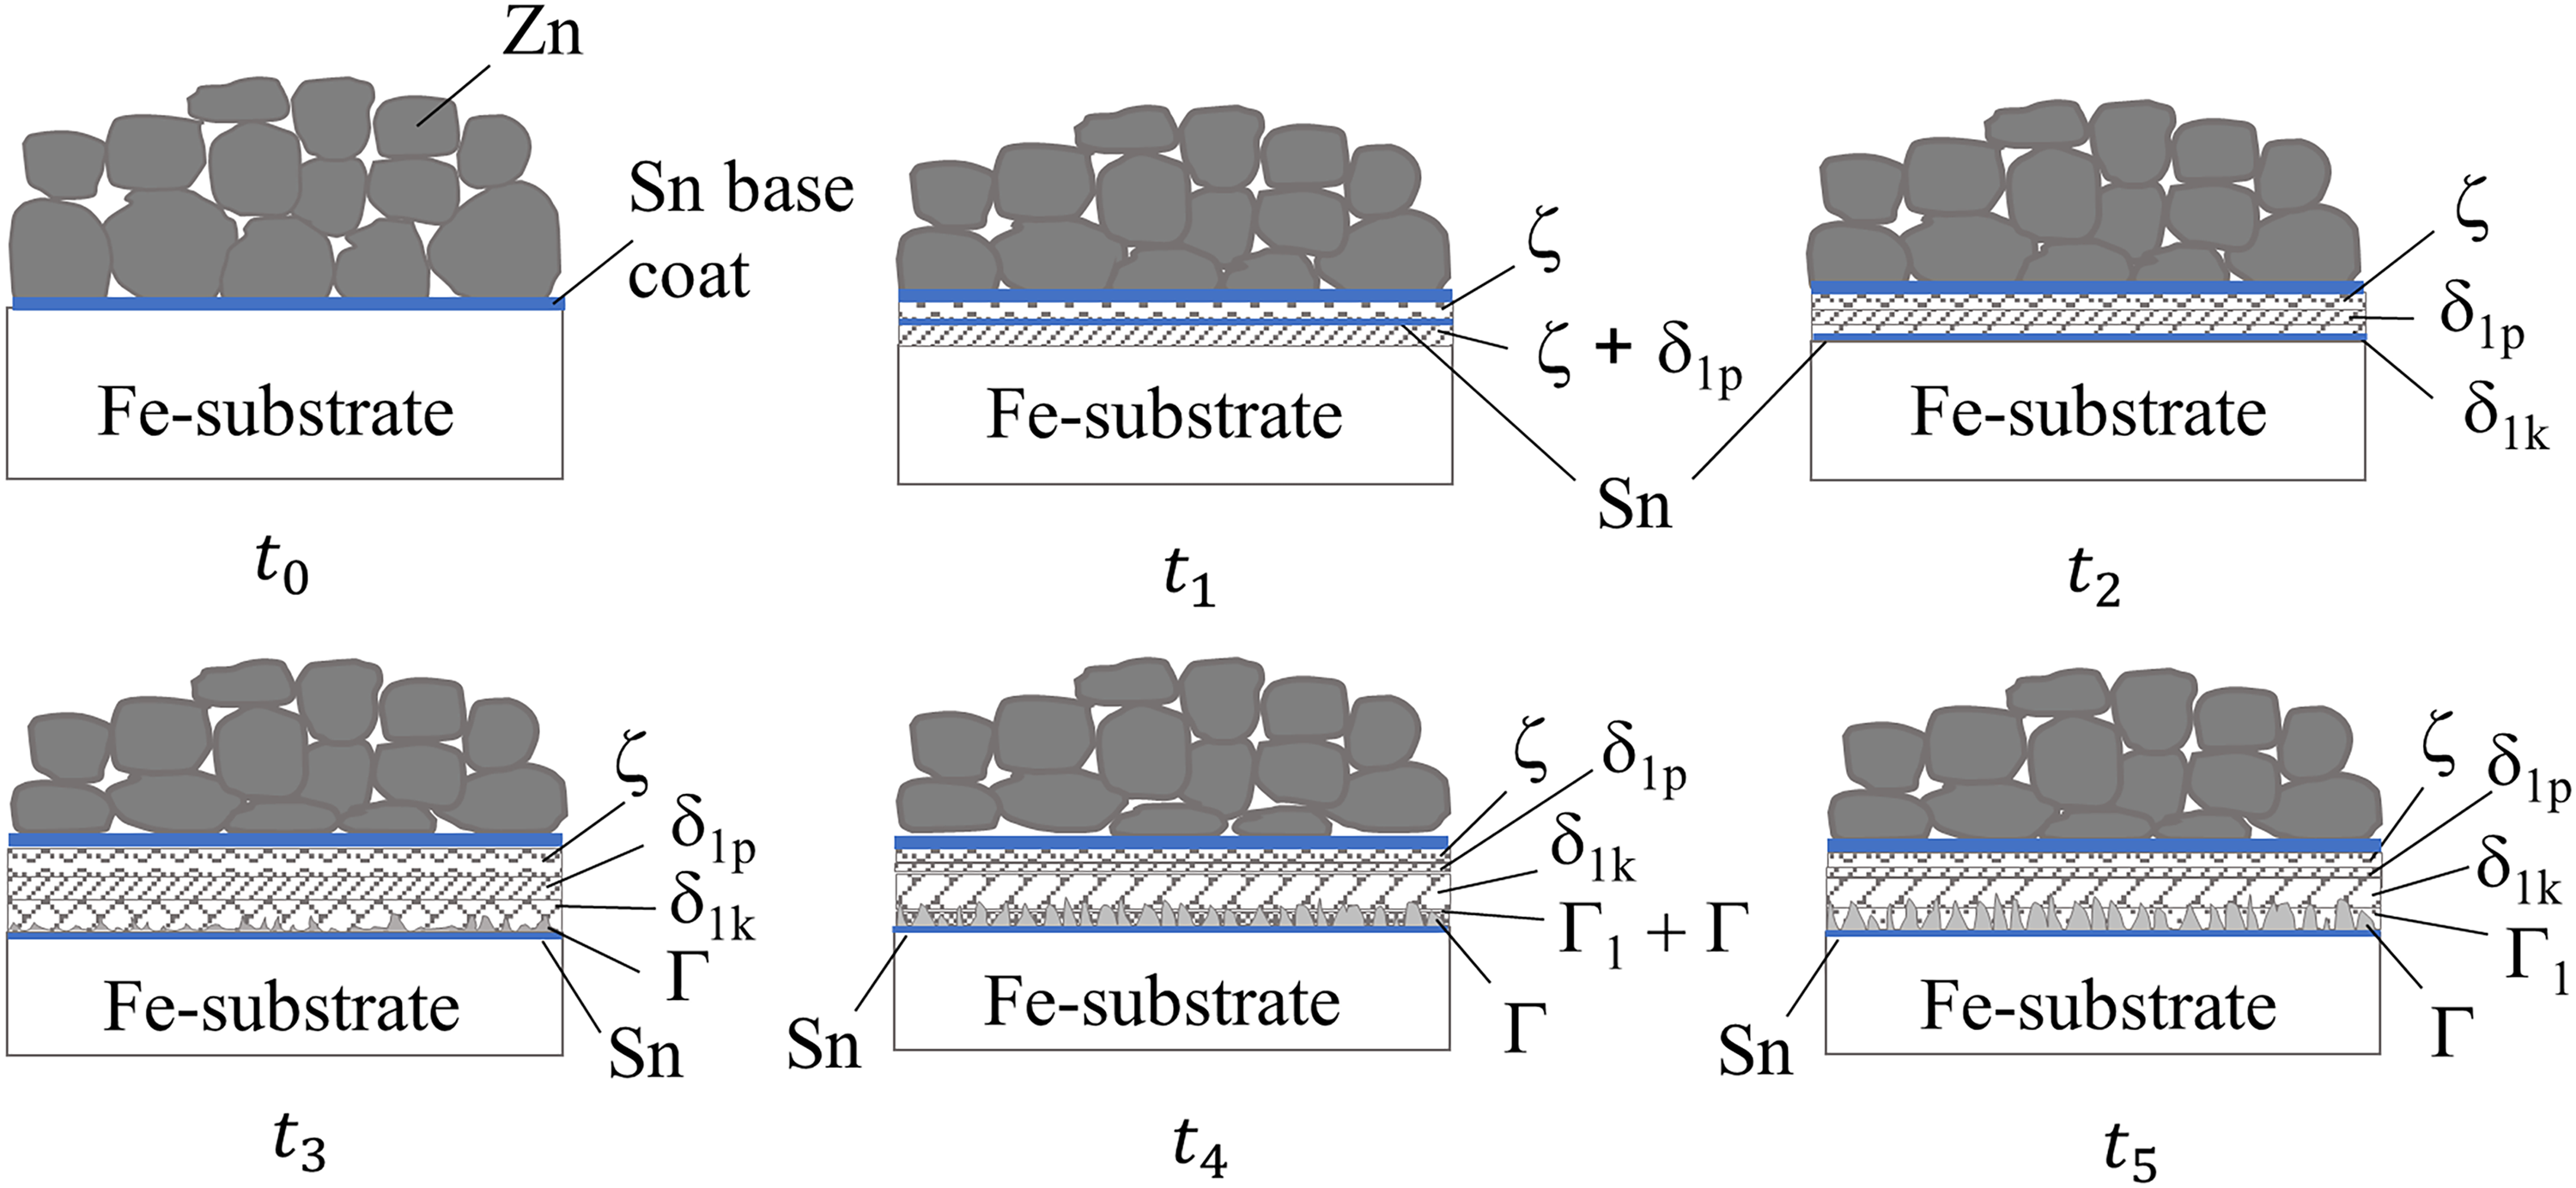
Schematic of the intermetallic phase evolution in heat-treated Zn coating. t0 corresponds to zero time of the Zn coating before heat treatment, and development occurs according to time such that t1<t2<t3<t4<t5.
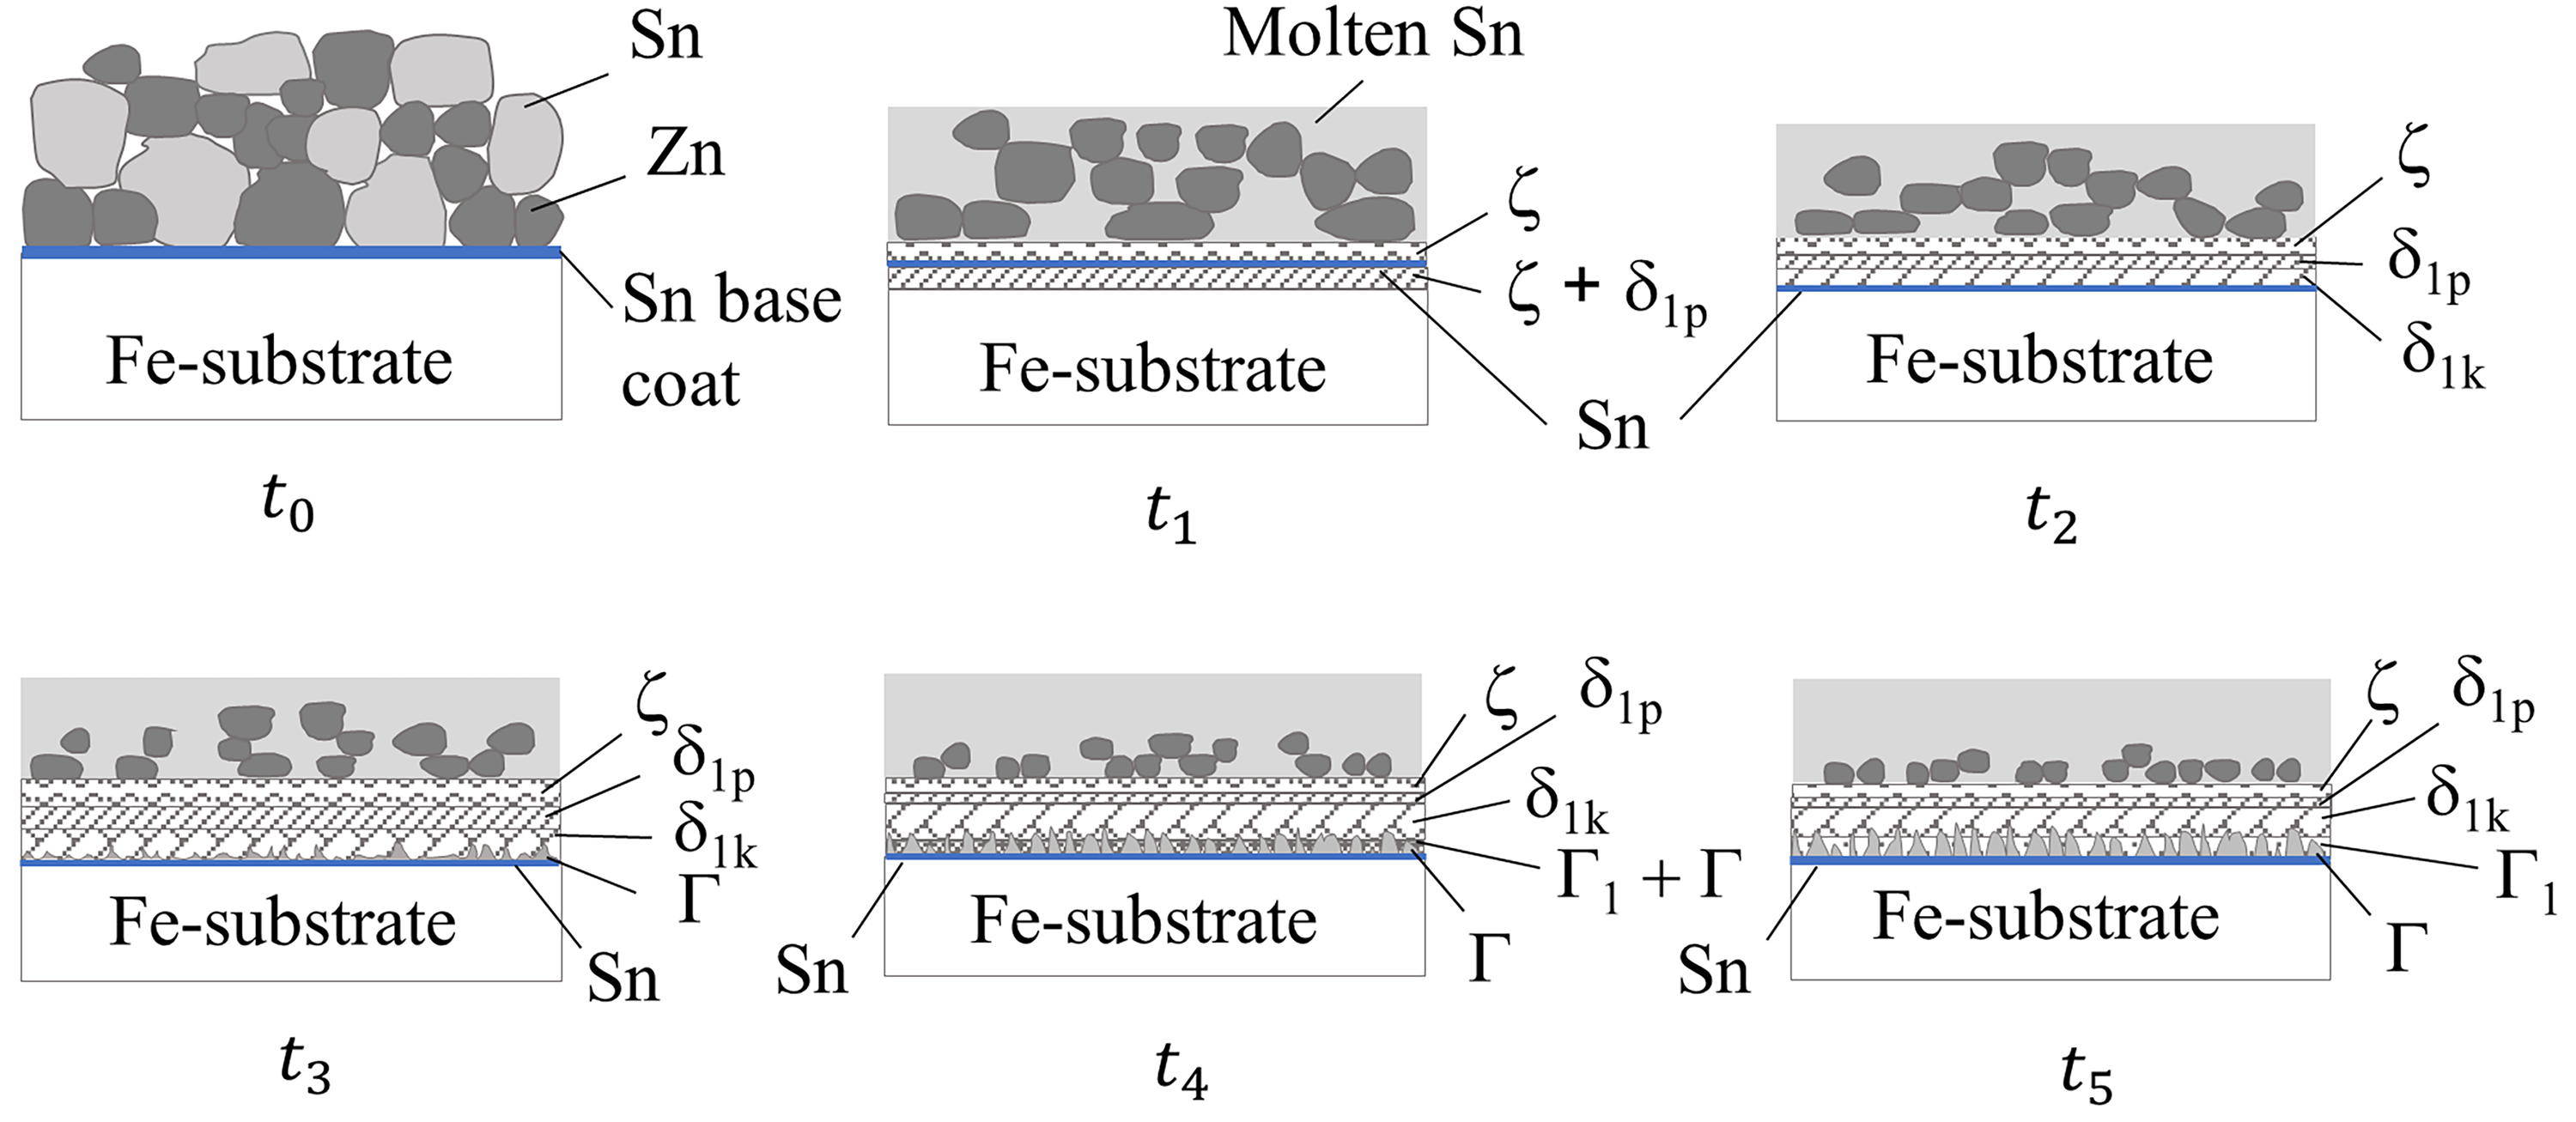
Schematic of the intermetallic phase evolution in heat-treated ZnSn coating. t0 corresponds to zero time of the ZnSn coating before heat treatment, and development occurs according to time such that t1<t2<t3<t4<t5.
It is proposed that during heat treatment, solid–liquid diffusion occurred as well as solid–solid diffusion as the heat treatment temperature (340°C) was above the melting point of tin (232°C). The melted Sn facilitated the diffusion of Zn towards the steel substrate to form the Fe–Zn intermetallic layer. The diffusion of Zn in liquid Sn at 347°C was reported about twice as fast as Sn because Zn exhibited extensive repulsive interaction with Sn, causing Zn to diffuse more rapidly than Sn itself in the liquid state. 46 In addition, Zn has a smaller atomic radius (0.133 nm) than Sn (0.141 nm), so it diffuses faster than Sn in liquid Sn. 47 Hence, during heat treatment of ZnSn coatings in the present work, the increased diffusion of Zn in liquid Sn towards the steel surface resulted in the Sn-rich outer coating, which solidified last upon cooling. The Sn-rich outer coating might have contained a Zn and Sn eutectic structure in view of the Zn–Sn phase diagram. 48 In a study of the Zn–Fe–Sn system, in which the alloy mixture was heated to 1100°C, followed by water quenching and annealing at 450°C for 10 days, and water-quenched again at the end of the treatment, a eutectic structure of η-Zn and β-Sn formed in between the ζ crystallites. 49 The current study observed no eutectic structure in the Sn-rich outer coating, but further verification may be needed. In addition, a bi-continuous structure might have formed during the solid–liquid diffusion 50 ; further work is required to resolve this uncertainty. Literature also showed that the melting temperature of metallic nanoparticles decreases when the nanoparticle size reduces due to the high surface-to-volume ratio.51–54 Hence, further investigation on reduced feedstock particles sizes may be necessary to gain a more comprehensive understanding of the role that Zn and Sn play in microstructure evolution during heat treatment.
Though the diffusion coefficients of Zn in Fe at 340°C (1.22 × 10⁻¹⁵ m2/s) are higher than that of Sn (4.56 × 10⁻²⁷ m2/s), 16 a small amount of Sn was detected at the interface of substrate/intermetallic layer in Zn HT30 (0.6 at%), Zn HT60 (1.2 at%), ZnSn HT30 (1.3 at%) and ZnSn HT60 (4.2 at%) coatings (Figure 8 for Zn HT60 and ZnSn HT60). The Sn could be from the base coat or the Sn near the substrate interface that diffused towards the steel substrate during heat treatment. The Gibbs free energies for the formation of FeSn and FeSn2 at 340°C are lower (−10.94 and −9.97 kJ/mol, respectively) 55 than for Fe–Zn phases (−2.5 to −4.9 kJ/mol at 340°C), 43 indicating that the formation of FeSn and FeSn2 is more favourable than that of Fe–Zn phases. However, neither FeSn nor FeSn2 was detected in this study. In a study of Fe–Sn diffusion couple annealed at 480°C for 96 h, an extremely thin FeSn layer was found between a thick FeSn2 layer and the Fe. 56 Hence, the Sn detected at the interface of substrate/intermetallic layer in the present work might be the ‘in-progress’ formation of FeSn since the heat treatment duration was considerably shorter, and the temperature was not high enough for such diffusion reaction to be completed. This agrees with the present work because GIWAXS also did not detect FeSn or FeSn2.
Conclusion
Advanced diffraction technique GIWAXS is a high-resolution characterisation tool that does not require specific or complex sample preparation such as in TEM or micro-XRD analysis, so it is advantageous to use for the examination of specimens with irregular shapes, such as the fasteners used in this study.
GIWAXS was used to resolve the formation of mechanically plated zinc and zinc–tin coatings before and after heat treatment. Heat treatment of mechanically plated zinc and zinc–tin coatings resulted in the formation of an iron–zinc-rich intermetallic layer. XRD analysis identified the presence of ζ-FeZn13, δ1p-Fe13Zn126 and δ1k-FeZn6.67 phases, but not Γ1-Fe5Zn21 or Γ-Fe3Zn10, although they were expected to occur based on the equilibrium phase diagram. Notably, the use of Synchrotron X-ray in GIWAXS revealed the presence of both phases, overcoming the limitations of traditional XRD due to its superior signal-to-noise ratio.
GIWAXS confirmed the proposed microstructure evolution in heat-treated coatings in which the formation of the iron–zinc intermetallic phases occurred in the sequence of ζ-FeZn13, δ1p-FeZn10, δ1k-FeZn7 during the first 15 min of heat treatment, followed by Γ-Fe3Zn10 and Γ1-Fe5Zn21 when the heat treatment duration increased to 30 then 60 min. GIWAXS has validated the evolution of iron–zinc intermetallic phases when the heat treatment duration increased and confirmed that the post-mechanical plating heat treatment is diffusion-controlled.
This study was the first novel application of GIWAXS to identify phases in heterogeneous mechanically plated coatings using X-ray scanning of standard metallographic sections in the Synchrotron.
Footnotes
Acknowledgements
The authors are grateful to Mr. Peter Cook and Kwik-Coat (Aust) Pty Ltd for the access to materials and coating facilities.
Declaration of conflicting interests
The author(s) declared no potential conflicts of interest with respect to the research, authorship, and/or publication of this article.
Funding
The author(s) disclosed receipt of the following financial support for the research, authorship, and/or publication of this article: This work was supported by the Australian Synchrotron under proposal M13703 “Nano and Microstructural Characterization of Mechanically Plated Coatings Using Grazing Incidence Wide-Angle Scattering”; Faculty of Science, Engineering and Technology Swinburne under University Postgraduate Research Award (SUPRA) scholarship program and Higher Degree Research Publications Award.