
Abstract
The effect of different relaxation time before online quenching on mechanical strength and toughness of high-strength medium-thickness martensitic steel plate was analysed in this work. Increasing the relaxation time from 15 s to 135 s resulted in an increase in the impact energy at −20 °C from 33 J to 148 J. However, the yield strength was decreased from 1050 MPa to 1002 MPa. Dislocation density and martensitic lath width are the main factors causing the strength change. Moreover, the dislocation density caused by deformation drops first sharply and then gently during the relaxation, resulting in an inverse trend of martensitic lath width. Additionally, there appears to be a linear relation between impact energy at −20 °C and dislocation density−1/2.
Introduction
In the present stage, lightweight and low-cost have sparked much discussion and attention. So high-strength and high-toughness steels should gain more visibility. For instance, 960 MPa grade high-strength steel (the yield strength is higher than 960 MPa) has been applied in engineering machinery, coal mine machinery and port machinery, such as large-tonnage cranes, booms of the concrete-pump trucks, high-performance hydraulic support and large-tonnage barge port.1–3
Most of 960 MPa grade high-strength steels are processed by the offline quenching and tempering process with a relatively long process flow.4,5 Due to the proliferation of advanced industrial equipment, the thermo-mechanically controlled process (TMCP) has been applied. 6 Then the online quenching process (a kind of TMCP) can be applied to shorten the process flow and lower the cost. 7 Accordingly, the relaxation time (air cooling time) between rolling and online quenching deserves more attention. The deformation of austenite not only causes dislocation to increase but also induces fine (Nb, Ti)(C, N) to precipitate along dislocations. 8 The highly dense twisted dislocations formed during the deformation develop into dislocation cells gradually and the density decreases with the isothermal relaxation time increasing. 9 The strain-induced precipitates occur along the dislocations as well as the dislocation walls, while there are many more precipitates along the former during isothermal relaxation.9,10 The nano-sized precipitates smaller than 5 nm provide a significant precipitation hardening effect to increase the mechanical strength. 11 The pinning effect becomes weak as the precipitates start to coarsen, and finally, the dislocations get rid of pinning through the bypassing mechanism. 9 So the relaxation is beneficial to the precipitation-induced strength effect. Considering the industrial production line, the anisothermal relaxation (air cooling) can acquire more applications than isothermal relaxation, thus there should be some research on anisothermal relaxation.
Micro-alloying elements (Nb, V and Ti) can be added to the steel for grain refinement and to improve its strength. 12 The yield strength of high-strength steel can be controlled between 1050 MPa and 1150 MPa by adjusting the quenching final cooling temperature to ≤300 °C, which could meet the requirement of 960 MPa. 13 But too high strength will bring burdens to the online straightening equipment. A 960-MPa low-carbon niobium–vanadium micro-alloyed steel processed by quenching and high-frequency induction tempering has a 100% improvement in low-temperature toughness compared with the conventional reheating process. The reason may be that the morphology of cementite is different. The nano-scale cementite can be observed in the steel processed by high-frequency induction tempering, while the lamellar cementite often exists in the steel processed by conventional reheating and tempering. 14 The 960-MPa grade high-strength steel usually consists of martensite. Lamellar martensite, 15 dislocations 16 and precipitations17,18 would have different impacts on the performance, so they should be discussed.
Regarding the industrial production line equipped with online quenching equipment, controlling and achieving anisothermal relaxation between rolling and online quenching is easier compared to isothermal relaxation. This has broad application and high research value in performance adjustment. The effect of relaxation time on the mechanical properties of online quenched high-strength low-alloy medium-thickness martensitic steel plates has been studied. Additionally, the strengthening and toughening mechanisms have been analysed in this work.
Materials and experimental methods
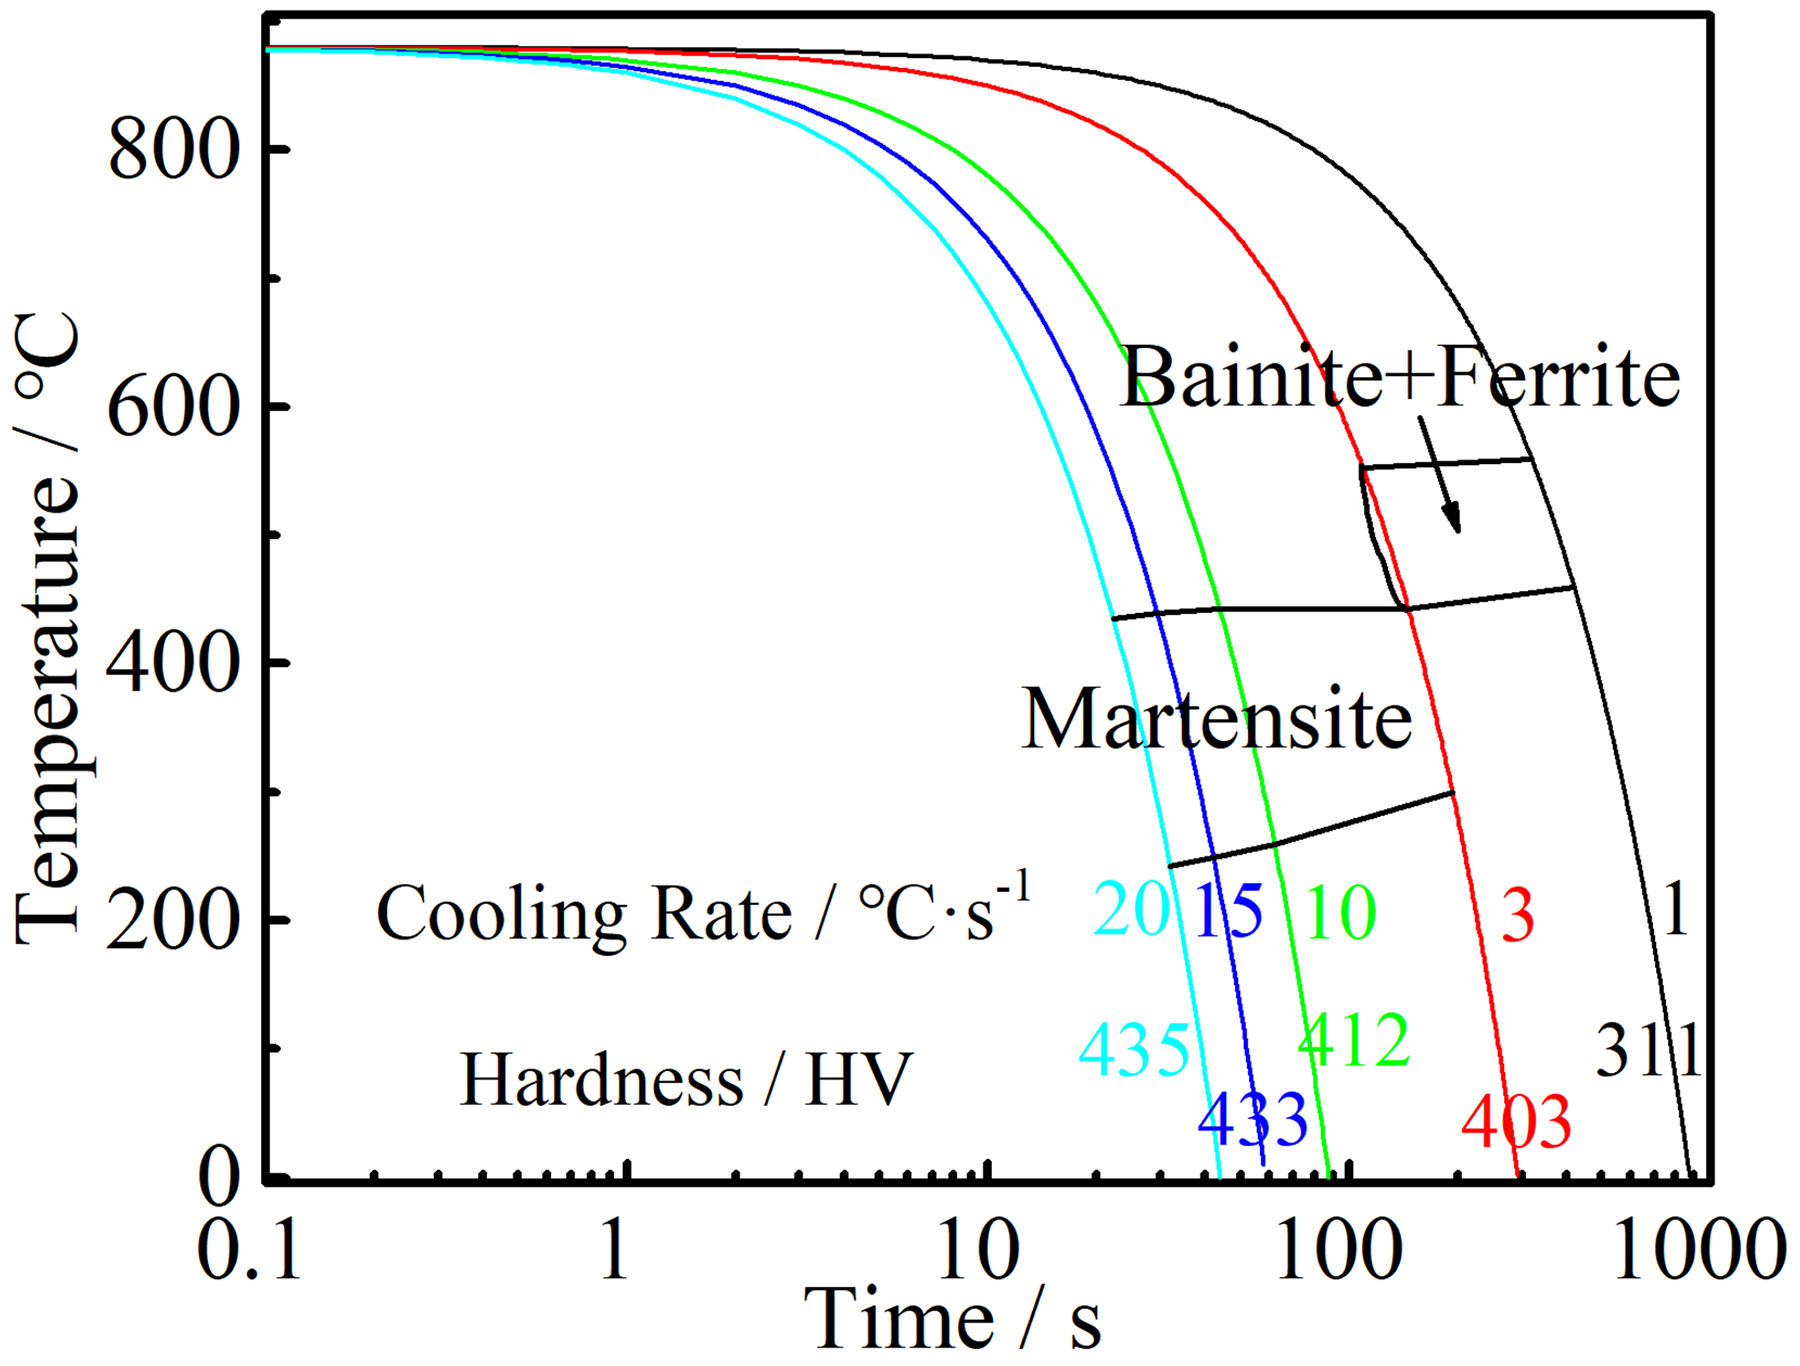
The chemical composition of high-strength low-alloy steel is shown in Table 1. The process of producing high-strength low-alloy medium-thickness steel plate is illustrated in Figure 1(a). This process was carried out on the 3500 mm medium plate production line located in HBIS Group Co., Ltd and equipped with online temperature measuring devices. The billet, with a thickness of 260 mm, was homogenised at 1200 °C for 286 min and then reduced to 20 mm via 15 hot rolling passes from 1100 °C to 800 °C. The billet was rolled using rough rolling and finished rolling with the reciprocating rolling mill. The final rolling temperature was 800 °C. After rolling, the plates were relaxed on the rollers before the online quenching equipment, that was to say, cooling in air. It should be noted that it was not the isothermal relaxation in this work. After rolling, the plates were relaxed for 15 s, 65 s, 90 s and 135 s, respectively. The corresponding quenching start temperatures were 760 °C, 730 °C, 700 °C and 670 °C, respectively. The minimum relaxation time was 15 s, which was achieved through the fastest transfer from the finish rolling mill to online quenching equipment. The relaxation time could be extended by adjusting the roller speed between the finish rolling mill and online quenching equipment. The online quenching equipment comprises spray cooling equipment and laminar cooling equipment, both of which used water as the cooling medium. The quenching termination temperature was approximately 125 °C at the surface, with an average cooling rate of 20 °C·s−1.
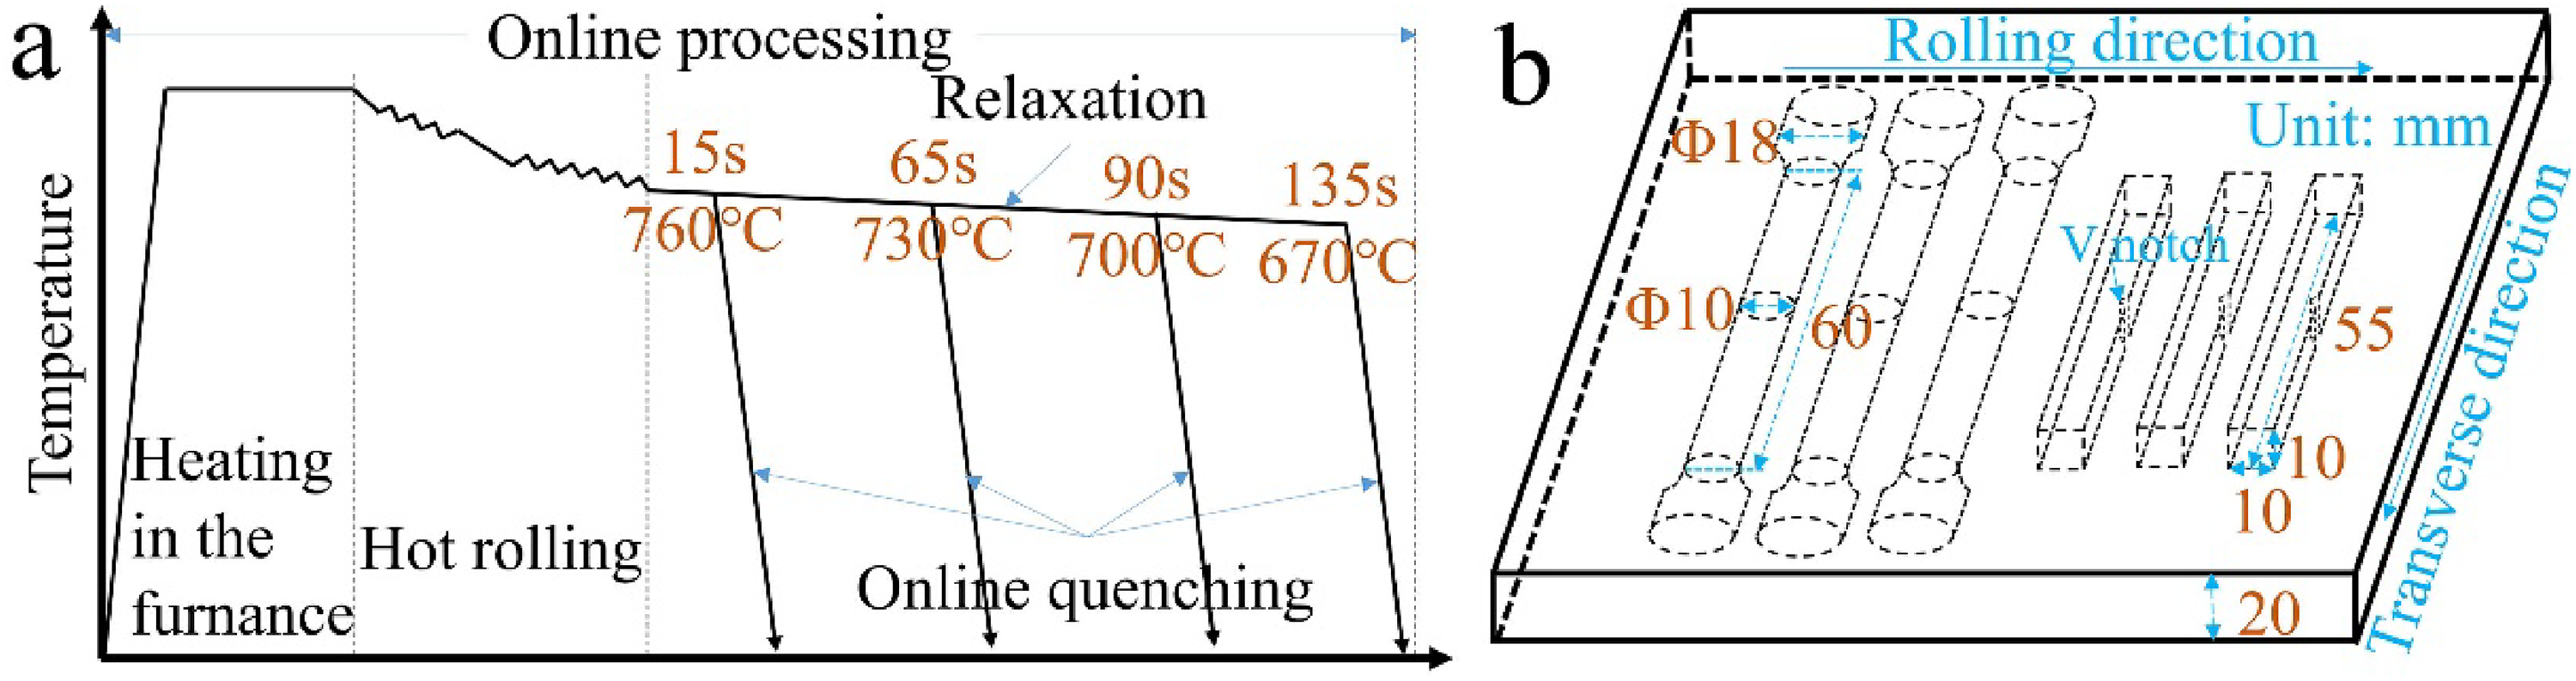
The plates processing method (a) and specimens processing method (b).
Chemical composition (wt-%).
The specimens for mechanical properties were obtained from the samples (Figure 1(b)). Three specimens were tested for each relaxation time to guarantee reproducibility. The surfaces were polished to average roughness to Ra = 0.4 μm, aiming to prevent the mechanical properties from being affected by the differences between surface roughness and the surface cracks. The tensile performance was tested by SHT5605P electro-hydraulic servo tension tester at 1 mm min−1 and room temperature. The impact performance with Charpy V-notch specimens with dimensions of 10 mm × 10 mm × 55 mm was tested on a CBD-300 impact testing machine at −20 °C.
Scanning electron microscopy (SEM, FEI Quanta 600) equipped with Oxford electron back-scattered diffraction (EBSD) and transmission electron microscopy (TEM, JEM-2100) were conducted to observe the microstructure. And the plane normal to the transverse direction (TD) was used. The specimens were manually polished with 200 to 1500 grid SiC sandpaper. The 4% nital solution was used for etching the specimens to reveal the metallographic microstructure for SEM. The specimens used for EBSD were further electro-polished in the solution with C2H5OH:HClO4 = 8:2 (volume ratio) for about 50 s. The grain boundaries were identified by EBSD with a 0.1-μm step. The EBSD data was analysed by Channel 5 software. The TEM specimens were foils of 3 mm diameter prepared by double plasma spraying.
Phases and dislocation density were identified by Empyrean automatic X-ray diffraction (XRD, Co Ka radiation, 35 kV, 50 mA, room temperature). The specimens for XRD were prepared by machine and electro-polishing to remove the microscopic deformation. All XRD specimens were scanned over the 2θ range from 30° to 105° at 0.026° s−1. The dislocation density could be calculated by Mdijade 6.0 and the Williamson–Hall formula. 19

Where ε is the microscopic strain and b is the Burgers vector.
Results
Effect of relaxation time on mechanical properties
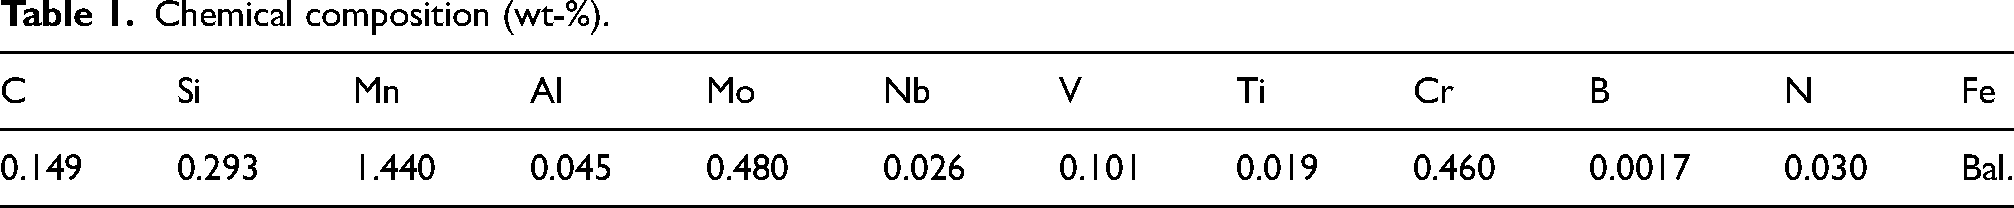
The mechanical properties are shown in Figure 2. When the relaxation time was extended from 15 s to 65 s, the tensile strength and the yield strength plummeted, and the elongation and the impact energy at −20 °C drastically increased. That was more significant than the changes from 65 s to 135 s. When the relaxation time was ≥65 s, the mechanical properties (the yield strength, tensile strength and elongation) first increased and then decreased, and the amplitude of variation was slight. The impact energy consistently surged when the relaxation time was ≥65 s, and they were ≥118 J, while the steel subjected to relaxation for 15 s has an impact energy of 33 J at −20 °C. Aiming to meet the requirements of 960 MPa grade high-strength steels and improve the toughness, the relaxation time should be controlled within the range of 65 s to 135 s.
Mechanical properties of the steel of different relaxation time. (a) the yield strength and tensile strength; (b) the elongation; (c) the impact energy at −20 °C.
Effect of relaxation time on microstructures
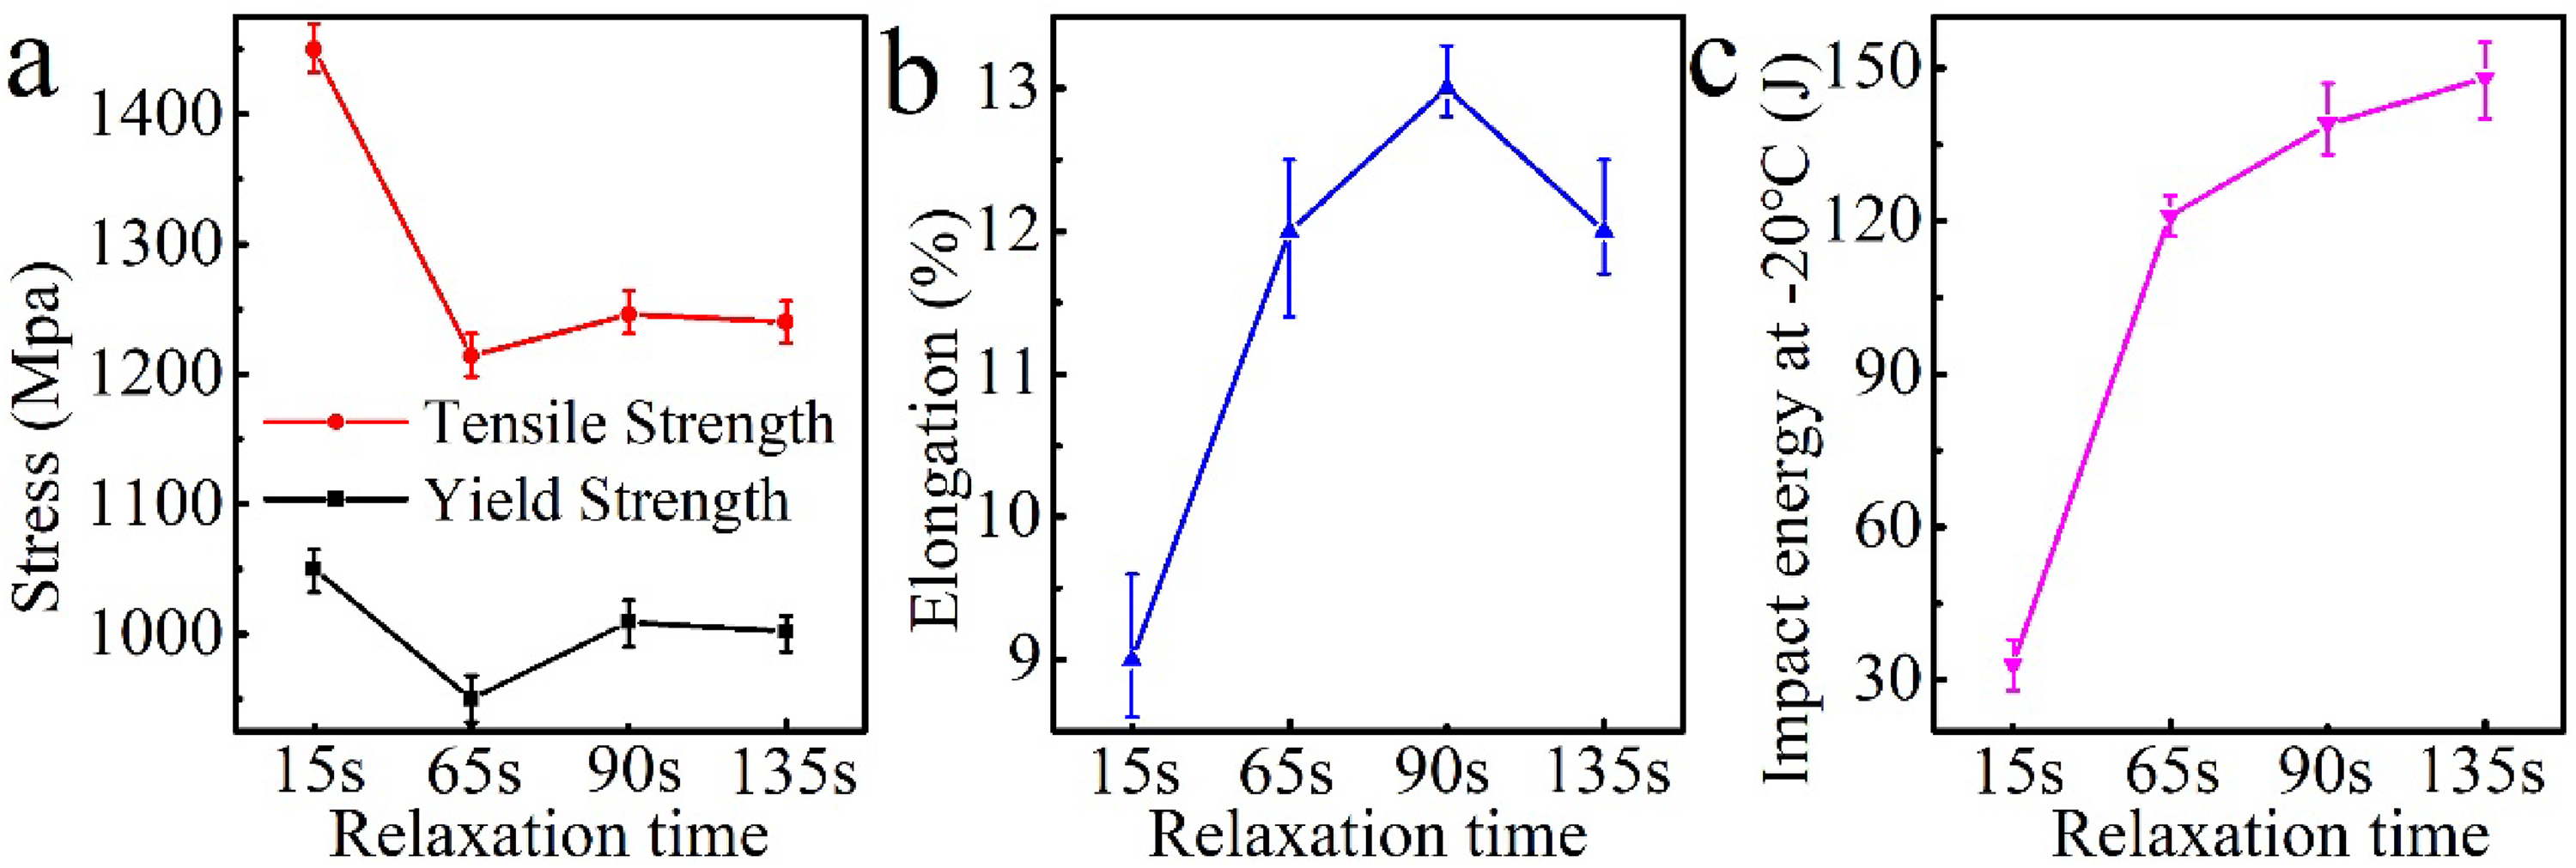
The deformations were carried out at complicated temperatures in the 3500 mm medium plate production line. The temperatures and deformations differed at different positions in the plate, such as the surface and centre, as well as during different hot rolling passes. Consequently, conducting precise research on all the temperatures and deformations was impractical, necessitating simplification. The previous work 7 showed the dynamic continuous cooling transformation (DCCT) curves in Figure 3 obtained by a two-stage deforming by 30% at 1050 °C and 40% at 880 °C to simulate the rough rolling and finish rolling. The deformations and temperatures were corresponding to the actual parameters of the plates in this work. So the DCCT curves in Figure 3 could be applied in this work to aid in the identification of microstructures.
DCCT curves.
According to the DCCT curves of the steel (Figure 3), 7 the ferrite transition start temperature was 559 °C when cooled at 1 °C·s−1. Therefore, no ferrite would appear even if the start quenching temperature decreased from 760 °C to 670 °C. The quenching termination temperature was about 125 °C with an average cooling rate of 20 °C·s−1. As a result, the microstructures obtained after online quenching would consist of martensite.
The microstructures observed by SEM are shown in Figure 4. The plate surface temperature was from the start quenching temperature to 125 °C during the online quenching process. Subsequently, the 20 mm thickness plate was cooled in the air to room temperature. The centre, along the thickness direction, underwent slow cooling for a certain time below 125 °C or a little above 125 °C. So, the microstructures in Figure 4 were tempered martensite. When relaxed for 15 s, the laths extended through the whole grain in different directions within the prior austenite grains (Figure 4(a)). When relaxation time increased from 15 s to 135 s, the directions of the laths within the prior austenite grains increased.
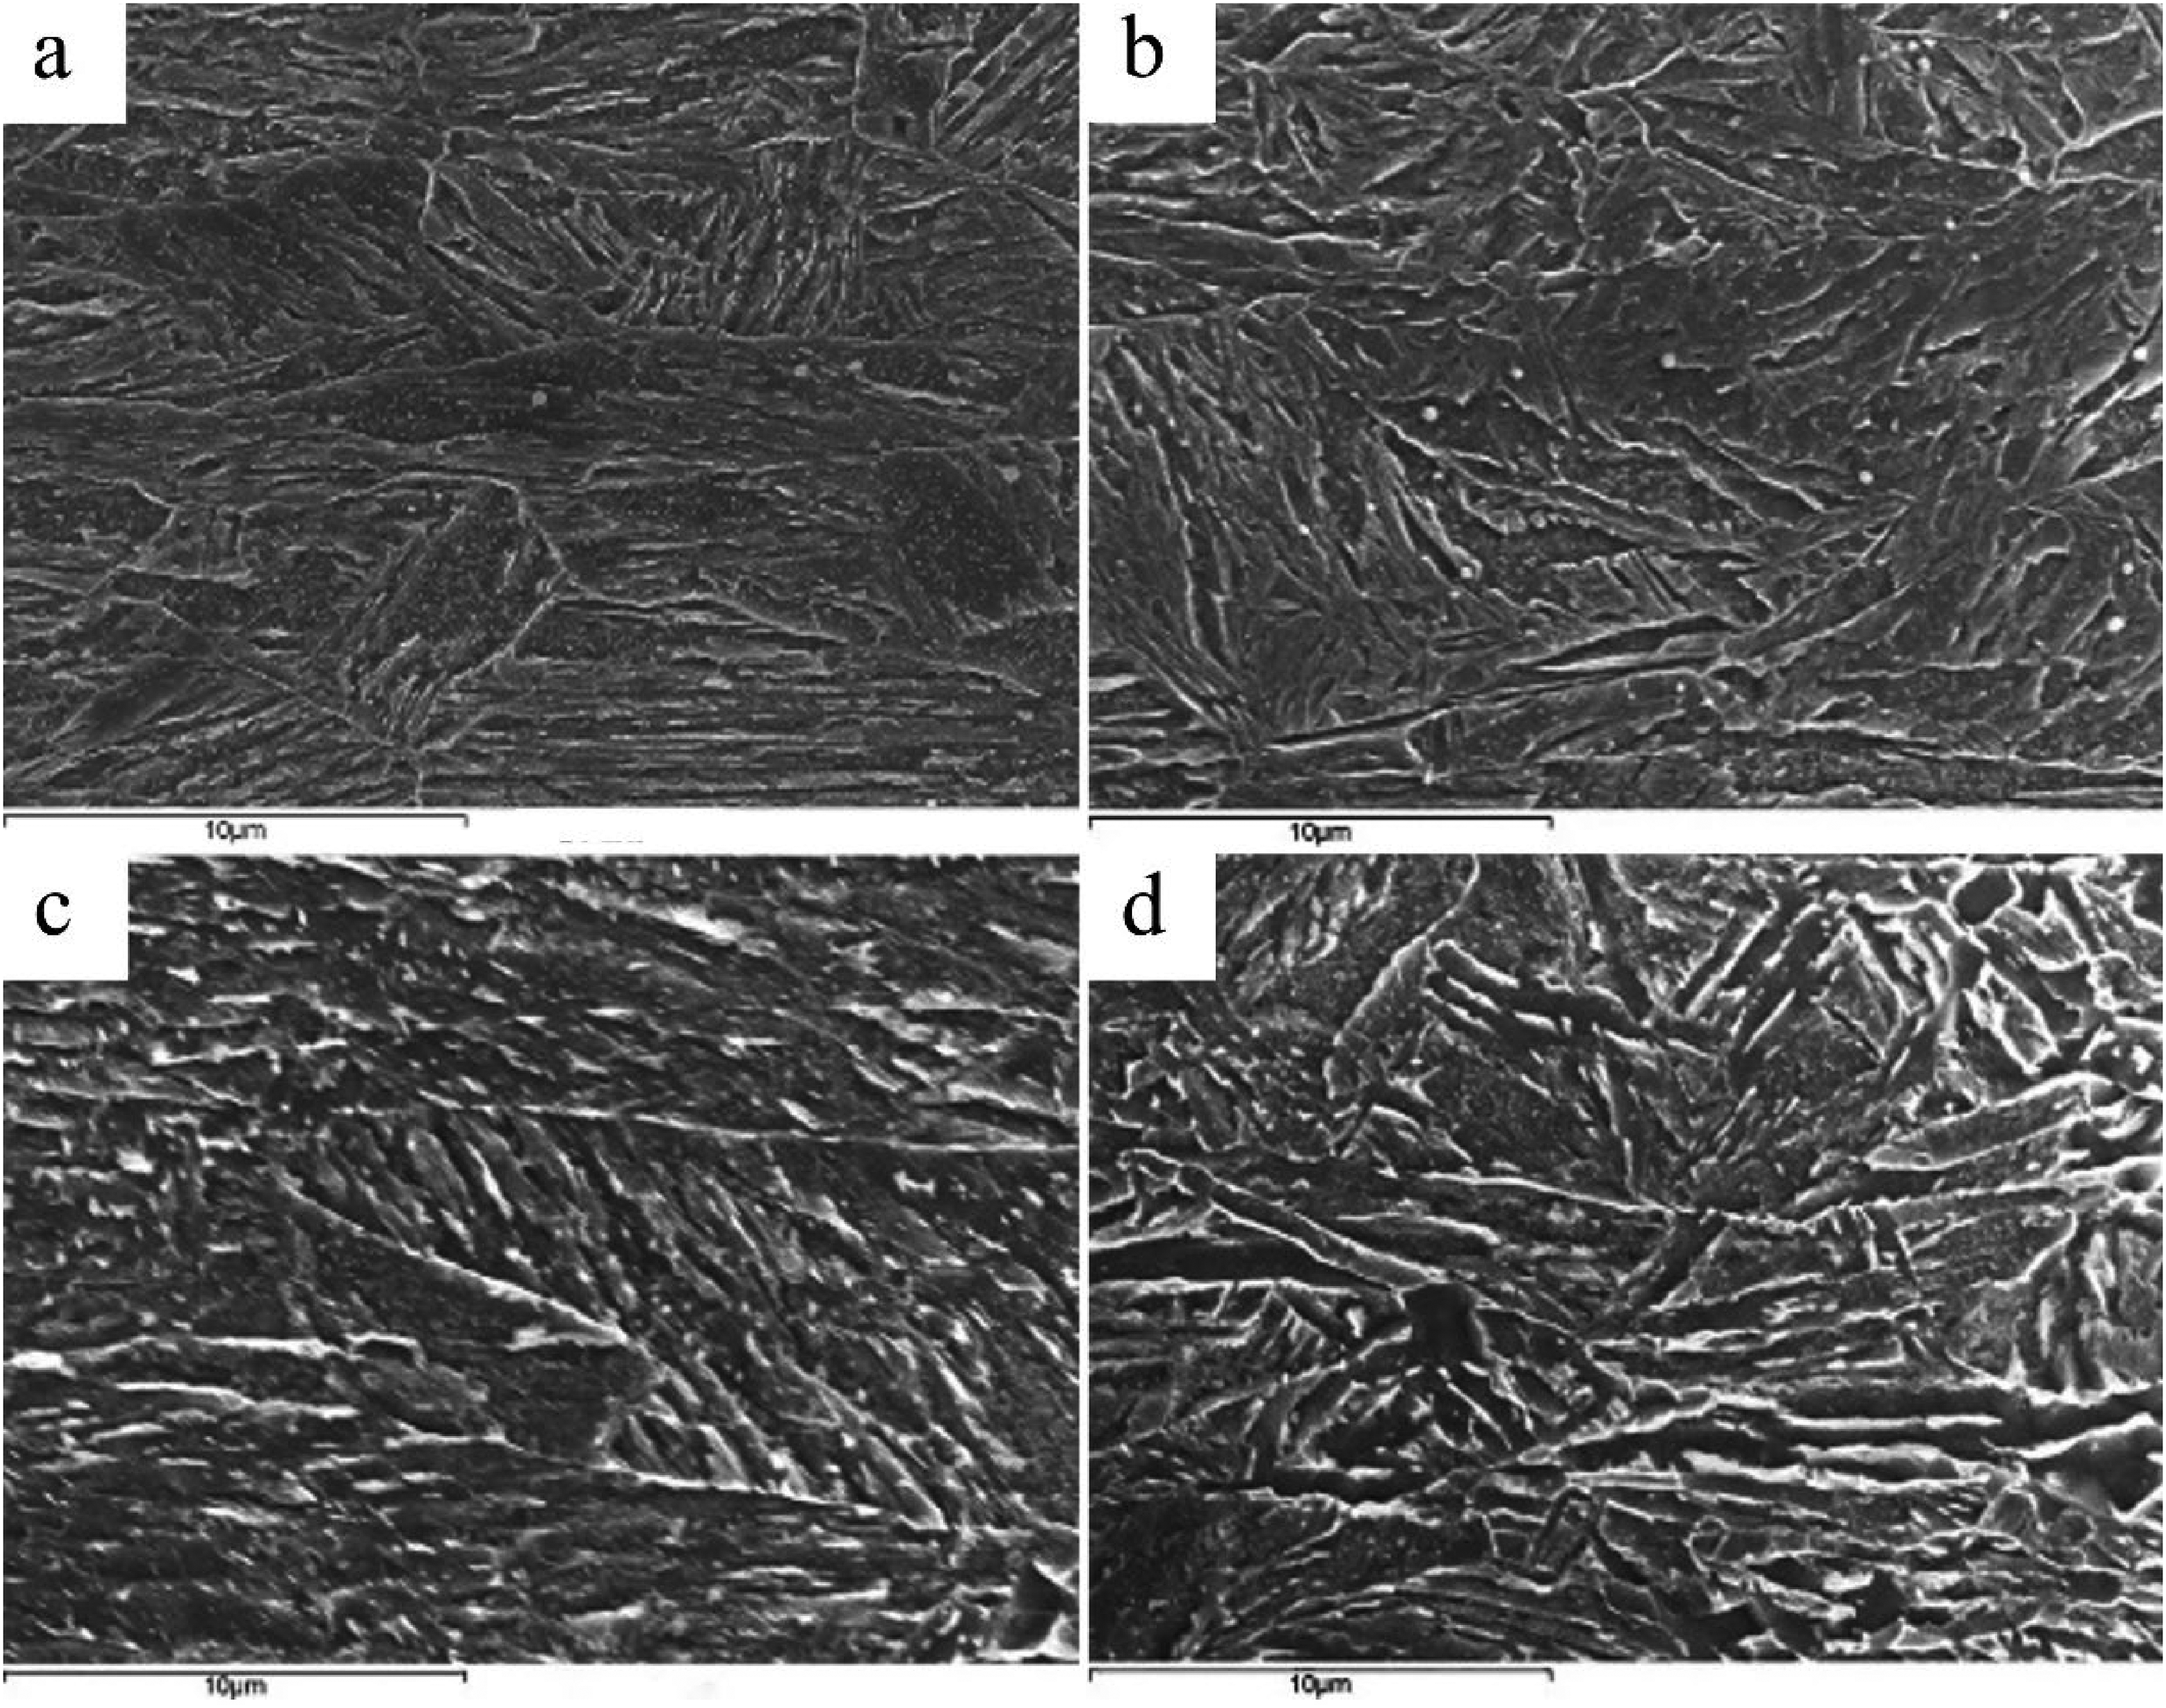
SEM microstructures of different relaxation time: (a) 15 s, (b) 65 s, (c) 90 s and (d) 135 s.
As depicted in Figure 5, the relaxation time affected the morphology and size of the martensitic lath. When the relaxation time was set to 15 s, the lath appeared straight and slender (Figure 5(a)). When relaxation time increased to 135 s (Figure 5(c)), the number of lath directions increased. The width of the martensitic lath increased as the relaxation time prolonged. The width in five TEM figures of each relaxation time was measured by Nano Measurer software, as shown in Figure 5(d). Notably, there was a significant increase in the lath width with the relaxation time increasing from 15 s to 65 s. And then, as the relaxation time continued to prolong, the rate of increase slowed down.
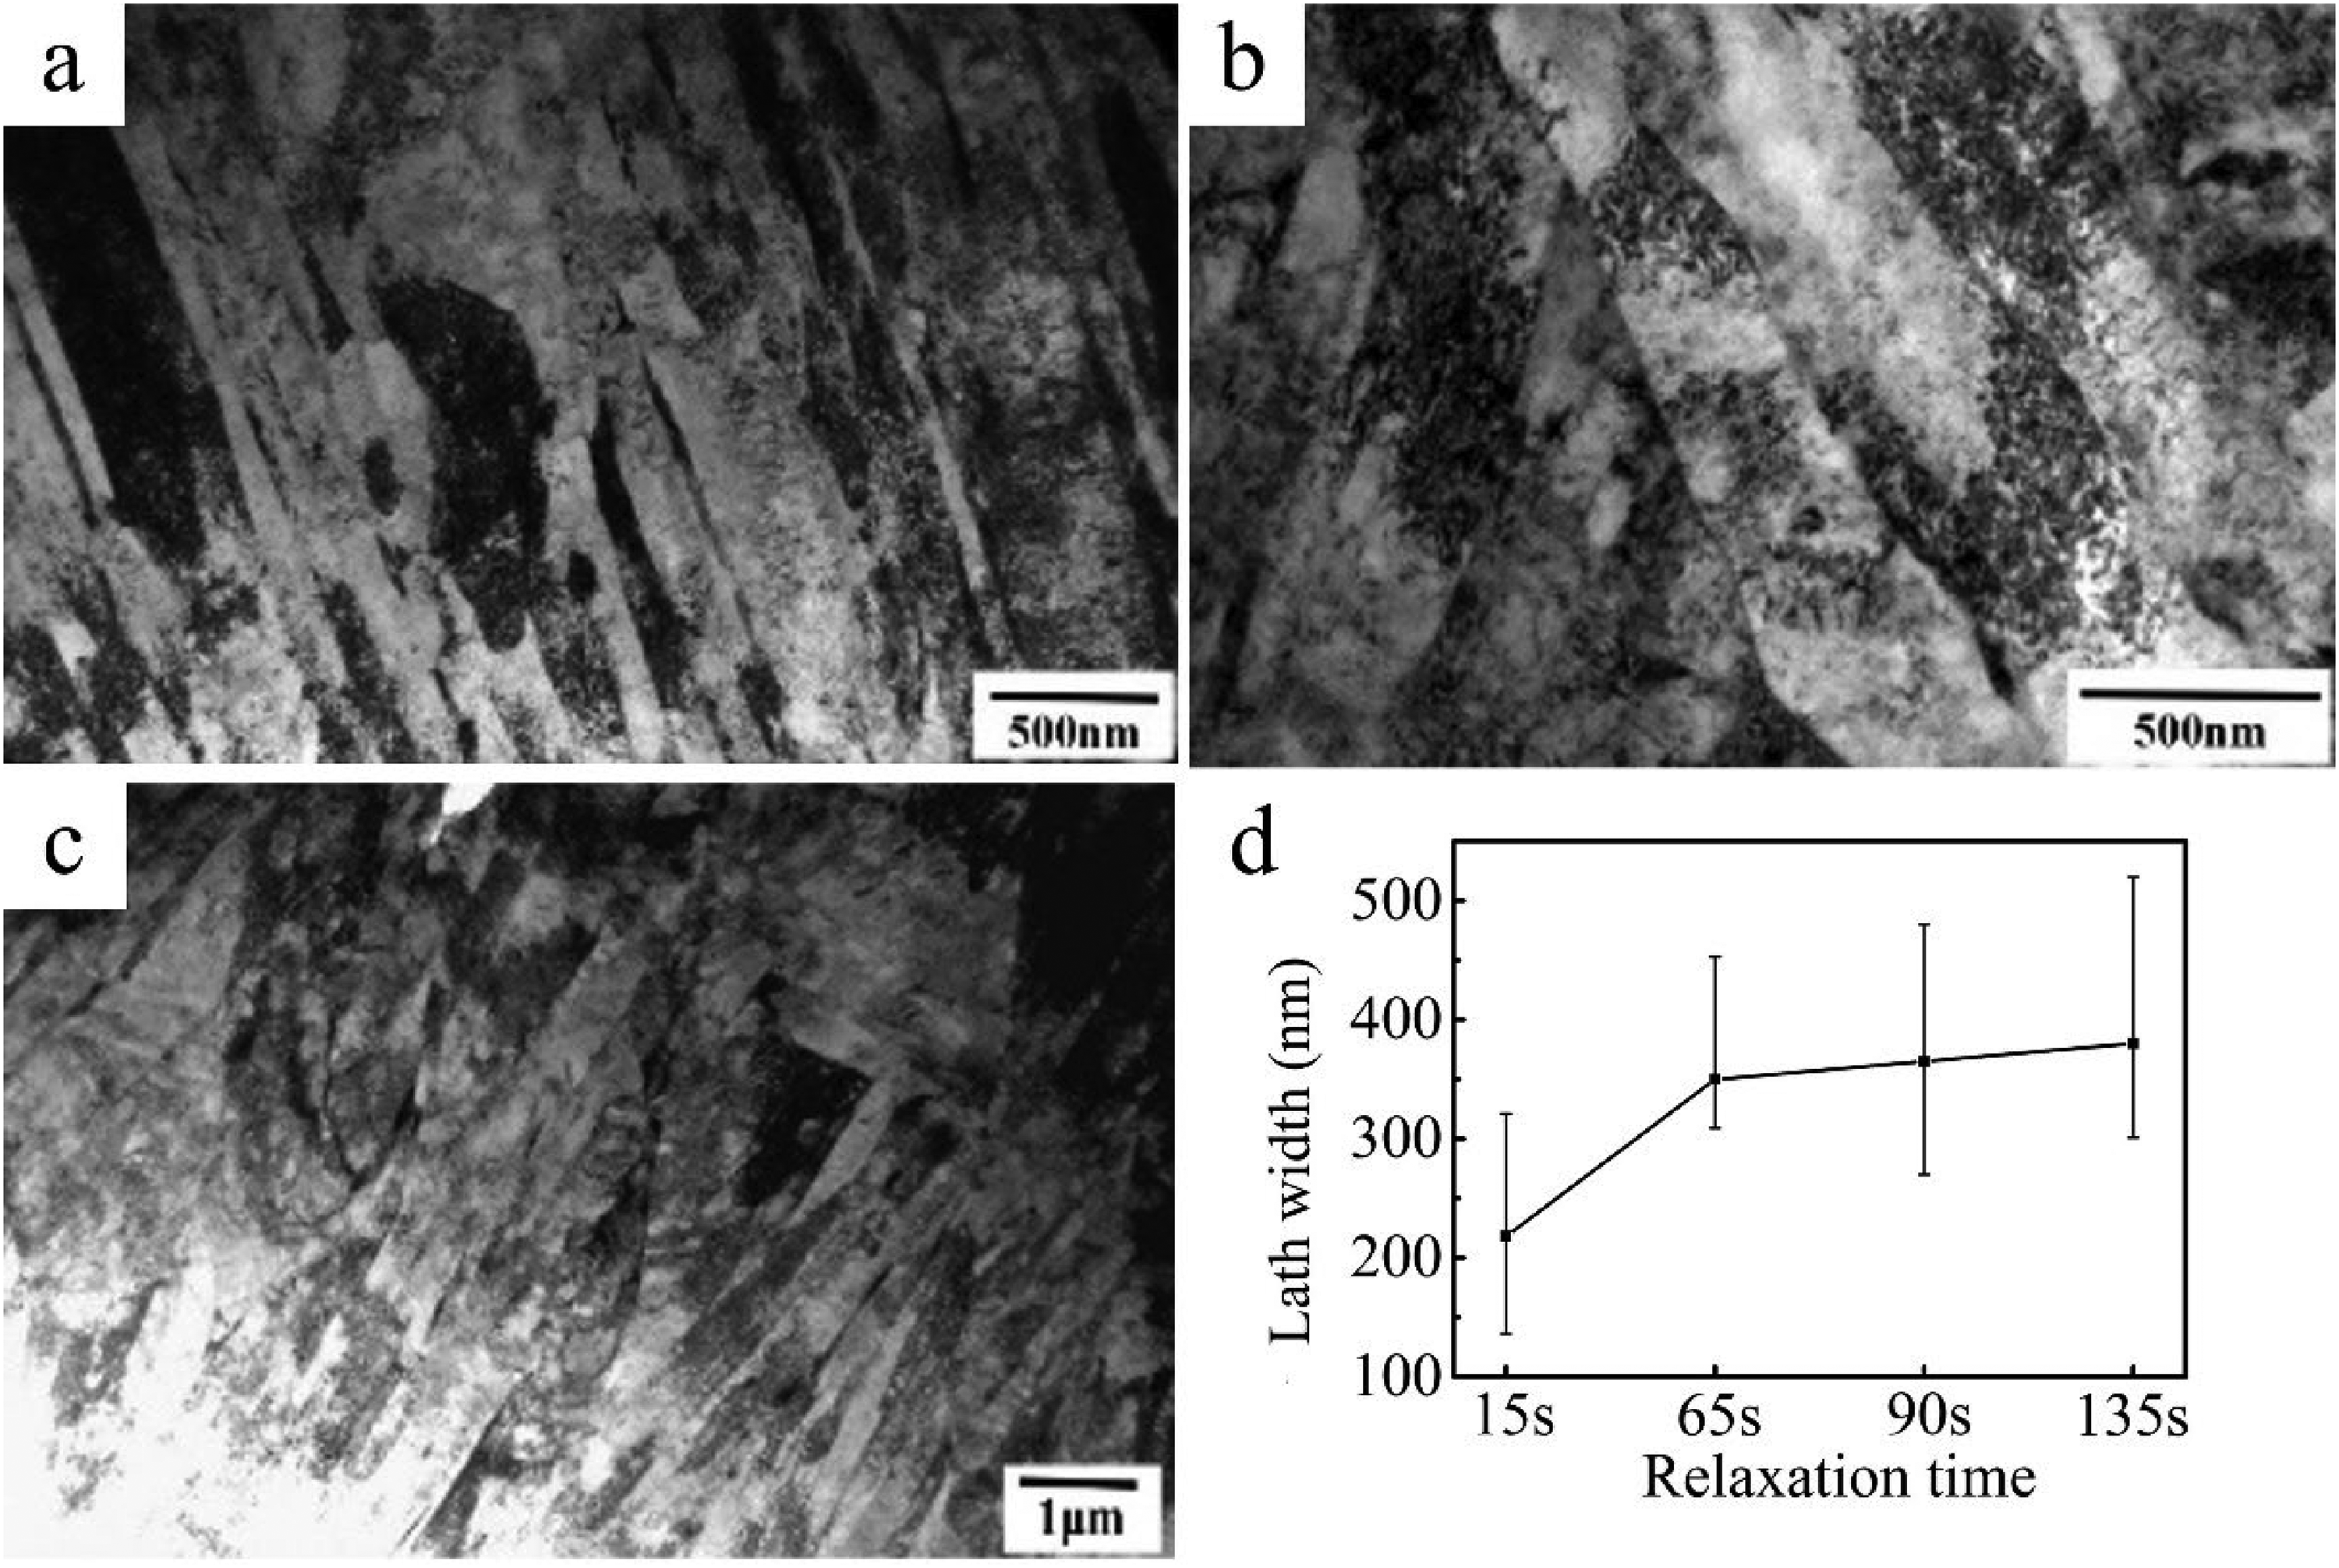
Martensitic lath of different relaxation time: (a) 15 s, (b) 65 s, (c) 135 s and (d) the lath width of different relaxation time.
As shown in Figure 6, the morphology of dislocations changed significantly with the relaxation time increase. When relaxed for 15 s, a notably high dislocation density was observed. As the relaxation time prolonged, the dislocations began to move, many dislocations appeared, and some of them recombined into cellular dislocations. When relaxed for 90 s and 135 s, more and more dislocations evolved into cellular dislocations. Additionally, nanometer-size precipitates could be found in Figure 6(c) and (d).
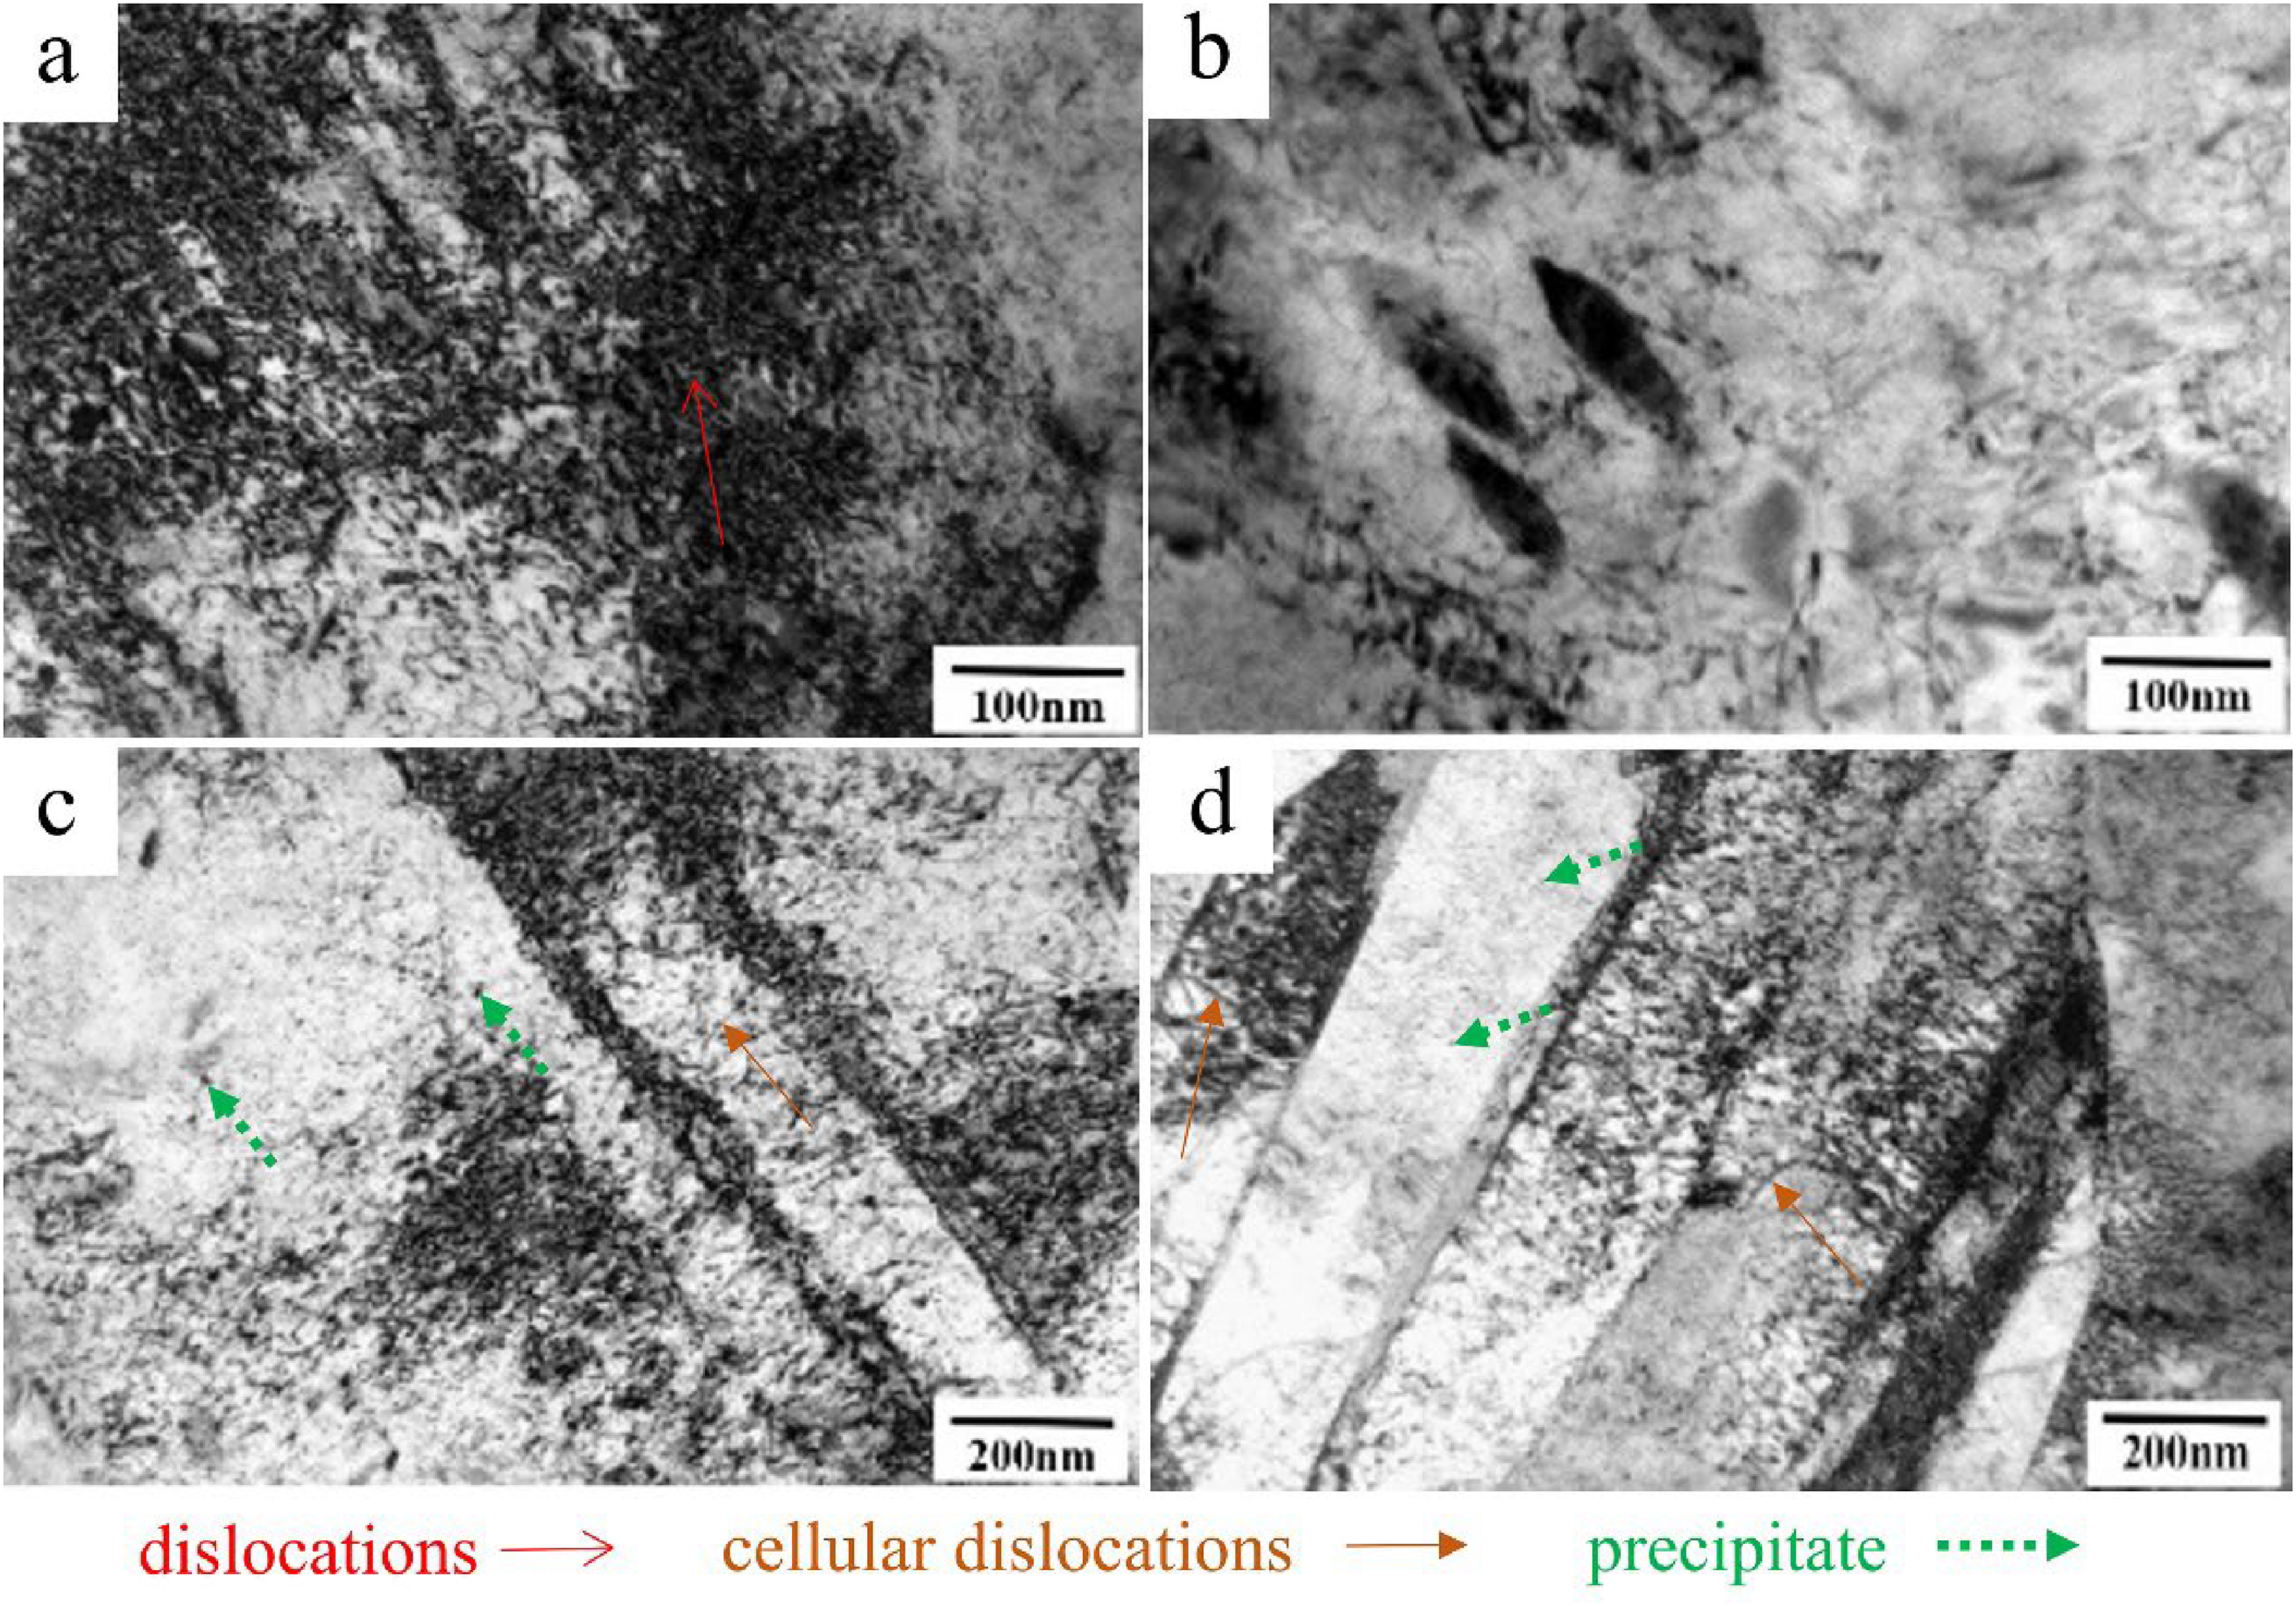
TEM results of different relaxation time: (a) 15 s, (b) 65 s, (c) 90 s and (d) 135 s.
The distribution of grain boundaries was tested by EBSD, as shown in Figure 7. The black lines represented high-angle grain boundaries (HAGBs) (≥15 °), and the green lines denoted low-angle grain boundaries (<15°). The length of HAGBs in the detected area and the average grain size are shown in Figure 7(e) and (f). The length of HAGBs consistently rose, in addition, the average grain size declined first sharply and then gently with the relaxation time extension.
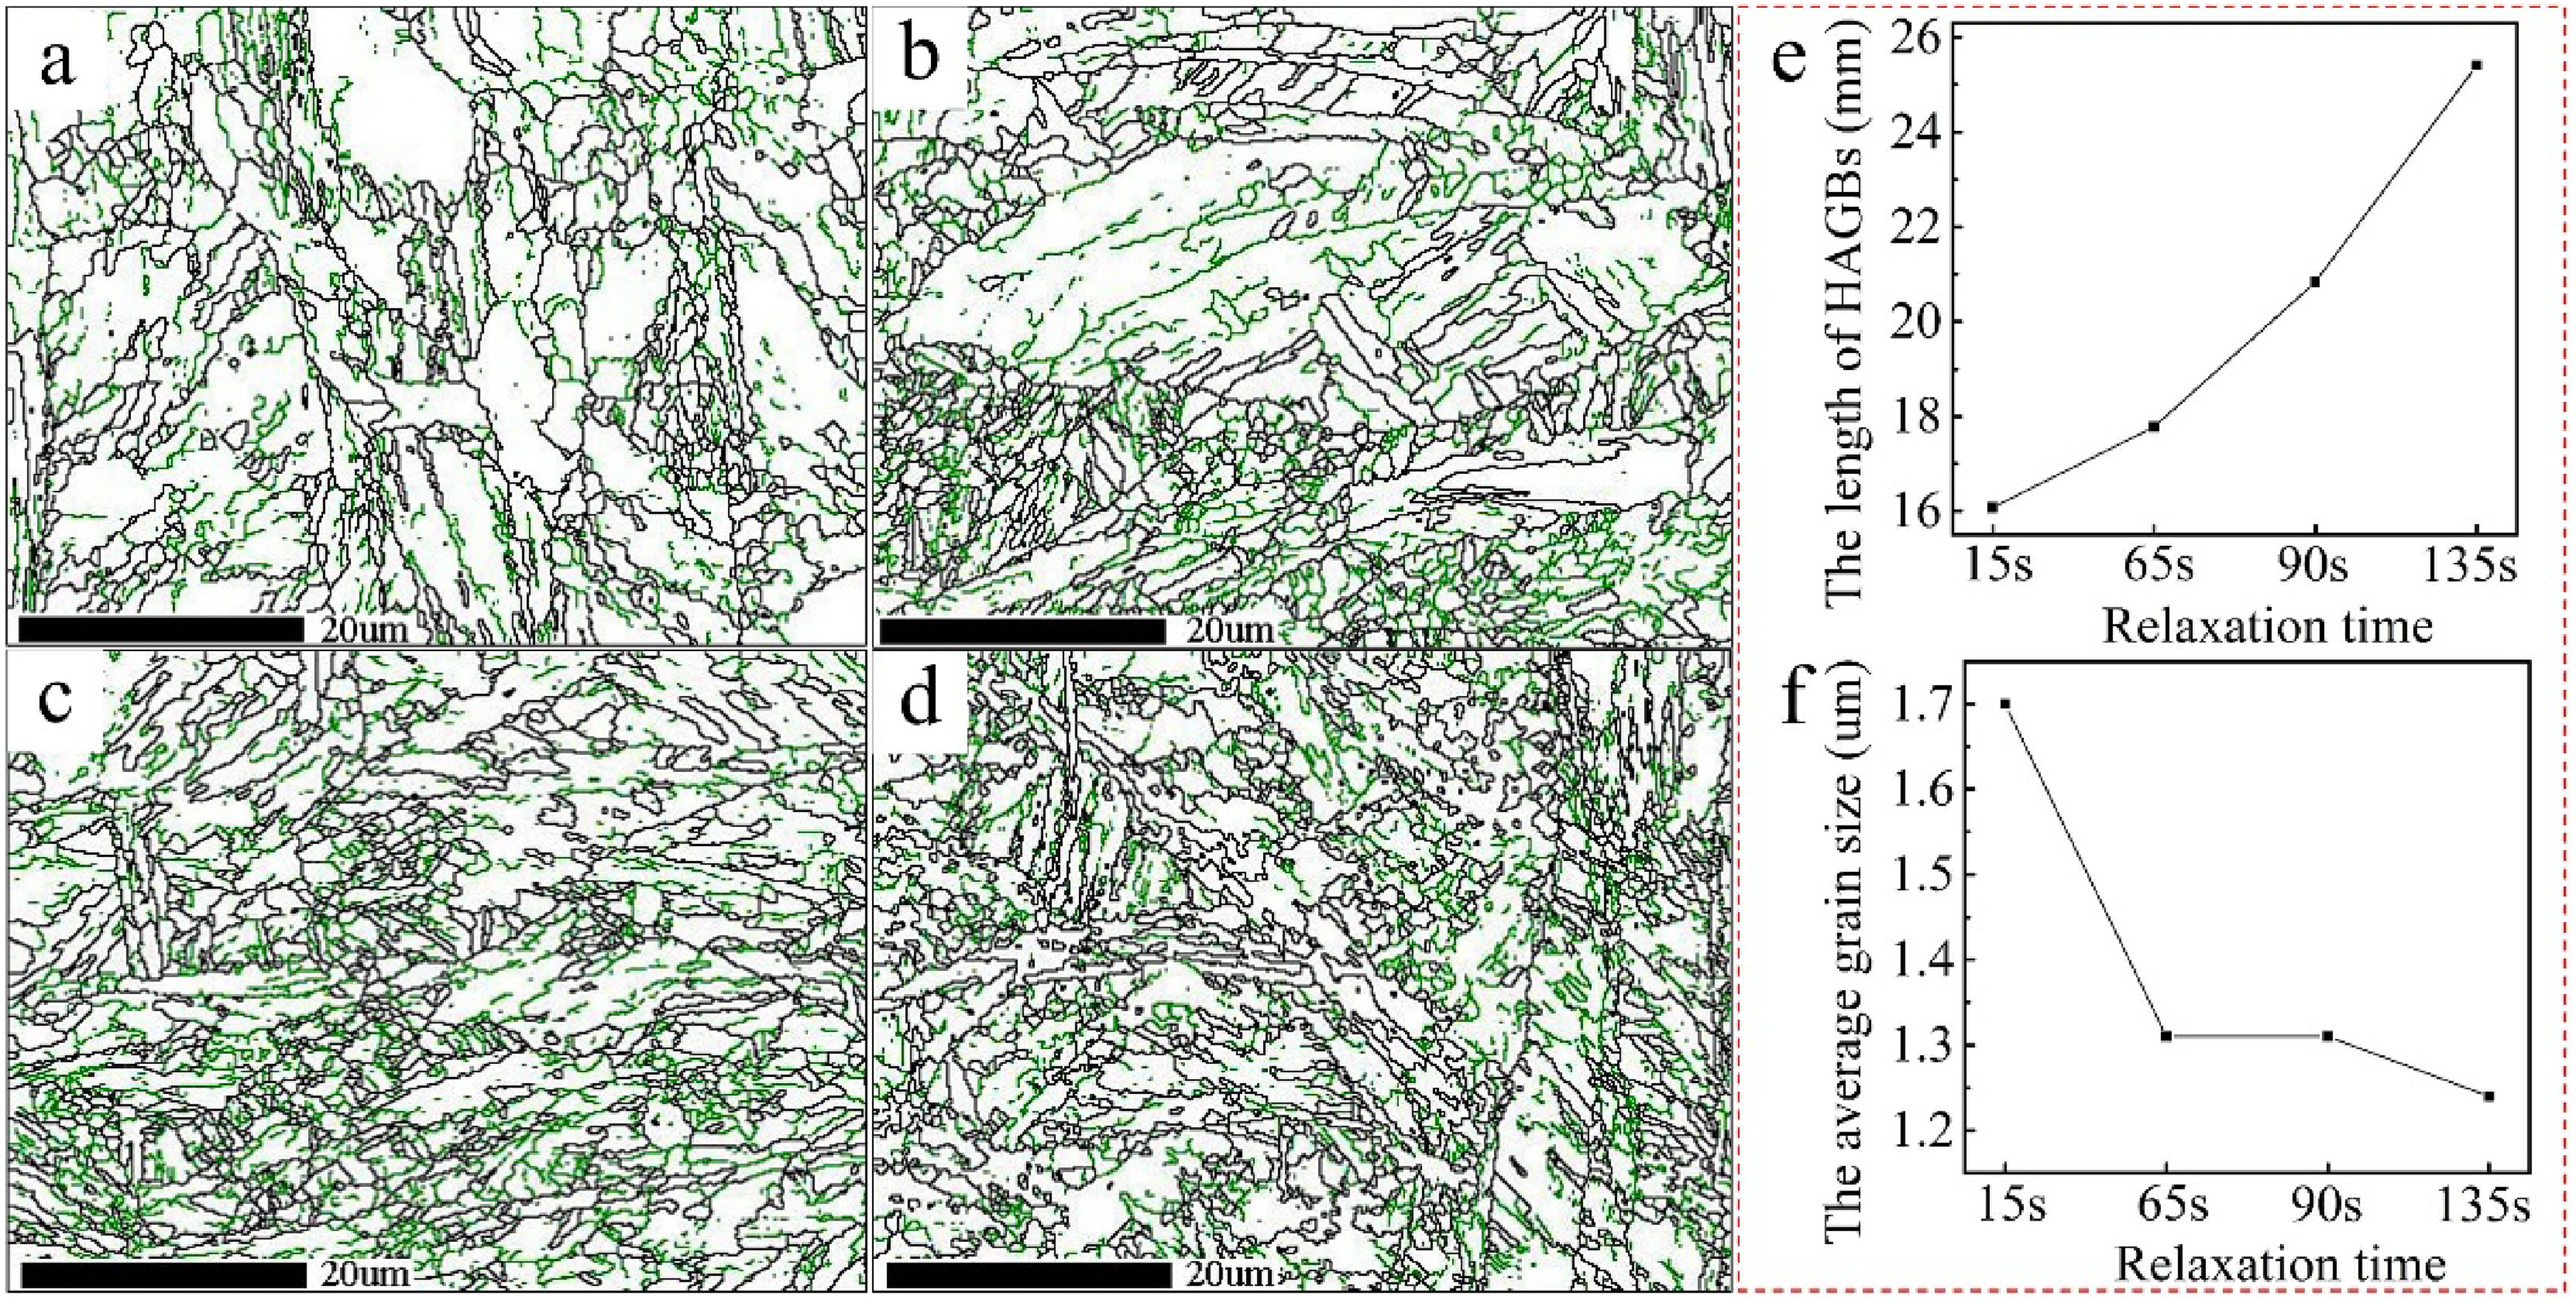
Distribution of grain boundaries of different relaxation time: (a) 15 s, (b) 65 s, (c) 90 s, (d) 135 s, (e) the length of HAGBs and (f) the average grain size.
Based on the XRD peak profiles in Figure 8, the microstructures were predominantly martensite. Austenite was detected in negligible amounts (approximately 2%) when relaxed for 65 s and 90 s. This observation could be attributed to three factors. First and foremost, the volume fraction of retained austenite changed from 0% to 2%, which was within the resolution limit of XRD. Second, the volume fraction (about 2%) might be too low to influence the impact energy 20 and the strength. At last, microscopic analyses did not reveal the presence of austenite.
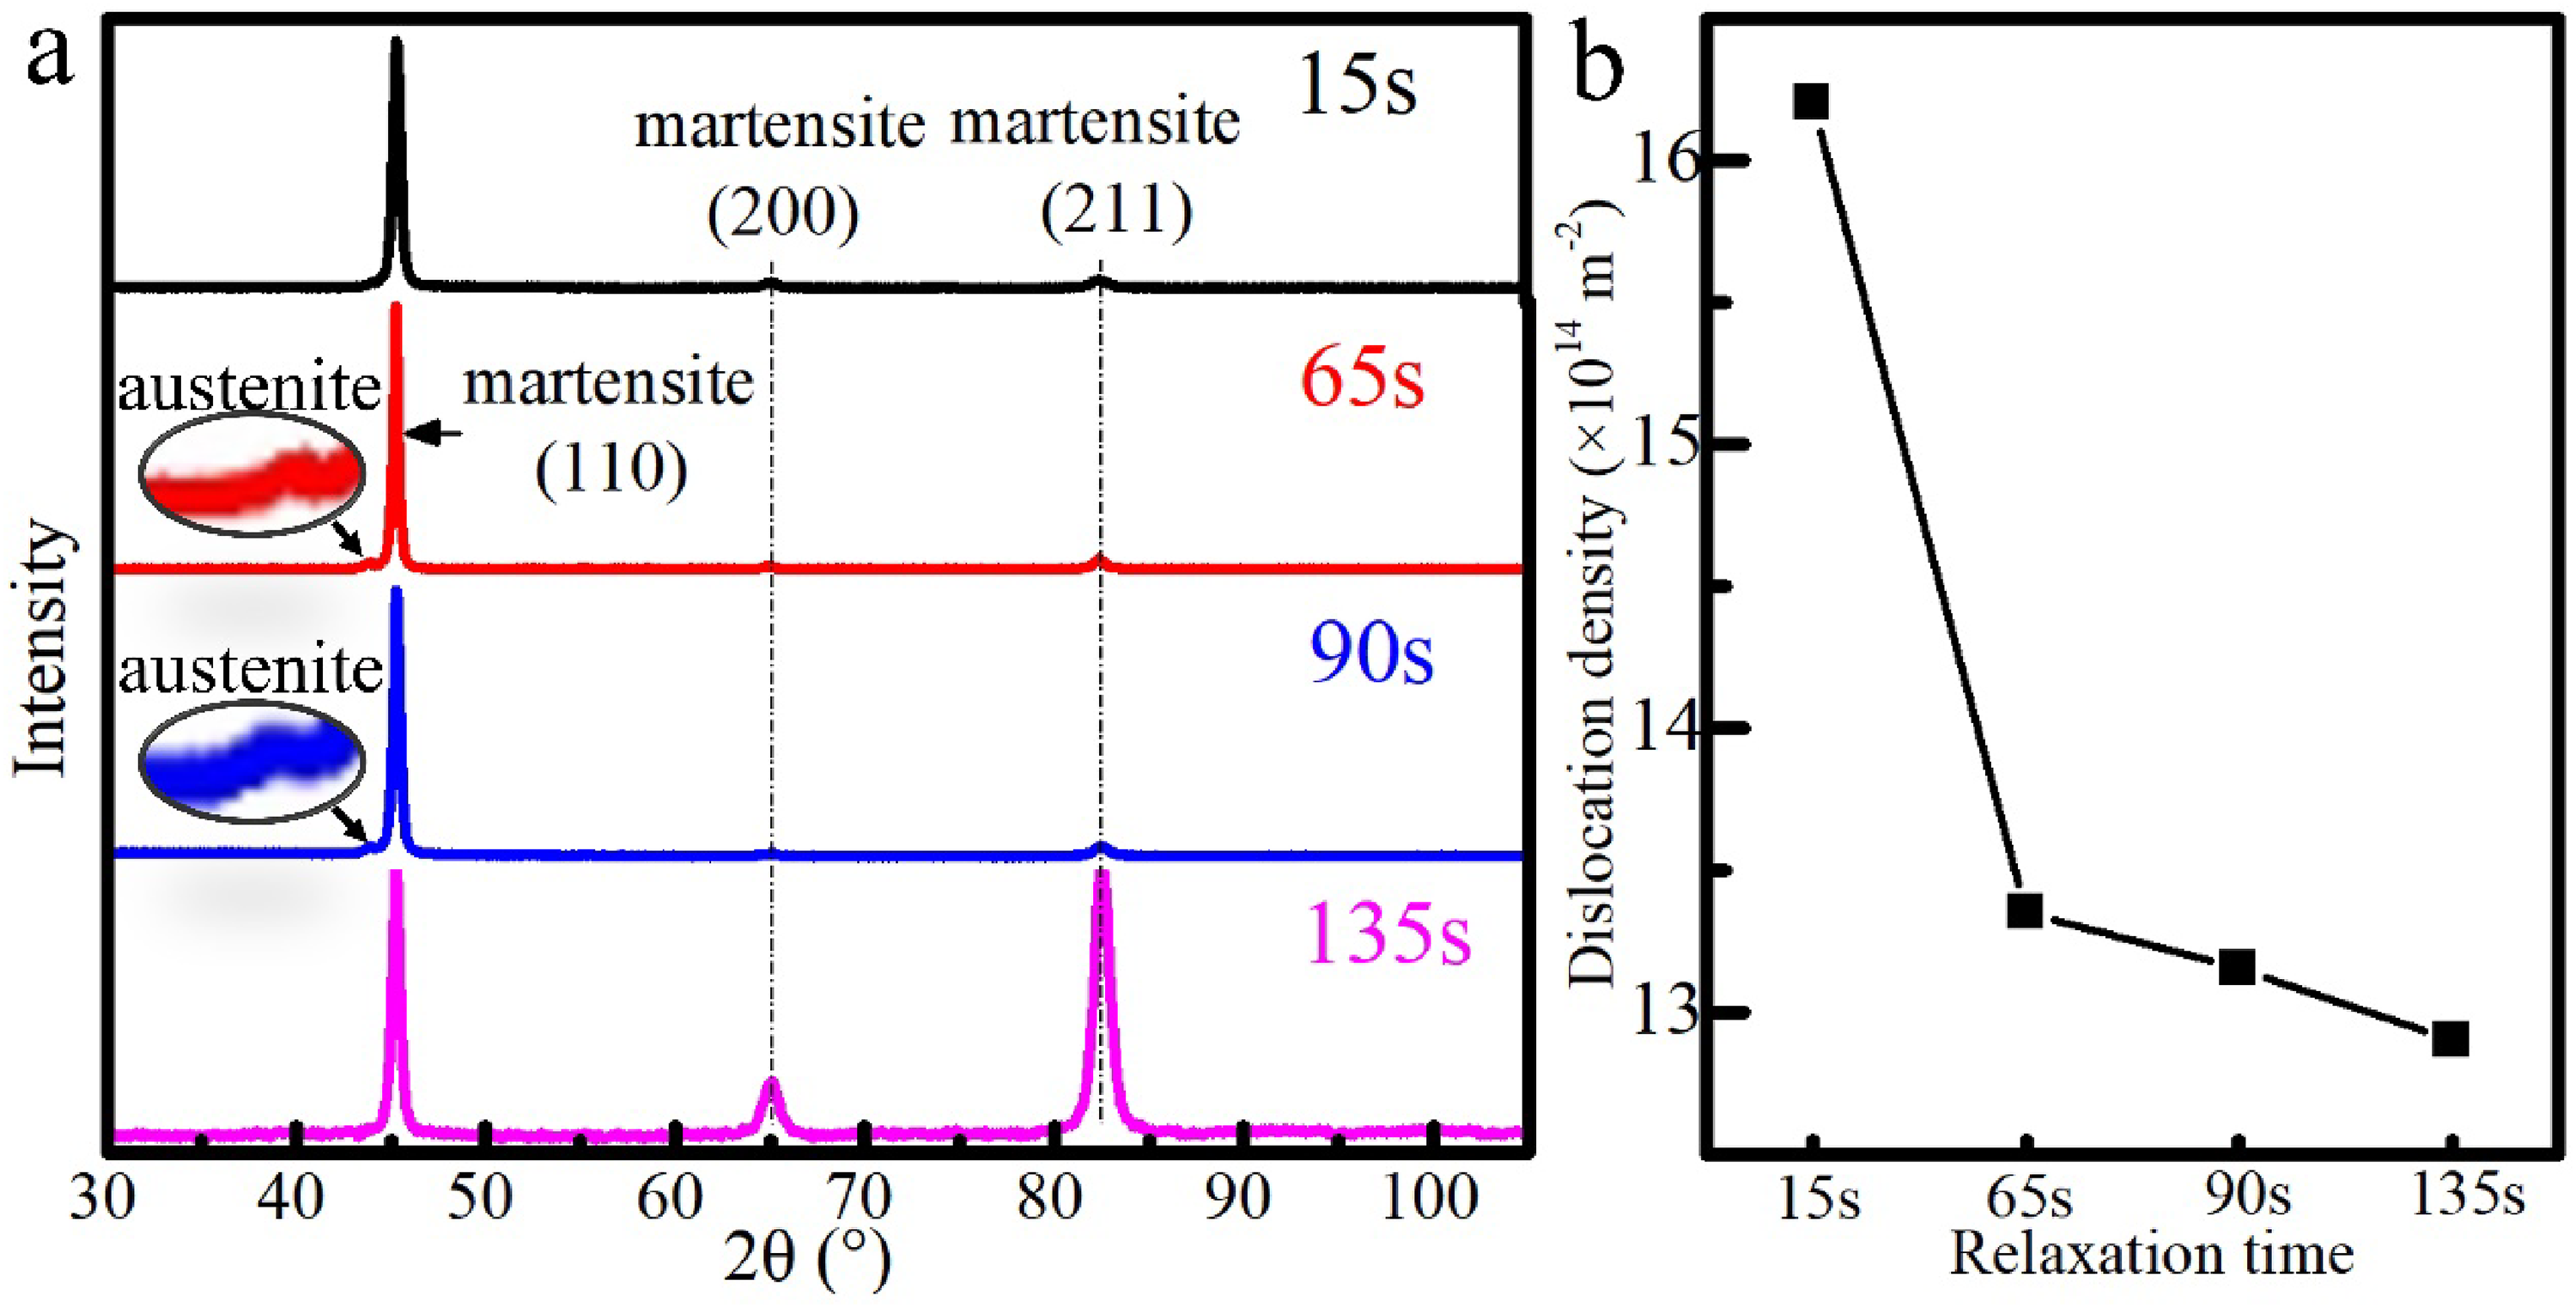
(a) XRD results and (b) dislocation density of different relaxation time.
When relaxed for 135 s, the peak intensity of (110) dropped, while the peak intensity of (211) increased. That might be associated with the crystal orientation of martensitic lath, 21 which would influence mechanical properties along different directions (such as rolling direction and TD). Nonetheless, the mechanical properties in different directions would not be tested and discussed in this work, and the crystal orientation would not be discussed further. Figure 8(b) depicts the dislocation density calculated using formula (1). The dislocation density decreased with the relaxation time extension. The decrease from 15 s to 65 s was more evident than that from 65 s to 135 s.
Discussion
Microstructure evolution
After the online quenching process, the surface temperature was about 125 °C, whereas the centre temperature was slightly higher than the surface temperature because the plate thickness was 20 mm. Subsequently, the plate was cooled in the air to room temperature. The centre along the thickness direction would go through cooling at a low cooling rate, also called, self-tempering at low temperature. Hence, the microstructures in Figure 4 were tempered martensite.
The microstructure evolution during relaxation could be represented by Figure 9(a)–(c). Meanwhile, the martensitic transformation during online quenching is illustrated in Figure 9(d–f). During relaxation, the plate will be cooled in air, which also means the 20 mm thickness plate would go through a slow cooling. The deformed austenite (Figure 9(a)) recovered 22 and the dislocation density decreased via climbing and moving (Figure 8(b)). The dislocations could recombine to form cellular dislocations (Figure 6). With the extension of relaxation time, cellular dislocations may form sub-grains within deformed austenite (Figure 9(b)). Prolonging relaxation time led to precipitation and equiaxed grains (Figure 9(c), Figure 6(c) and Figure 7). The previous works also prove that the precipitates in the steels containing Nb, V and Ti will precipitate as held at 670 °C to 760 °C.23,24 The equiaxed grains were not obviously observed in this work. No matter what happens in prior austenite before online quenching, the microstructure after online quenching is martensite (Figure 9(d–f)).
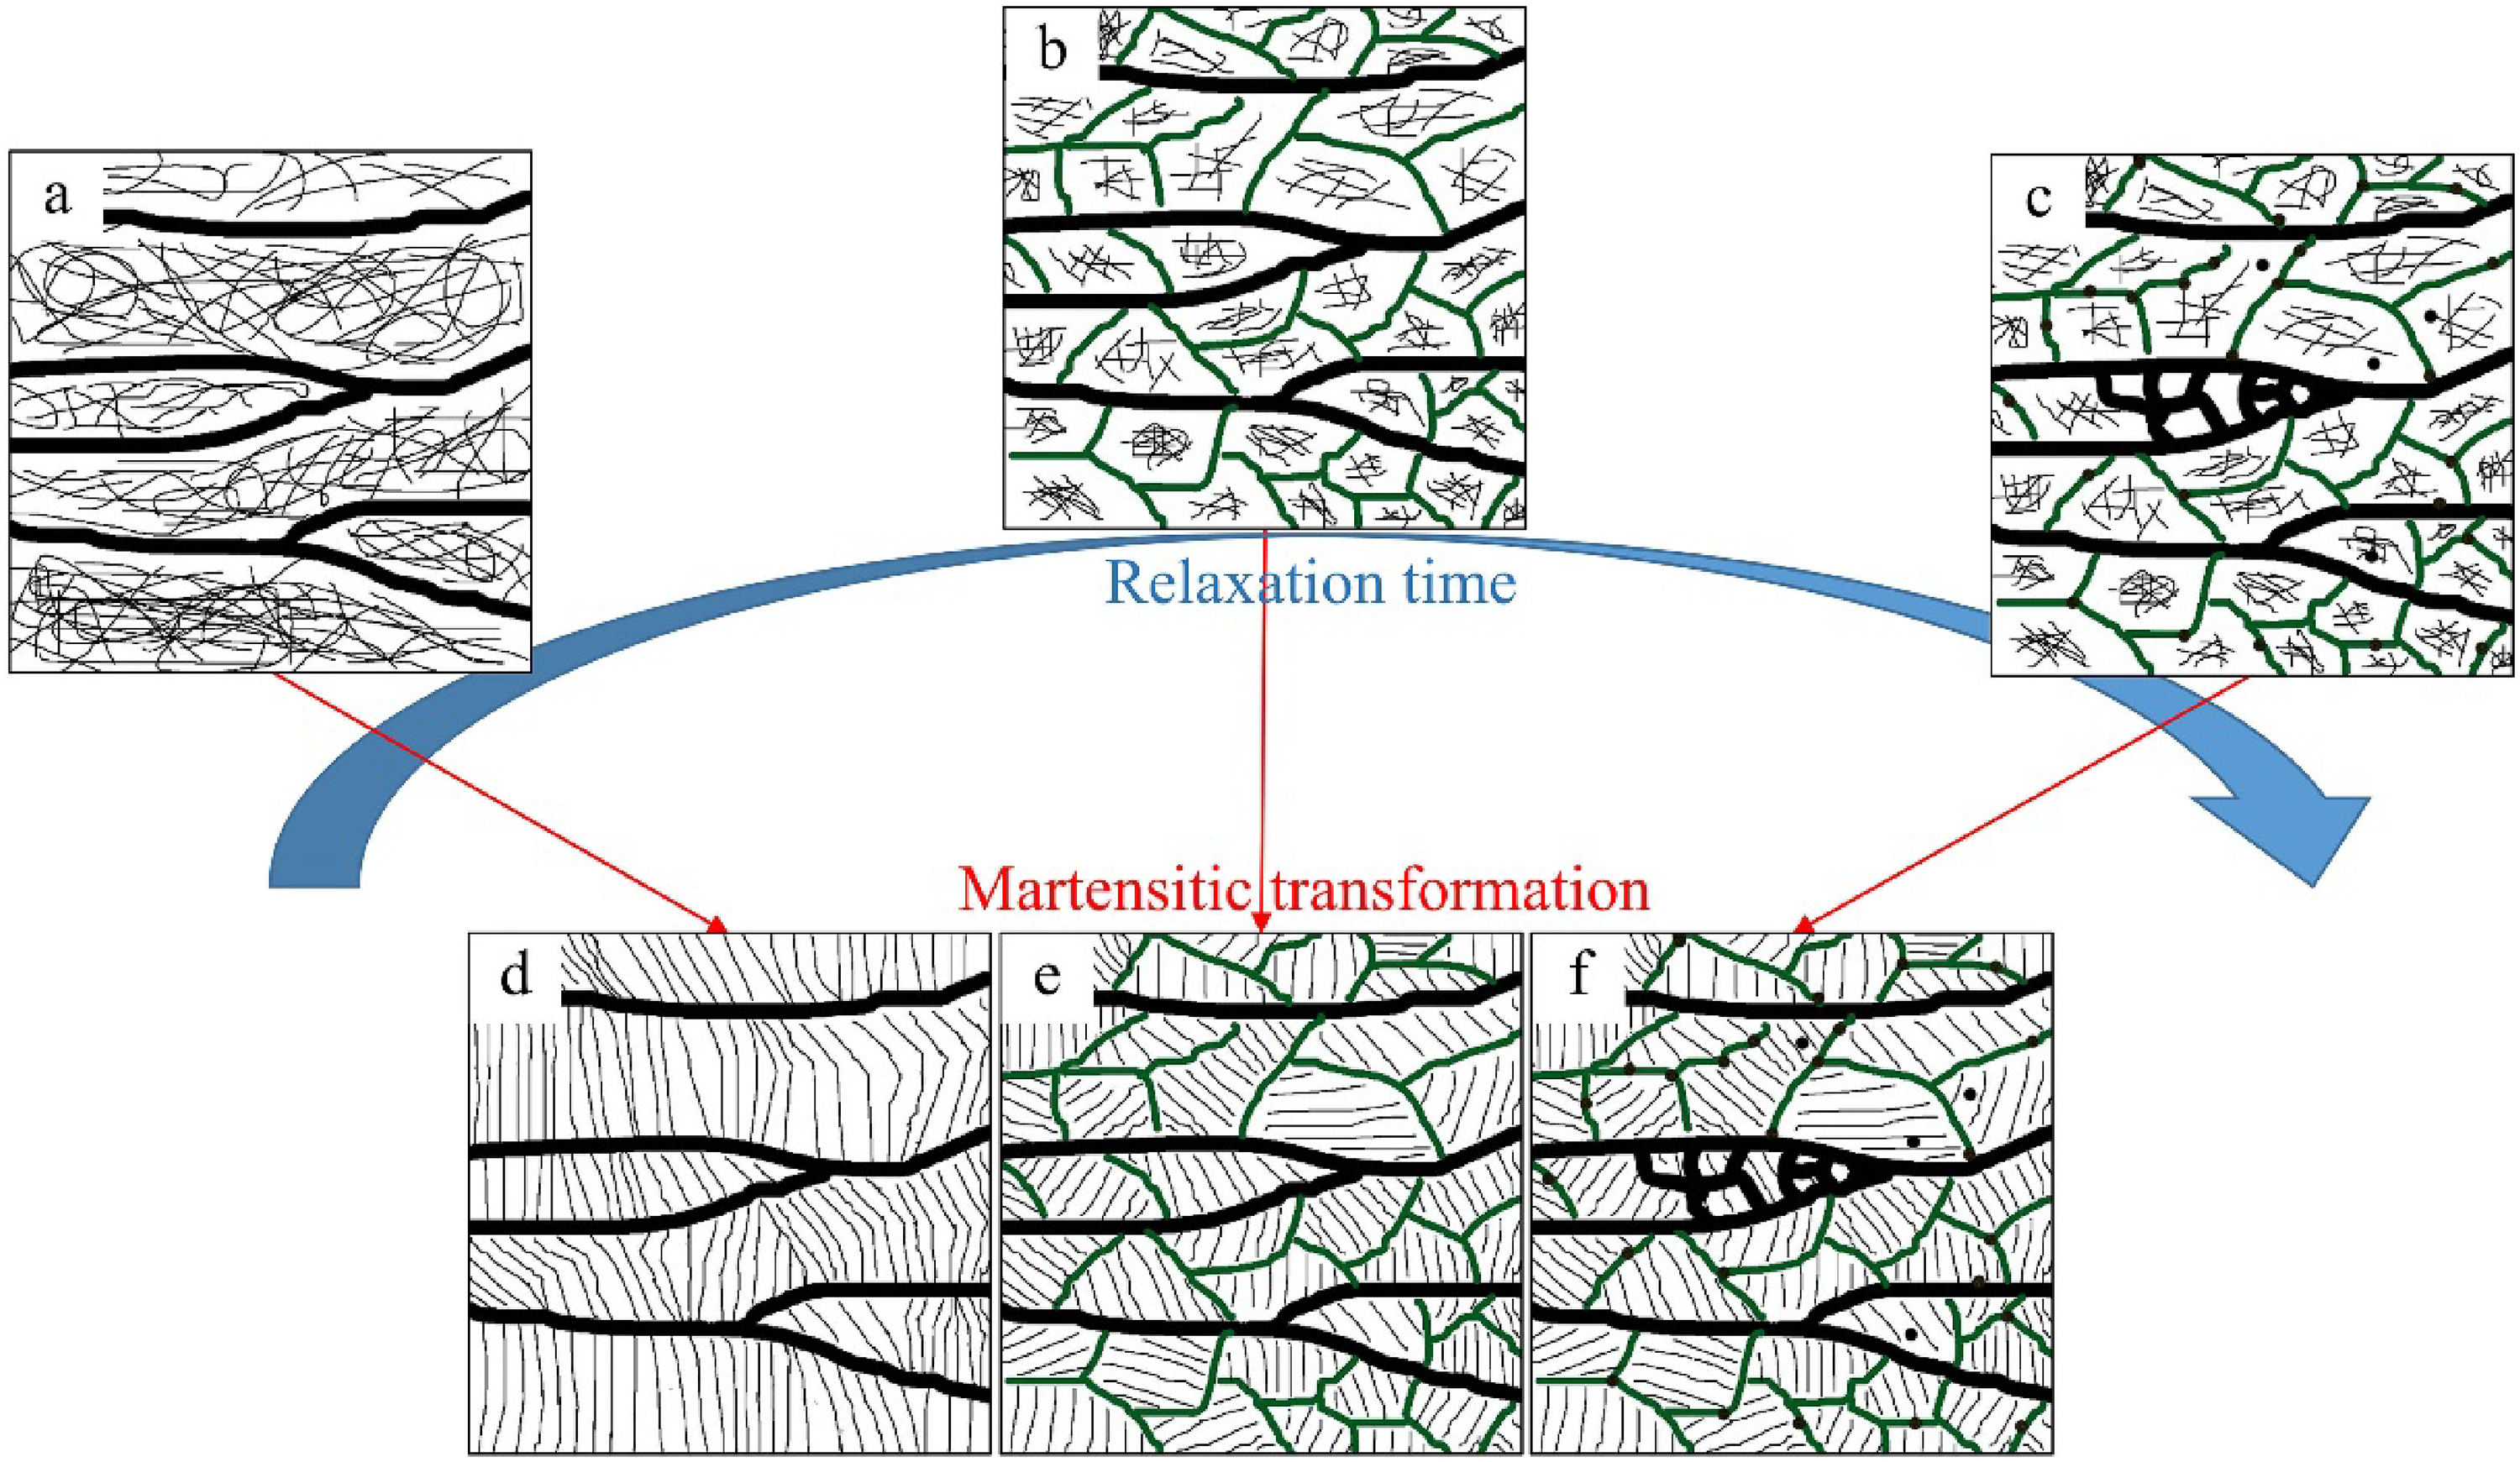
The microstructure evolution: (a) deformed austenite with high-density dislocation; (b) Forming substructures; (c) precipitations and equiaxed grains appearance; (d–f) martensitic transformation.
After rolling, the plates were relaxed (that was to say, cooled in the air) at about 800 °C to 670 °C (Figure 1), higher than the ferrite transition start temperature (Figure 3). That mean the plates would be held at the austenitising temperature for a certain time. The recovery occurred, while recrystallisation was unobserved in this work. The dislocation density dropped first sharply and then gently. This resulted from dislocations evolving into cellular dislocations (Figure 6), which are more stable. 19
The dislocation density calculated using the XRD results (Figure 8) comprised two components: dislocations caused by deformation, and those generated during martensitic transformation. As stated earlier, the dislocation density caused by deformation drops first sharply and then gently during the relaxation. As for the dislocations generated during martensitic transformation, they could be regarded as identical. Two factors can contribute to this. In the first place, the cooling rates after the martensite starting temperature (Ms) are the same. In addition, the temperature histories following online quenching (also called self-tempering) are also identical (as shown in Figures 1 and 3). In summary, the dislocations density (Figure 8(b)) drops first sharply and then gently due to the prolonging of relaxation time.
The crystal orientation changes in the steel plate, considering the recovery during relaxation and the martensitic transformation, contribute to the length increase of HAGBs and the decrease of average grain size (Figure 7). It may have an impact on the peak intensity of XRD results in Figure 8(a). Nonetheless, the crystal orientation will not be further discussed in this work, because the performances in different directions are not the primary focus of the current work.
The martensitic lath width is not affected by the prior austenite grain size, which is mainly controlled by the nucleation rate of martensite during the phase transformation. 25 The molecular dynamics (MD) simulations have demonstrated that dislocations could promote the nucleation of martensite. 26 So, the high dislocation density before online quenching could increase the number of martensitic nucleation sites, resulting in a narrow width of the martensitic lath. The dislocation density dropped first sharply and then gently in Figure 8(b). Correspondingly, the dislocation density caused by deformation drops first sharply and then gently during relaxation, as shown in Figure 9. That would have an effect on the following martensitic transformation, leading to a sharp and then gradual increase in the width of martensitic laths, as illustrated in Figure 5(d). There seemed to be a linear relation between lath width and dislocation density (Adjusted R-Square = 0.9989), as shown in Figure 10. The dislocations generated during martensitic transformation could be regarded as identical, thus, a linear relation between lath width and dislocation density caused by deformation could be established.
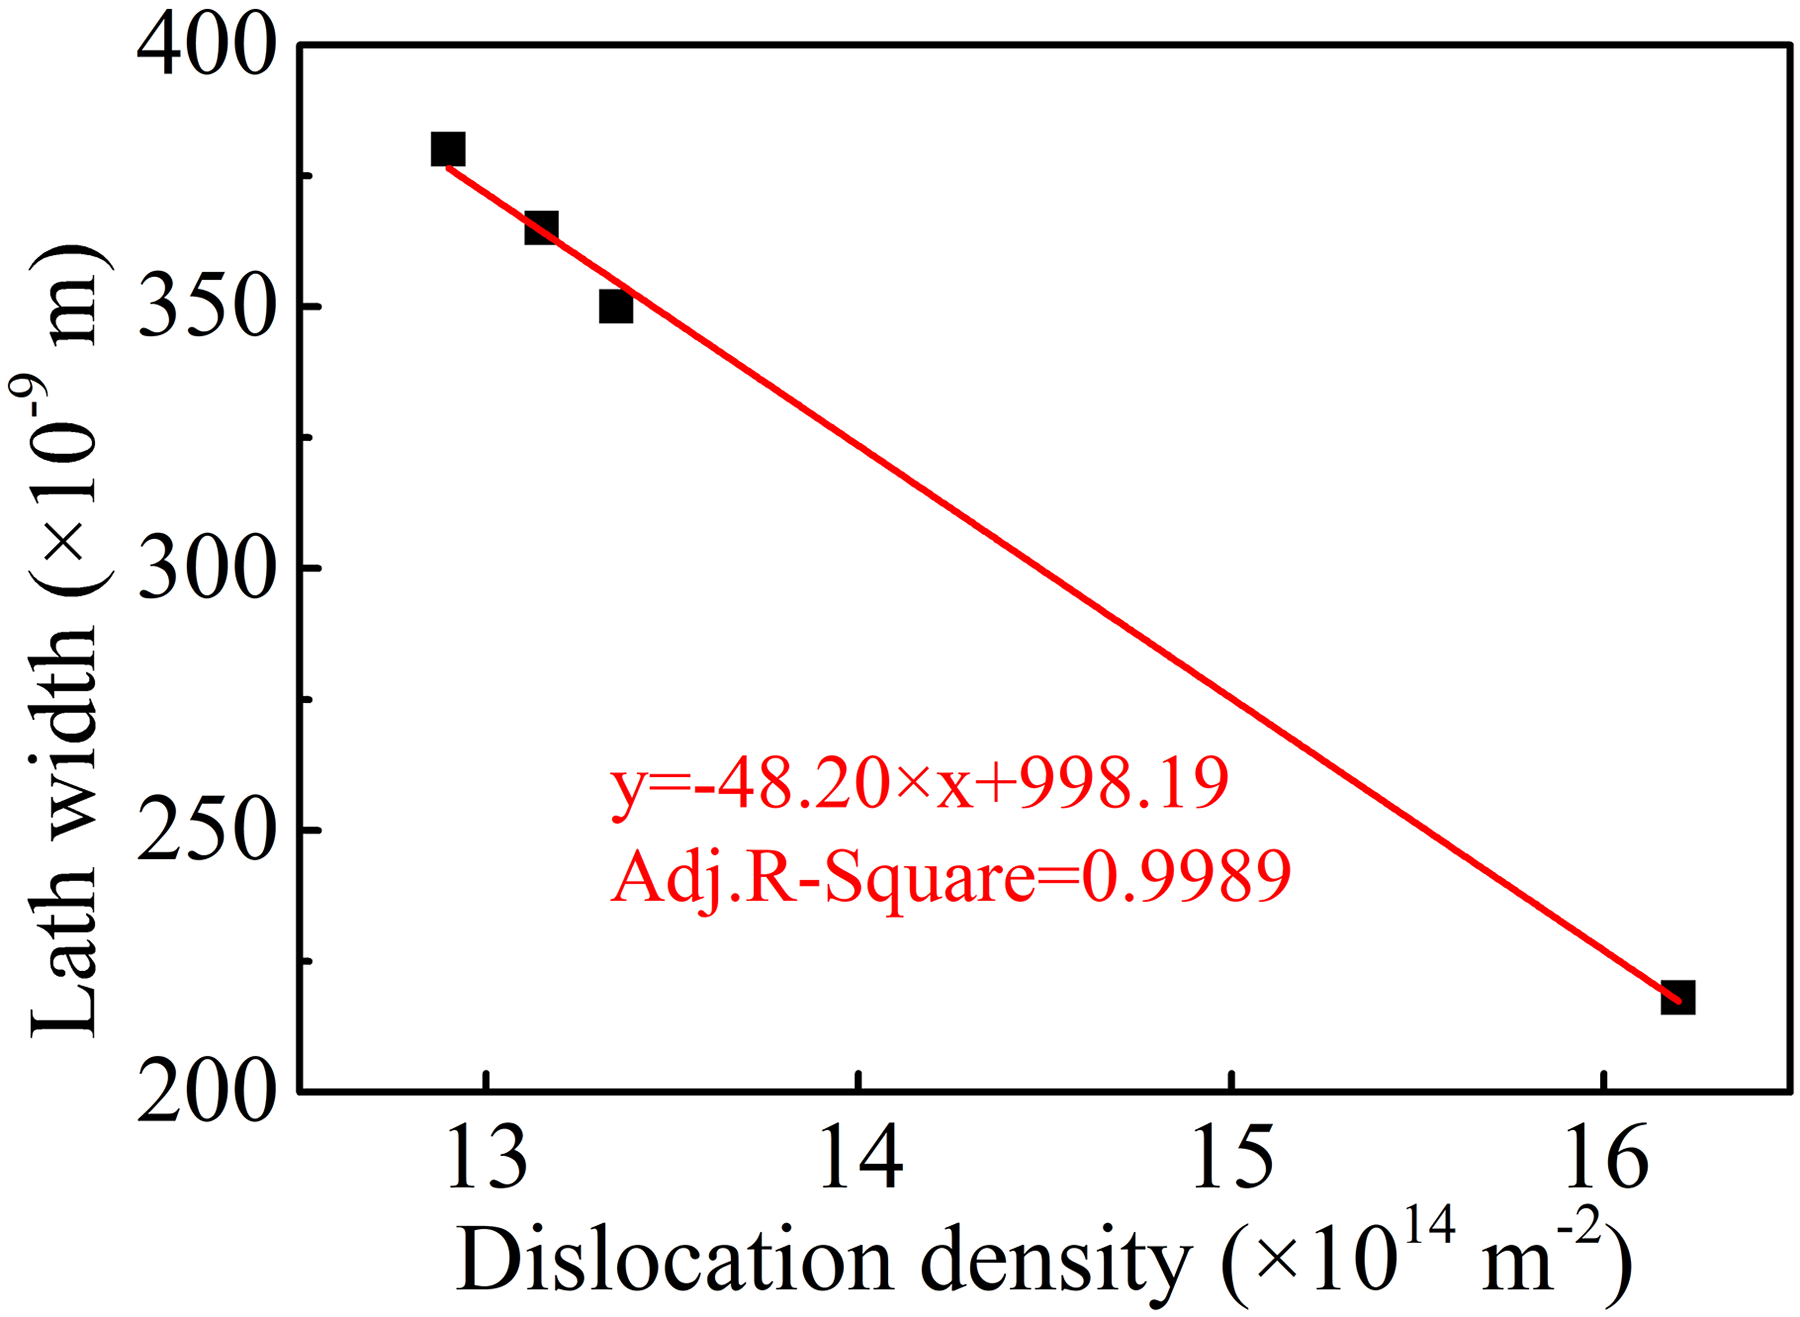
The relation between lath width and dislocations density.
Most of the martensite nucleation positions are the austenite grain boundary. 27 So, when relaxed for 15 s, martensite mainly nucleates along the austenite grain boundaries and grows up. The lath directions were relatively single in the original austenite grain (Figure 5(a)). During the relaxation process, the sub-grains formed by the dislocations in the austenite serve as the preferential nucleation positions of martensite, 27 resulting in laths growing in various directions (Figure 5(c)). The laths with different directions intersect with each other, thereby limiting the growth of laths. Additionally, the sub-grains also prevent the growth of laths, thus restricting the length of the laths.
Strengthening mechanism
The strengthening mechanisms of low-carbon martensitic steel include solid solution strengthening, dislocation strengthening, precipitation strengthening, and grain refinement strengthening.
The effect of dislocation on strength can be expressed by
28
:
Grain refinement strengthening could be expressed by the classical empirical formula between the strength and the grain size, namely, the Hall–Petch formula
29
:
When the relaxation time increased from 15 s to 65 s, the yield strength decreased from 1050 MPa to 950 MPa. The primary factor contributing to this decrease was the increase of lath width (causing a 90.3 MPa decrease), followed by the decrease of dislocation density (causing a 54.2 MPa decrease), according to formula (2) and (3). The yield strength and tensile strength improved slightly with the increasing relaxation time from 65 s to 135 s. This may be attributed to the formation of small precipitates during the process of relaxation (Figure 6). The researchers have proved that the precipitates from during holding at 670 °C to 760 °C and contribute to strength improvement.23,24
Toughening mechanism
The previous works33,34 show that the lath bundles or blocks with HAGBs are the subunits controlling toughness in low-carbon martensitic steels. The impact cracks will turn and change direction at or near the HAGBs during its propagation. The more the HAGBs are, the more times the cracks turn, and the more energy will be consumed. Thus, the impact energy has been improved. The length of HAGBs per unit volume of steel increased with the relaxation time increase (Figure 7), thus the impact energy was improved (Figure 2(c)).
The low dislocation density makes the crack less susceptible to nucleation and propagation, thus improving the impact energy of the steel. 35 The dislocation density drops first sharply and then gently with the increase of relaxation time from 15 s to 135 s in Figure 8(b), while an inverse trend of impact energy at −20 °C is shown in Figure 2(c). There seemed to be a stronger correlation between the impact energy at −20 °C and the dislocation density than that between the impact energy at −20 °C and the length of HAGBs. Figure 11 shows a linear relation between the impact energy at −20 °C and the square root of dislocation density (Adjusted R-Square = 0.9886). Thus, the dislocation density had a more tremendous impact on the impact energy at −20 °C than the length of HAGBs in this work.
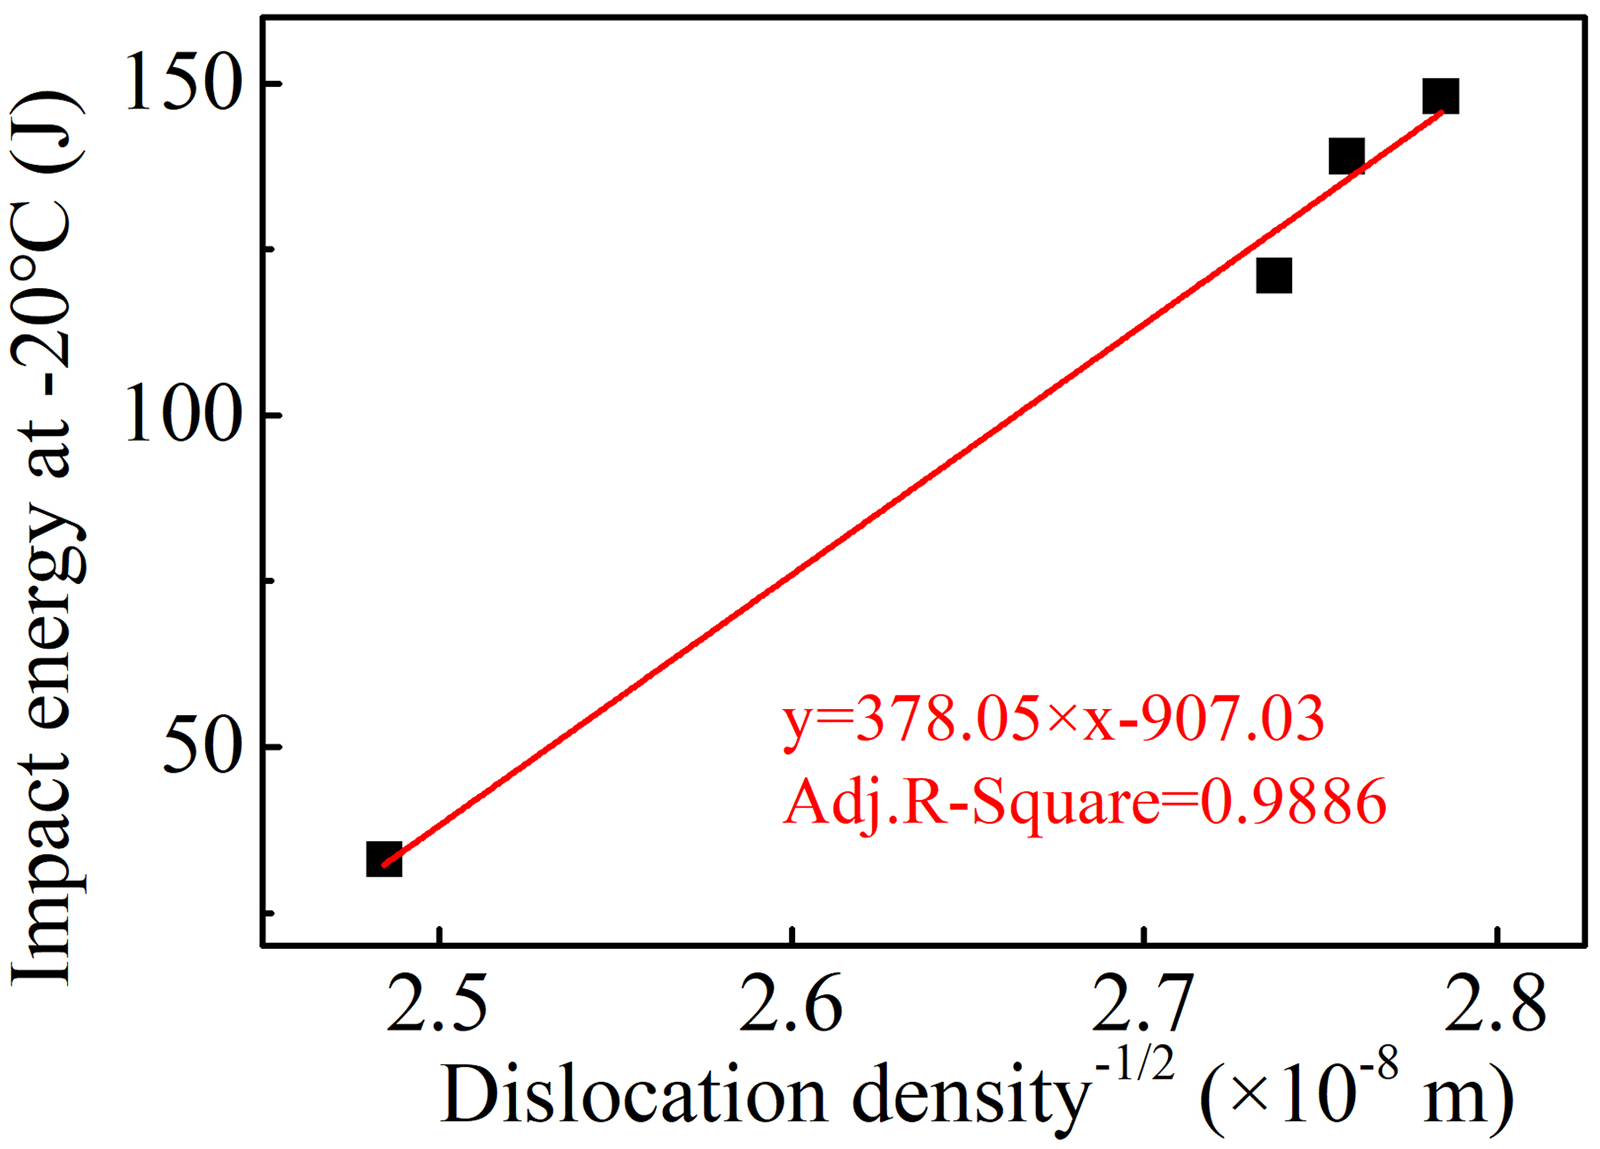
The relation between the impact energy at −20 °C and dislocation density−1/2.
Conclusion
The conclusions of this work on the effect of relaxation time before online quenching on microstructure and properties of high-strength medium-thickness steel plates are as follows:
The dislocation density caused by deformation drops first sharply and then gently during relaxation. Therefore, the dislocation density decreased first sharply and then gently with the increase of relaxation time, resulting in an inverse trend of martensitic lath width from 218 nm to 390 nm. With the relaxation time increased from 15 s to 65 s, the yield strength of high-strength steel decreased from 1050 MPa to 950 MPa. The main factor was the increase of lath width, followed by the decrease of dislocation density. The impact energy at −20 °C increased from 33 J to 148 J. It was influenced by the dislocation density and the high-angle grain boundaries. Notably, there seemed to be a linear relation between impact energy at −20 °C and the square root of dislocation density. Aiming to meet the requirements of grade high-strength steels and improve the toughness, the relaxation time should be controlled between 65 s and 135 s, and the corresponding quenching start temperature should be between 670 °C and 730 °C.
Footnotes
Declaration of conflicting interests
The authors declared no potential conflicts of interest with respect to the research, authorship and/or publication of this article.
Funding
The authors received no financial support for the research, authorship and/or publication of this article.