
Abstract
In this study, the flexural behaviour of high-strength concrete was tested with chopped carbon fibres that were 30 mm long and added in amounts of 0.2%, 0.4%, 0.6%, 0.8%, and 1%. Thirty-six prisms were evaluated experimentally for flexural strength at 28 days using an ultrasonic pulse velocity test and a flexural testing machine. X-ray diffraction and linear regression analysis were carried out to characterise crystalline material and linear correlation amongst different mixes. Increasing the number of carbon fibres in high-strength concrete led to unexpected and innovative findings, such as lower pulse velocities and improved flexural characteristics up to an optimum dosage point. In SEM images of chopped carbon fibres, debonding was the most prevalent cause of failure.
Keywords
Introduction
Due to the fast-growing world's modernisation, there is high natural resource consumption with rapidly growing demands of urbanisation, industrialisation, etc., resulting in the dumping of scrap materials all over places, which is becoming a tedious task for humans to tackle this problematic situation. Hence it is highly essential to dispose of these scrap materials is utmost required. Hence the reuse of scrap materials could be a solution to save our mother earth and the environment from the harmful side effects of these scrap materials. In construction, several scrap materials are used worldwide, such as fly ash, silica fume, tire shreds, carbon fibres, etc. Innovative research is going on to develop high-strength concrete using scrap materials; this way, apart from attaining high strength, we are helping reuse processes. Research has been going on to understand the role of silica fume and fly ash in developing high-strength concrete. 1 Several studies have been carried out on the properties of carbon fibre reinforcement in cement-based materials, reinforcement effect, and flexural toughness in concrete.2–4
Moreover, some researchers have helped the construction field by enlightening the world with chopped fibres for attaining high-strength concrete.5,6 Several researchers have benefited the construction industry by raising public awareness of incorporating chopped fibres to generate high-strength concrete.5–11 In addition, research has been done to see if the performance of regular concrete may be enhanced by adding a variety of fibres to the mix.12–16 According to the authors, there is relatively little research on using chopped carbon fibre fragments to achieve high-strength concrete.6,13,17,18 High-strength concrete was developed by reinforcing chopped carbon fibres into the concrete matrix, and its unique and intriguing character made its usage in building relatively straightforward. So, the present research aimed to learn about the properties of chopped carbon fibre reinforcement to design high-strength concrete using waste products such as silica fume and fly ash. The flexural property of high-strength concrete with a novel aspect ratio and dosage values of chopped carbon fibres was chosen to offer originality to the study. So, a new investigation into enhanced high-strength concrete is required due to the exceptional and erratic outcomes of the ultrasonic pulse velocity test and the flexural strength test setup. Destructive and non-destructive testing, X-ray diffraction (XRD), and analytical analysis were used to evaluate the feasibility of carbon fibre and the flexure performance of high-strength concrete in 36 prismatic beams of six different mixes, each with 30 mm average length and a dose value of 0.2%, 0.4%, 0.6%, 0.8%, and 1% of fibres.
Test methodology
Raw materials and concrete mix design
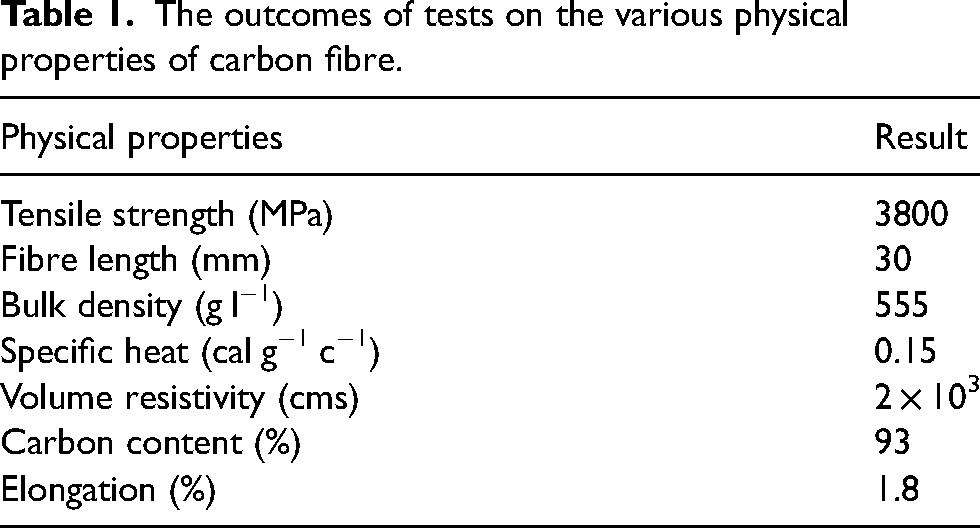
Fibre-reinforced high-strength concrete was created with the help of fly ash grade 1, silica fume, OPC 43 cement, coarse and fine aggregates, super plasticiser additive (S.P), carbon fibres, and water as chief ingredients. The preliminary cement tests were performed as per the IS 8112-2013 norm. 19 Ordinary Portland Cement, which has a minimum 43 MPa compressive strength, also known as OPC 43, was incorporated to develop concrete specimens of the desired strength. Specifications specified by 3812 20 were employed in developing concrete mix designs that included pozzolan material, that is, fly ash of grade 1 obtained from a local coal thermal power station. Preliminary experiments on this experiment were conducted in line with IS Code, AASHTO M307, and ASTM C-1240.21–23 The mineral additive silica fume was employed for the concrete mix design. To meet the requirements of IS 9103:1999, 24 ACI WR-1010, a superplasticiser, which is a polycarboxylate ether-based chemical, was incorporated into the mix design as a water reducer; its optimal dose was determined with the aid of a marsh cone apparatus, 25 and it was fixed at 1.1%. An IS 383: 1970 26 sieve analysis test was carried out on zone II fine aggregates (F.A) to generate a particle size distribution curve for the experiment (see Figure 1). The tests were conducted using 10 mm nominal size coarse aggregates (C.A) to evaluate water absorption, specific gravity (S.G), and fineness modulus (F.M) results from preliminary tests. For sand, the values for water absorption, S.G, and F.M, were 1.2%, 2.6%, and 2.8%, respectively. According to the standards established by the IS codes,27–29 the results for water absorption, S.G, and F.M for C.A were 7.3%, 2.81%, and 0.20%, respectively. Chopped fibre pieces of 30 mm length were incorporated; Figure 2 is a picture of the chopped carbon fibres used, and Table 1 lists the physical attributes of the tested carbon fibres. As a means of experimentation, Size 500 × 100 × 100 mm prismatic beam samples were made with six types of mixes, including nominal mix and fibre additions of 0.2%, 0.4%, 0.6%, 0.8%, and 1% volume fraction (Vf). Once all the chief ingredients of the mix design were thoroughly mixed in a concrete mixer, transfer the prepared mix into the steel moulds; after thorough compaction of the mixture in the mould, the concrete had to cure for about 24 h before it was set. The samples were removed after 24 h from the steel moulds and kept in water for about 28 days, after which they were first tested for non-destructive testing (ultrasonic pulse velocity test). Then later flexural strength test was performed. The mix compositions achieved, which were used for sample preparation, are mentioned in Table 2.
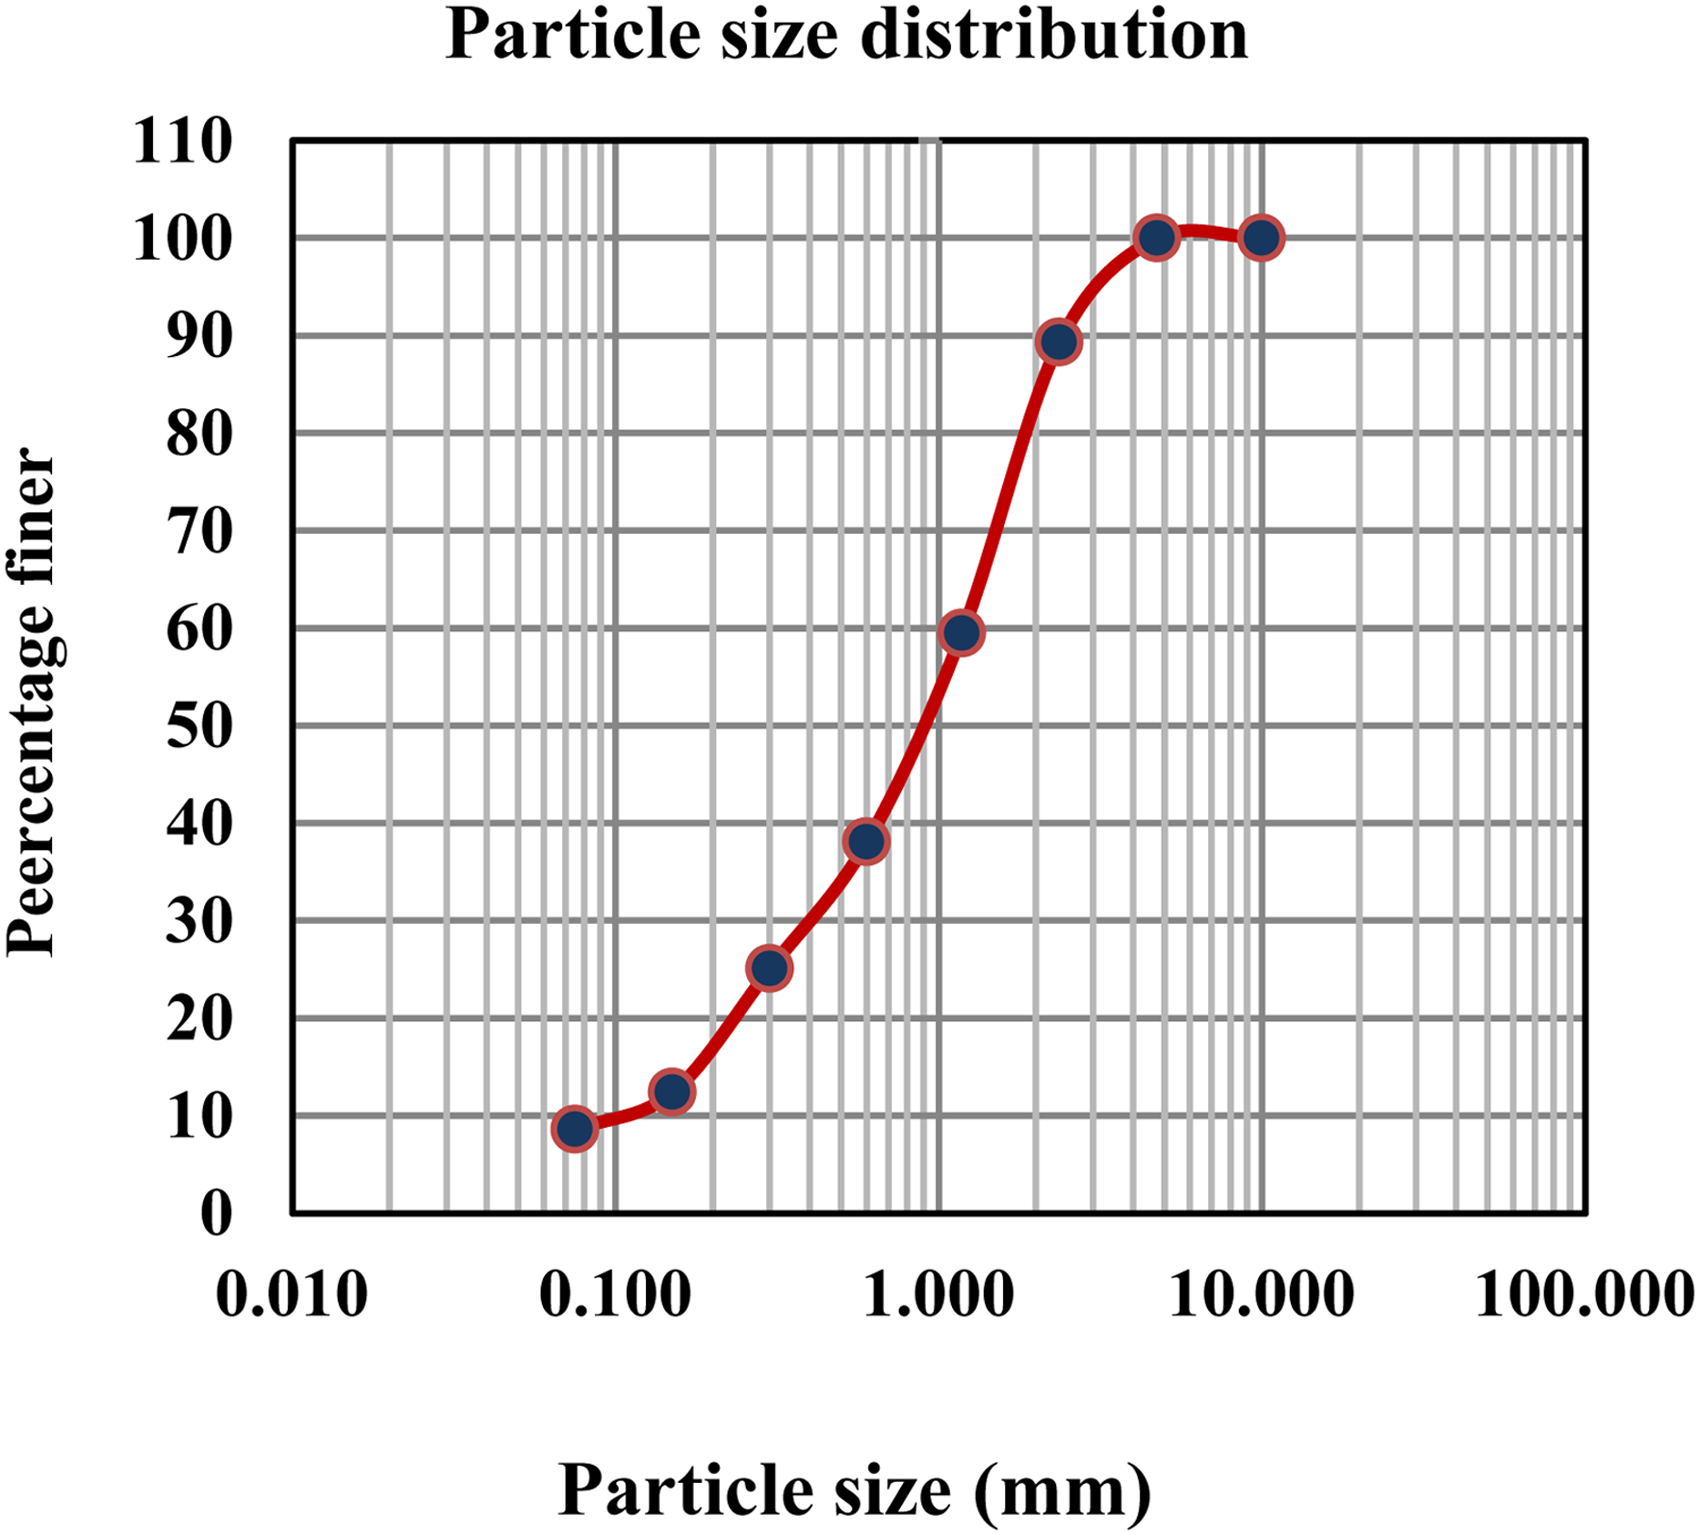
Particle size distribution curve.
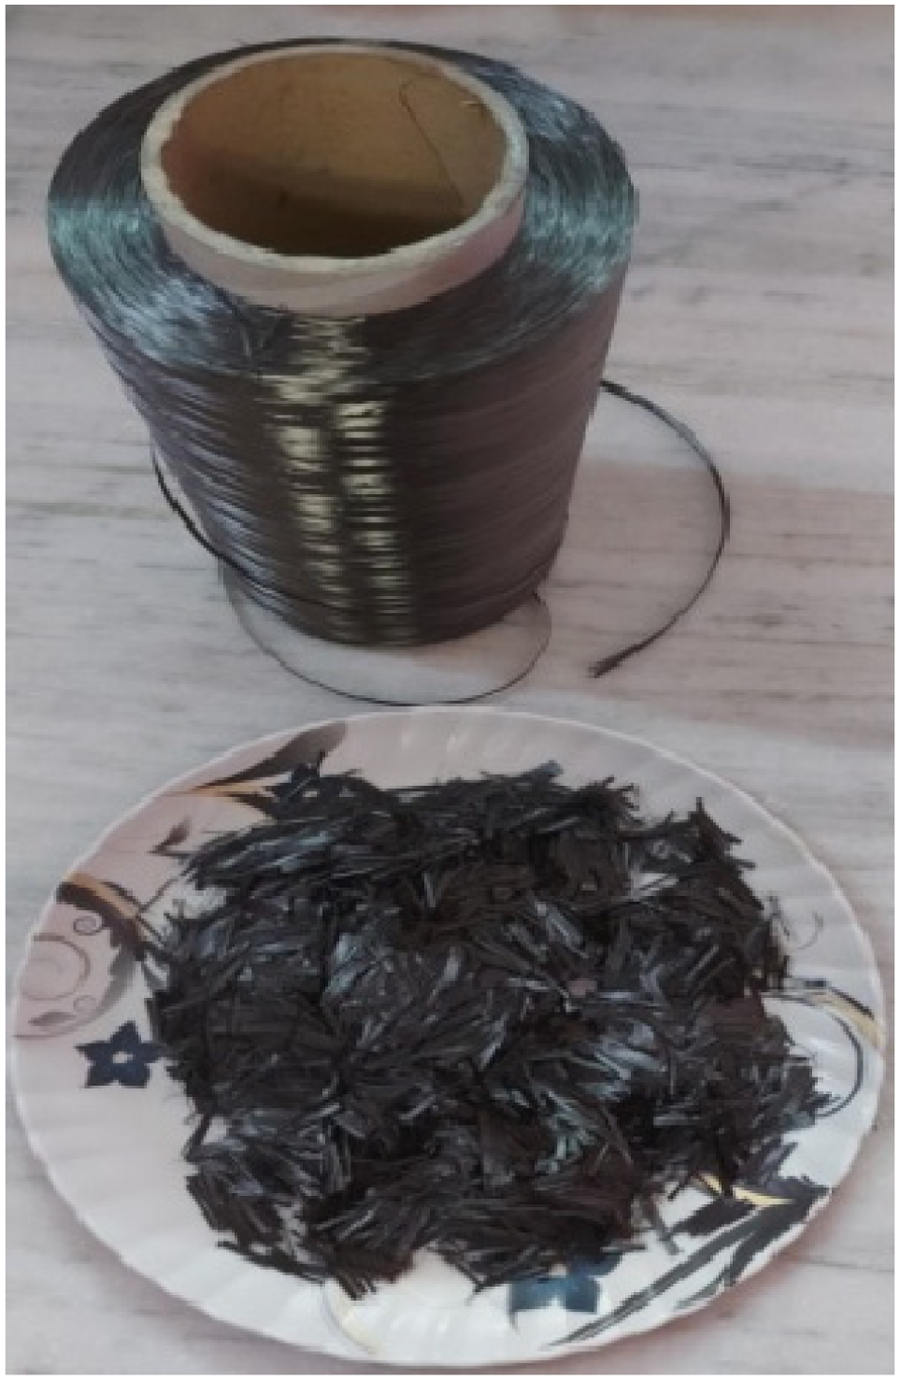
Chopped carbon fibres.
The outcomes of tests on the various physical properties of carbon fibre.
Mix composition for concrete mix design developed.
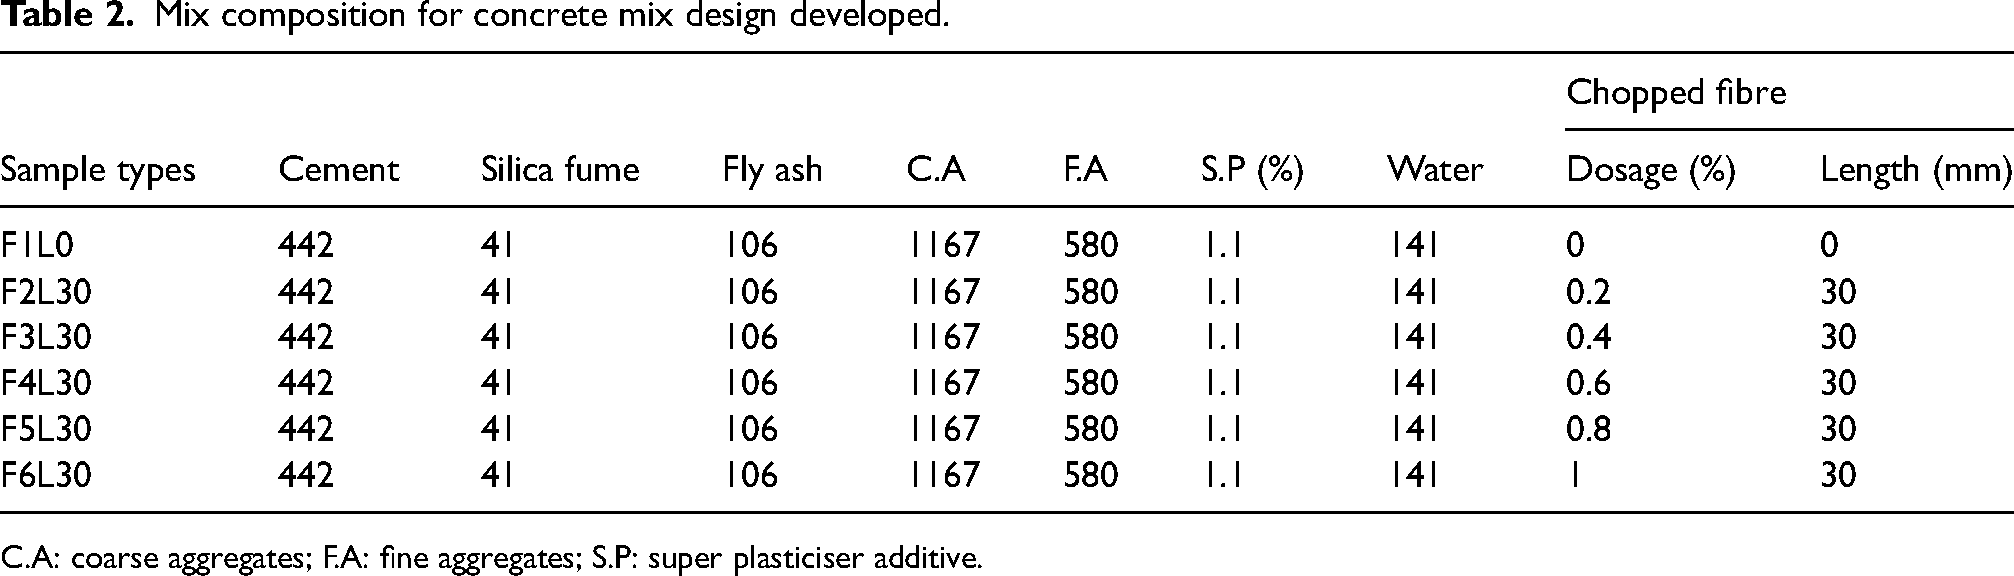
C.A: coarse aggregates; F.A: fine aggregates; S.P: super plasticiser additive.
Experimental test procedure
Ultrasonic pulse velocity test
Non-destructive tests were performed initially on the experimental samples prepared for the experiments, followed by destructive tests (four-point bending test). A unit of ultrasonic pulse velocity testing (UPVT) equipment, as depicted in Figure 3, was used in accordance with IS code
30
to conduct the tests which work on the technique of direct transmission. Below is the equation adopted to determine the pulse velocity of the samples prepared:
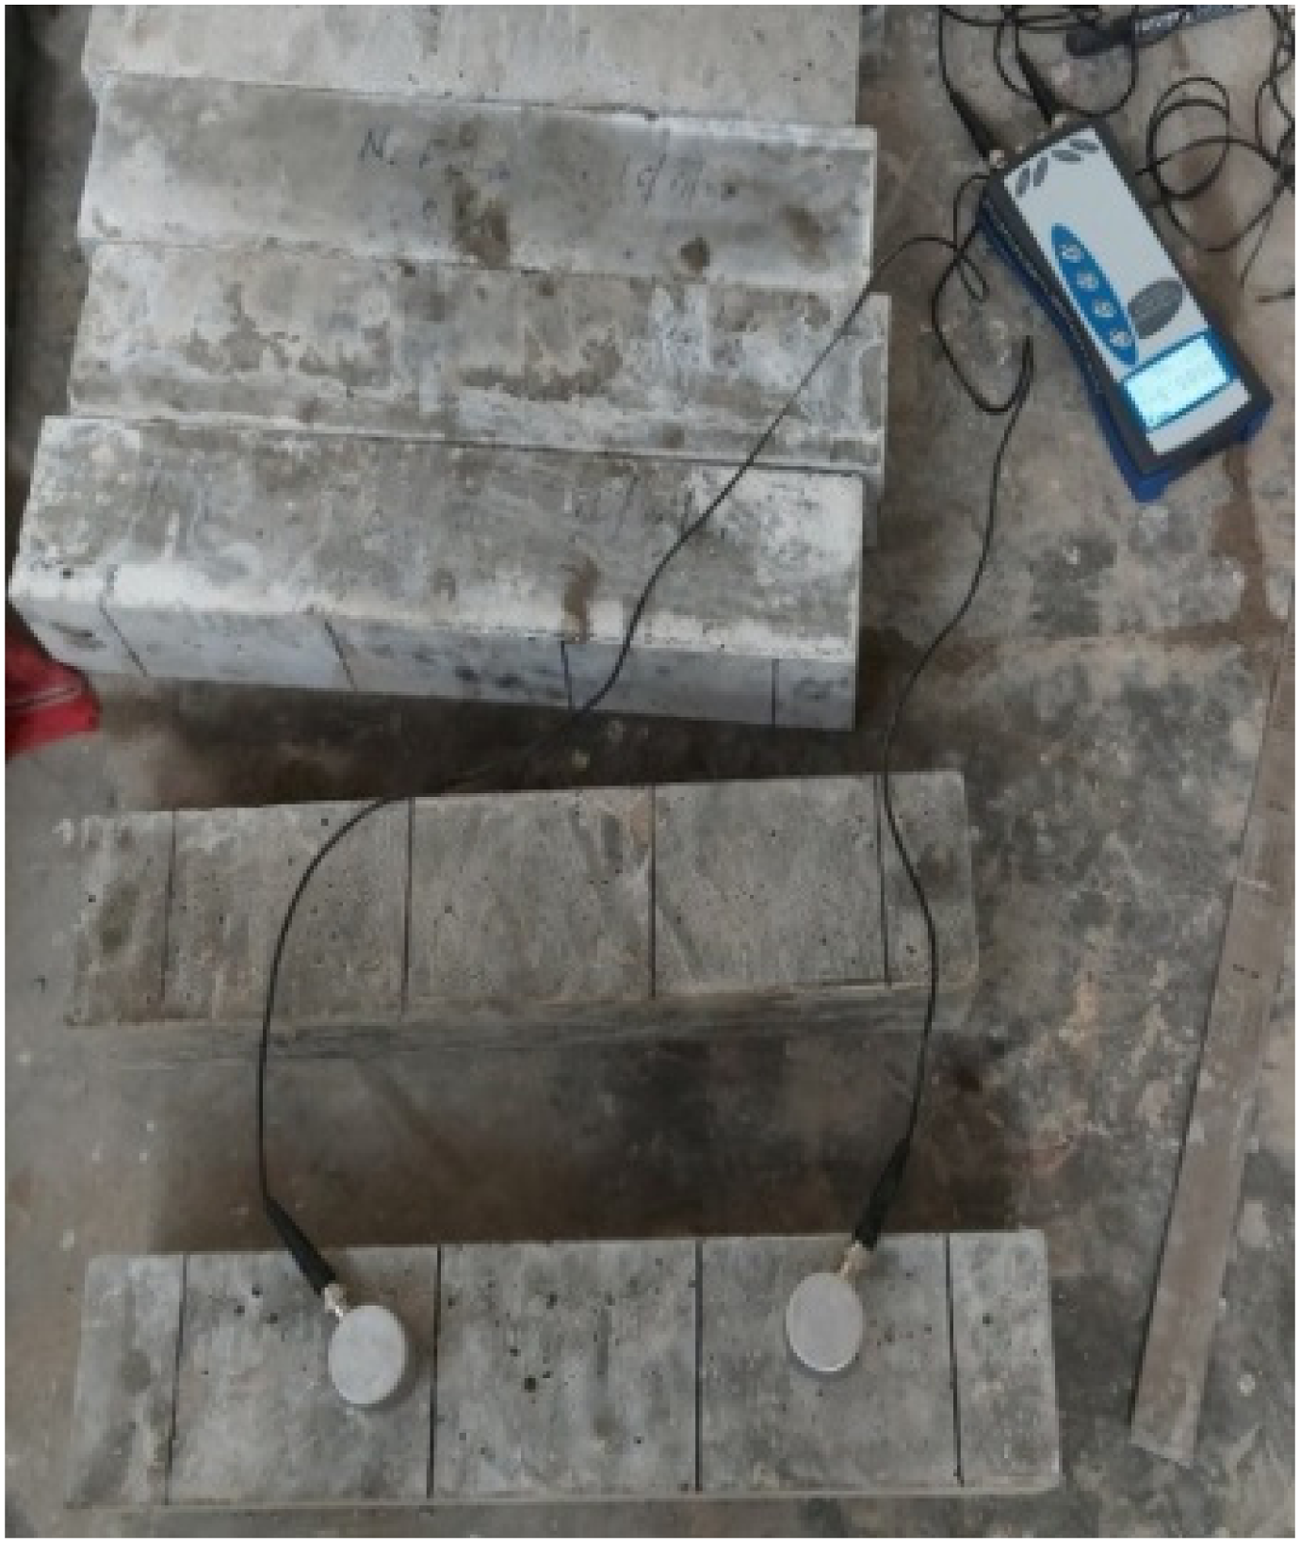
Ultrasonic pulse velocity testing (UPVT) test setup.
Pulse velocity (in km s−1) for the cast prism beam samples needs to be estimated, L stands for the whole distance that separates the transducers, and T (in μ-s) is the time taken by pulse velocity to travel in between transducers.
Four-point bending test
Following the termination of the UPVT test, flexure strengths of prismatic beam samples of six various sample mixes of size 500 × 100 × 100 mm were evaluated using a four-point loading method with flexural test equipment of 100 kN capacity applied at the mid-span of the sample in accordance with the standards set forth by ASTM C78.
31
Displacement-controlled four-point bending tests were conducted at a deflection rate of 0.6 mm min−1. Below is the equation for determining flexural strength:
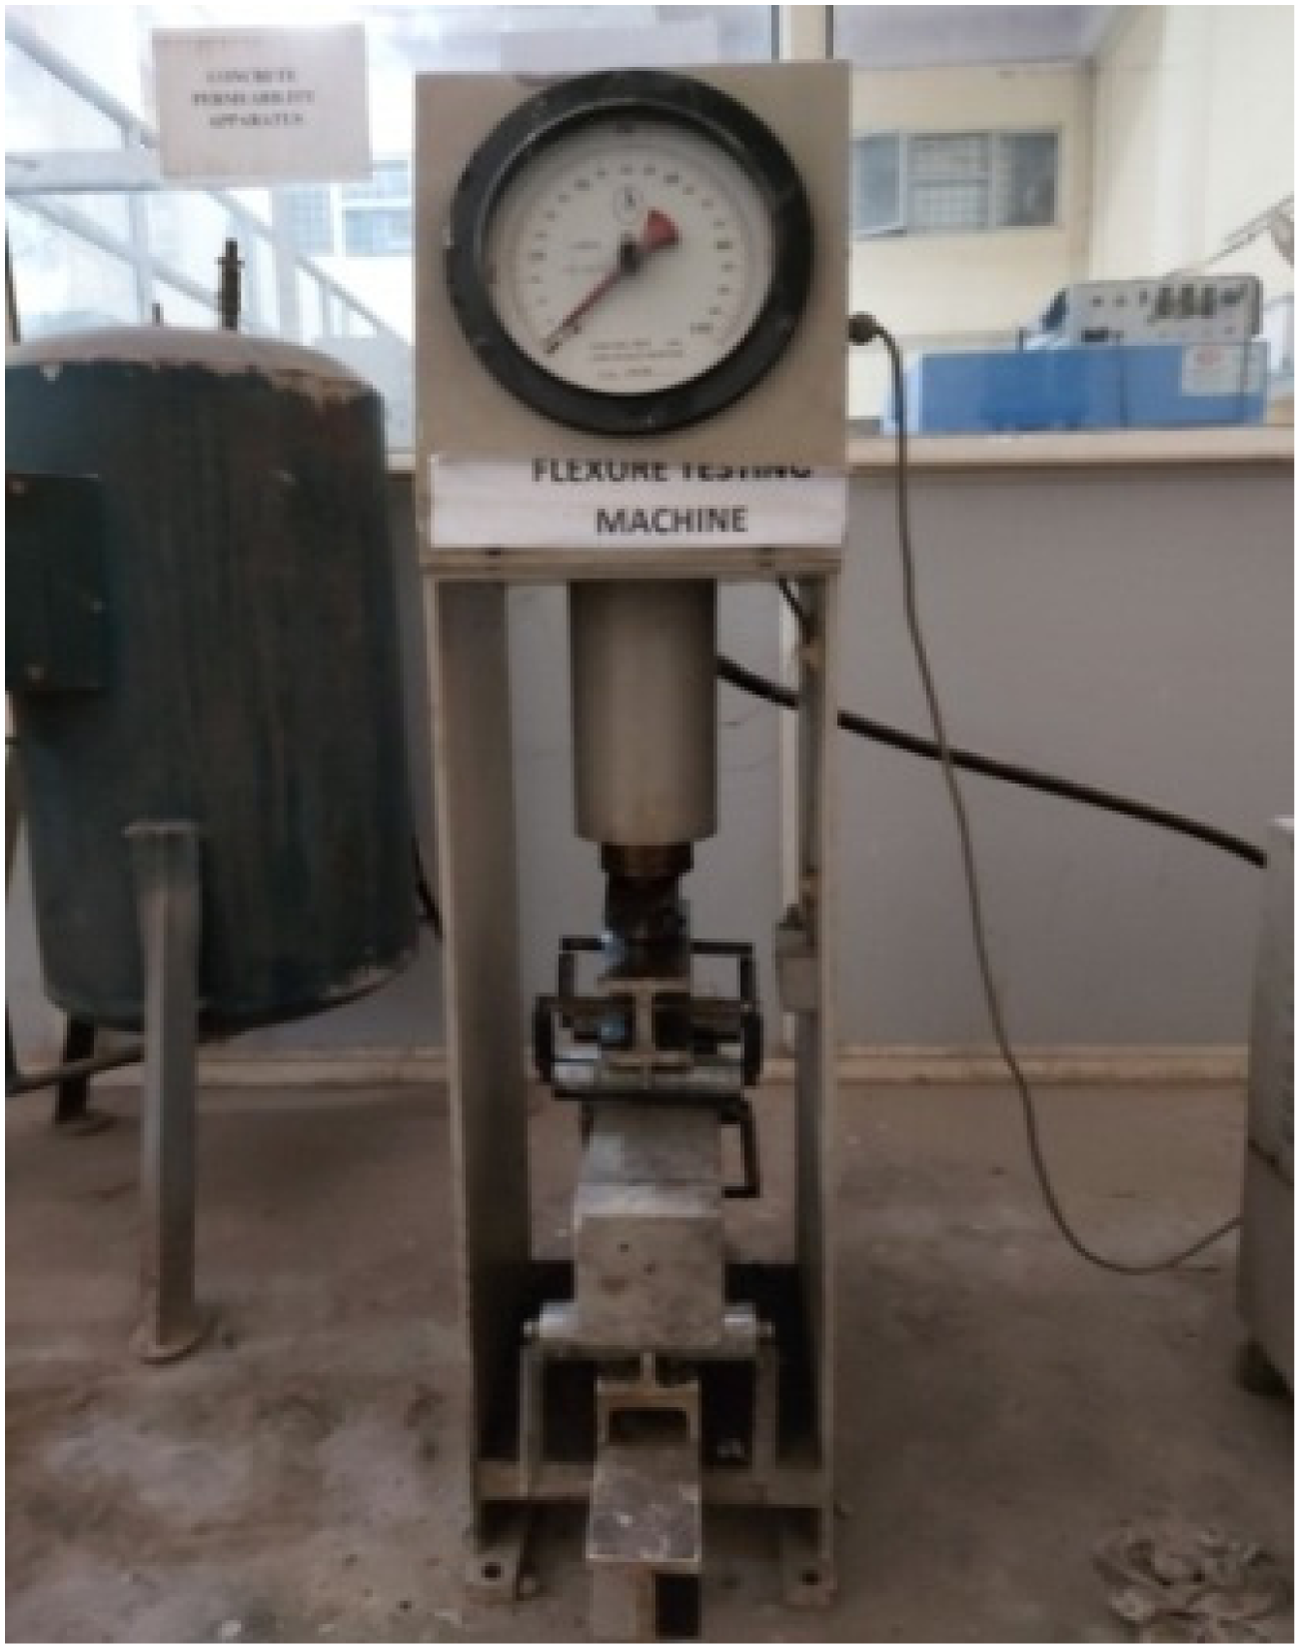
Flexure test setup.
Result and discussion
Ultrasonic pulse velocity, flexural strength and X-ray diffraction analysis
Based on the findings acquired from the UPVT test setup, it was noted that the pulse velocity values decrease with an increase in Vf or dosage values of samples, as displayed in Figures 5 and 6. These findings are depicted in both of these figures. When compared to the specimen with no fibre content, it was discovered that sample F3L30 had the largest drop in pulse velocity values, which was approximately 39%. Amongst all the reinforced specimens, the decline in pulse velocity that was discovered to be the highest was around 11% in sample F3L30. This was compared to sample F2L30, which had a minor fibre content prepared. The pulse velocity values of the test specimens increased with the fibre dosage increment after the point when there was a decline in pulse velocity values of samples until the optimum dosage point (F3L30) was attained. Still, the pulse velocity did not increase beyond this optimum dose point. This trend was found among the samples. The cast prismatic beam samples were subjected to a four-point bending test to determine their flexure strength. The results of this test revealed that the samples’ flexural properties had been improved. When either the dosage or the Vf value was increased, as depicted in Figures 7 and 8, a significant increment was observed in the level of strength. Compared to the specimen that included no fibre in any percentage, the F3L30 sample showed an improvement in strength, around 58% higher than the other sample. Compared to F2L30, the reinforced samples of type F3L30 showed an improvement in strength of about 36% compared to those of type F2L30 (most negligible fibre dosage value). A pattern was observed, as indicated in Figures 7 and 8, that suggests that the flexural strength values increased up to an optimum dose point (0.4%) and then decreased later beyond this point. This pattern was observed to indicate that the value of the strength increases up to the limit. XRD analysis was the non-destructive method used on the reference sample (which had 0% fibre) and the F3L30 specimen, which included the optimal fibre dosage. This method was applied to the samples better to understand the mineralogical characteristics of the cast samples, as shown in Figure 9. It was noted that Ca–K and O–K were the significant peaks visible, which means that the samples used for testing are composed of silicon and calcium crystalline. This finding is more evidence that the primary products that result from the hydration of cement are calcium hydroxide and calcium silicate hydrate
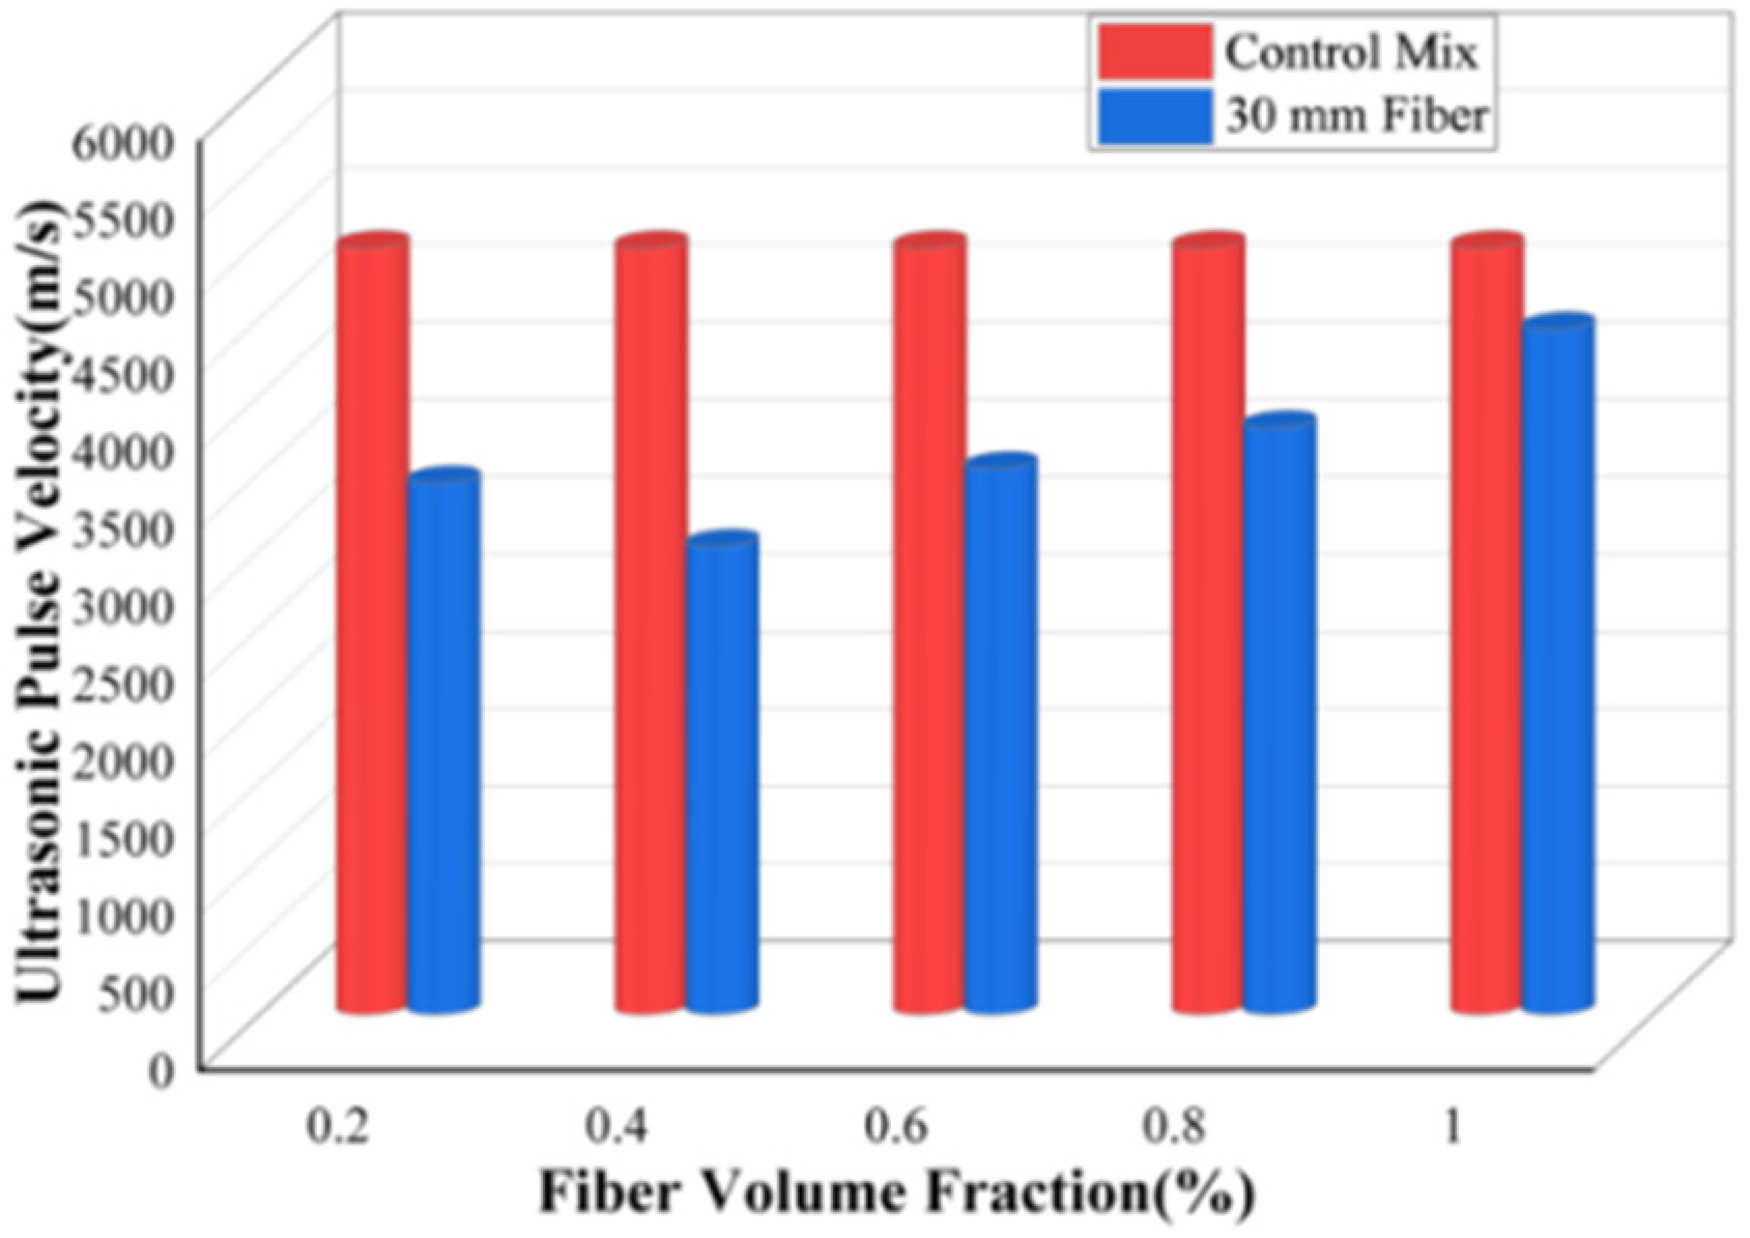
Fibre volume fraction versus ultrasonic pulse velocity testing (UPVT).
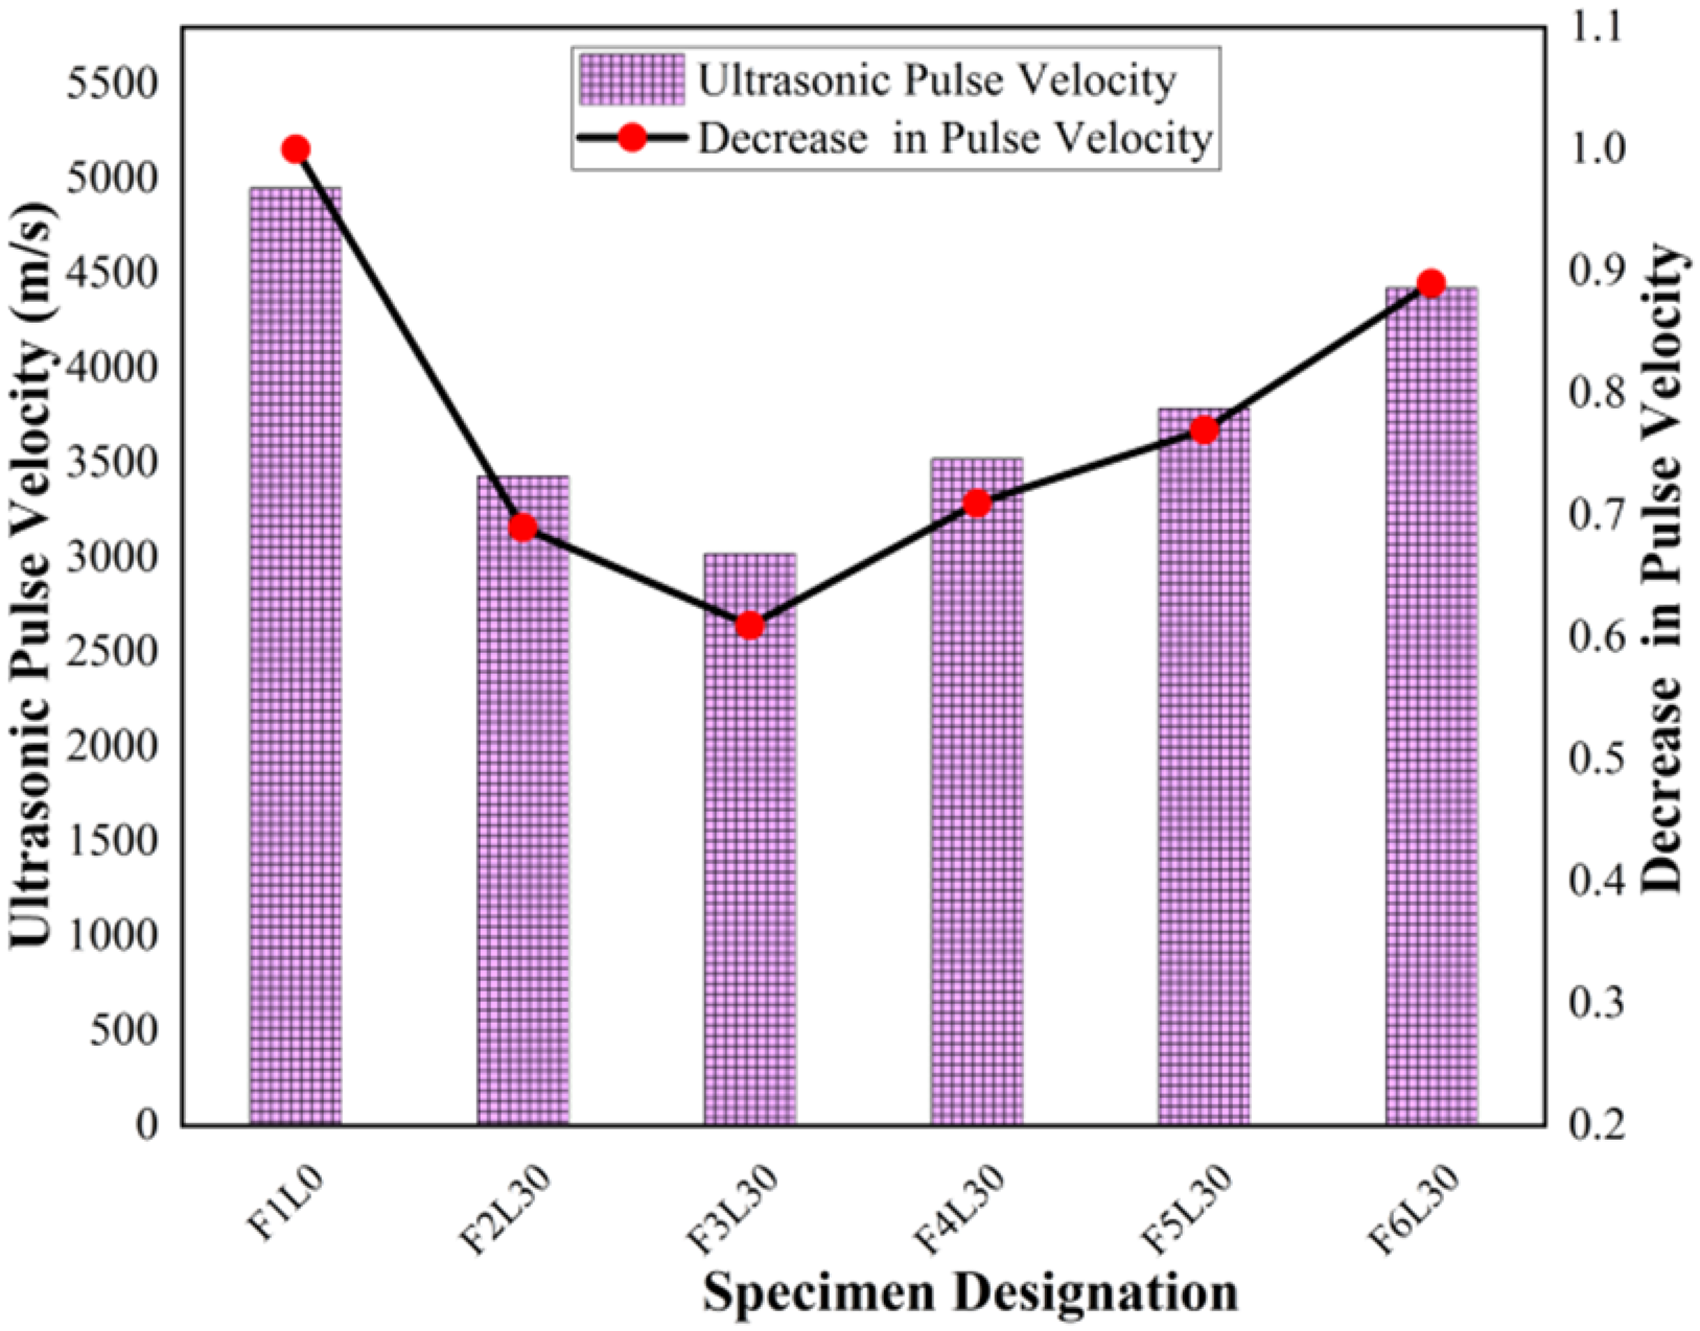
Dosage versus decrease in pulse velocity.
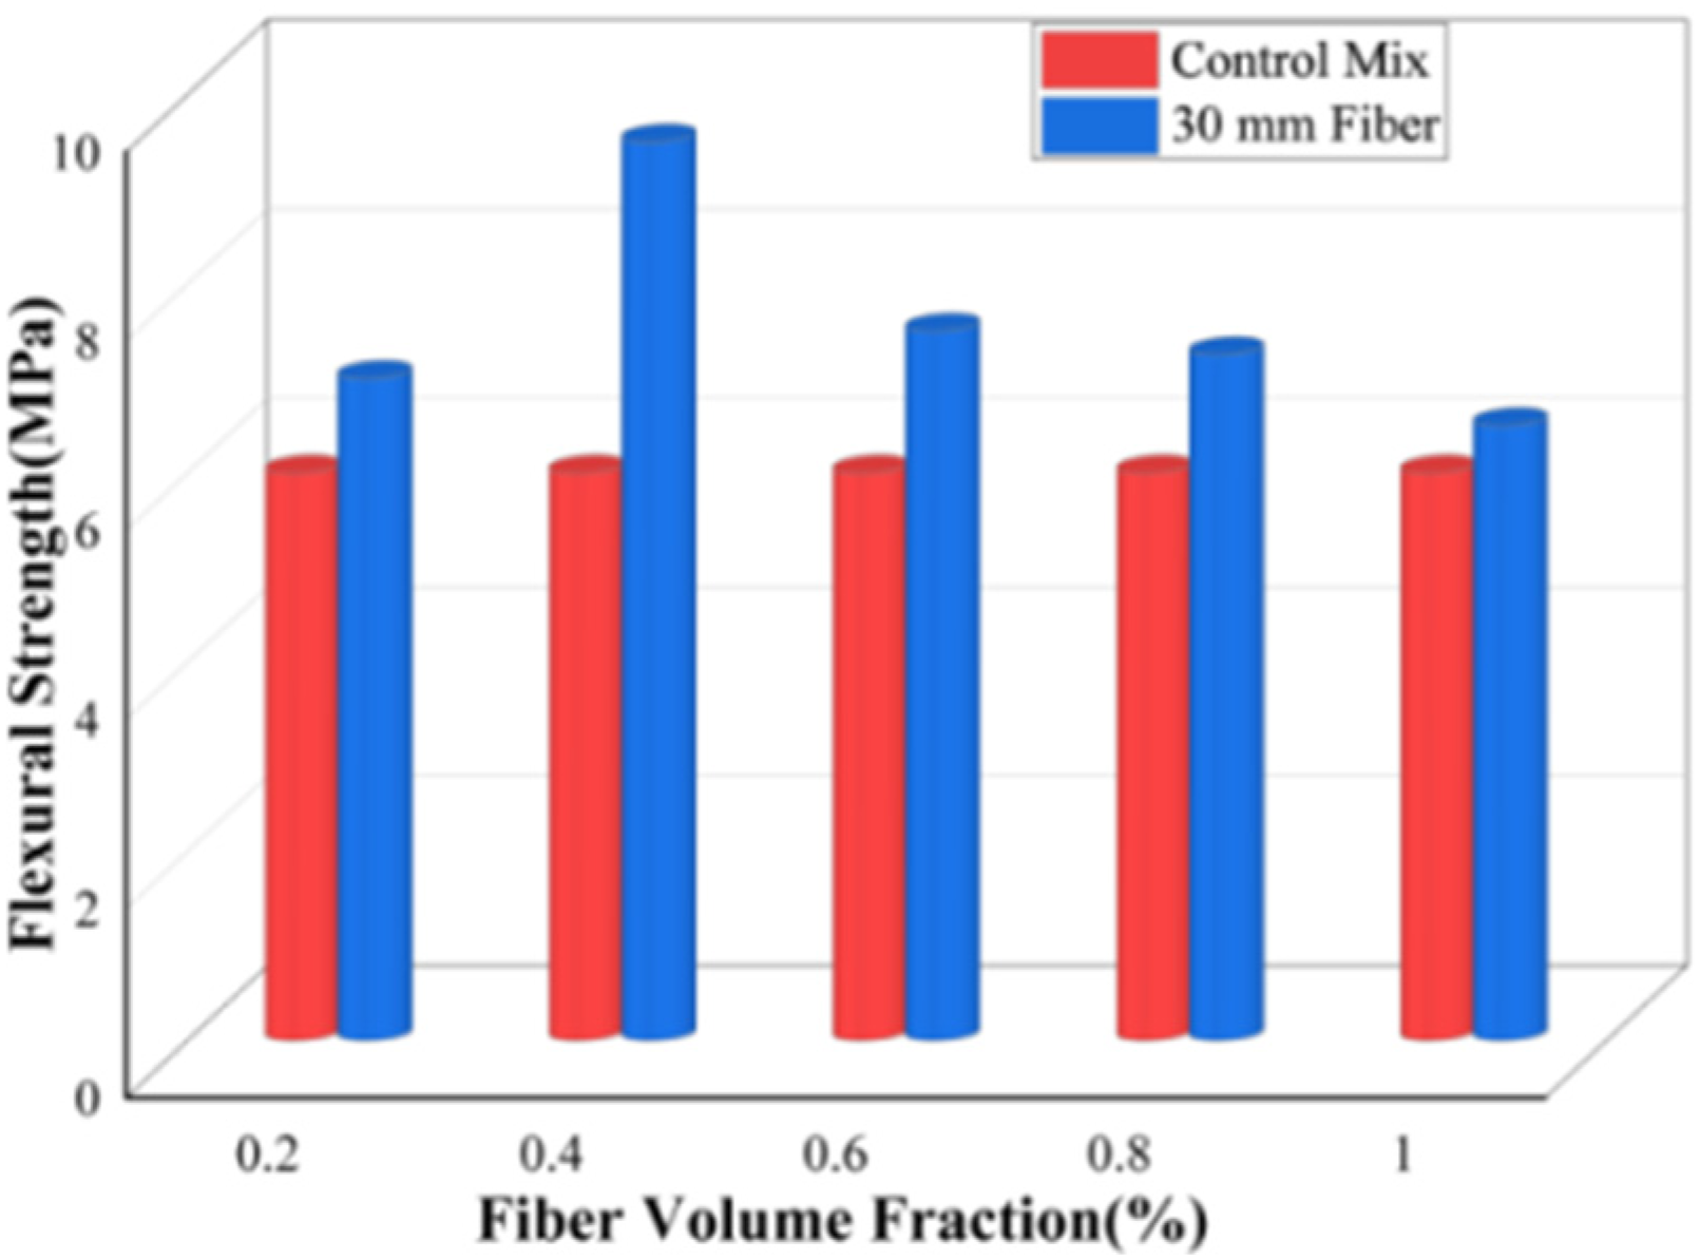
Fiber volume fraction versus Fr.
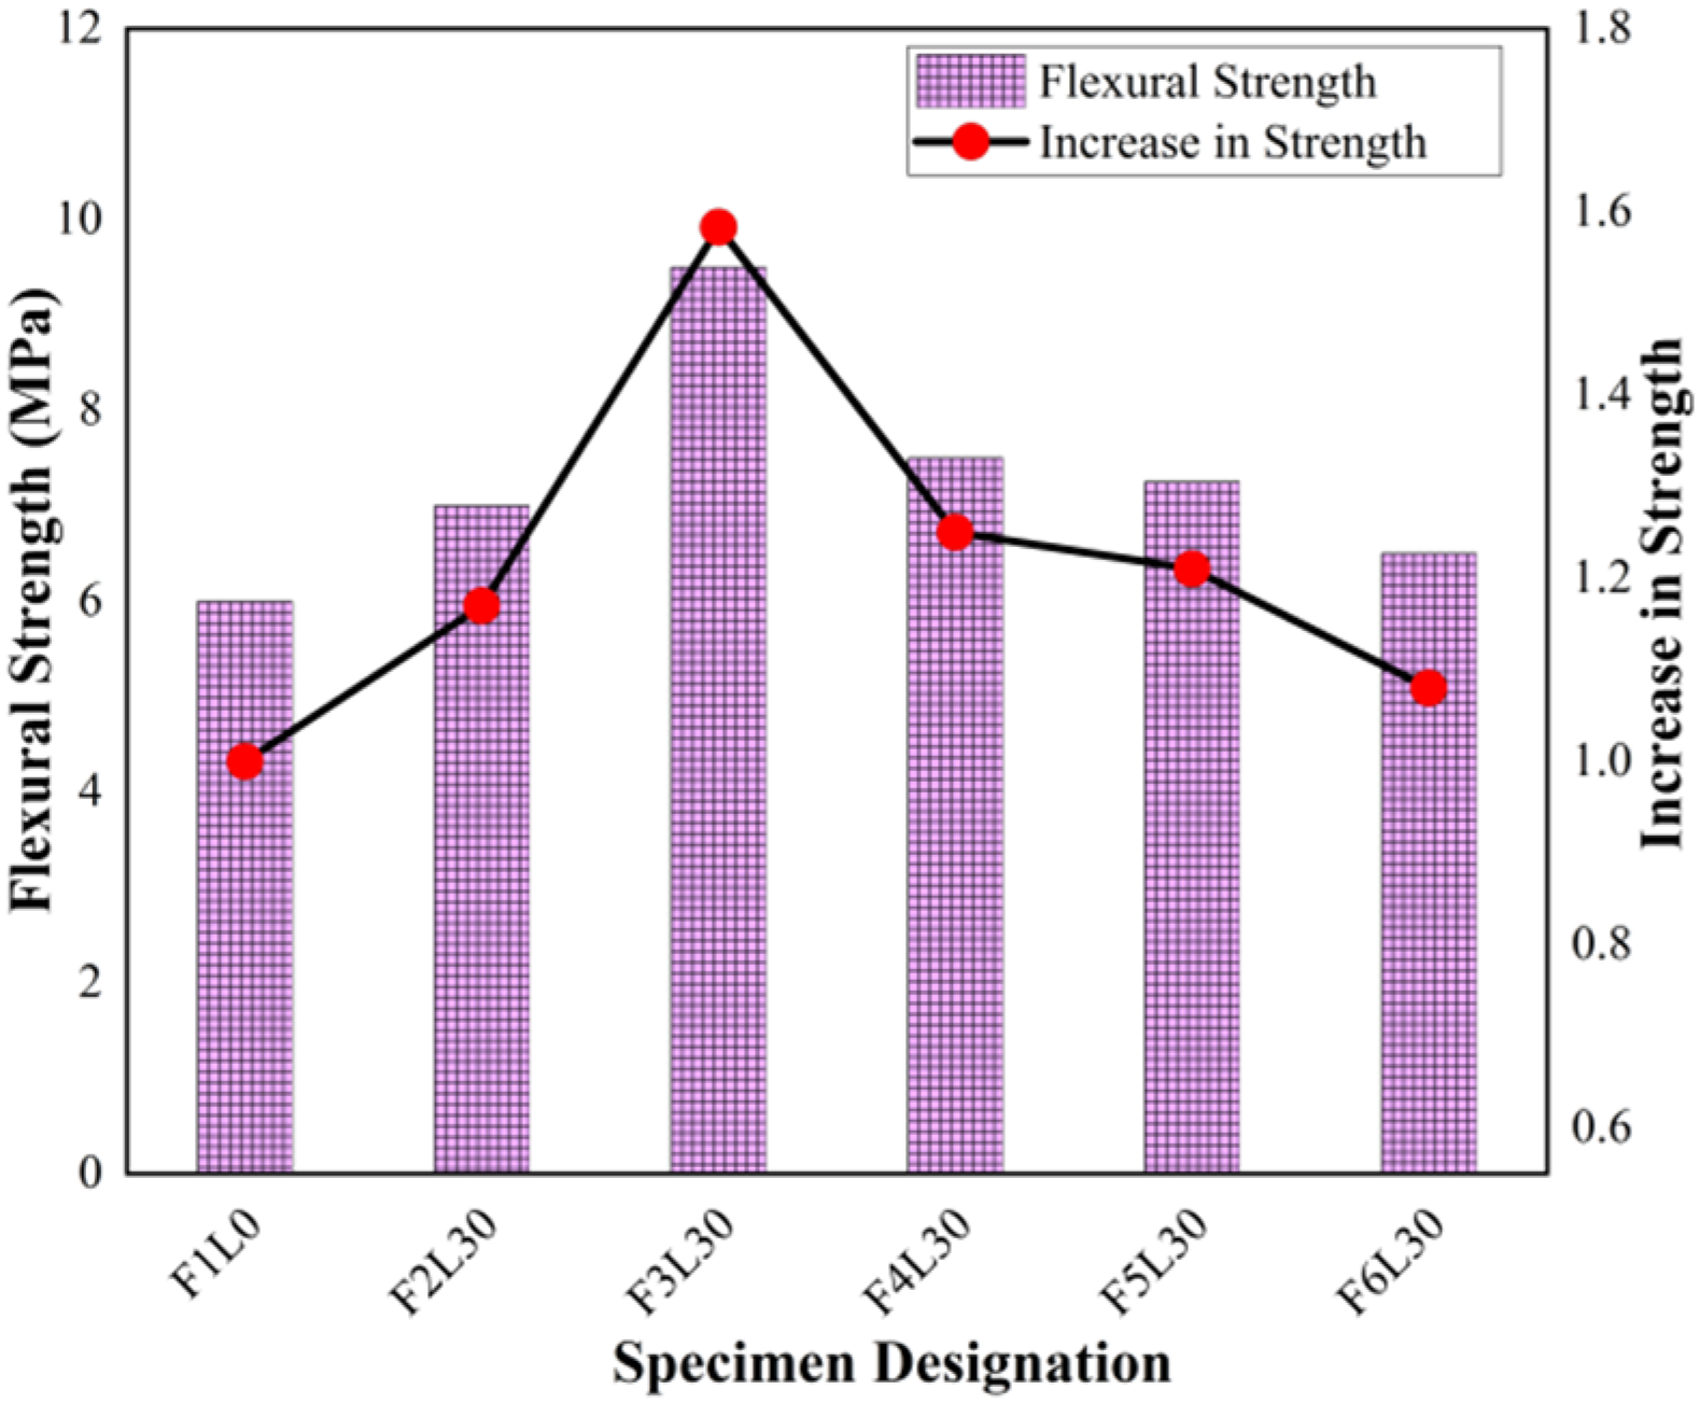
Dosage versus increase in strength.
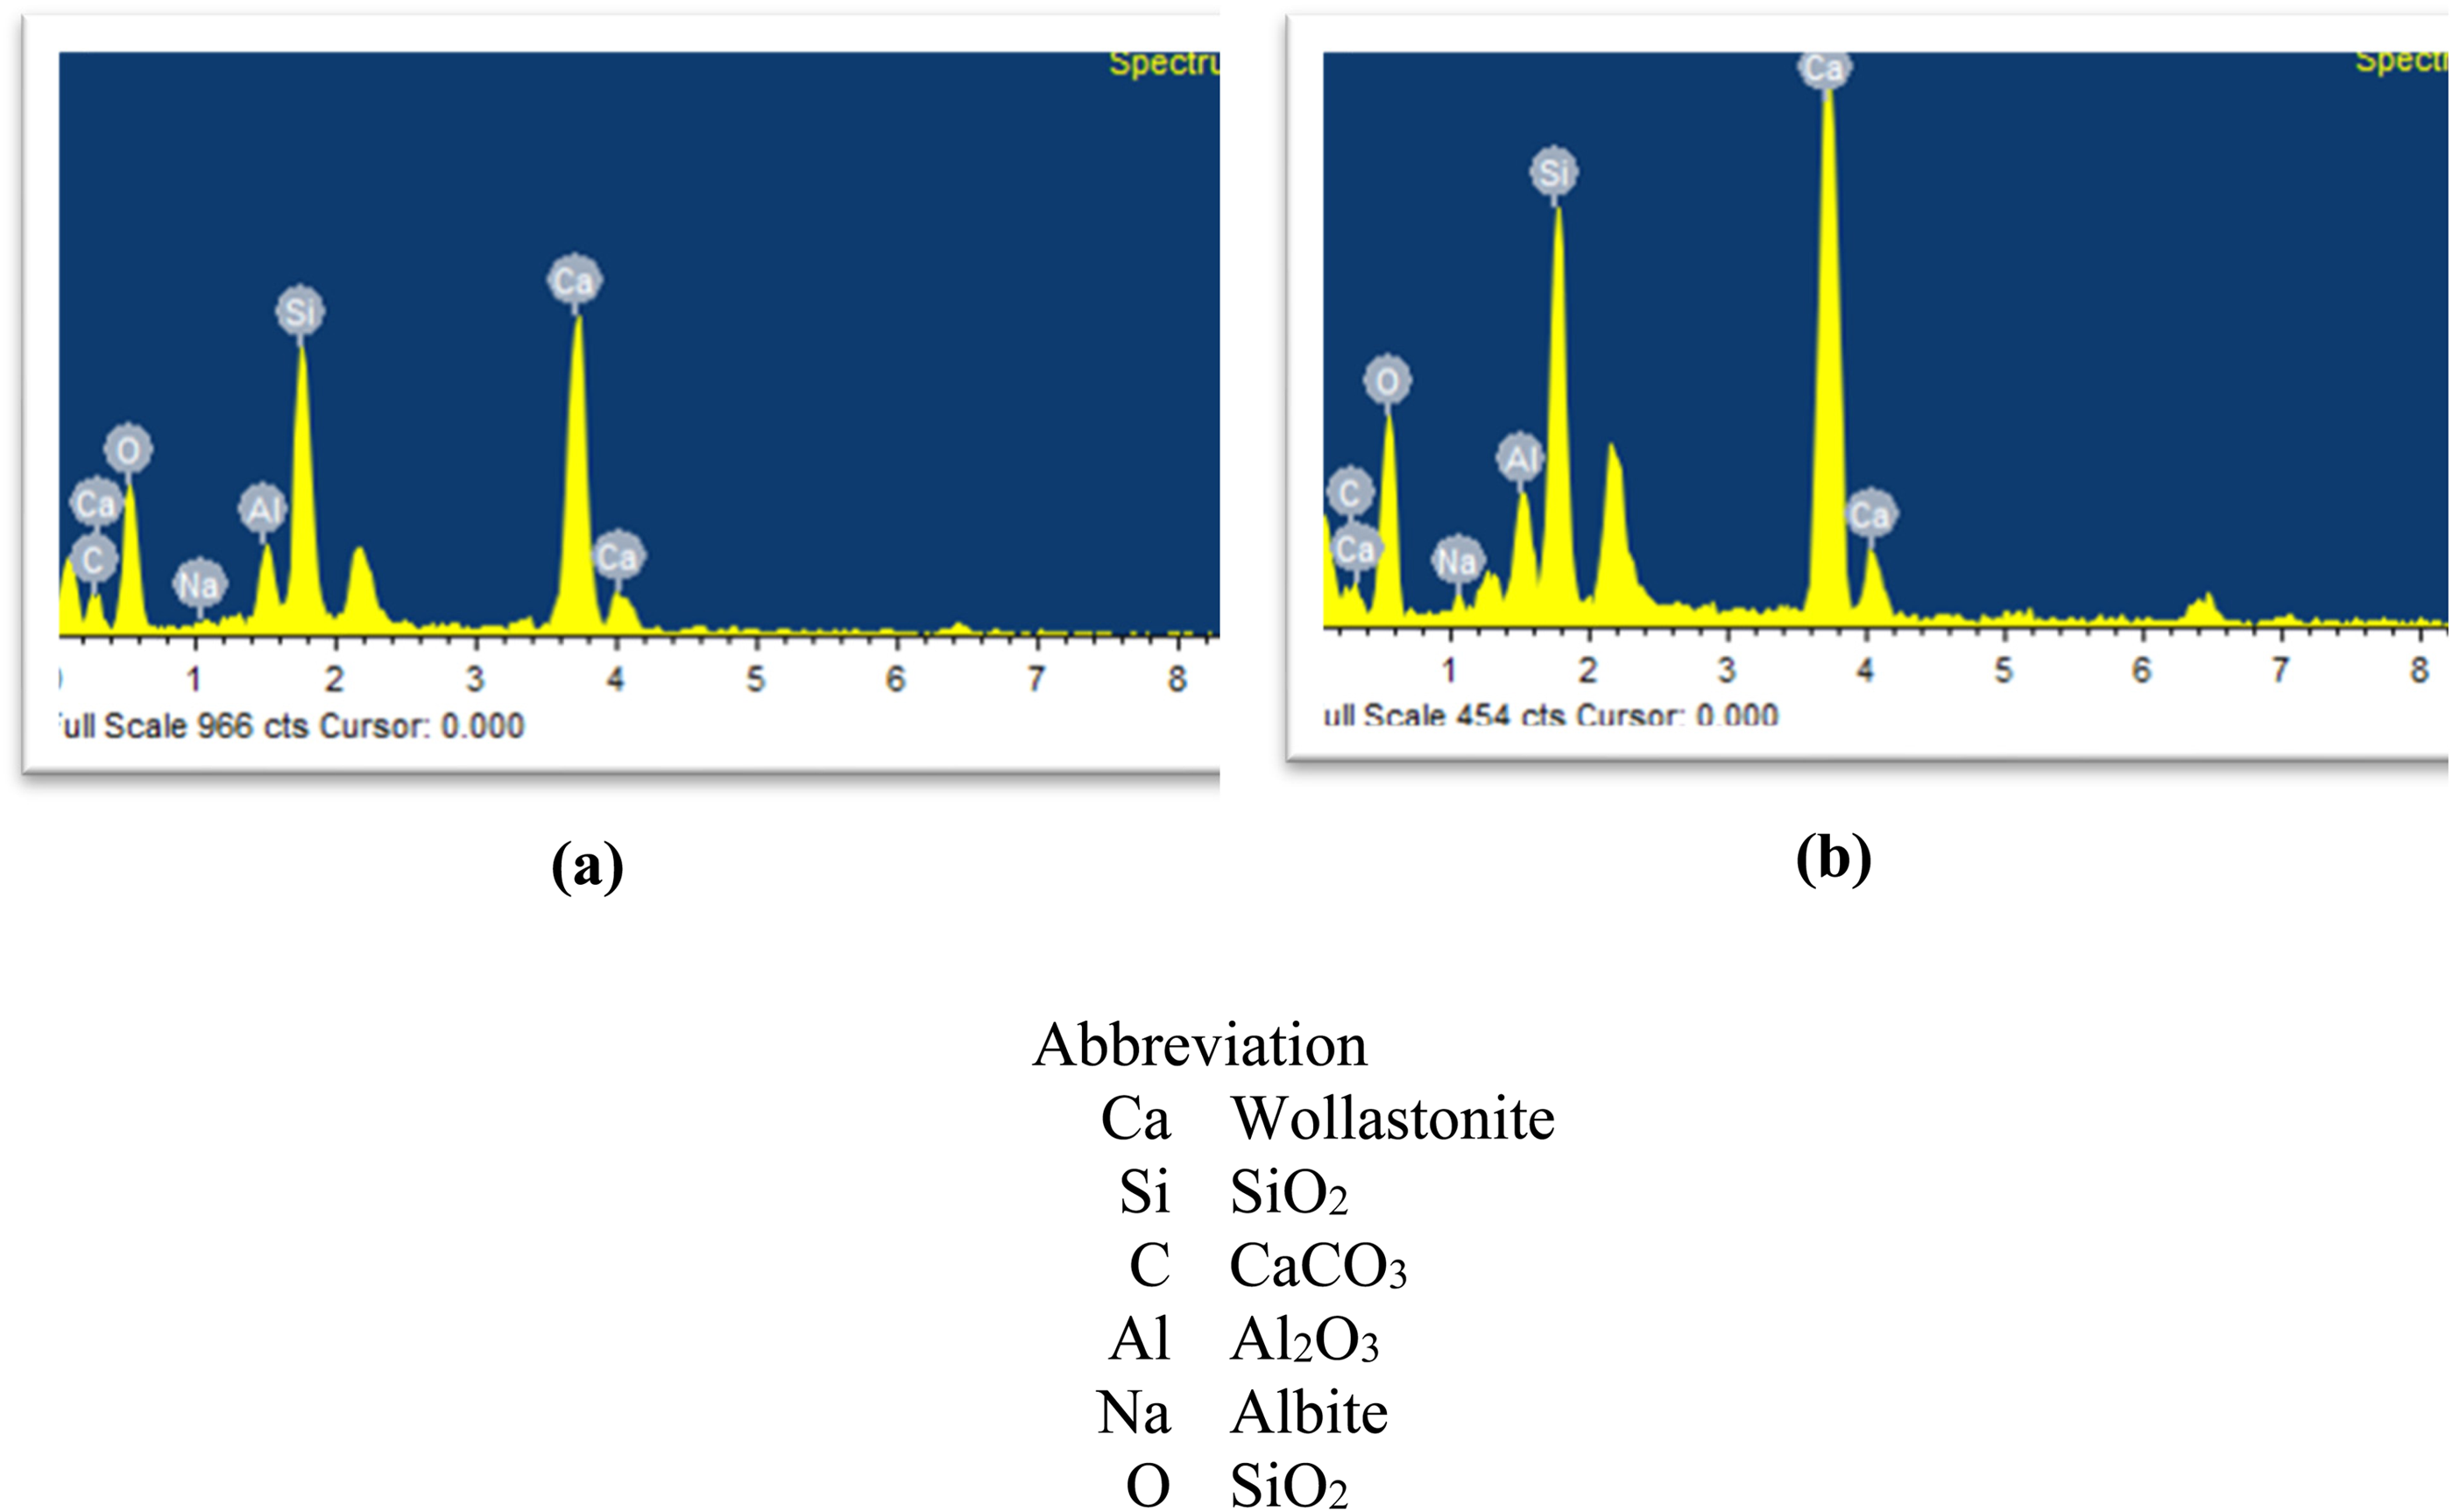
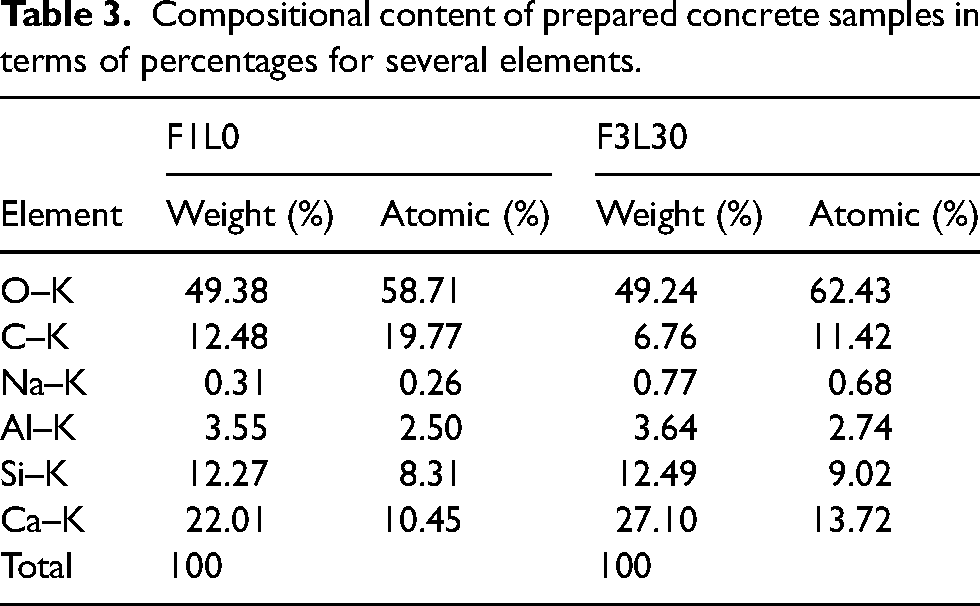
EDX results of samples (a) F1L0 and (b) F3L30.
XRD, SEM, and EDX
SEM was used to examine the surface morphology of the chopped carbon fibres and carbon fibre-reinforced concrete matrix used in the study, as illustrated in Figure 10. Figure 10(c) shows the surface of a chopped carbon fibre consisting of grooves that strengthen the interface binding between the fibres and the matrix. The mineral orientation and crystal microstructure of the cast concrete samples containing homogenously dispersed chopped carbon fibres were observed in Figure 10(b) and (c). Debonding of carbon fibres from the concrete matrix was detected in Figure 10(b), implying that the carbon fibres employed in the experiments could not withstand the ultimate loads. Energy dispersive X-ray spectroscopy (EDX), as presented in Figure 9, described the abundance of elements present in the cast samples. Various elements found in the cast samples are listed in Table 3. As can be seen in Figure 11, XRD analysis was done on concrete samples F1L0 and F3L30 to understand their mineralogical properties better. The XRD analysis of the concrete matrix revealed that oxygen (O) and calcium (Ca) elements were present in dominance in the matrix silicon, followed by comparable amounts of silicon (Si) and carbon (C) and only minute quantities of aluminium and sodium. Based on the EDX analysis, it was implied that calcium silicate hydrate and calcium hydroxide were the primary hydration products of the cement-based matrix.
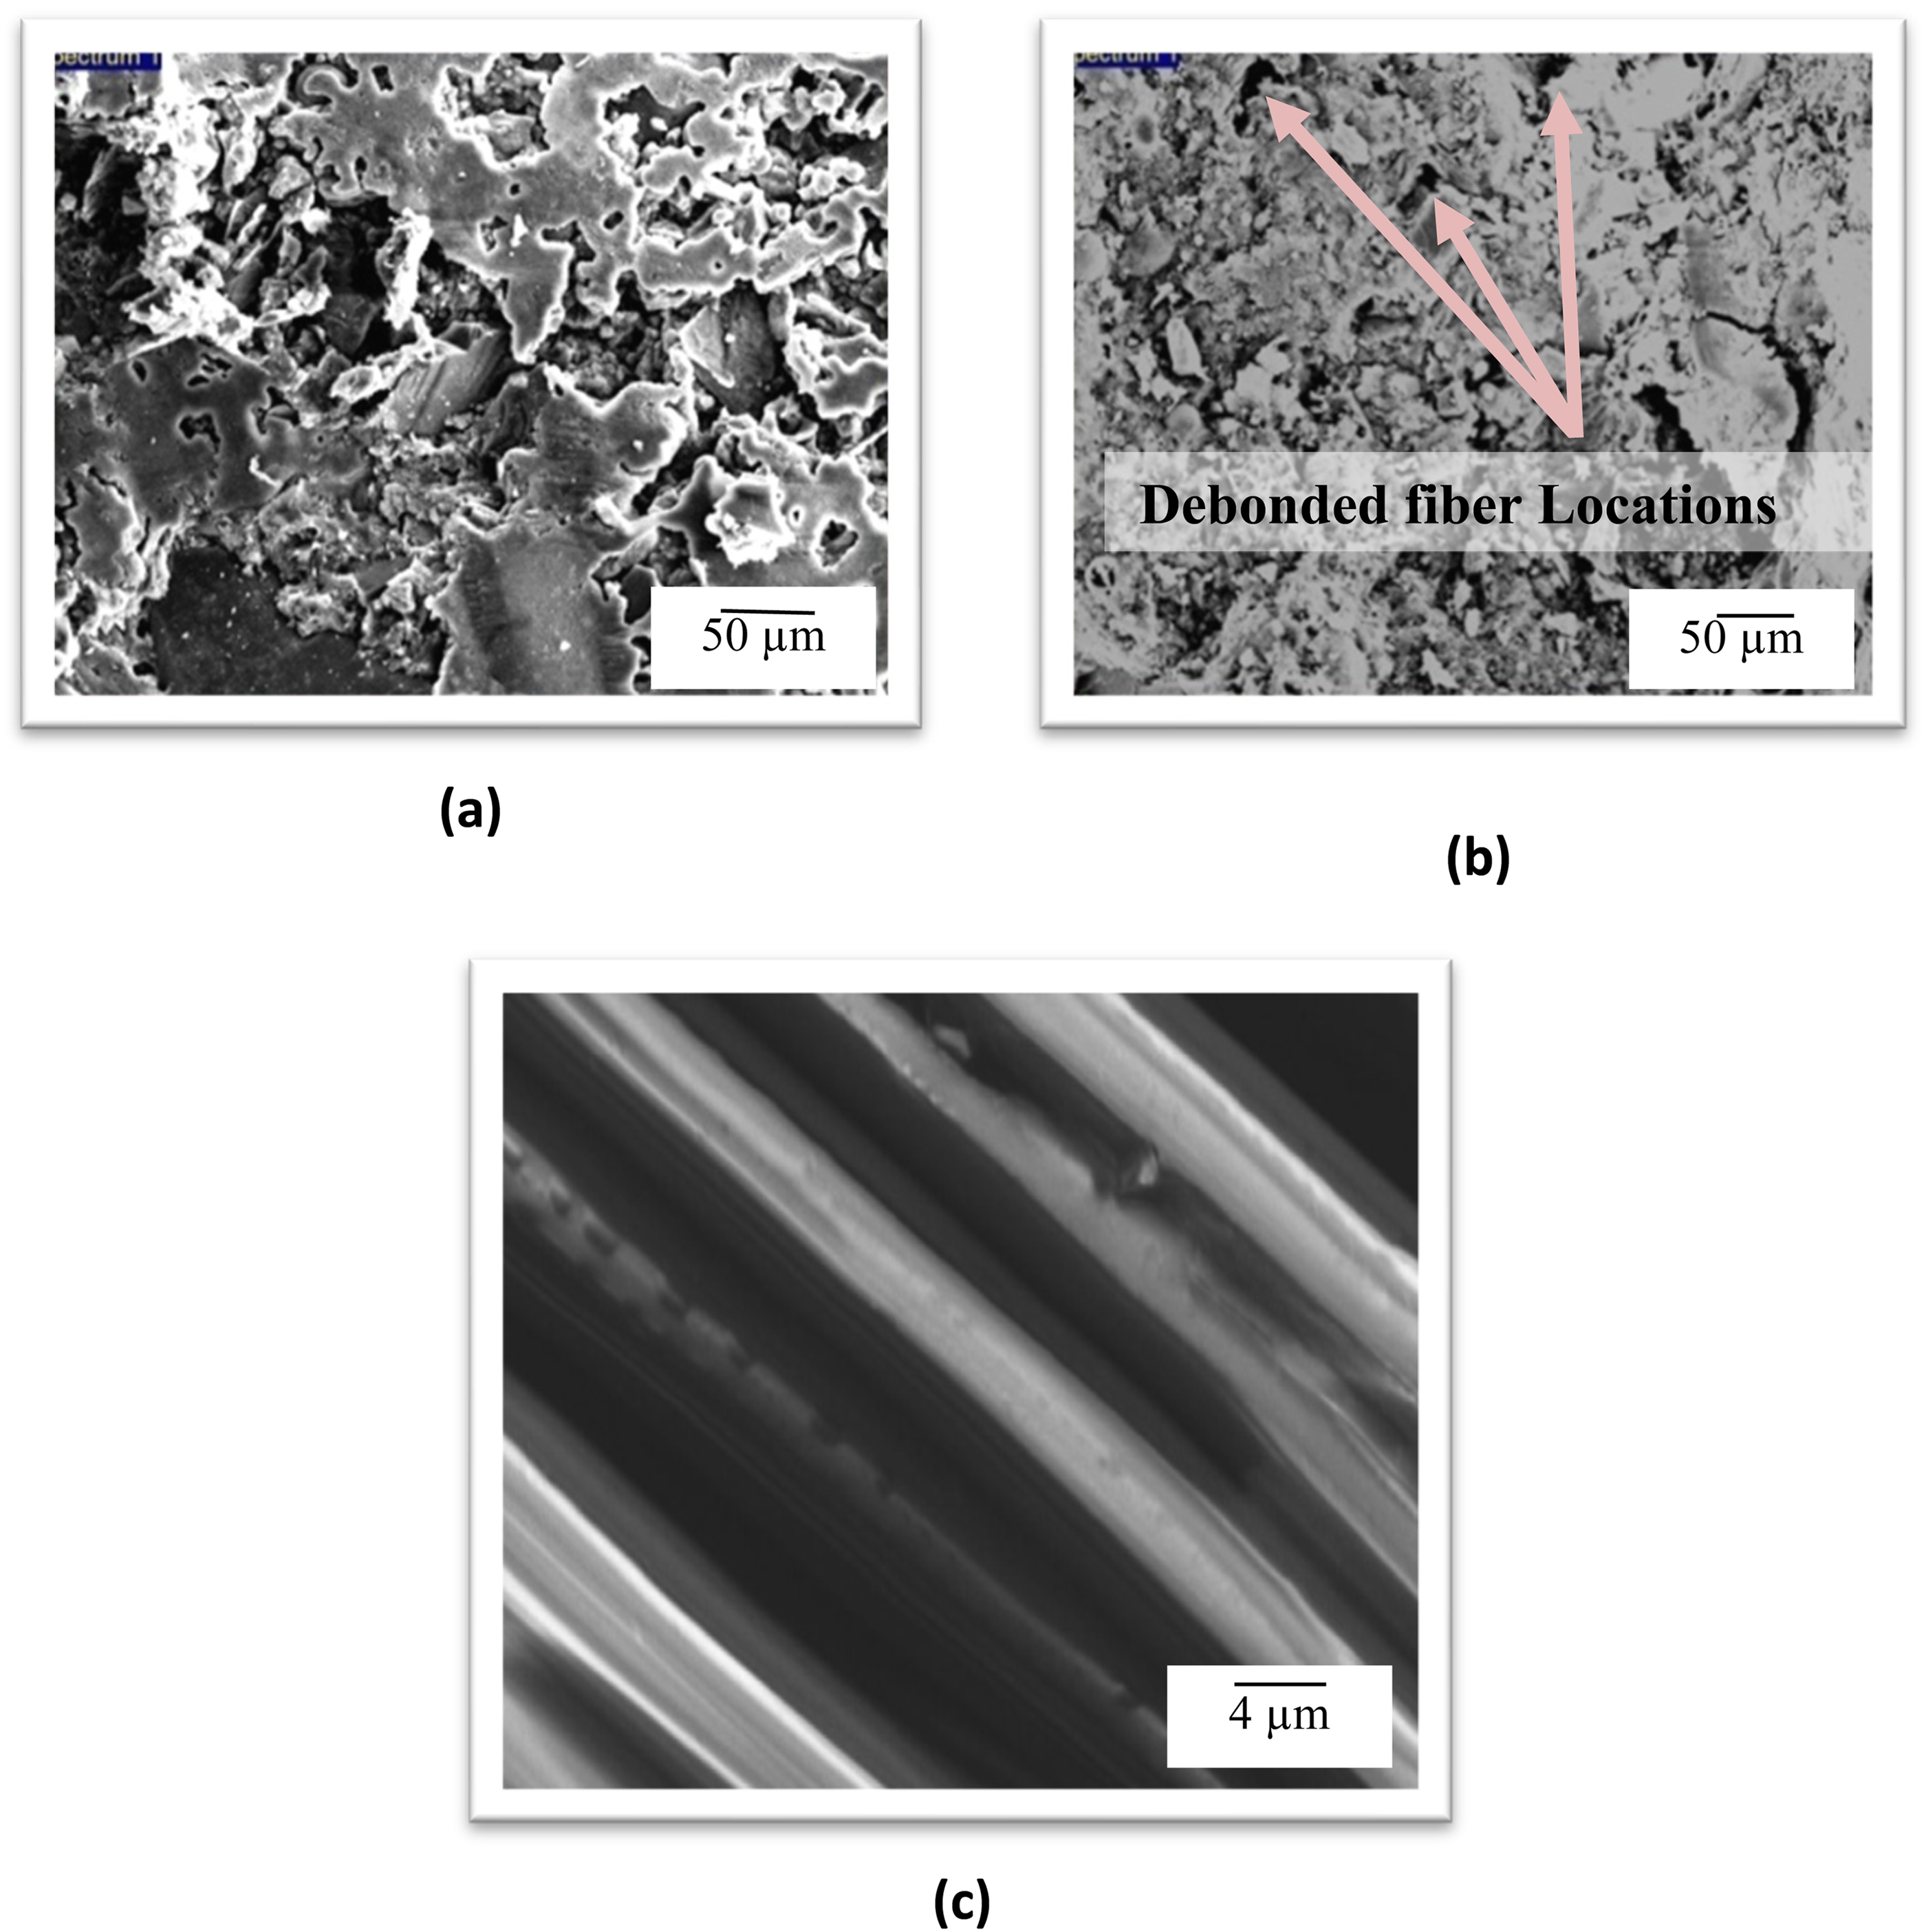
SEM images of (a) F1L0, (b) F3L30, and (c) View of carbon fibres magnified.
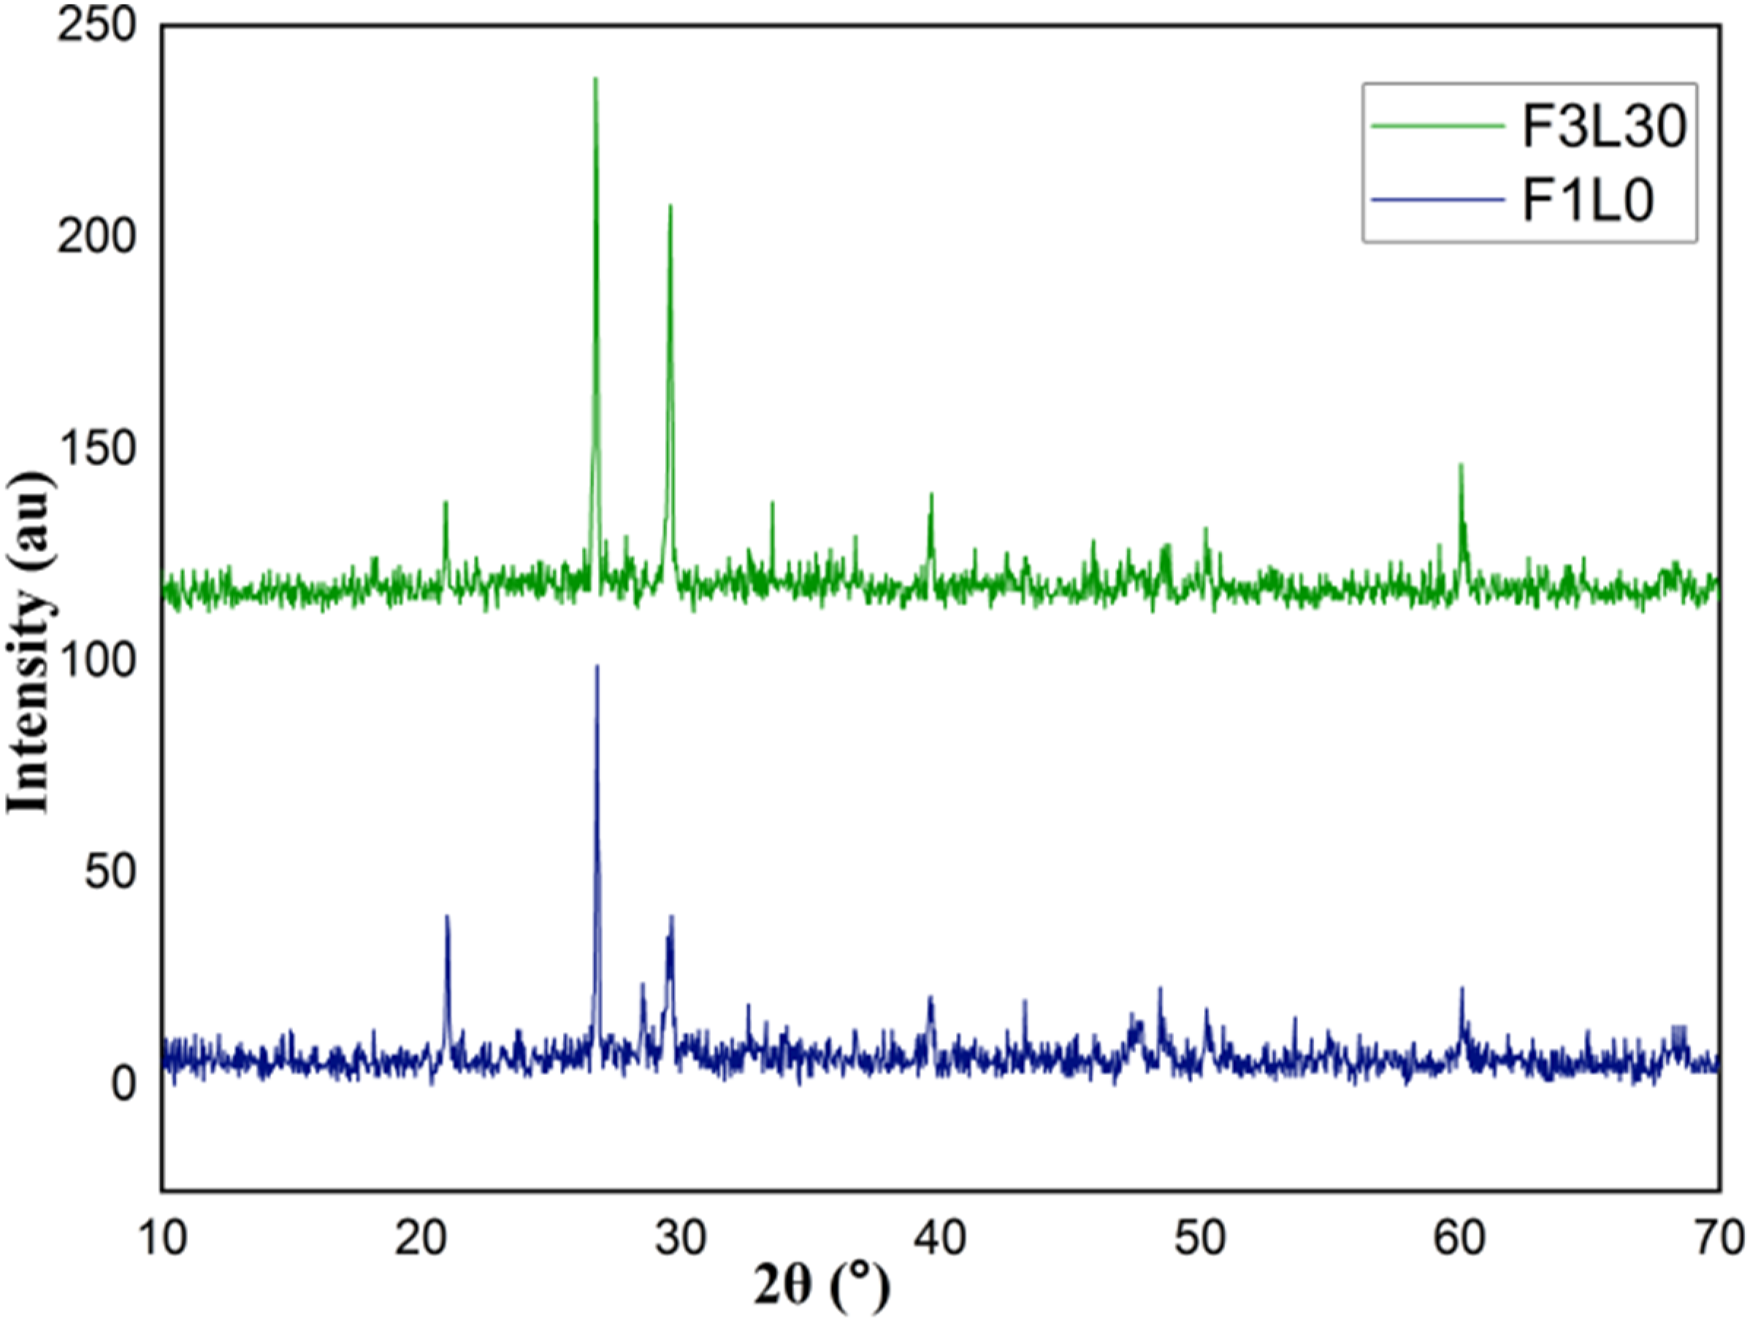
X-ray diffraction (XRD) analysis of concrete samples F1L0 and F3L30.
Compositional content of prepared concrete samples in terms of percentages for several elements.
Analytical investigation
The results of the four-point bending test were used to determine the flexural strength values of each of the particular specimens, which was done as part of the analytical study. The technique employed to achieve this investigation was linear regression analysis. The different composition Vf values of the cast prism samples were linearly correlated with the obtained Fr values. As depicted in Figure 12, an empirical link was constructed between these two parameters, denoted by the acronyms Vf and Fr. Here, Vf is the dosage value or the volume fraction of carbon fibres used, and Fr is the flexural strength values obtained from the flexure test. A marginal coefficient of determination value was obtained from the empirical relation.
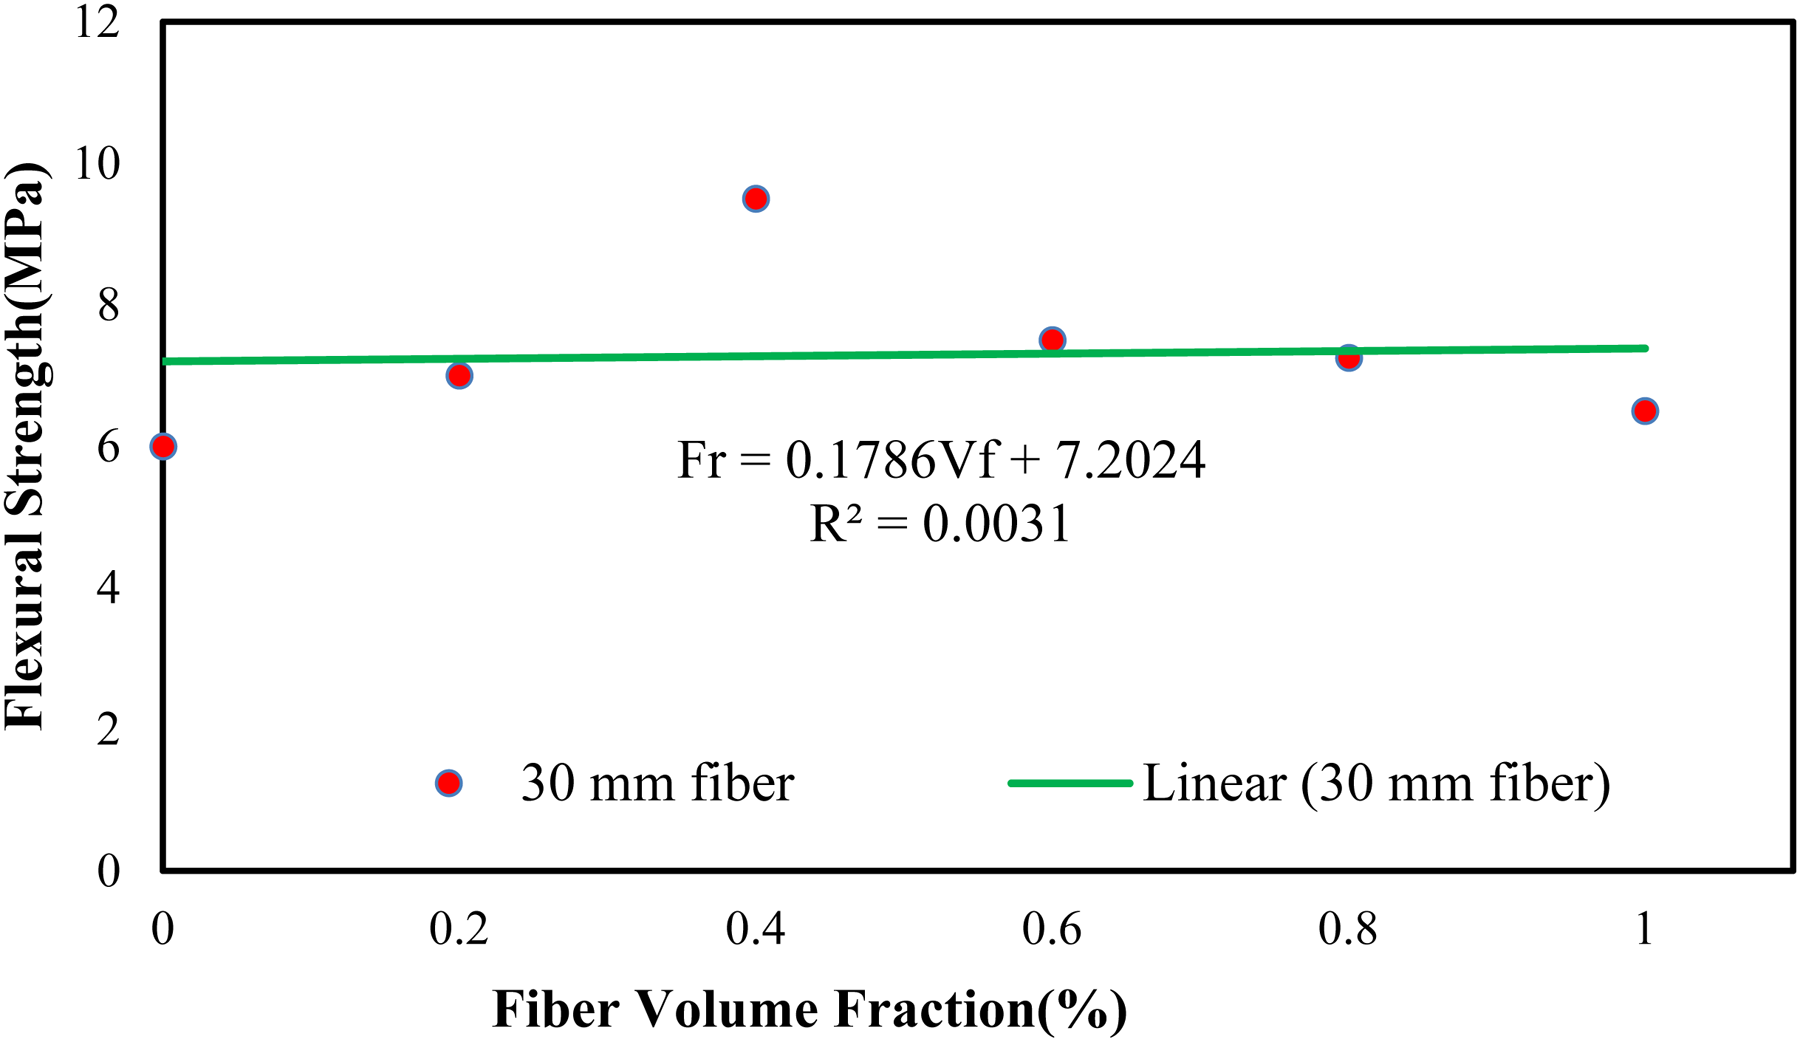
Correlation of Fr with volume fraction (Vf).
Conclusions
To understand the flexure performance of high-strength concrete, a sufficient amount of research was conducted on samples prepared by reinforcing chopped fibres of different mixes with different doses in concrete. This research was carried out to understand the flexure performance of high-strength concrete. A non-destructive test was performed using ultrasonic pulse velocity test equipment, a flexure test on cast specimens, an XRD study, and an examination of the material's composition. The following important points can be deduced from this inquiry and their findings:
As the values of doses were increased, there was an increase in flexural performance; however, this gain was only observed up to an optimum dose point of fibre-reinforced concrete; after reaching this value, the strength values began to decline. A significant drop in pulse velocity was noticed up to an optimum dosage value, and pulse velocity values increased beyond this point. A trend was observed that the flexural strength values first increased and then decreased later, and this trend was reversed with ultrasonic pulse velocity test values. From the XRD result, it was clear that the peaks obtained were of oxygen (O) and calcium (Ca) elements, which were predominant in the matrix silicon, followed by comparable amounts of silicon (Si) and carbon (C), and only minute quantities of aluminium and sodium Debonding was shown to be the most common cause of failure in chopped carbon fibres by scanning electron microscope images. There was a marginal value of the coefficient of determination value when flexure strength values were correlated with different dosage values.
Footnotes
Acknowledgements
The authors would like to thank the support staff of civil engineering and applied physics research laboratories of DTU, Delhi.
Declaration of conflicting interests
The authors declared no potential conflicts of interest with respect to the research, authorship, and/or publication of this article.
Funding
The authors received no financial support for the research, authorship, and/or publication of this article.