
Abstract
This study examined the influence of innovative culture, innovative behavior, and social capital on the performance of Small and Medium-sized Information and Communication Technology Enterprises (SMICTEs) in Lagos, Nigeria. It also explored how innovative culture and social capital affect innovative behavior. Guided by Social Exchange and Social Capital theories, the study utilized a descriptive sample survey research design. The study was conducted at Otigba and Saka Tinubu Computer Villages in Lagos, using a sample of 360 business owners or representatives. Data was collected using a pretested and validated questionnaire covering innovative culture, social capital, innovative behavior, performance, and demographic characteristics. Analysis involved Confirmatory Factor Analysis, and Structural Equation Modelling, with decisions made at a 0.05 significance level. Respondents included owners (67.4%), supervisors (13.6%), managers (12.6%), and other staff (6.8%). Most were male (78.2%), aged 21–40 (71.4%). A majority (95.8%) could generate new ideas, 83.8% explored novel methods, and 91.4% shared innovations internally. Trust among SMEs was low (43.4%), but mutual support was valued (60.4%). Innovative culture positively impacted performance (β = 0.299) and predicted innovative behavior (β = 0.315), while social capital also predicted innovative behavior (β = 0.191). Social capital and innovative behavior did not significantly predict performance. There should be collaboration between Nigeria's NITDA and ICT SMEs to foster innovation through continuous learning, mentorship programs, networking mechanisms, and technology hubs.
Keywords
Introduction to the Study
Small and Medium-sized Enterprises (SMEs) are crucial to economic growth and development, prioritizing job creation, poverty reduction, and economic stimulation (Delanoe, 2013; Ndayako, 2021; Okundaye et al., 2019). They vary in classification globally; SMEs are often defined by size, employment, and assets (SMEDAN, 2024). Generally, micro enterprises have fewer than 10 employees and assets under 5 million Naira, small enterprises have 10–49 employees and 5–50 million Naira in assets, and medium enterprises have 50–99 employees and assets between 50–500 million Naira. In emerging economies, SMEs play key roles in economic development, significantly contributing to GDP and employment (Anderson and Ullach, 2014; Tolani et al., 2019). In Nigeria, SMEs contribute up to 48% of the GDP (International Labour Organization, 2022). SMEs also drive innovation by improving processes and offering better services and products. They adapt quickly to changing business environments, crucial for economic resilience, and are vital in supply chains for larger organizations.
An emerging subset of SMEs is the ICT enterprises in clusters in various locations in Nigeria. These clusters, such as Lagos Computer Village, clusters in Abuja, and Port Harcourt, and other major cities consist of interconnected ICT companies offering services like trading, repairing, and consulting in ICT. These clusters have evolved from basic transactions to embrace complex roles, including direct importation of computer parts and assembly (Jegede and Jegede, 2018).
The development of small businesses is seen globally as a strategic way of promoting job generation, poverty reduction, and stimulating economic growth (Delanoe, 2013; Ndayako, 2021; Okundaye et al., 2019). According to Aremu et al. (2021), small and medium-sized enterprises (SMEs) play strategic roles in the economic development of every nation, particularly in emerging economies. This is because SMEs contribute significantly to poverty reduction, economic prosperity, and the gross domestic product (GDP) of countries (Anderson and Ullach, 2014; Tolani et al., 2019). The Central Bank of Nigeria acknowledges the role of SMEs in developing new products and services, providing job opportunities, and contributing up to 48% of the GDP, which is a key indicator of economic growth (International Labour Organisation, 2022).
SMEs are also crucial sources of innovation (Yahaya and Nadarajah, 2023), as they improve their processes and offer better services and products. They exhibit innovative behaviors, including redesigning products or services to meet market needs, exploring unique distribution or sales techniques, and venturing into untapped markets (IFC, 2014). Furthermore, SMEs are particularly important in promoting cooperation and culture due to their size and informal nature. SMEs, given the dynamic nature of business environments and market conditions, leverage internal and external competencies and resources to drive performance, which is critical to their survival and economic contributions (Okundaye et al., 2019).
An important aspect of the growing significance of ICT is the emergence of small and medium-sized ICT enterprises in clusters in Nigeria. This group of SMEs is an expanding subset of businesses that emphasize generating both financial and social gains (Santoro et al., 2019). These ICT SMEs are recognized as potential game changers in the information and communication development sector because they produce measurable social and financial returns and show signs of scalability. ICT SMEs dominate clusters that act as major catalysts for societal progress and chief determinants of innovation, playing significant roles in job creation, income generation, and industrial development (Akanbi and Adewoye, 2021).
Oyelaran-Oyeyinka (2006) observed that small and medium-sized ICT enterprises are location-based concentrations of interconnected companies, institutions, and other business outfits. These ICT SMEs, seen largely in clusters, consist of linked firms and other entities such as suppliers of specialized and non-specialized inputs, manufacturers, computer cloners, and satellite technology providers, whose linkages offer potential advantages and opportunities for innovation (Oyelaran-Oyeyinka, 2014). Typical of these clusters is the Lagos Computer Village in Lagos, Nigeria, which has evolved from trading in imported new and used ICT equipment in the early 90 s to becoming a beehive of ICT activities. Other clusters exist in major cities such as Abuja, Nigeria's Federal Capital Territory, and Port Harcourt, the Rivers State capital. Actors in ICT SMEs consist of trained experts and artisans engaged in various IT activities (Nwagwu and Ibeku, 2016; Oyelaran-Oyeyinka, 2014). These SMEs typically operate by trading, supplying, and repairing ICT facilities, including computers, satellite technologies, telecommunication equipment, and mobile phones. They also provide services for office equipment and cloning of computers and other ICT equipment.
The ecology of ICT SMEs has changed significantly over time, incorporating more complex roles such as the direct importation of computer parts, components, and accessories for direct sales. According to Jegede and Jegede (2018), other activities include IT consultancy, training, and web development. ICT clusters in Nigeria have developed complex systemic networks, interactions, and knowledge flows, becoming grounds for many innovation research initiatives (Nwagwu and Ibeku, 2016). This suggests diverse links among ICT SMEs in clusters and institutions outside the clusters, including cooperation with manufacturers and research institutions. As ICT SMEs in clusters exhibit high rates of learning and competition, considering different practices could lead to changes in their behavior, impacting their performance (Heinicke, 2018).
The performance of small and medium enterprises is crucial to the socio-economic development of economies due to their ability to drive competition, stimulate innovation, and contribute to overall economic growth. SMEs are major sources of employment, providing jobs to many individuals and groups who may face barriers to employment in larger organizations (Bifeke and Daniel, 2022). In terms of income generation, small businesses provide income opportunities for owners and employees, leading to poverty alleviation and improved standards of living. Additionally, SMEs contribute significantly to government revenues at all levels through taxes and levies, aiding public infrastructure investments and governance. The ability of SMEs to adapt quickly to changing business environments, especially during crises, has contributed to the resilience of economies. SMEs are also critical parts of supply chains for larger organizations, significantly affecting supply chain efficiency. With these contributions, the performance of SMEs is crucial not only to entrepreneurs and their employees but to the broader economy. Therefore, enhancing their performance is a priority for all stakeholders.
Statement of the problem
Despite the potential of small and medium enterprises (SMEs) to drive innovation, foster competition, and contribute to economic growth, their performance is hindered by various factors. Socio-cultural variables have been strongly linked to the performance of SMEs. Previous studies on small and medium ICT enterprises in clusters in Nigeria have primarily focused on the emergence and growth of these enterprises, their size and capacity (Bamiro, 2003; Oyelaran-Oyeyinka, 2006), sustainability, production capability (Abiola, 2008; Oyelaran-Oyeyinka, 2014; Oyelaran-Oyeyinka and McCormick, 2007), innovation capabilities, types of innovation, and constraints (Awoleye, 2015; Jegede and Jegede, 2018; Nwagwu and Ibeku, 2016).
These studies have explored learning patterns through collaboration, knowledge transfer types, and human capital factors affecting production capacity. They also examined innovation capabilities in relation to size, operational modes, and sustainability, along with the impact of clusters on employees’ standard of living and poverty alleviation. Findings revealed two main features of ICT SMEs: emerging firm-level capabilities and increasing firm-to-firm interaction aimed at building a knowledge-based cluster. Key determinants of innovation capability included the frequency of training and business growth, with process innovation being the most common type (Awoleye, 2015).
However, there is a lack of literature on the contributions of social variables rooted in traditional socio-cultures and socially accessible capital, such as innovative behavior, innovative culture, and social capital, which might fundamentally influence the innovation and performance of small and medium ICT enterprises. Recently, ICT SMEs have struggled to improve their innovative capabilities and performance. Considering these variables is essential for enhancing the overall performance of SMEs. Motivated by these gaps and findings, this study investigates how innovative culture, social capital, and innovative behavior influence the performance of small and medium ICT enterprises in Lagos. The study aims to inform policies and strategies to improve innovation and performance in ICT SMEs in Nigeria.
Objectives of the study
This study examines how innovative culture, social capital, and innovative behavior variables, along with their interrelations, influence the performance of small and medium ICT enterprises in Lagos, Nigeria. The study is guided by the following specific objectives:
To examine the innovative behaviors of small and medium ICT enterprises in Lagos, Nigeria. To examine the innovative culture of small and medium ICT enterprises in Lagos, Nigeria. To examine the social capital of small and medium ICT enterprises in Lagos, Nigeria. To ascertain the performance of small and medium ICT enterprises in Lagos, Nigeria. To determine the interrelationships among innovative culture, social capital, innovative behavior, and performance among small and medium ICT enterprises in Lagos, Nigeria.
Research hypotheses
There is no significant relationship between innovative culture and the performance of small and medium ICT enterprises in Lagos, Nigeria. There is no significant relationship between social capital and the performance of small and medium ICT enterprises in Lagos, Nigeria. There is no significant relationship between innovative behavior and the performance of small and medium ICT enterprises in Lagos, Nigeria. There is no significant relationship between innovative culture and innovative behavior of small and medium ICT enterprises in Lagos, Nigeria. There is no significant relationship between social capital and innovative behavior of small and medium ICT enterprises in Lagos, Nigeria. Innovative behavior does not mediate the relationship between innovative culture and the performance of small and medium ICT enterprises in Lagos, Nigeria.
A study on how innovative culture, social capital, and innovative behavior influence small and medium ICT enterprises is essential for advancing our understanding of innovation dynamics in dynamic business environments. This research aims to inform policymakers and stakeholders on strategies to bolster the innovative capacity of ICT SMEs, thereby contributing to economic growth and competitiveness.
The study focused on examining how innovative culture, innovative behavior, and social capital influence the performance of small and medium ICT enterprises in Lagos, Nigeria, specifically exploring dimensions such as resource allocation culture, entrepreneurial culture, competitive culture, learning culture, degree of trust, shared values, level of social interaction, and performance indicators including product/market diversity, cost reduction, market expansion, profitability, scaling up, and sustainability.
Literature review
Understanding innovation
Innovation plays a pivotal role in enhancing the performance of small and medium enterprises (SMEs), serving as a catalyst for growth and survival in dynamic business environments. It encompasses the creation of novel goods, improved production methods, new market opportunities, enhanced supply chains, and the establishment of new industry standards (Afuah, 2020; Schumpeter, 1942). Scholars highlight its significance as a driver of competitiveness and profitability, essential for organizations aiming to expand and achieve sustained success (Schumpeter, 1942).
Innovation can take various forms, including product, process, marketing, and organizational innovations, each contributing uniquely to an organization's strategic goals and market positioning (OECD, 2005). It involves the integration of new technologies, ideas, and practices to create value-added products or services that meet evolving market demands (Urban and Sefalafala, 2015). Furthermore, innovation is not limited to technological advancements but also encompasses cultural and organizational changes that foster creativity, learning, and adaptation (Luecke, 2003). Digital innovation, enabled by technological advancements, presents unparalleled opportunities for organizations to revolutionize their operations and offerings (Henfridsson et al., 2014). This shift requires businesses, including SMEs, to continuously adapt their strategies and embrace digital transformation to maintain competitiveness in today's rapidly evolving markets (Sedera et al., 2016).
The ability to innovate is influenced by internal factors such as organizational culture, leadership, and human resource practices, which shape the organizational environment and encourage experimentation and risk-taking (Amabile, 1996; West and Farr, 1989). Additionally, external factors like collaborative partnerships and government policies play crucial roles in facilitating access to new knowledge, resources, and markets, thereby enhancing innovation capabilities (Chesbrough, 2003; Mazzucato, 2013).
Early research on the subject classifies innovations into two distinctive types: administrative innovation and technical innovation. These types relate to changes made in various activities within a specific organization (Parrilli and Radicic, 2020; Sexton, 2012). Administrative innovations encompass changes in organizational structure and administrative processes. While these changes have an indirect relationship with the core activities of the organization, they directly influence organizational management (Irani, 2019; Sexton, 2012). On the other hand, technical innovations involve advancements in products, services, and production processes. These innovations have a direct impact on the fundamental activities of the organization, including products or processes (Agwu, 2011).
Product innovation refers to the creation of new or improved goods or services, while process innovation involves enhancing the methods used to create products or deliver services (Naughton, 2002). Position innovation involves contextual variations in introducing products or processes to the market, while paradigm innovation focuses on intellectual model changes that drive business transformations (Henderson and Clark, 1990). Radical innovation signifies a significant departure from existing technologies or practices, often introducing entirely new concepts or materials. In contrast, incremental innovation involves iterative improvements to existing products or processes (Dodgson et al., 2008). Modular innovation integrates new components into an existing product architecture, enabling flexibility in design and adaptation to new markets. Architectural innovation, on the other hand, modifies the overall system configuration without altering its basic components (Chapman, 2002). The advent of digital technology has facilitated the development of new digital products and services. Digital innovations leverage technologies like AI and IoT to enhance product functionality and improve service delivery (Nasiri et al., 2020; Parida et al., 2015).
In response to environmental and social challenges, sustainable innovation focuses on enhancing products, services, and technologies to minimize ecological impact while maximizing economic and social benefits (Schaltegger and Wagner, 2011). Open innovation involves integrating external ideas and resources into the innovation process, whereas closed innovation relies solely on internal capabilities and resources (Chesbrough, 2003).
Theoretical framework
This study is guided by two theoretical frameworks: Social Capital Theory (SCT) and Social Exchange Theory (SET) which we synthesize here.
Social Capital Theory (SCT)
Social Capital Theory (SCT), first articulated by Robert Putnam in (1993), is a structural and network theory focusing on social relationships within communities. The theory has garnered significant attention and empirical support across various socioeconomic contexts, highlighting its relevance (Krishna, 2001). SCT identifies five key constructs: networks, reciprocity, trust, social norms, and personal and collective efficacy. Networks refer to associations within a social system, varying in size and impact, including groups and individual connections. Reciprocity posits that acts of kindness or services are expected to be reciprocated over time among community members. Trust involves a willingness to take risks in social contexts based on expectations of reciprocal behavior. Social norms are unwritten guidelines governing behavior within groups. The robust utilization of social capital underscores its theoretical validity and practical applications across diverse settings.
Additionally, SCT emphasizes the collaborative potential within social systems, examining how norms, networks, and trust facilitate collective action and mutual benefits among group members (Woolcock, 2001). Critics, however, point out challenges in defining and operationalizing social capital, impacting empirical assessments (Adler and Kwon, 2002). Despite these challenges, SCT remains valuable for integrating sociological concepts like social support and cohesion.
Social Exchange Theory (SET)
Social Exchange Theory (SET), pioneered by Homans (1961) and developed by Blau (1964), explores social relationships in terms of mutual benefits and exchanges. SET posits that social behaviors are outcomes of exchanges where individuals seek rewards while minimizing costs (Diekmann et al., 2014). Key dimensions of SET include perceived rewards in exchanges, efforts to minimize costs (cognitive, emotional, etc.), and the establishment of trust through repeated interactions. Trust enables individuals to predict and anticipate positive behavior from others, fostering ongoing exchanges (Cortez et al., 2022). SET views social interactions as foundational to human relationships, emphasizing the role of reciprocity and mutual benefit in shaping social structures (Montgomery, 2000). The theory's application spans various social processes, offering a framework to understand interactions and exchanges in social settings.
In the context of ICT clusters in Nigeria, both SCT and SET provide valuable frameworks. SCT helps understand how trust and shared norms among the operators in the clusters facilitate collective action and innovation. SET elucidates the dynamics of reciprocal exchanges and trust-building behaviours that enhance collaboration and performance within SMEs. On the basis of the variables extracted from these theories, a research framework is created to guide the present study.
The research framework
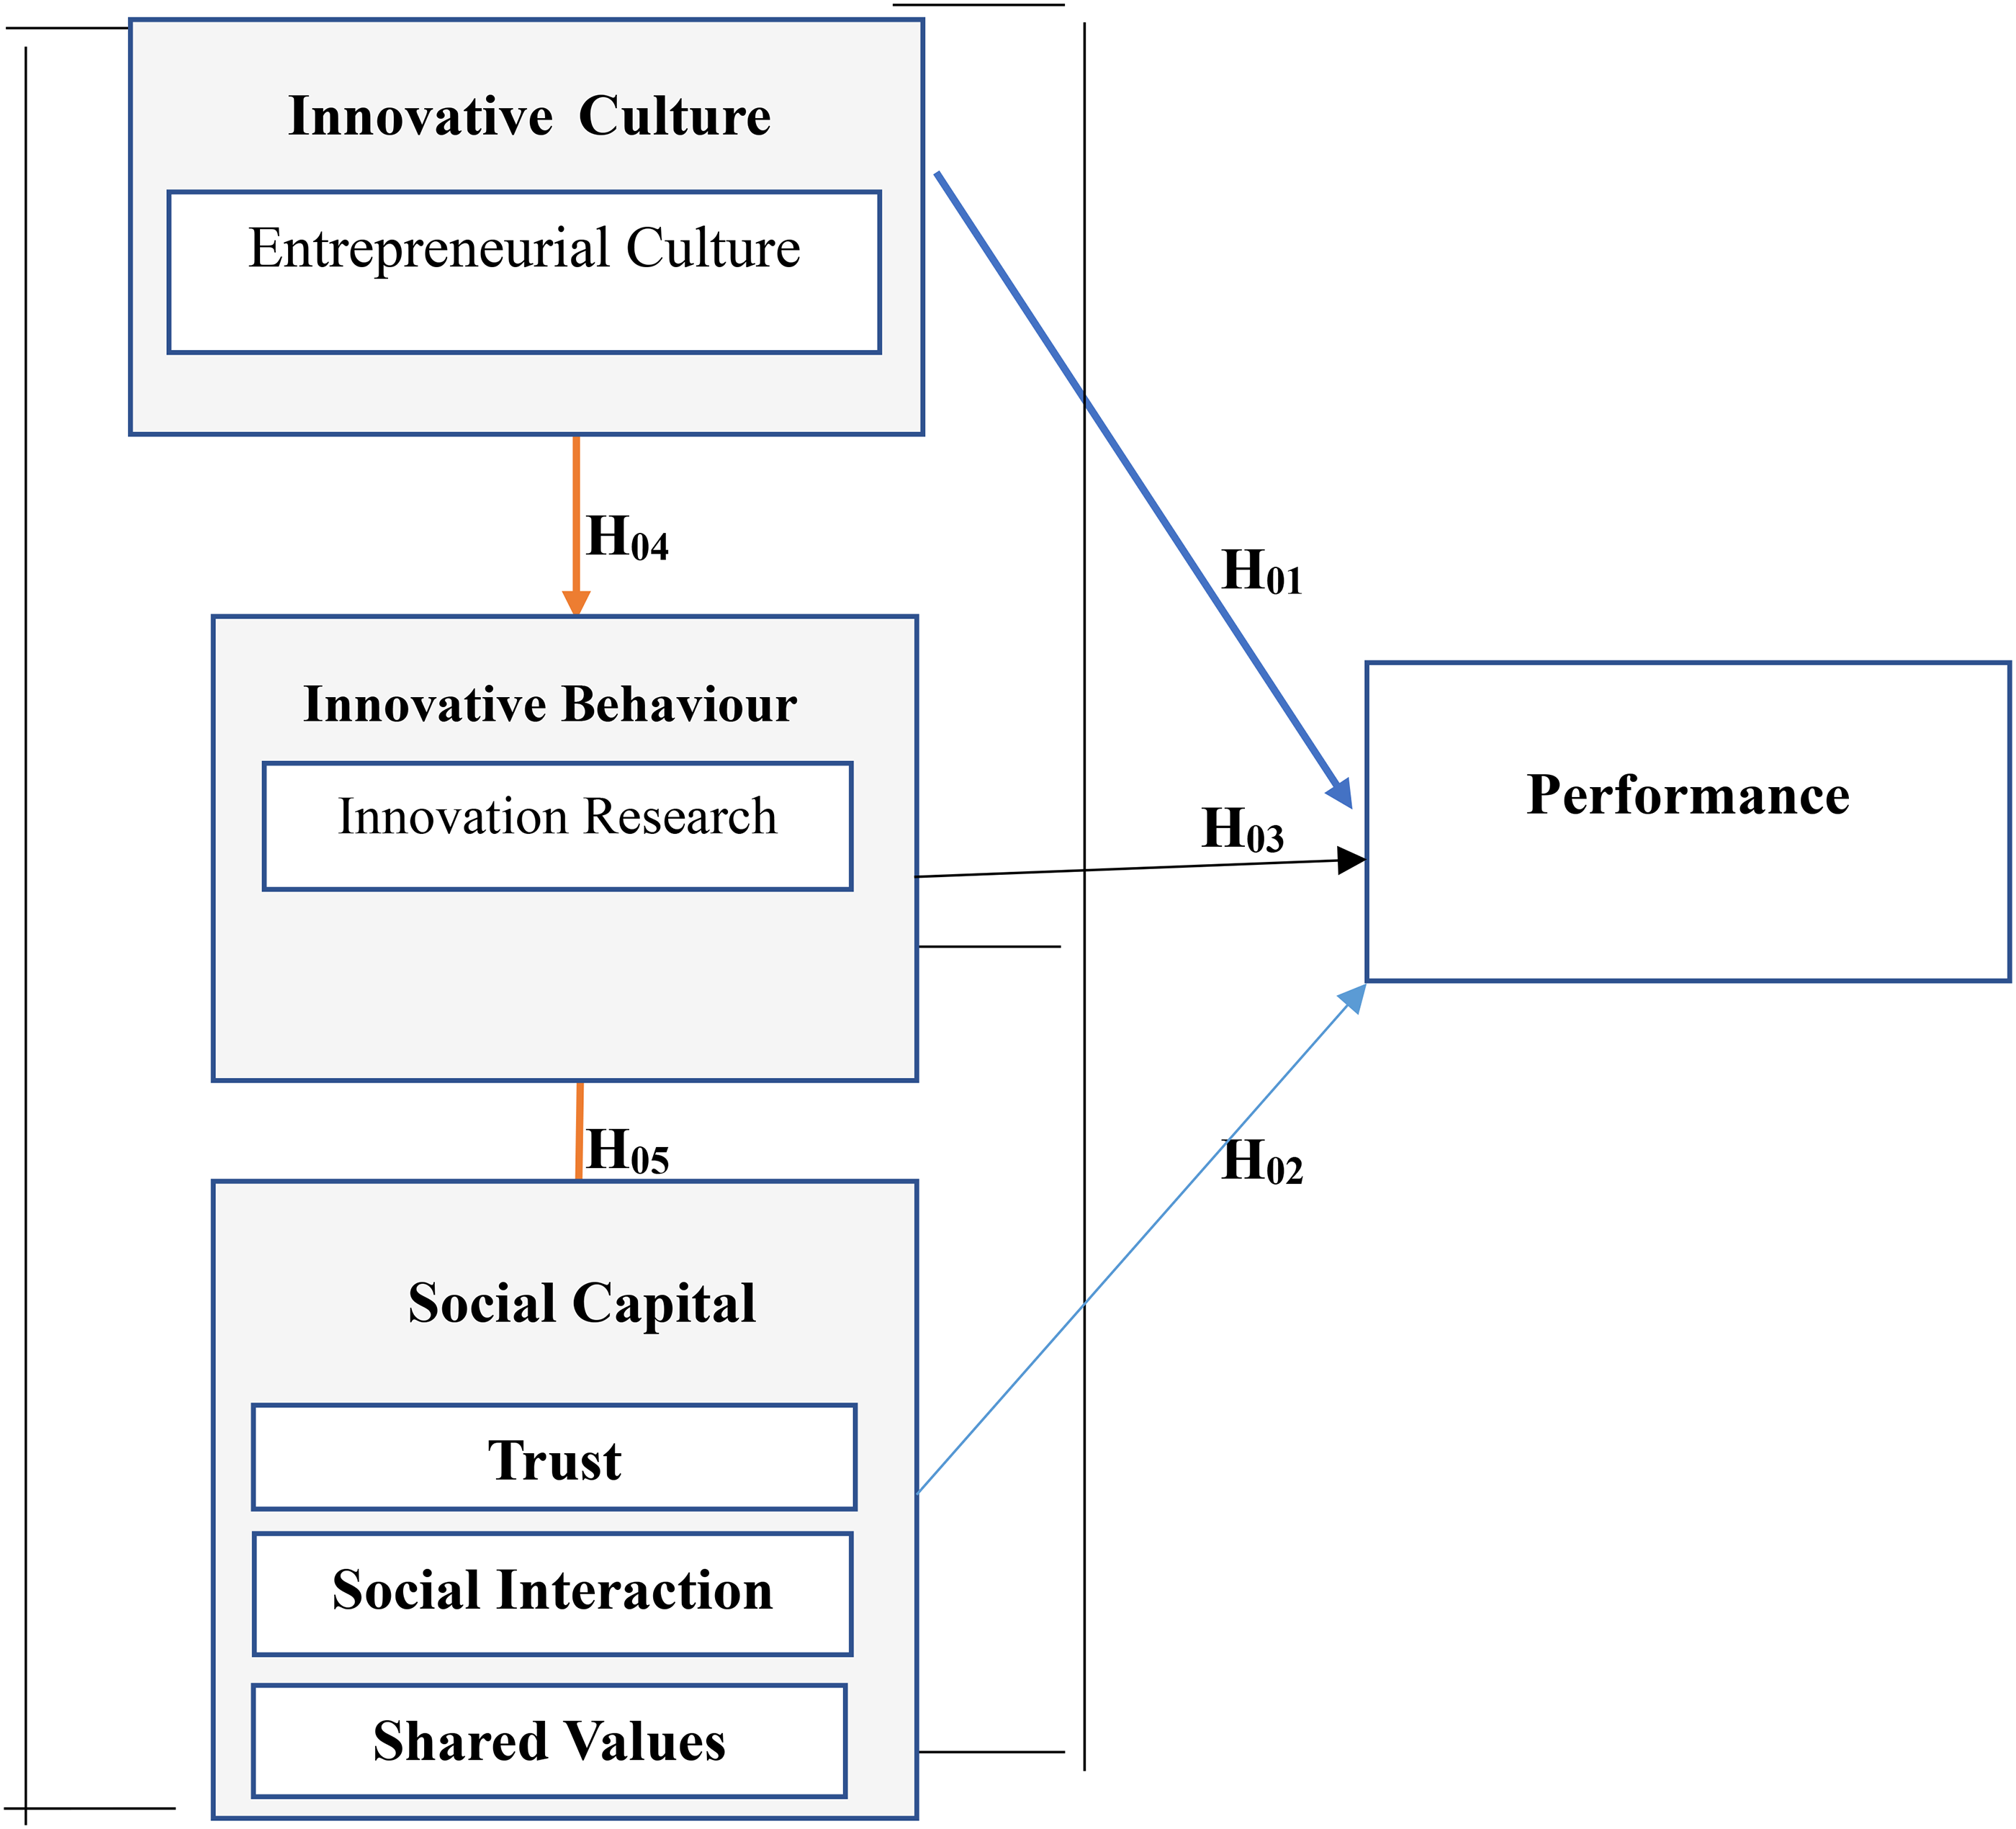
The research framework (Figure 1) integrates dimensions of SET and SCT to explore the influence of innovative culture, innovative behavior and social capital on performance of Small of Medium ICT Enterprises (SMEs) in Nigeria.
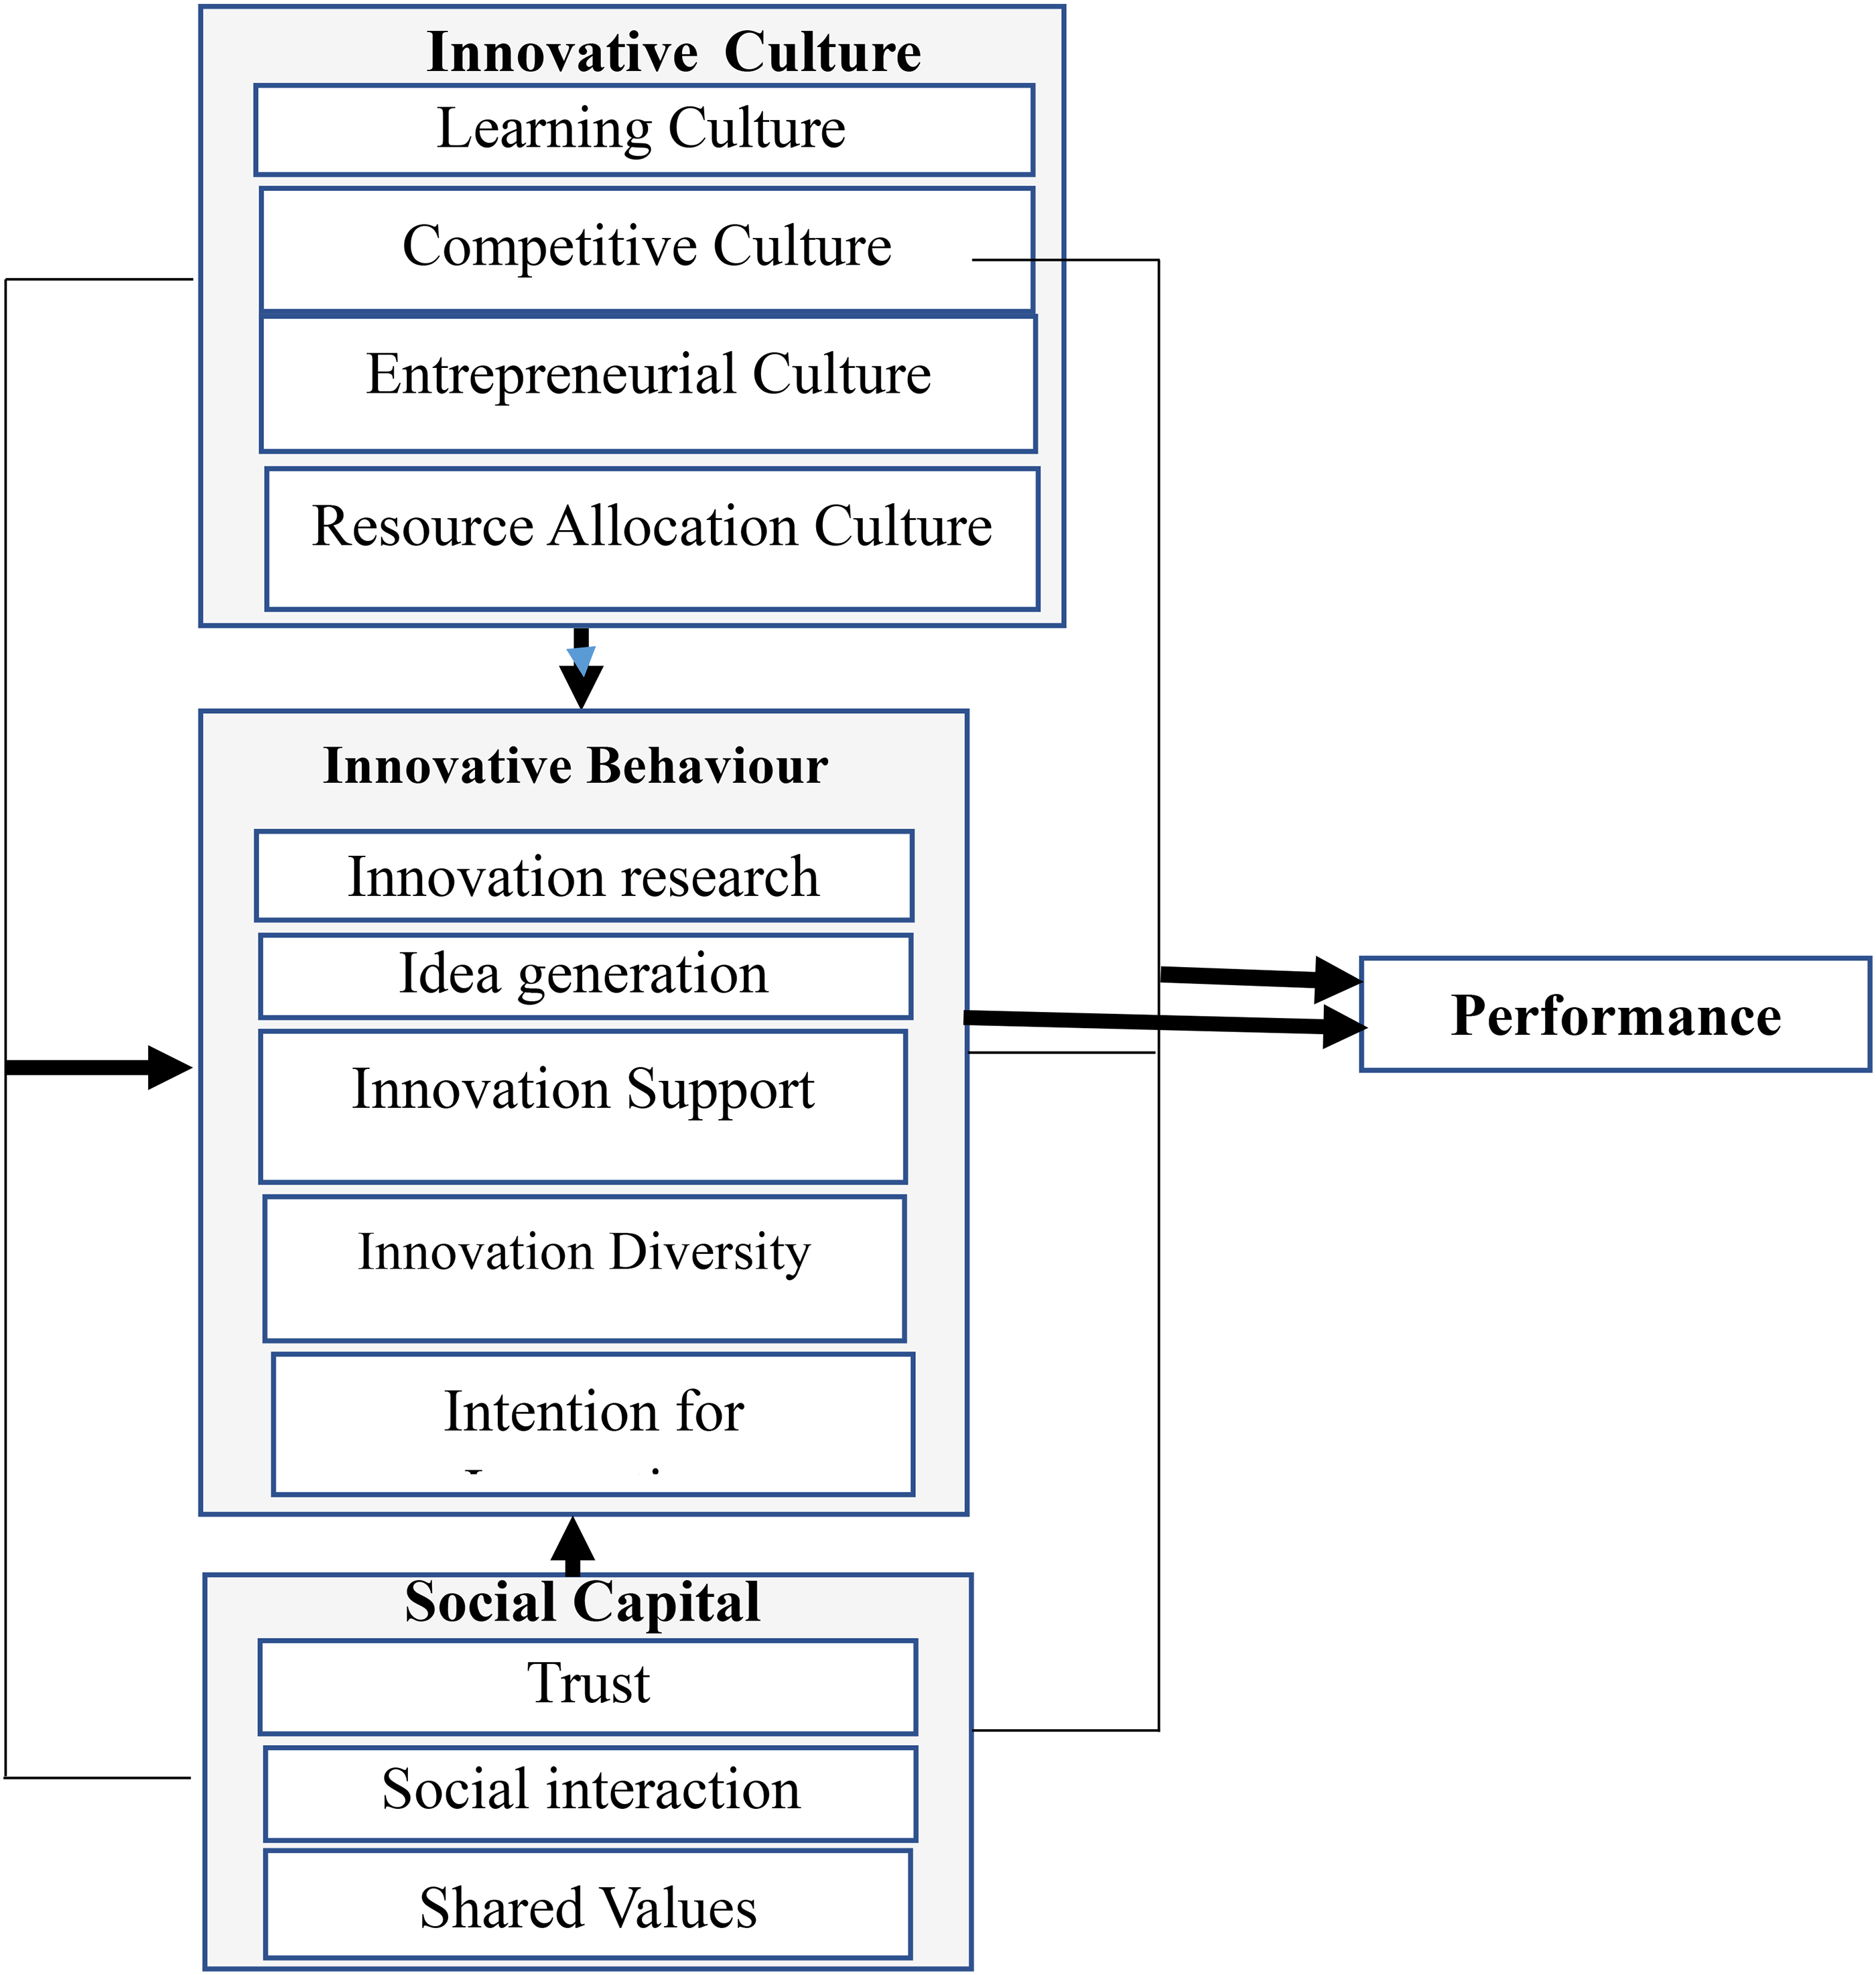
Research framework.
Innovative culture encompasses four dimensions:
Resource Allocation Culture: Allocation of resources such as funds and time towards innovation projects, crucial for fostering innovation (Börjesson et al., 2014; Tellis et al., 2009). Learning Culture: Involves individual and social learning orientations. Individual learning focuses on acquiring and experimenting with new knowledge internally, while social learning emphasizes collaborative knowledge acquisition through trusted networks (Calantone et al., 2002). Entrepreneurial Culture: Emphasizes the role of entrepreneurship in implementing new and creative ideas within SMEs, essential for competitive advantage and growth. Competitive Culture: Focuses on strategies and actions SMEs undertake to manage and respond to competition, crucial for market positioning and sustainability.
Innovative behavior
Key attributes of innovative behavior under study include:
Innovation Research: Generation of new solutions to organizational problems, both current and future-oriented. Idea Generation: Processes and activities SMEs employ to generate new ideas and solutions. Innovation Support: Practices and initiatives within SMEs that encourage and support innovation activities. Intention for Innovation: The firm's commitment and strategic alignment towards innovating across its vision, goals, and business model (Dobni, 2008). Innovation Diversity: The breadth and scope of innovative activities undertaken by SMEs, including product diversification, input sourcing, and customer support innovations.
Social capital
Social capital is conceptualized through three dimensions:
Degree of Trust: The willingness of actors in social interactions to be vulnerable based on expectations of reciprocation, critical for knowledge sharing and cooperation (Chiu et al., 2006). Social Interaction: Engagement in meaningful social activities and networks that facilitate collaboration and knowledge exchange among SMEs. Shared Values: Common understanding and shared beliefs among SMEs, developed over time through interactions, fostering a conducive environment for innovation. Product Range/Diversity: Extent to which SMEs diversify their product or service offerings. Market Expansion: Ability of SMEs to reach new customer segments and expand their market reach. Size Scaling: Growth and scaling of SMEs in terms of business size and capacity. Firm Sustainability: SMEs’ ability to meet financial, social, and environmental obligations while maintaining operational efficiency. Cost Reduction: Efforts to reduce costs associated with inputs and operations, enhancing profitability. Higher Profitability: Achievement of higher profit margins, revenue growth, and enhanced market competitiveness.
Performance–Performance outcomes evaluated include:
The framework posits that innovative culture, social capital, and their interaction influence innovative behavior and subsequent performance outcomes within SMEs. Specifically, it hypothesizes that a conducive innovative culture combined with strong social capital enhances SMEs’ innovative capacity, leading to improved performance across various metrics.
Methodology
Research design and study location
The study adopted a descriptive sample survey research design. This design was used because the study was guided by hypotheses derived from an articulated research framework. This study was conducted in ICT-Based enterprises in Lagos, Nigeria. Small and medium ICT enterprises are firms relying heavily on digital tools and systems, to operate, deliver goods and services, and also interact with their customers and other stakeholders (Tondro et al., 2022). These enterprises utilises the power of technology to drive innovation and enhance their operations. Due to their ability to adapt to changing business environment and the power of information and communications technology, these enterprises are positioned to drive growth and performance on various industries. There are several Small and Medium ICT Enterprises operating in ICT clusters in Lagos State, Nigeria.
However, two sites Otigba Computer Village, Ikeja and Saka Tinubu, Lagos Island in Lagos State were chosen for the purpose of this study. The Otigba ICT cluster in Lagos is the biggest cluster in Lagos and has attracted the attention of scholars over the years. The cluster was selected based on the large-scale ICT activities and opportunities for innovation and is reputed to be the largest ICT market in Africa (Abiola, 2008; Ogunjemilua et al., 2020; Oyelaran-Oyeyinka, 2006). It originated in 1990s on two streets but now occupies eight streets (Nwagwu and Ibeku, 2016; Oyelaran-Oyeyinka, 2014), and is an example of self-starting and self-sustaining cluster of enterprises (Oyelaran-Oyeyinka, 2014), providing employment for many people including graduates (Ogunjemilua et al., 2020).
Study population and sampling and sample size
According to the Computer and Allied Products Association of Nigeria (CAPDAN), there were about 5700 registered enterprises at the Otigba cluster (Awosanya, 2018). The Saka Tinubu cluster has no list of the SMEs. A sample size of 360 SMEs was determined at 95% confidence interval using Qualtrics, a widely used online survey software that also permits calculation of sample size for undefined populations (Smith et al., 2002). To select the specific subjects for the administration of the instrument, the researcher studied the SMEs based on the accessibility and availability of the business owners or their representatives at the time of data collection. This technique was adopted since there is no sampling frame of the SMEs to guide any random sampling technique.
Data collection instrument
This study used a structured questionnaire suitable for a descriptive survey. Many of the variables were adapted from existing studies except the demographic details:
SME Attribute: Information on the respondent's demographics and SME details. Innovative Behaviour: Adapted from Scott and Bruce (1994) and Senyard et al. (2014), this section measured innovation participation and strategy. Innovative Culture: Adapted from multiple sources, it assessed learning, entrepreneurial, competitive, and resource allocation cultures. Social Capital: Adapted from several sources, it measured trust, social interaction, and shared values. Performance: Due to challenges with obtaining objective data, subjective measures were used to evaluate SME performance, including innovation results and profitability.
Each section used a 4-point Likert scale (‘Strongly Agree’, ‘Agree’, ‘Disagree’, ‘Strongly Disagree’).
Validation of the questionnaire
The questionnaire was validated through:
Face Validation: Experts in Information Science, Psychology, Sociology, and Entrepreneurship from the University of Ibadan reviewed the questionnaire for relevance, appropriateness, and clarity. Feedback was incorporated to improve the instrument. Test-Retest Validation: Conducted in November 2019 with 16 respondents in Lagos. The same respondents completed the questionnaire twice, one month apart. Pearson correlation statistics was used to assess the consistency, with a correlation coefficient of at least 0.70 indicating reliability. Internal Consistency Validation: Cronbach's Alpha was used to measure the reliability of the constructs, with most coefficients above 0.70, indicating adequate internal consistency.
Table 1 and Table 2 show that the questionnaire has good reliability and internal consistency, with Cronbach's Alpha values typically above 0.70, signifying reliable scales. The test-retest correlations in Table 1 demonstrate strong and statistically significant correlations (p < 0.01) for most constructs, indicating a high degree of stability and reliability over time. Constructs such as “Competitive Culture” and “Shared Values” show particularly high correlations, suggesting consistent measurement. However, “Entrepreneurial Culture” exhibits a lower, but still significant (p < 0.05), correlation, indicating less stability compared to other constructs.
Test-Retest correlations for constructs (N = 16).
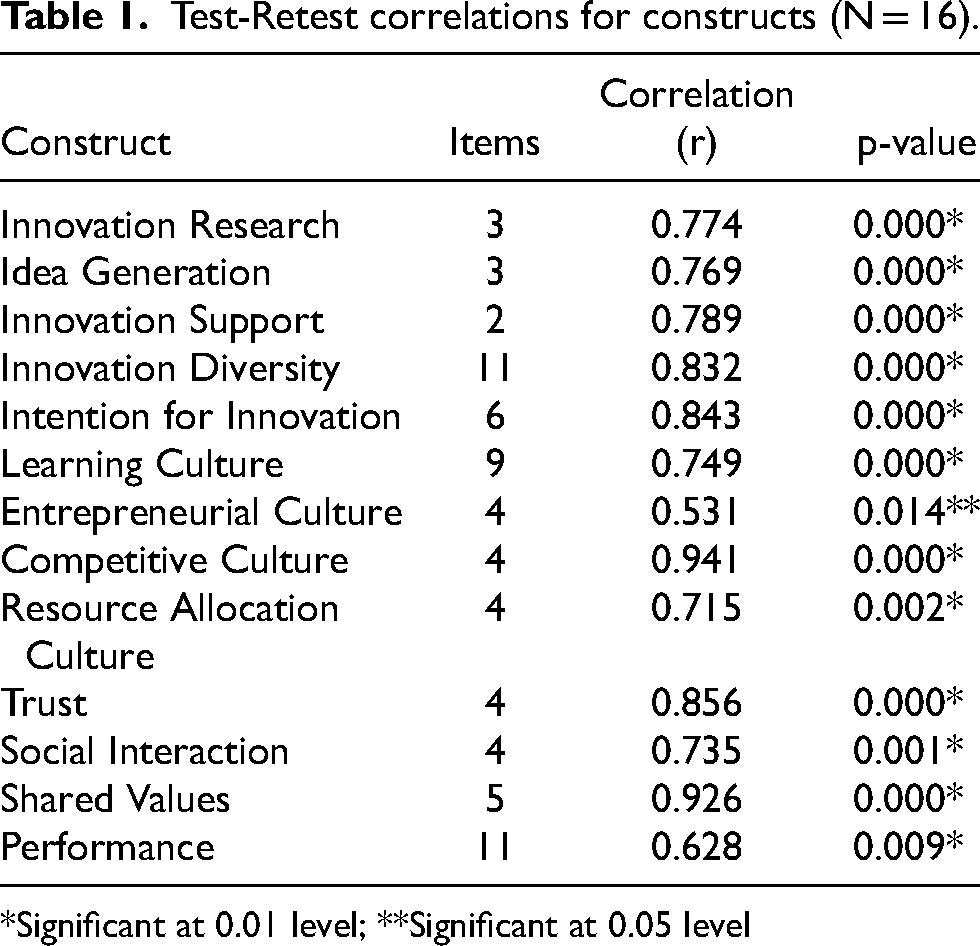
*Significant at 0.01 level; **Significant at 0.05 level
Cronbach's alpha results for constructs (n = 16)
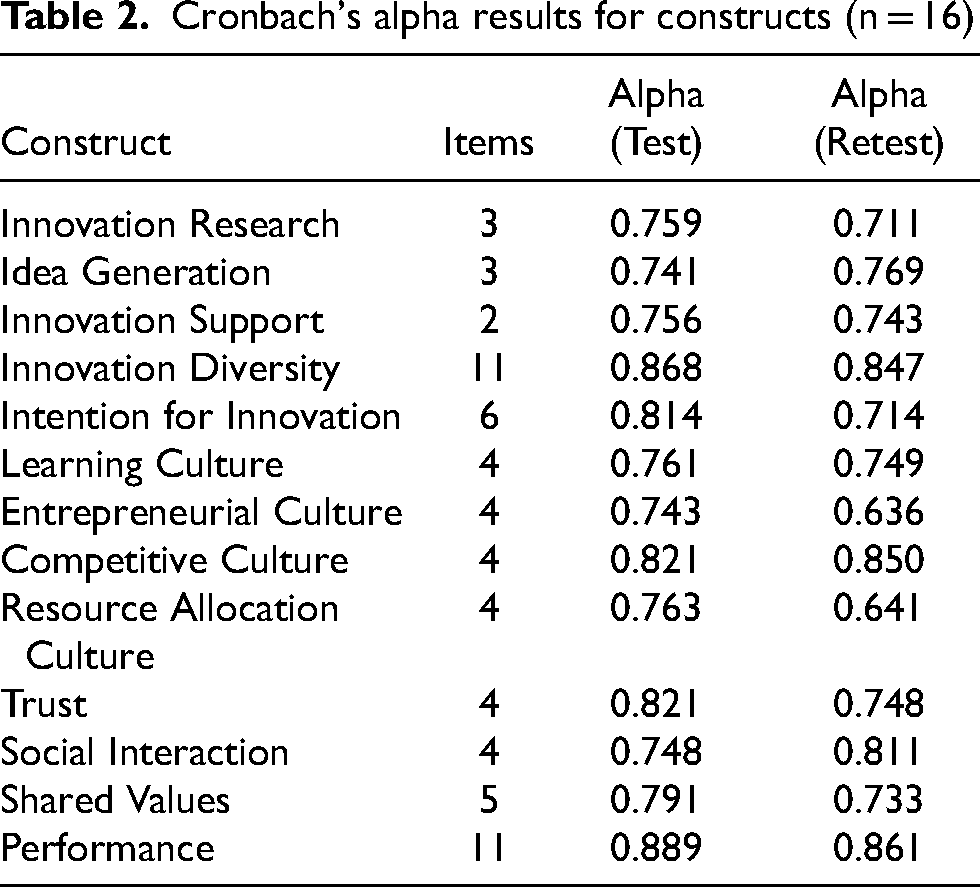
Table 2 indicates variations in the internal consistency reliability over time. While some constructs, such as “Competitive Culture” and “Social Interaction,” show an increase in reliability from test to retest, others, like “Entrepreneurial Culture” and “Resource Allocation Culture,” exhibit a noticeable decline. These variations suggest that the stability of the constructs’ measurement highlight the importance of assessing test-retest reliability to ensure the consistency and dependability of the scales used in research.
Data collection method
The questionnaire was administered by the researcher and an assistant. They approached SME heads or their delegates, introduced the study, and requested participation. Questionnaires were handed out, with some completed on the spot and others collected later. The survey took place between August and November 2021.
Ethical considerations and strategies
Ethical considerations are crucial for fostering trust, protecting participants, and ensuring transparency. The study's design, review, and execution adhered to ethical standards. A letter from the University of Ibadan's Department of Data and Information Science solicited cooperation from the Computer and Allied Products Association of Nigeria (CAPDAN), whose leadership permitted the survey but did not distribute the questionnaires. Participation was voluntary and free from coercion, with no risks involved. Respondents were fully informed about the study's purpose, methods, and benefits. Personal information was kept confidential and anonymized. Respondents could opt out at any stage, ensuring their rights and privacy were respected. Data integrity was maintained by accurately reporting and avoiding manipulation or fabrication.
Methods of data analysis
Descriptive and inferential statistics were used, with AMOS 23 and SPSS 28 for the analysis. Variables were described using frequency, percentage distribution, mean, and standard deviation. Principal component analysis (PCA) was employed to reduce constructs with many variables. Kaiser Meyer Olkin (KMO) and Bartlett's test of sphericity were used to assess the suitability of the scales. PCA identifies the maximum variation in the dataset using fewer variables while retaining much of the original dataset's statistical information. To test the hypotheses, structural equation modeling (SEM) was used, as it handles causal models effectively. SEM increases model validity and estimates causal relationships between latent constructs. SEM is suitable for complex models and large sample sizes, providing reliable structural model estimations.
The structural model includes exogenous (independent) and endogenous (dependent) constructs. Reflective measurement models were evaluated for internal consistency reliability, indicator reliability, convergent validity, and discriminant validity using Cronbach's alpha (CA) and average variance extracted (AVE). The first criterion for evaluating the structural equation model is each endogenous latent variable's coefficient of determination (R2), measuring the explained variance. Path coefficients between latent variables are then examined for their sign, magnitude, and relevance.
Results
Frequency distribution of the data
This section presents the frequency distributions of the data collected from the SMEs.
SME attributes
Table 3 Shows that 178 of the respondents who participated in the study were the owners of their firms, while 52 were head managers and 23 were supervisors. Thirteen respondents were apprentices while 18 were other staff. Males constituted 78.2% of the respondents while 21.8% of the respondents were females. This is consistent with previous studies Nwagwu and Ibeku (2016) and Oyelaran-Oyeyinka (2017), which reported that most of the firms in an ICT cluster is owned by males.
Demographic characteristics of the respondents (n = 265)
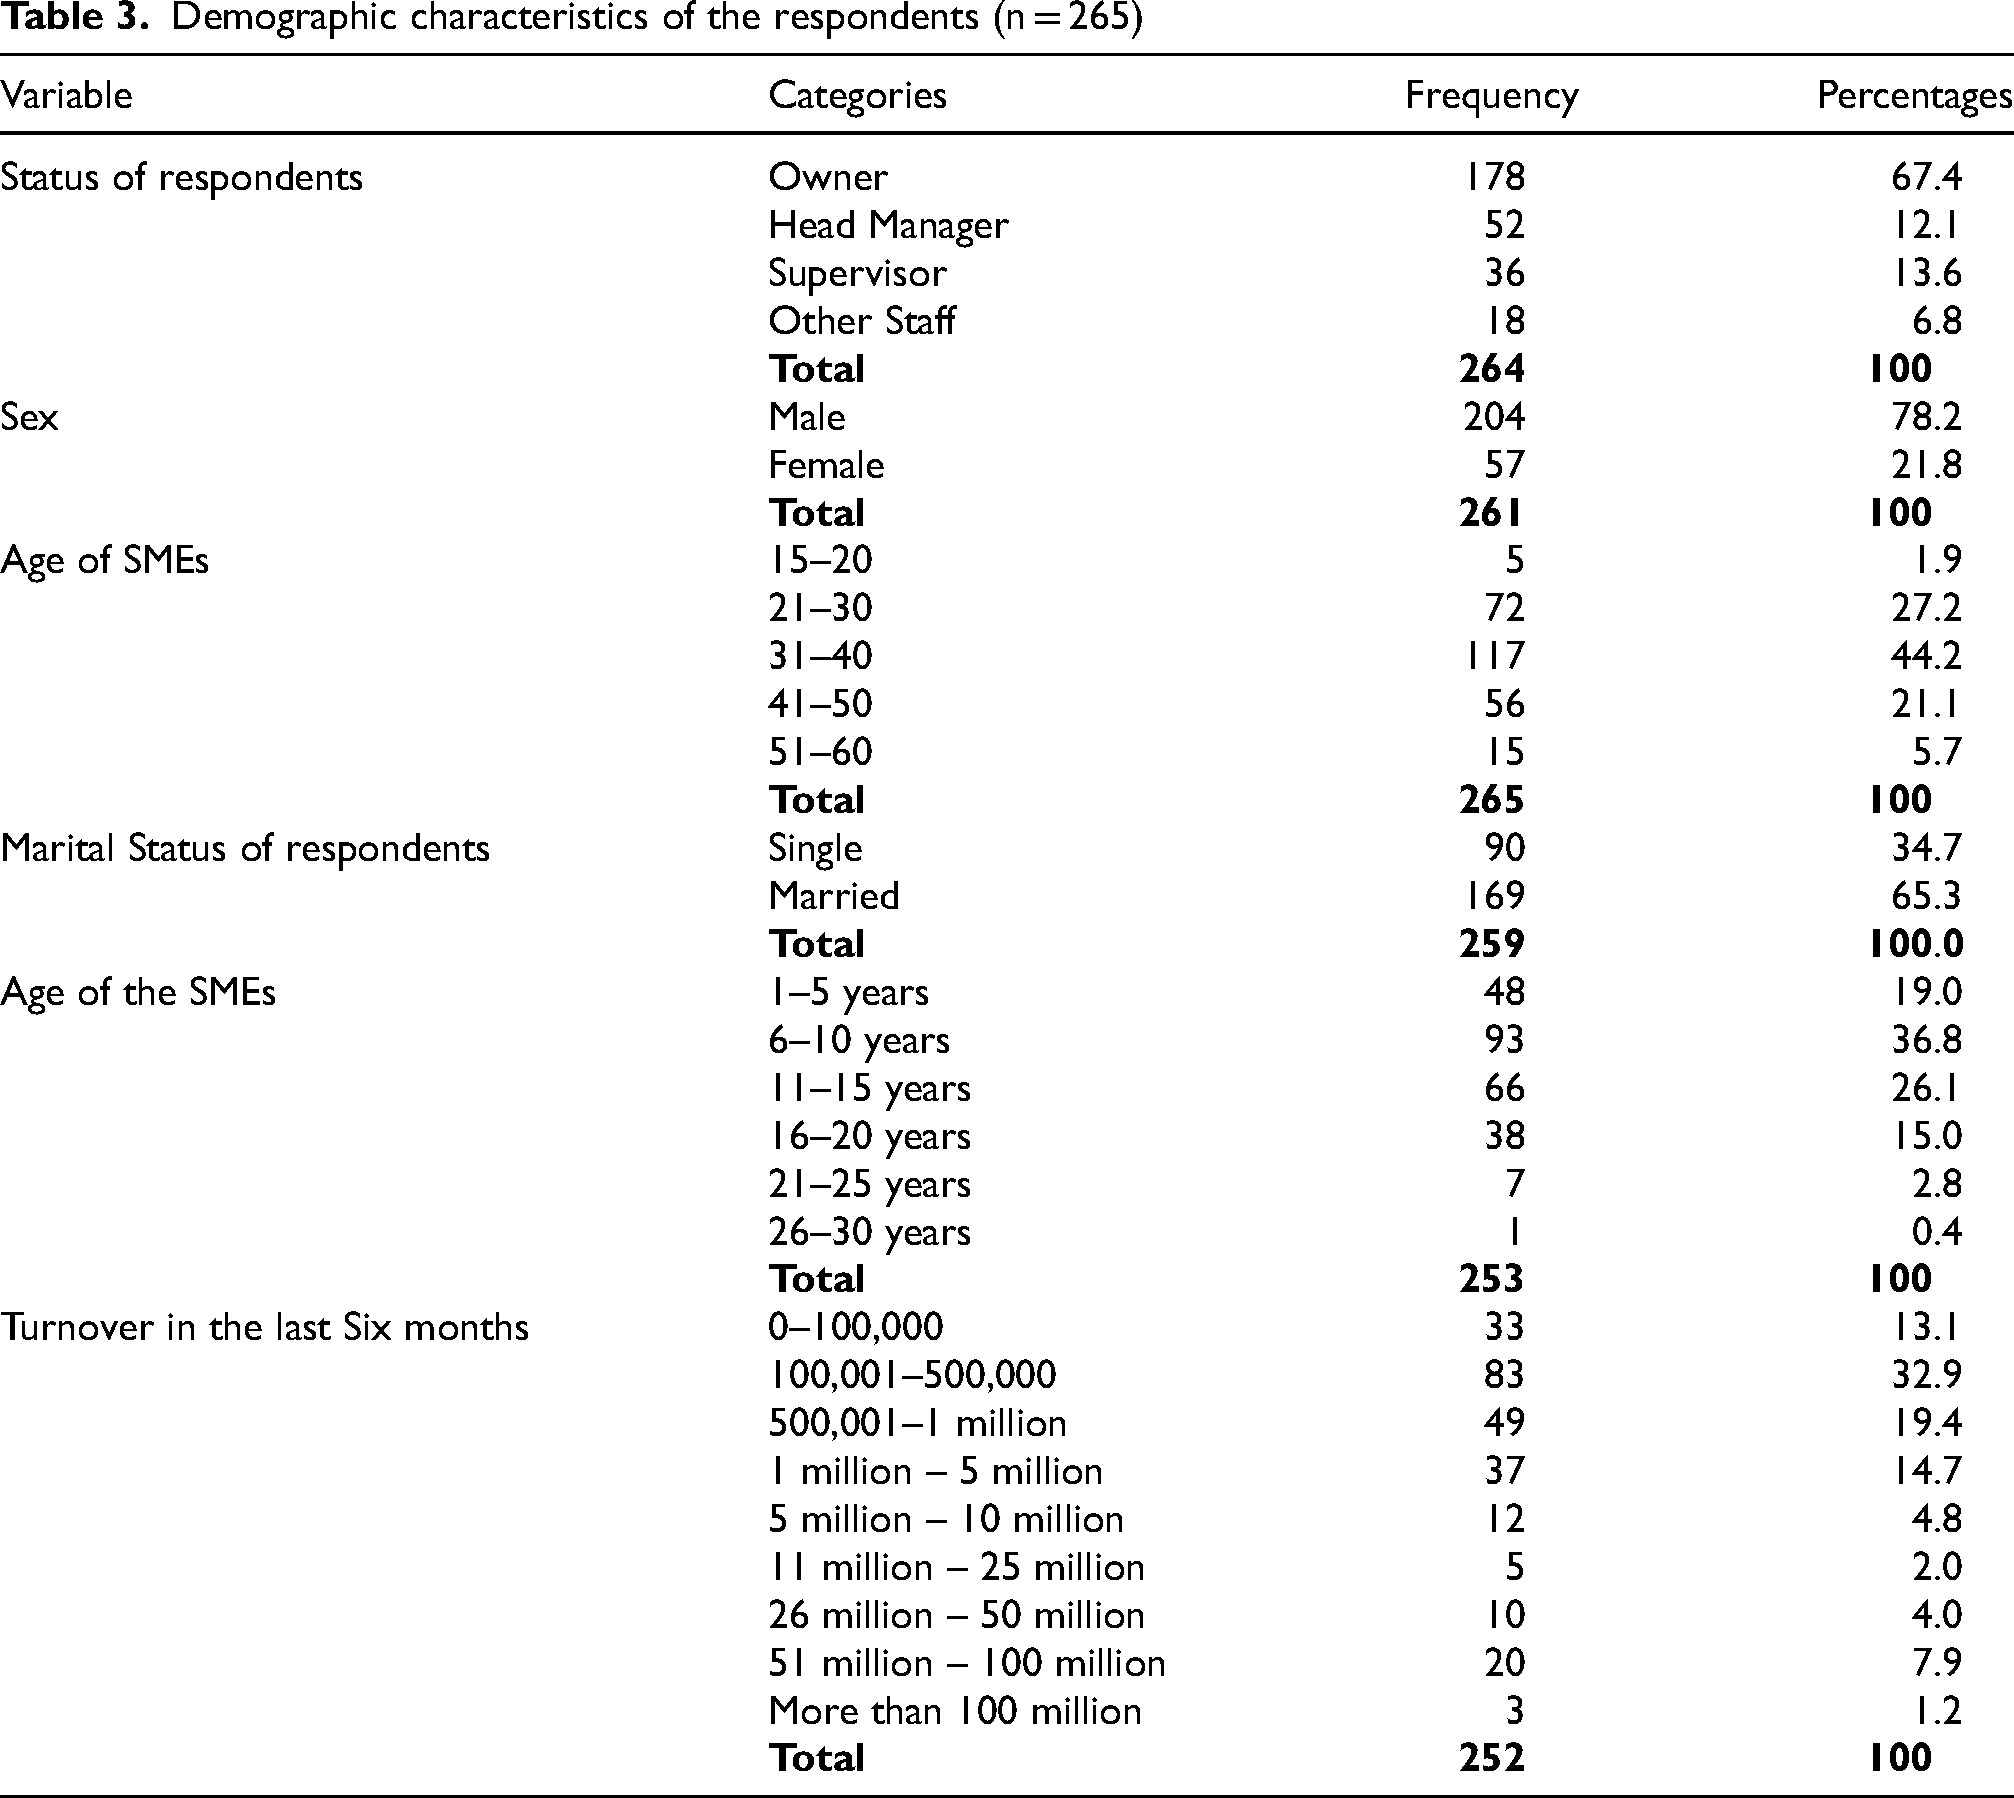
The age distribution shows about 44.2% of the respondents were between the ages 31–40. A little above one quarter of those who responded on behalf of the SMEs of the respondents fall between the ages 21–30, and 21.1% of the respondents were between the ages of 41–50. Those within the age bracket 51–60 make up 5.7% of the respondents and 1.9% constitutes those within 15–20. More than a quarter (35.2%) of the respondents had secondary education as their highest qualification, 5.6% had primary education, 15.9% of them had technical education qualifications, while only 9.6% had professional qualifications and nearly half (34%) of the respondents had university education. As Nigeria is grappling with the challenge of unemployment, both graduates and non-graduates have taken to different economic activities to earn a living. Table 3 shows further than 65.3% of the respondents were married, while 34.7% were single. More than half (36.8%) of the firms have existed between 6–10 years. A little above one quarter (26.1%) of the firms have existed between 11–15 years while 19% of the firms have existed between 1–5 years. About 15% of the firms have been existed between 16–20 years, 2.8% of the firms have existed between 21–25 years while one is between 26 to 30 years.
More than half (32.9%) of the firms generate between 101,000 and 500,000 thousand naira monthly, 19.4% of the firms generate between 501,000 and 1 million naira monthly, 14.7 of the firms generate between 1 and 5 million naira while 13.1% of the firms generate between 0 and 100,000 thousand naira monthly. About 7.9% of the firms generate between 51 and 100 million naira, 4.8% of the firms generate between 5 and 10 million naira, 4% of the firms generate between 26 and 50 million naira, 2% of the firms generate between 11 and 25 million naira and 1.2% of the firms generate more than 100 million naira.
Three-quarters (75.1%) of the firms had between 0 and 5 employees, while 19.6% of the firms had between 6 and 10 employees, 4.5% had between 11 and 15 employees, and only one firm each had between 16 and 20 employees and 26 and 30 employees, respectively.
Main activities of the SMEs
Table 4 shows that nearly all (92.5%) the SMEs engage in sales, while more than three-quarter of the ICT SMEs engage in maintenance/repairs. More than half (52.8%) of the SMEs engage in computer cloning and about half (49.4%) of the SMEs engage in installation services.
Main activities of ICT SMEs (n = 265)
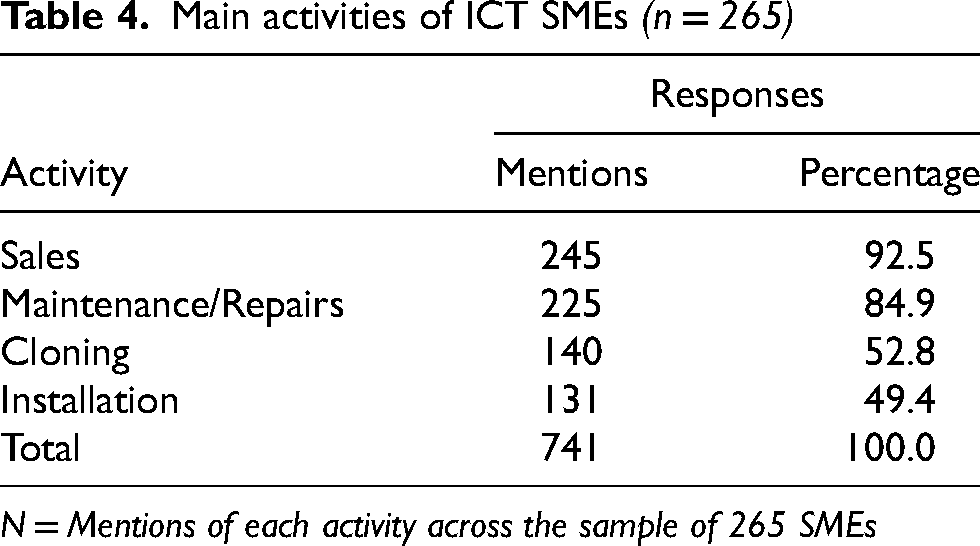
N = Mentions of each activity across the sample of 265 SMEs
Key elements of innovative behaviour of the ICT enterprises
The respondents were asked to rate their level of agreement or disagreement with various questionnaire items that were created to gauge the degree of each of the following targeted elements of innovative behaviour: innovation research, idea generation, innovation support, innovation diversity, and intention for innovation in order to determine the key components of the innovative behaviour of SMEs in Nigeria. 5 summarizes the responses.
Table 5 shows that almost all (95.8%) the firms agreed that they always create new ideas for current difficult issues. And more than three-quarters (86.1%) of the firms reported that they create new ideas for difficult issues that might emerge in the future especially with the use of internet and continuous practice. Participation in trainings, workshops and other capacity building programs also help the SMEs to improve in their work. Majority (89.1%) of the firms also agreed that they always generate original solutions for problems different from those of others.
Innovative behaviour of ICT SMEs in Lagos
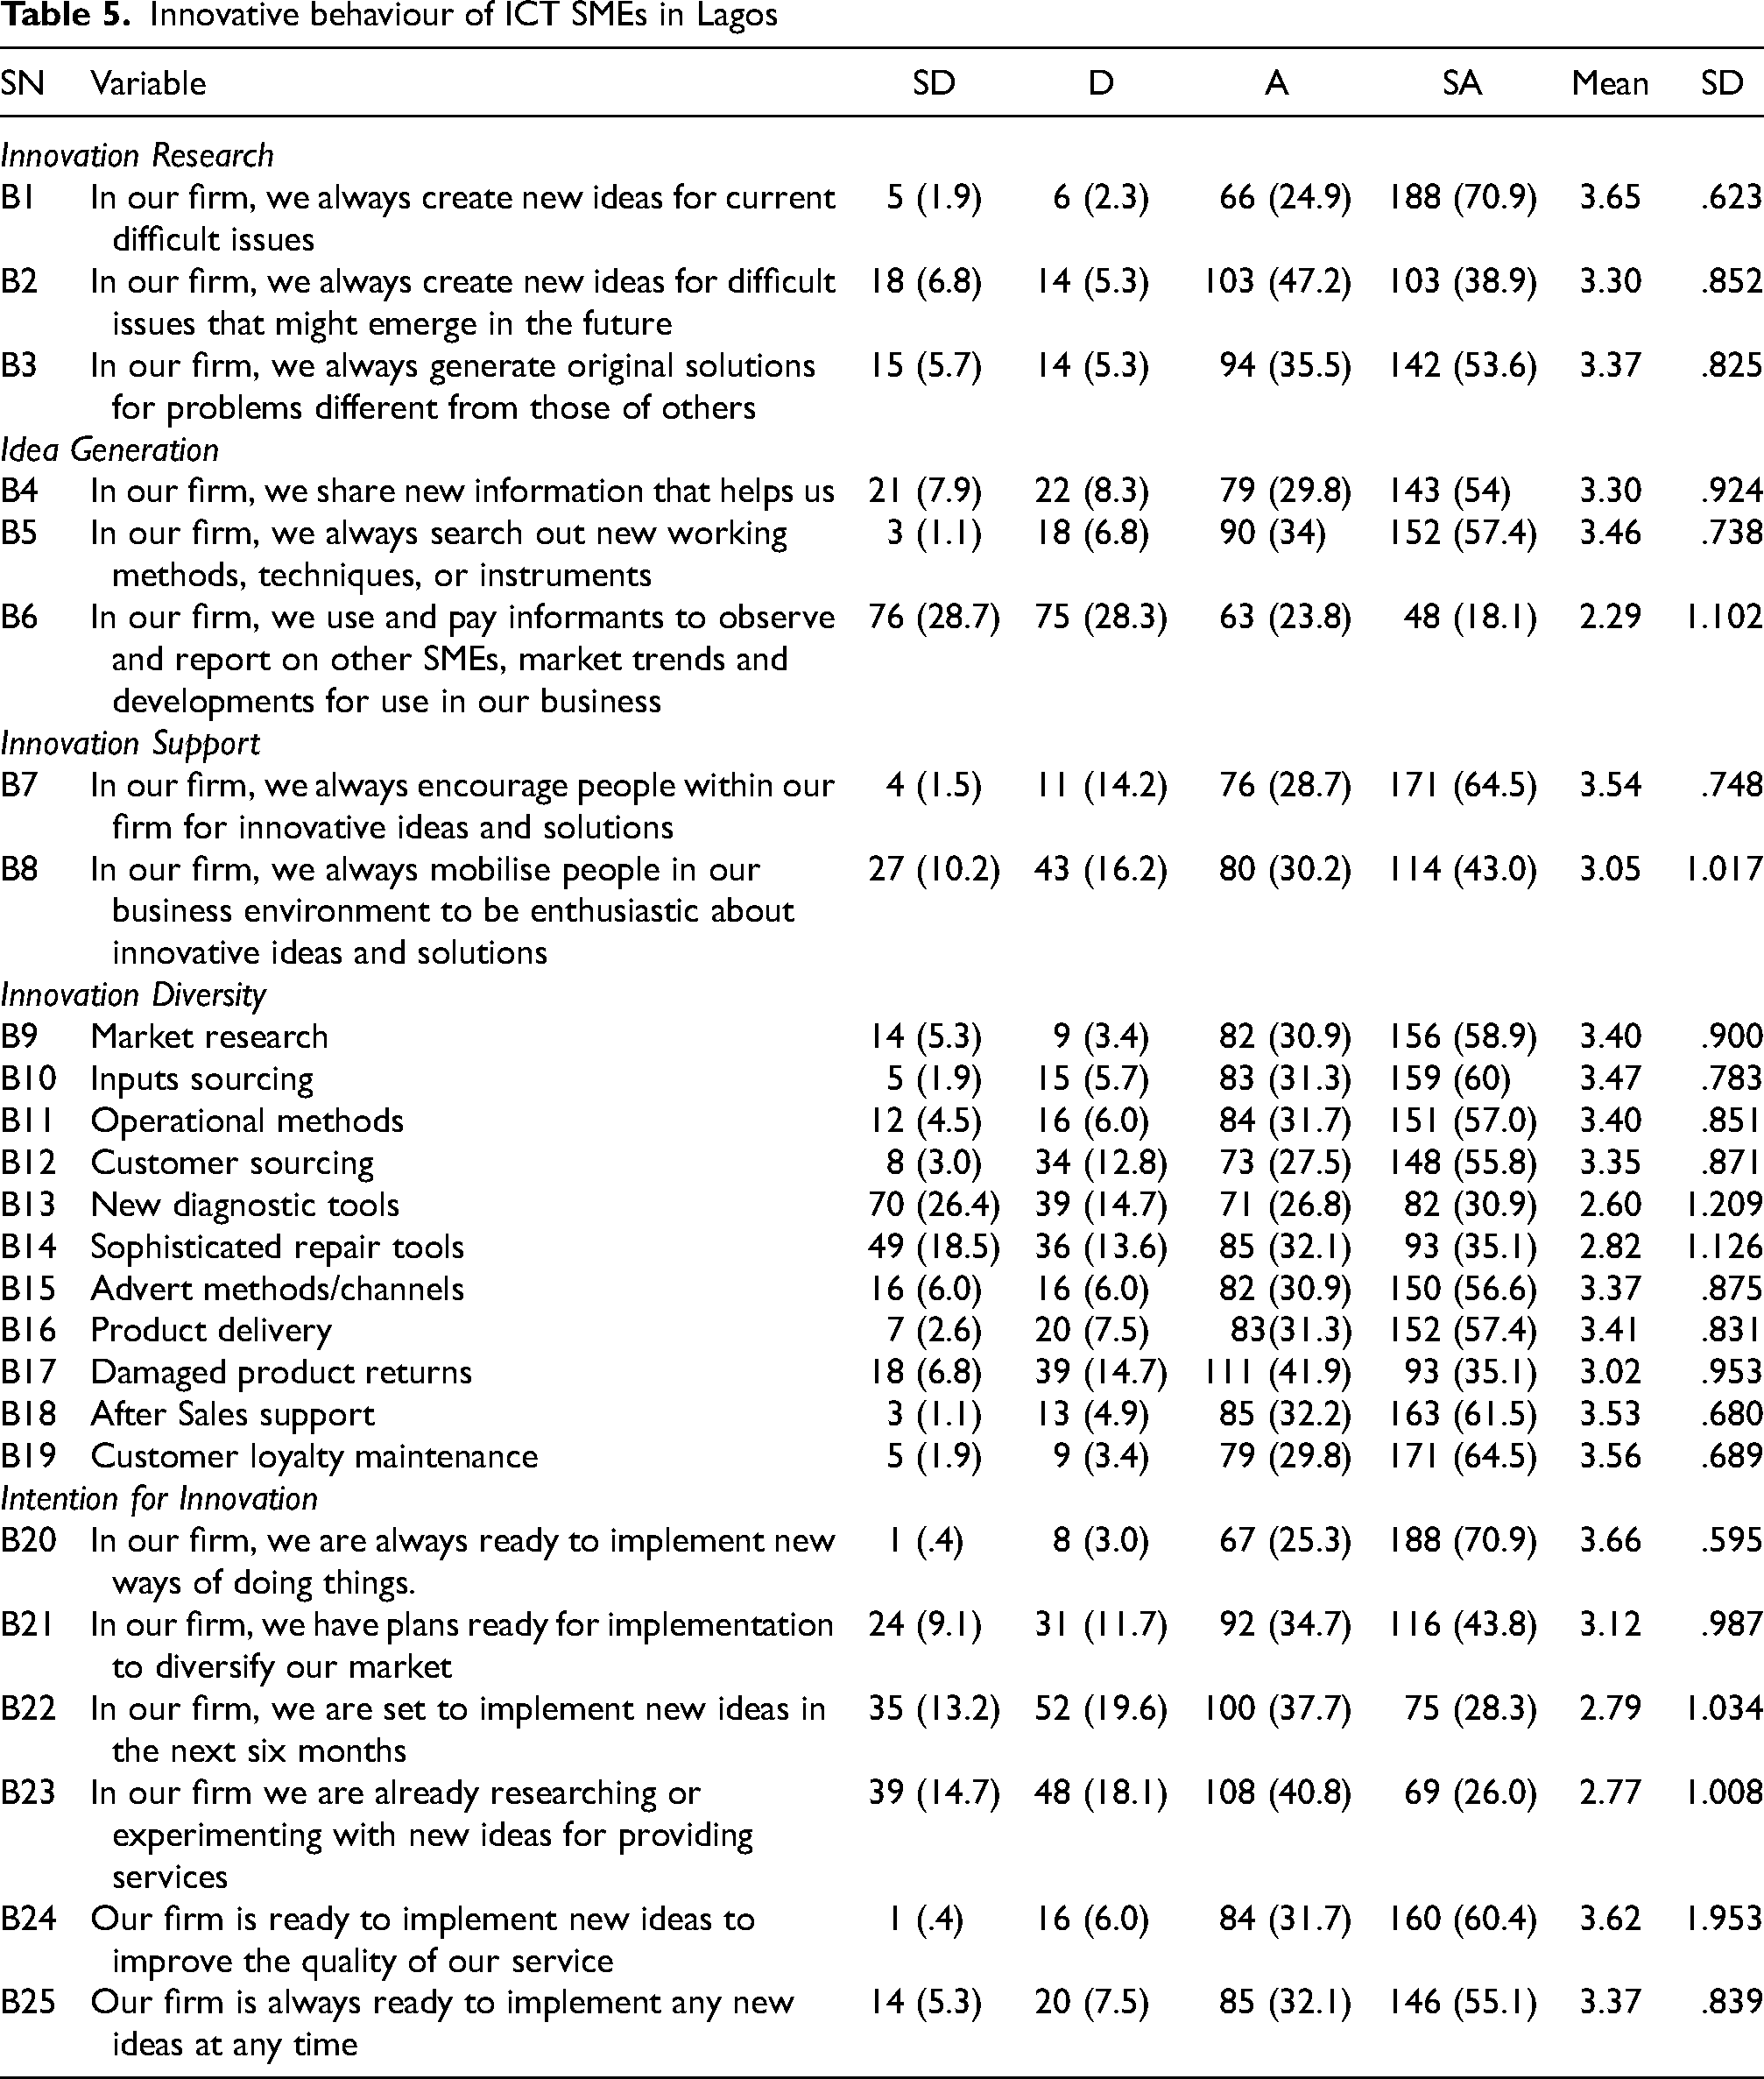
More than four-fifths (83.8%) of the firms agreed that they always search for new ways of working, techniques, or instruments, knowledge on and use of which they mostly share internally (91.4%) to help their own employees (Table 6). But almost half (41.9%) of the firms disagreed that they use and pay informants to observe and report information on other SMEs, market trends and developments for use in their business.
Elements of innovative culture of ICT SMEs in Lagos
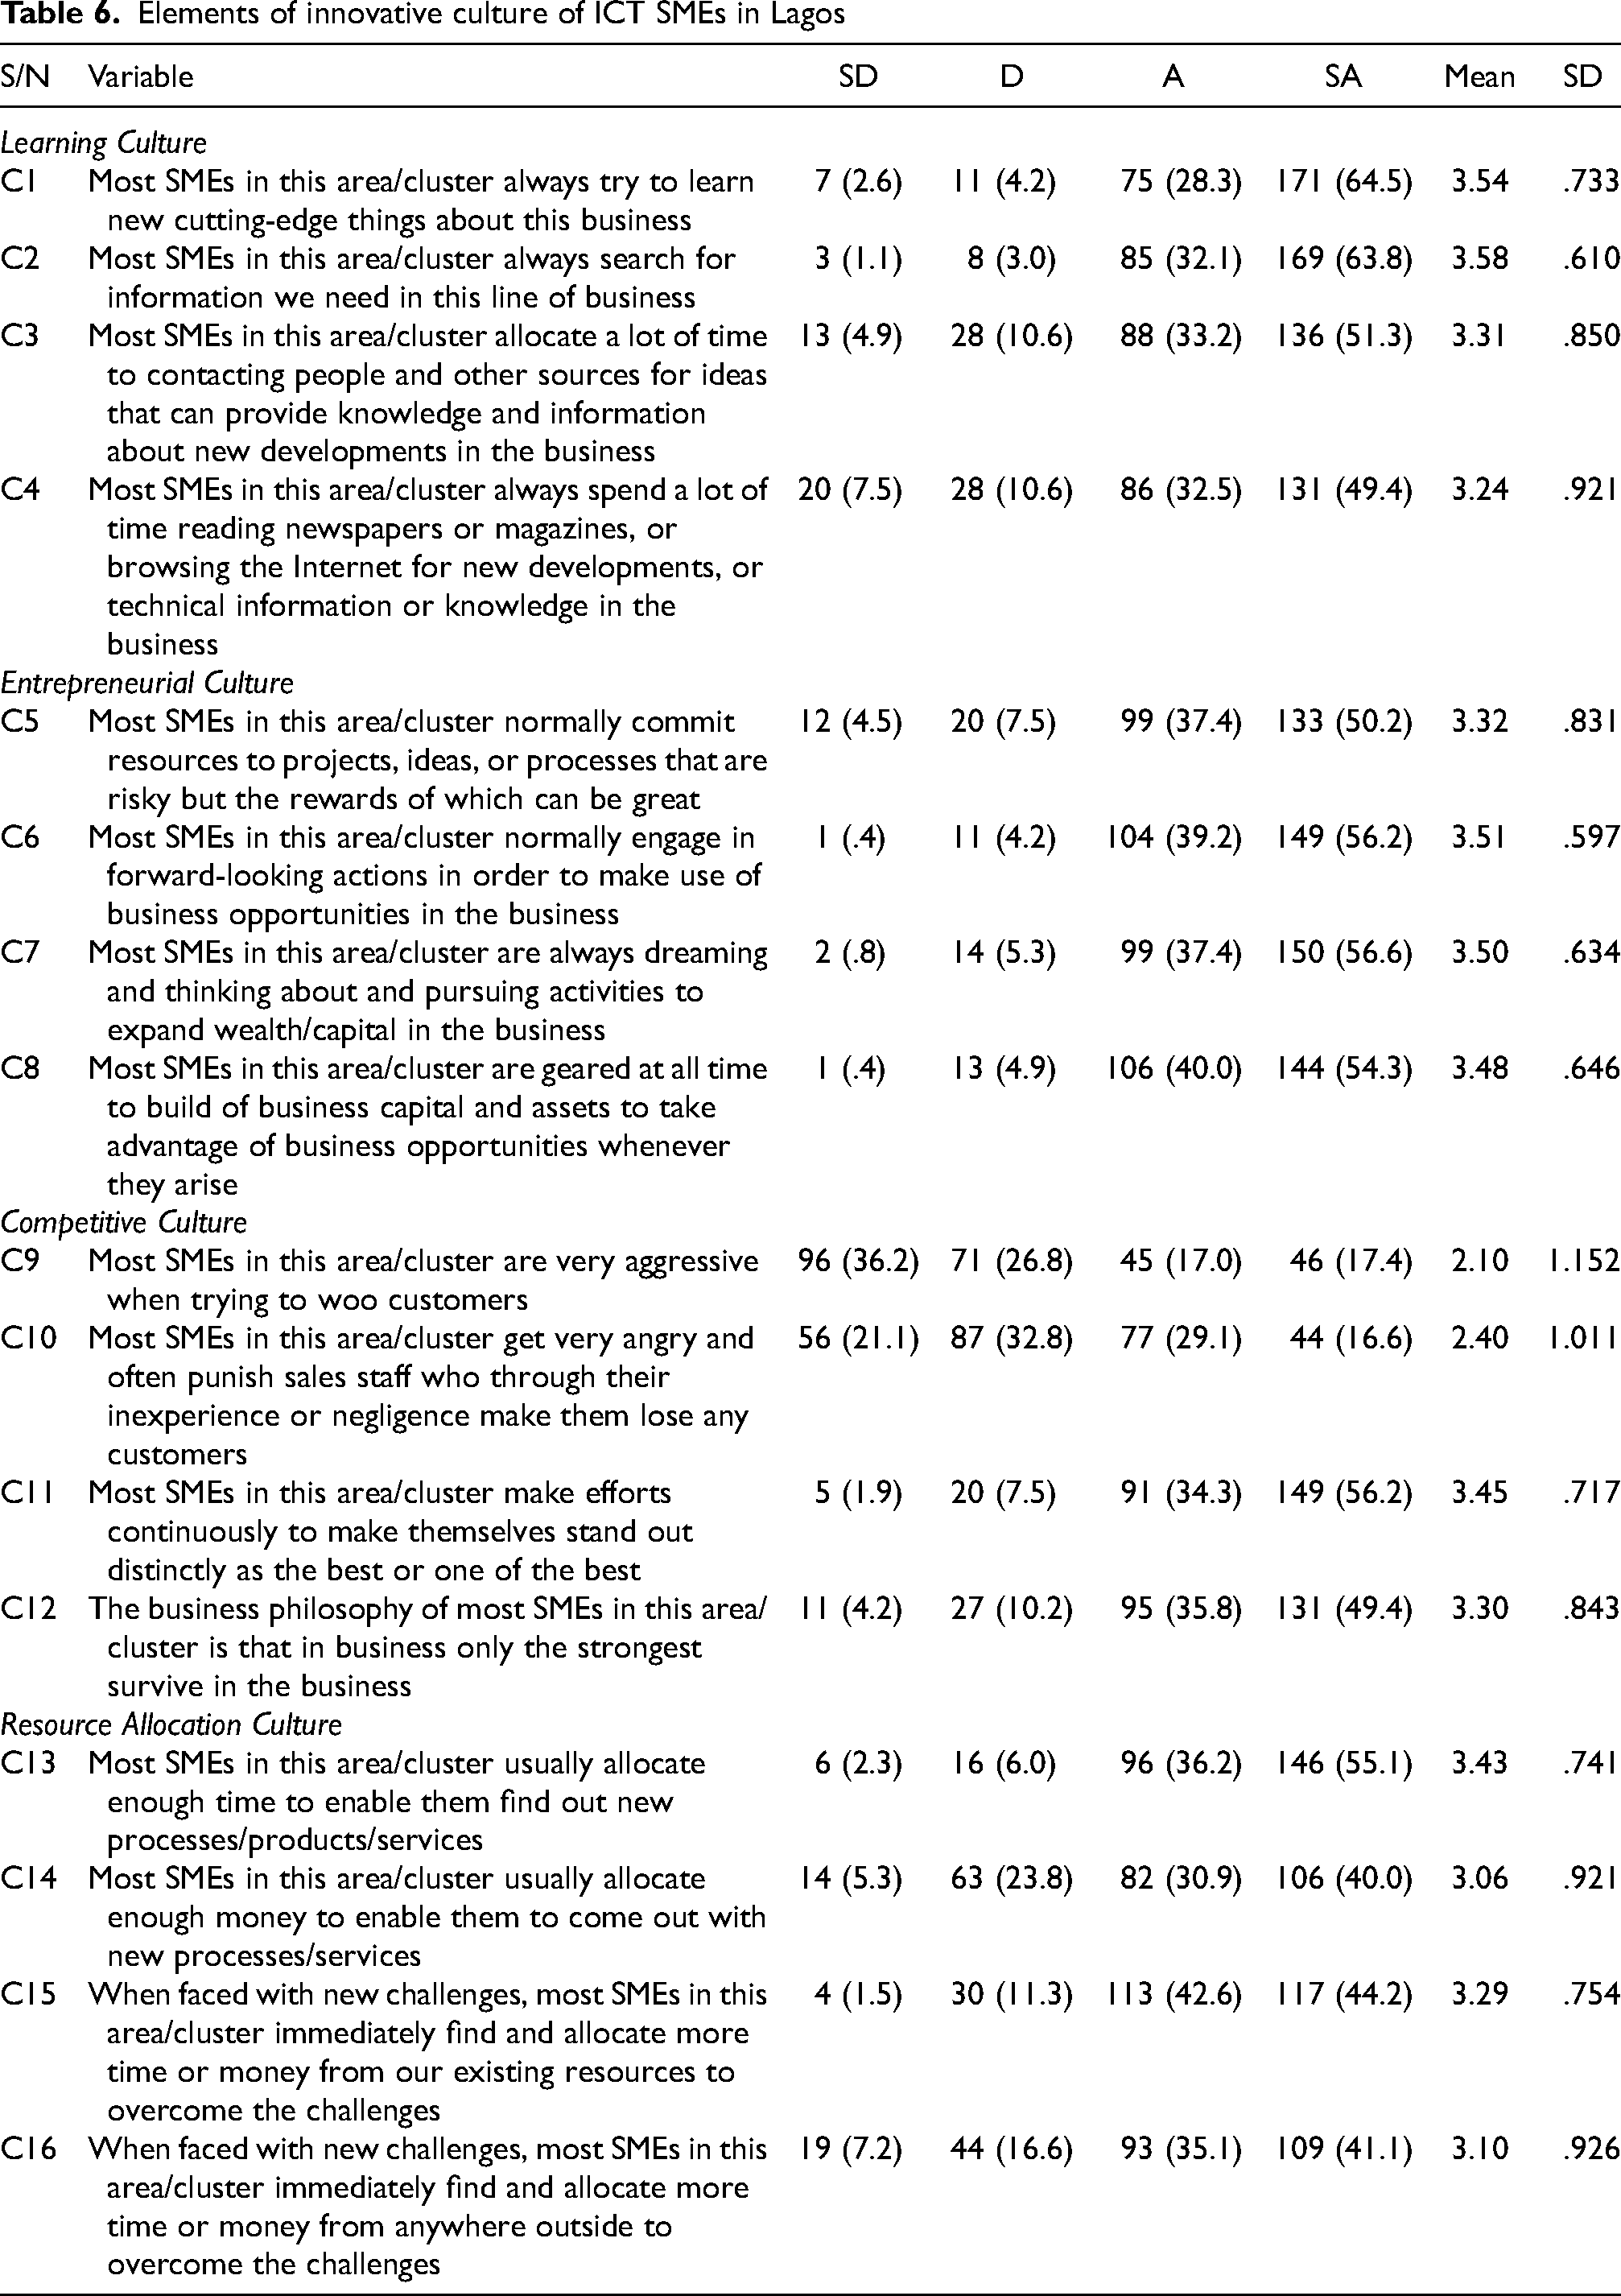
Almost (93.2%) all the firms agreed that they always encourage people within their firm for innovative ideas and solutions (Table 7). This indicate that the SMEs offer monetary rewards as a way of encouraging and supporting the workers to come up with ideas. Similarly, almost four-fifths (73.2%) of the firms admitted that they always mobilise people in their business environment to be enthusiastic about innovative ideas and solutions.
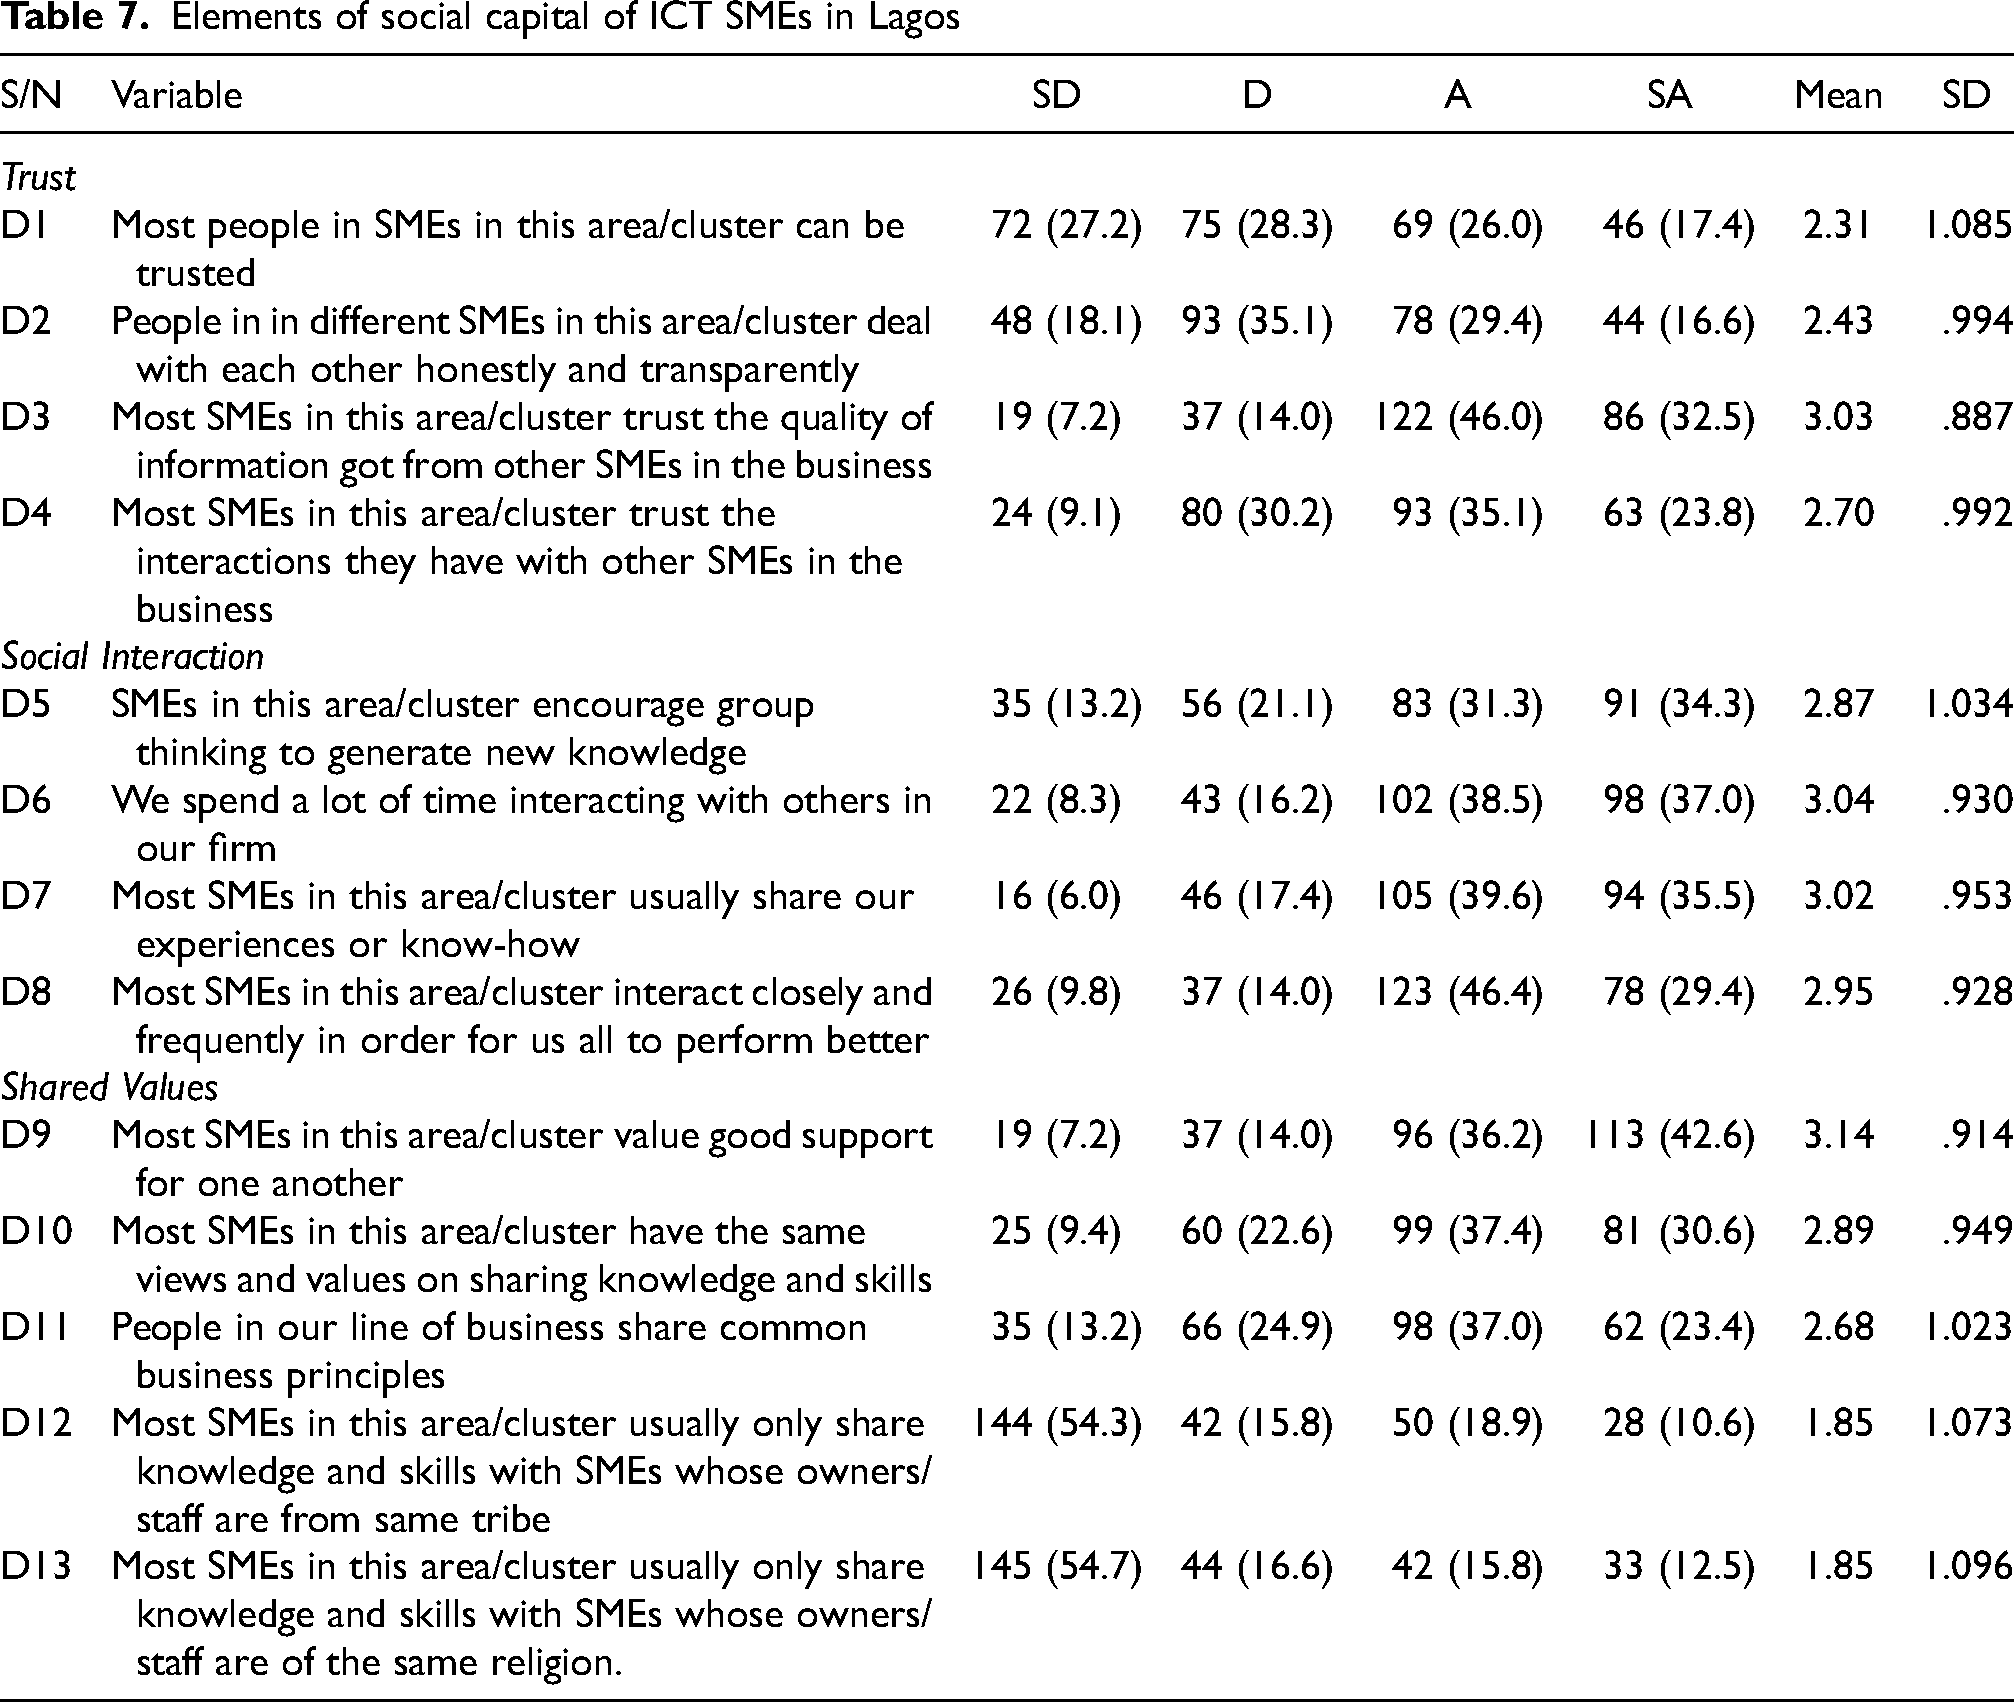
Elements of social capital of ICT SMEs in Lagos
In terms of innovation diversity, almost (96.2%) all the firms agreed that they are always ready to implement new ways of doing things, 94.3% use sophisticated repair tools and 93.7% use advert methods/channels as shown in Table 5. Similarly, almost all (92.1%) the firms agreed that they are already researching or experimenting with new ideas for providing services. Majorities of the firms agreed that they pay considerable attention to product delivery (91.3%), customer sourcing (89.8%), market research (88.7%), and operational methods (88.7%). More than two-thirds (87.5%) of the firms engage in after-sales support, almost nine-tenths (87.2%) agreed that they are set to implement new ideas in the next six months and 83.3% of them engage in inputs sourcing.
More than three-quarters (78.5%) agreed that they have plans ready for implementation to diversify their market, 77% of the firms use new diagnostic tools and 67.2% pay attention to damaged product returns. Two-thirds (66.8%) agreed that they are always ready to implement any new ideas at any time and slightly less than that (66%) are ready to implement new ideas to improve the quality of their service. 57.7% of the firms engage in customer loyalty maintenance.
Learning culture, entrepreneurial culture, competitive culture, and resource allocation culture of the enterprises
A number of critical dimensions to innovative culture were identified during the review of relevant literature for this research. To identify the crucial dimensions of innovative culture of ICT SMEs in Lagos, the following dimensions of creative culture found in this study were presented to the respondents, who were asked to indicate their level of agreement or disagreement with each statement: learning culture, entrepreneurial culture, competitive culture, and resource allocation culture.
In terms of learning culture, Table 6 reveals that, nearly (92.8%) all the firms agreed that most SMEs in their area/cluster always try to learn new cutting-edge things about their business and the same majority (95.9%) of the firms agreed that most SMEs in their area/cluster always search for information they need in their line of business, often through on-the-job solving of emerging new problem in their tasks. The SMEs also revealed how they source for technical information and described the types of persons/institutions they get their information from.
The internet has proven to be a useful resource in their operations. More than two-thirds (84.5%) of the firms agreed that most SMEs in their area/cluster allocate a lot of time and money to acquiring tools that make their works tasks easier. Also, majority (81.9%) of the firms, agreed that most SMEs in their area/cluster usually spend a lot of time reading newspapers or magazines, or browsing the Internet for new developments, or technical information or knowledge in the business.
For the entrepreneurial culture, Table 6 shows that more than three-quarters (87.6%) of the firms agreed that most SMEs in their area/cluster are always dreaming and thinking about and pursuing activities to expand their wealth/capital. Almost all (95.4%) the firms agreed that most SMEs in their area/cluster are always geared to building business capital and assets to take advantage of business opportunities whenever they arise. Similarly, Table 6 shows that almost (94%) of the firms agreed that most SMEs in their area/cluster normally commit resources to projects, ideas, or processes that are risky but the rewards of which can be great.
The SMEs admitted taking risks and getting the needed support in introducing new products and services. Similarly, almost all (94.3%) of the firms reported that most SMEs in their area/cluster normally engage in forward-looking actions to make use of business opportunities in the business.
In terms of competitive culture (Table 6), slightly above a quarter (34.4%) agreed that most SMEs in their area/cluster make efforts continuously to make themselves stand out distinctly as the best or one of the best. Furthermore, almost half (45.7%) of the firms reported that the business philosophy of most SMEs in their area/cluster is that only the strongest survive in the business. Data also reveals that majority (90.5%) of the firms reported that most SMEs in their area/cluster are not very aggressive when trying to woo customers. Four-fifths (85.2%) of the firms agreed that most SMEs in their area/cluster get very angry and often punish sales staff who through their inexperience or negligence make them lose any customers.
For resource allocation culture, data shows that most (91.3%) of the firms agreed that most SMEs in their area/cluster usually allocate enough money to enable them to come out with new processes/services. Similarly, two-thirds (70.9%) of the firms agreed that most SMEs in their area/cluster usually allocate enough time to enable them find out new processes/ products/services. Four-fifths (86.8%) of the firms agreed that when faced with new challenges, most SMEs in their area/cluster immediately find and allocate more time or money from their existing resources to overcome the challenges. Similarly, two-thirds (76.2%) of the firms reported that when faced with new challenges, most SMEs in their area/cluster immediately find and allocate more time or money from anywhere outside to overcome the challenges.
Level of trust, social interaction, and shared values among the enterprises
In determining the social capital of the SMEs, several potentially key elements were identified during the review of relevant literatures in Chapter 2. To identify the key elements of social capital of SMEs in Lagos, the participants indicated their level of agreement or disagreement to the statements relating to the following targeted elements of social capital: trust, social interaction, and shared values.
For the trust level of the SMEs, Table 7 shows that almost half (43.4%) of the firms agreed that most SMEs in their area/cluster trust the interactions they have with other SMEs in the business. Also, nearly half (46%) of the firms reported that most SMEs in their area/cluster trust the quality of information they get from other SMEs in the business. Similarly, nearly four-fifths (78.5%) of the firms agreed that people in different SMEs in their area/cluster deal with each other honestly and transparently. More than half (58.9%) of the firms agreed that most people in the SMEs in their area/cluster can be trusted.
In terms of social interaction, Table 7 reveals that nearly two-thirds (65.6%) of the firms reported that most SMEs in their area/cluster interact closely and frequently for them to perform better. Similarly, more than two-thirds (75.5%) of the firms agreed that most SMEs in their area/cluster usually share their experiences or know-how. Also, more than two-thirds (75.1%) reported that they spend a lot of time interacting with others in their firms. Two-thirds (75.8%) of the firms agreed that SMEs in their area/cluster encourage group thinking to generate new knowledge.
For shared values among the SMEs, more than two-thirds (78.8%) of the firms reported that people in their line of business share common business principles (Table 7). Also, more than two-thirds (68%) of the firms agreed that most SMEs in their area/cluster have the same views and values on sharing knowledge and skills. More than half (60.4%) of the firms agreed that most SMEs in their area/cluster value good support for one another. Slightly above one-quarter (29.5%) of the firms agreed that most SMEs in their area/cluster usually only share knowledge and skills with SMEs whose owners/staff are of the same religion. Also, slightly above one-quarter (28.3%) of the firms agreed that most SMEs in their area/cluster usually only share knowledge and skills with SMEs whose owners/staff are from same tribe.
Performance of the small and medium ICT enterprises
From the review of relevant literatures, several potentially key indicators of performance were identified. To identify the key indicators of performance of SMEs in Lagos, the respondents indicated their level disagreement or agreement on how their efforts in the last few years, in thinking about, obtaining, sharing, and using new ideas in their firms have helped them in the different areas. Table 8 shows that majority of the firms reported that their efforts in thinking about, obtaining, sharing, and using new ideas in their firms have helped them in having higher sale prices for their services (87.2%), reducing cost of how the firms sell their services to customers (97%) and increasing size of their business (98.5%).
Performance of ICT SMEs in Lagos
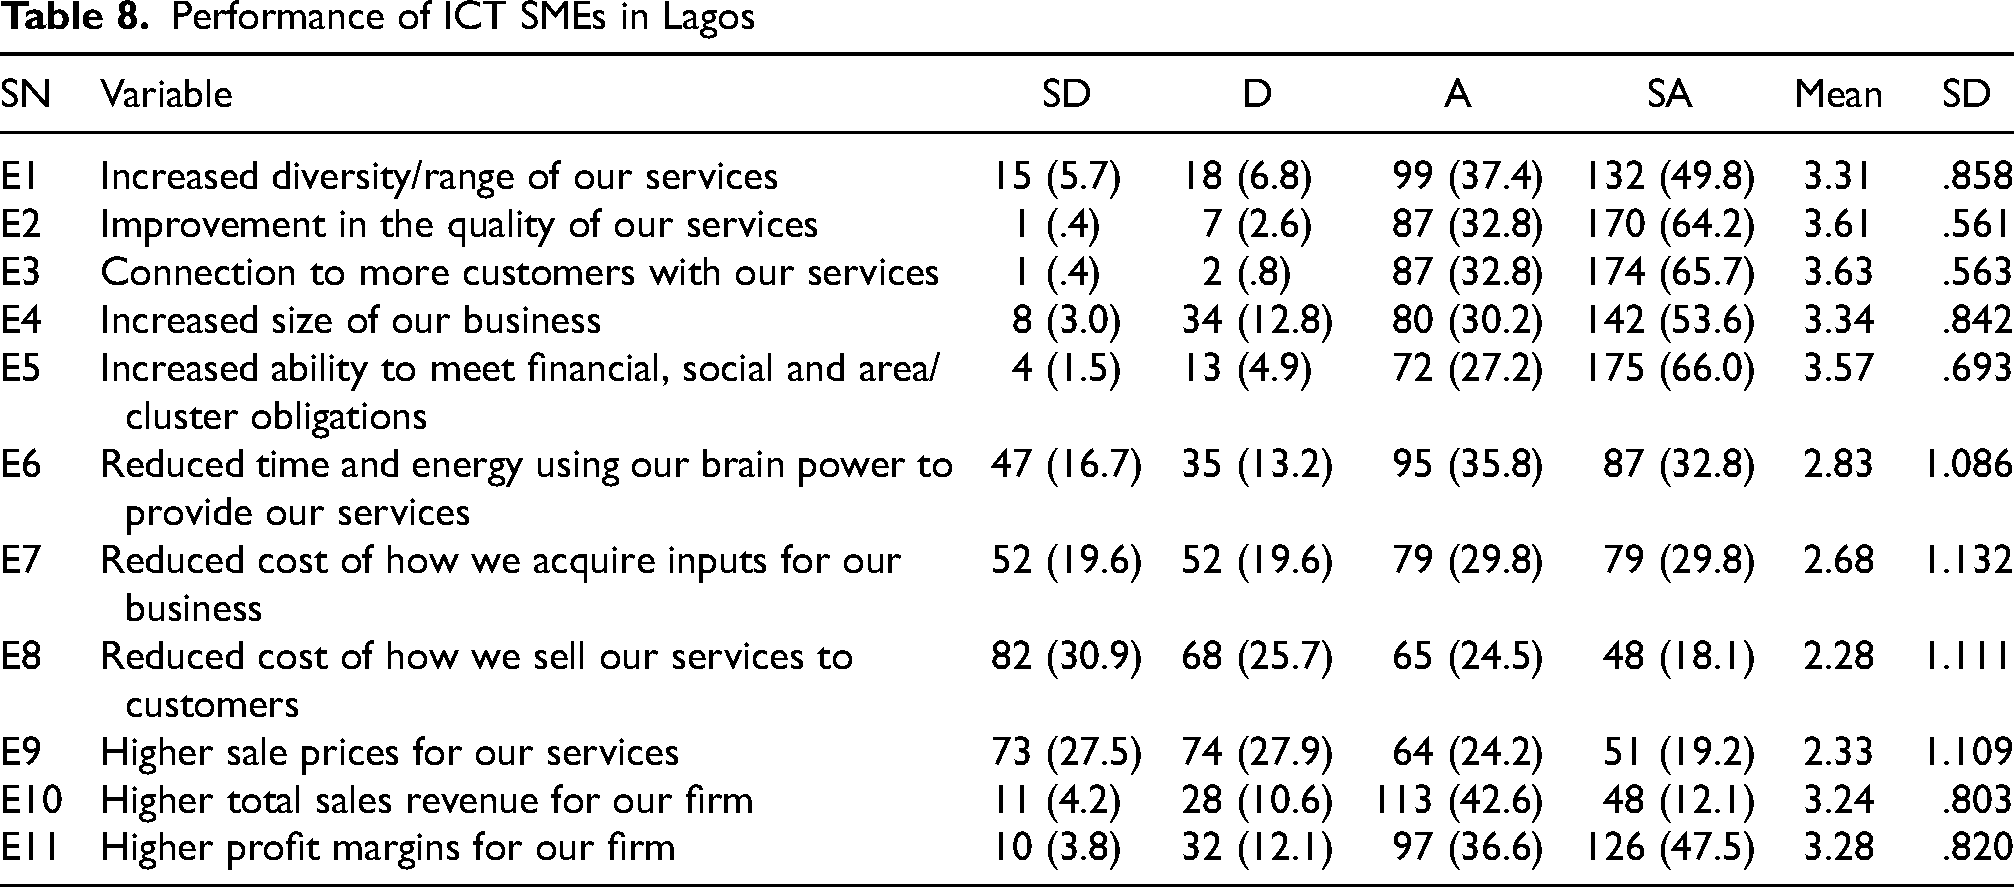
Also, most of the firms agreed that their efforts have ensured connection to more customers with their services (83.8%), increased ability to meet financial, social and area/cluster obligations (93.2%) and increased diversity/range of their business (68.6%). Their efforts have also ensured reduced cost of how the firms acquire inputs in their business (59.6%), higher total sales revenue (42.6%) and higher profit margins for the firms (43.4%). More than half of the firms agreed that their efforts have helped in reducing time and energy using their brain power to provide services (54.7%) and improvement in the quality of their services (84.1%).
Testing the hypotheses
The first activity is to prepare the data for statistical analysis through data reduction.
Data reduction using principal component analysis
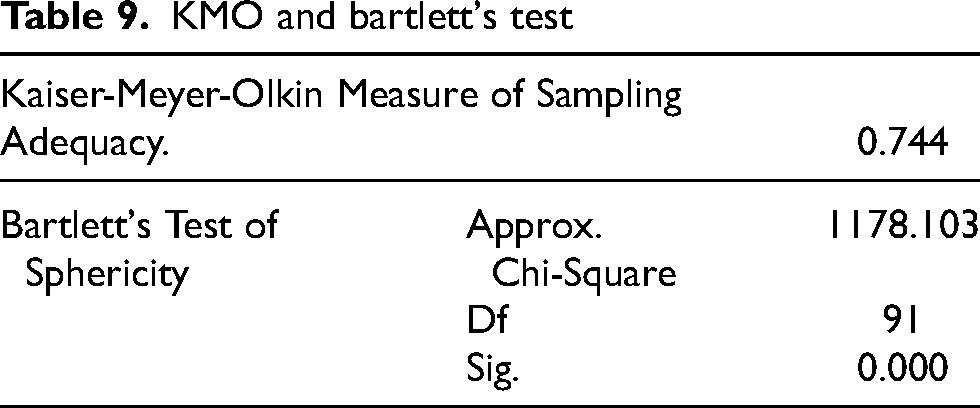
Table 9 demonstrates that the 74.4% Kaiser-Meyer-Olkin sample adequacy test accounted for was greater than the 60% cutoff suggested by Hair et al. (2010). The results of Bartlett's test, which indicated that the items were suitable factors, were significant (x2 = 1178.103, df = 91, p = 0.000).
KMO and bartlett's test
Loadings
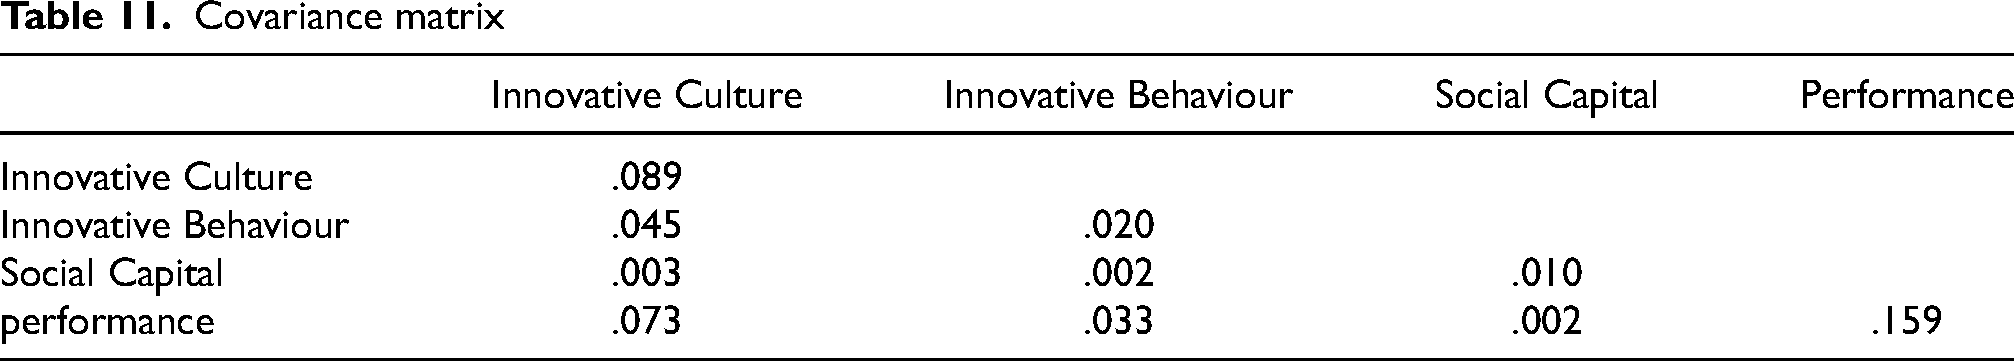
Table 10 shows that fourteen items loaded on four factors (constructs). All the items loadings were >0.50 ranging from 0.70 to 0.88. The extracted factors accounted for 65.4% of the total variance and their eigenvalues ranged from 1.393 to 3.229 while Table 11 shows the covariance matrix.
Rotated component matrix
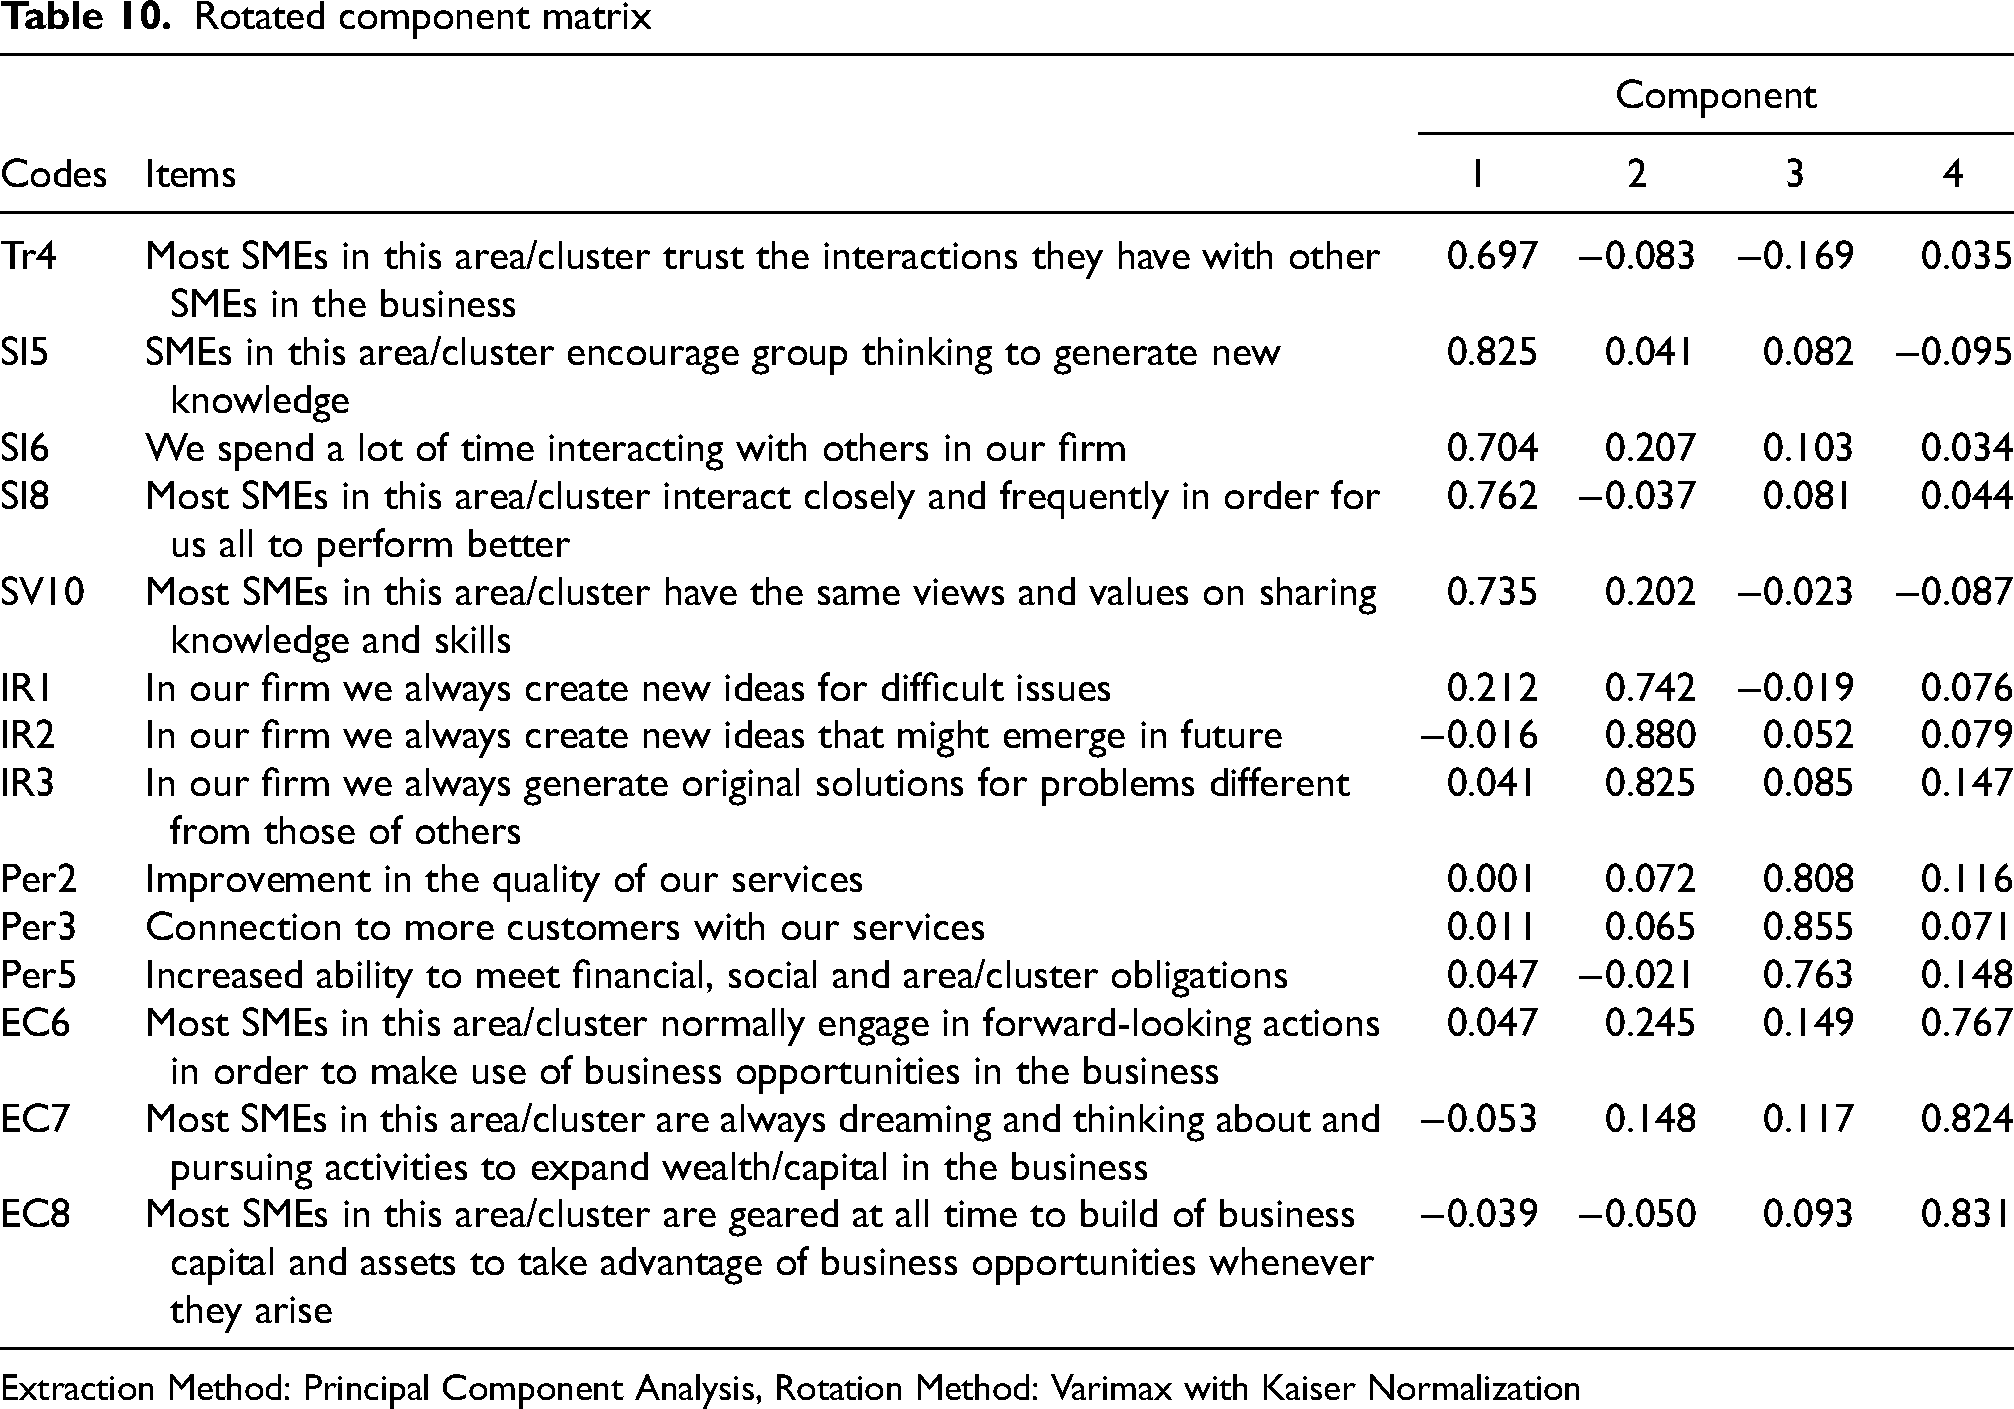
Extraction Method: Principal Component Analysis, Rotation Method: Varimax with Kaiser Normalization
Covariance matrix
Measurement model assessment
Pooled-CFA for three latent constructs was employed in this study. Figure 2 shows the CFA Hierarchical model, Figure 3 shows the CFA model. Model indices while Figure 4 shows the result of Pooled CFA. The model consists of one First-Order construct: Performance, and three Second-Order Constructs, which are: (i) Social Capital, (ii) Innovative Behaviour, and (iii) Innovative Culture.
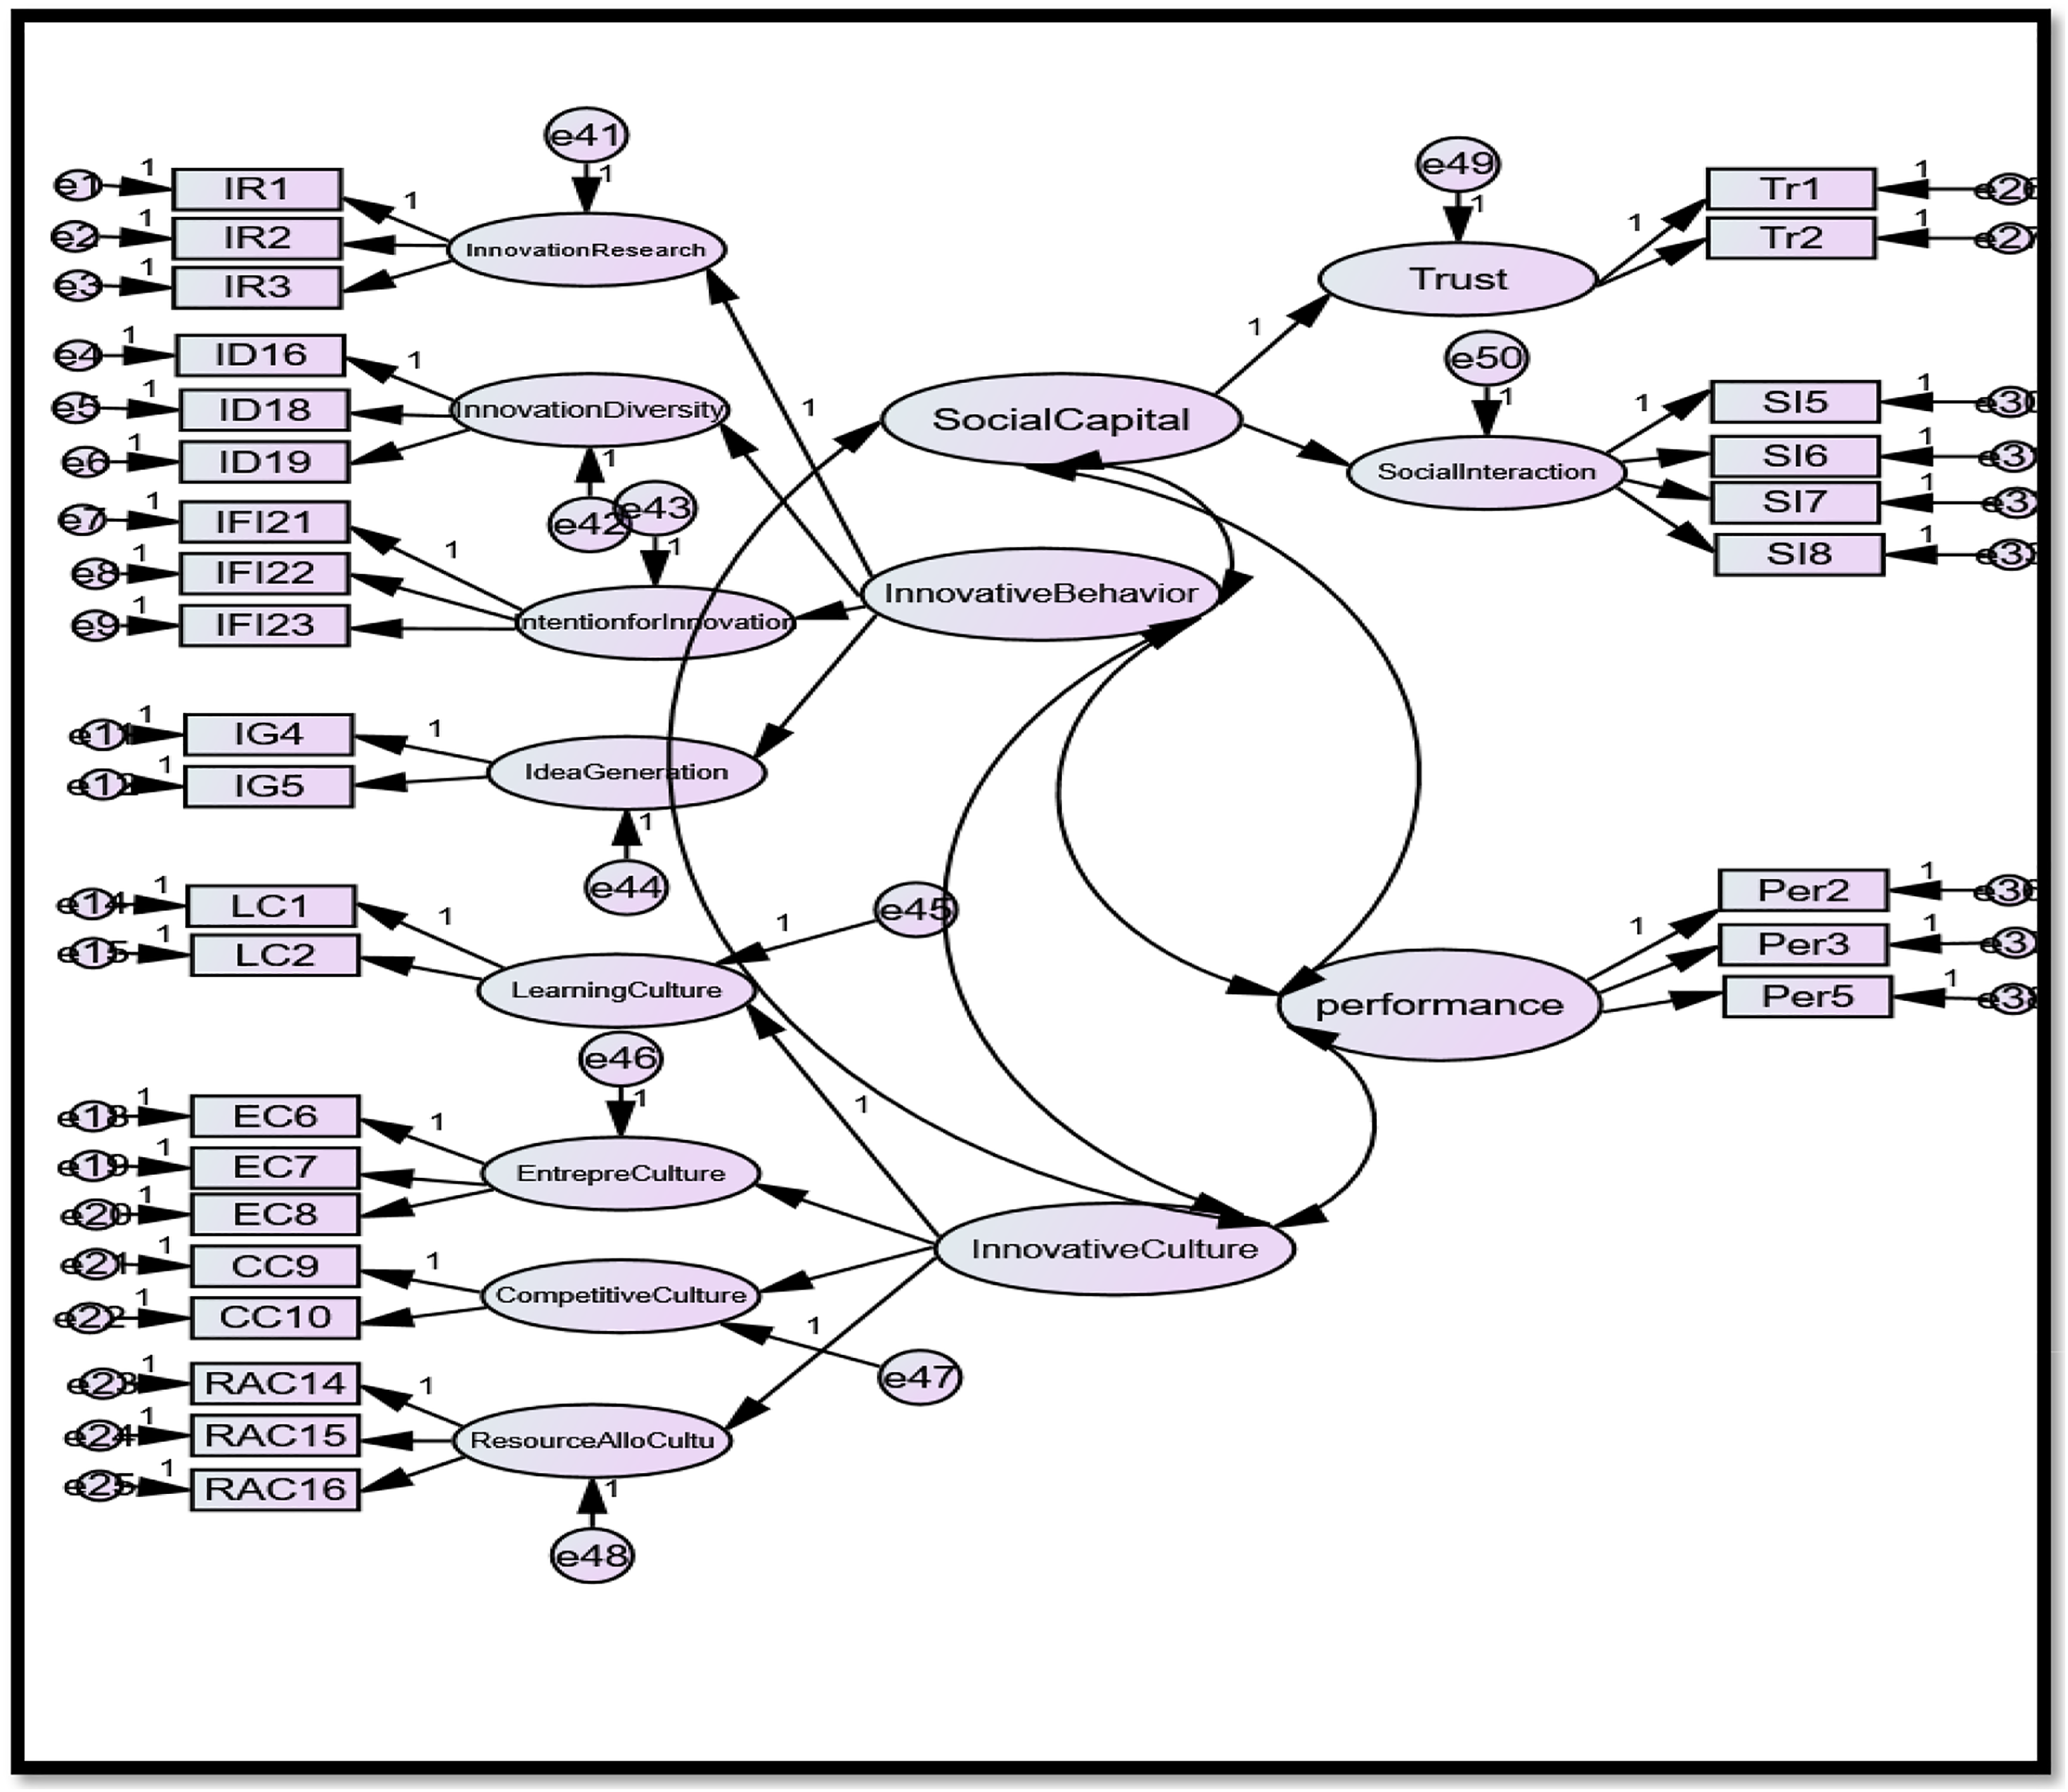
CFA Hierarchical model.
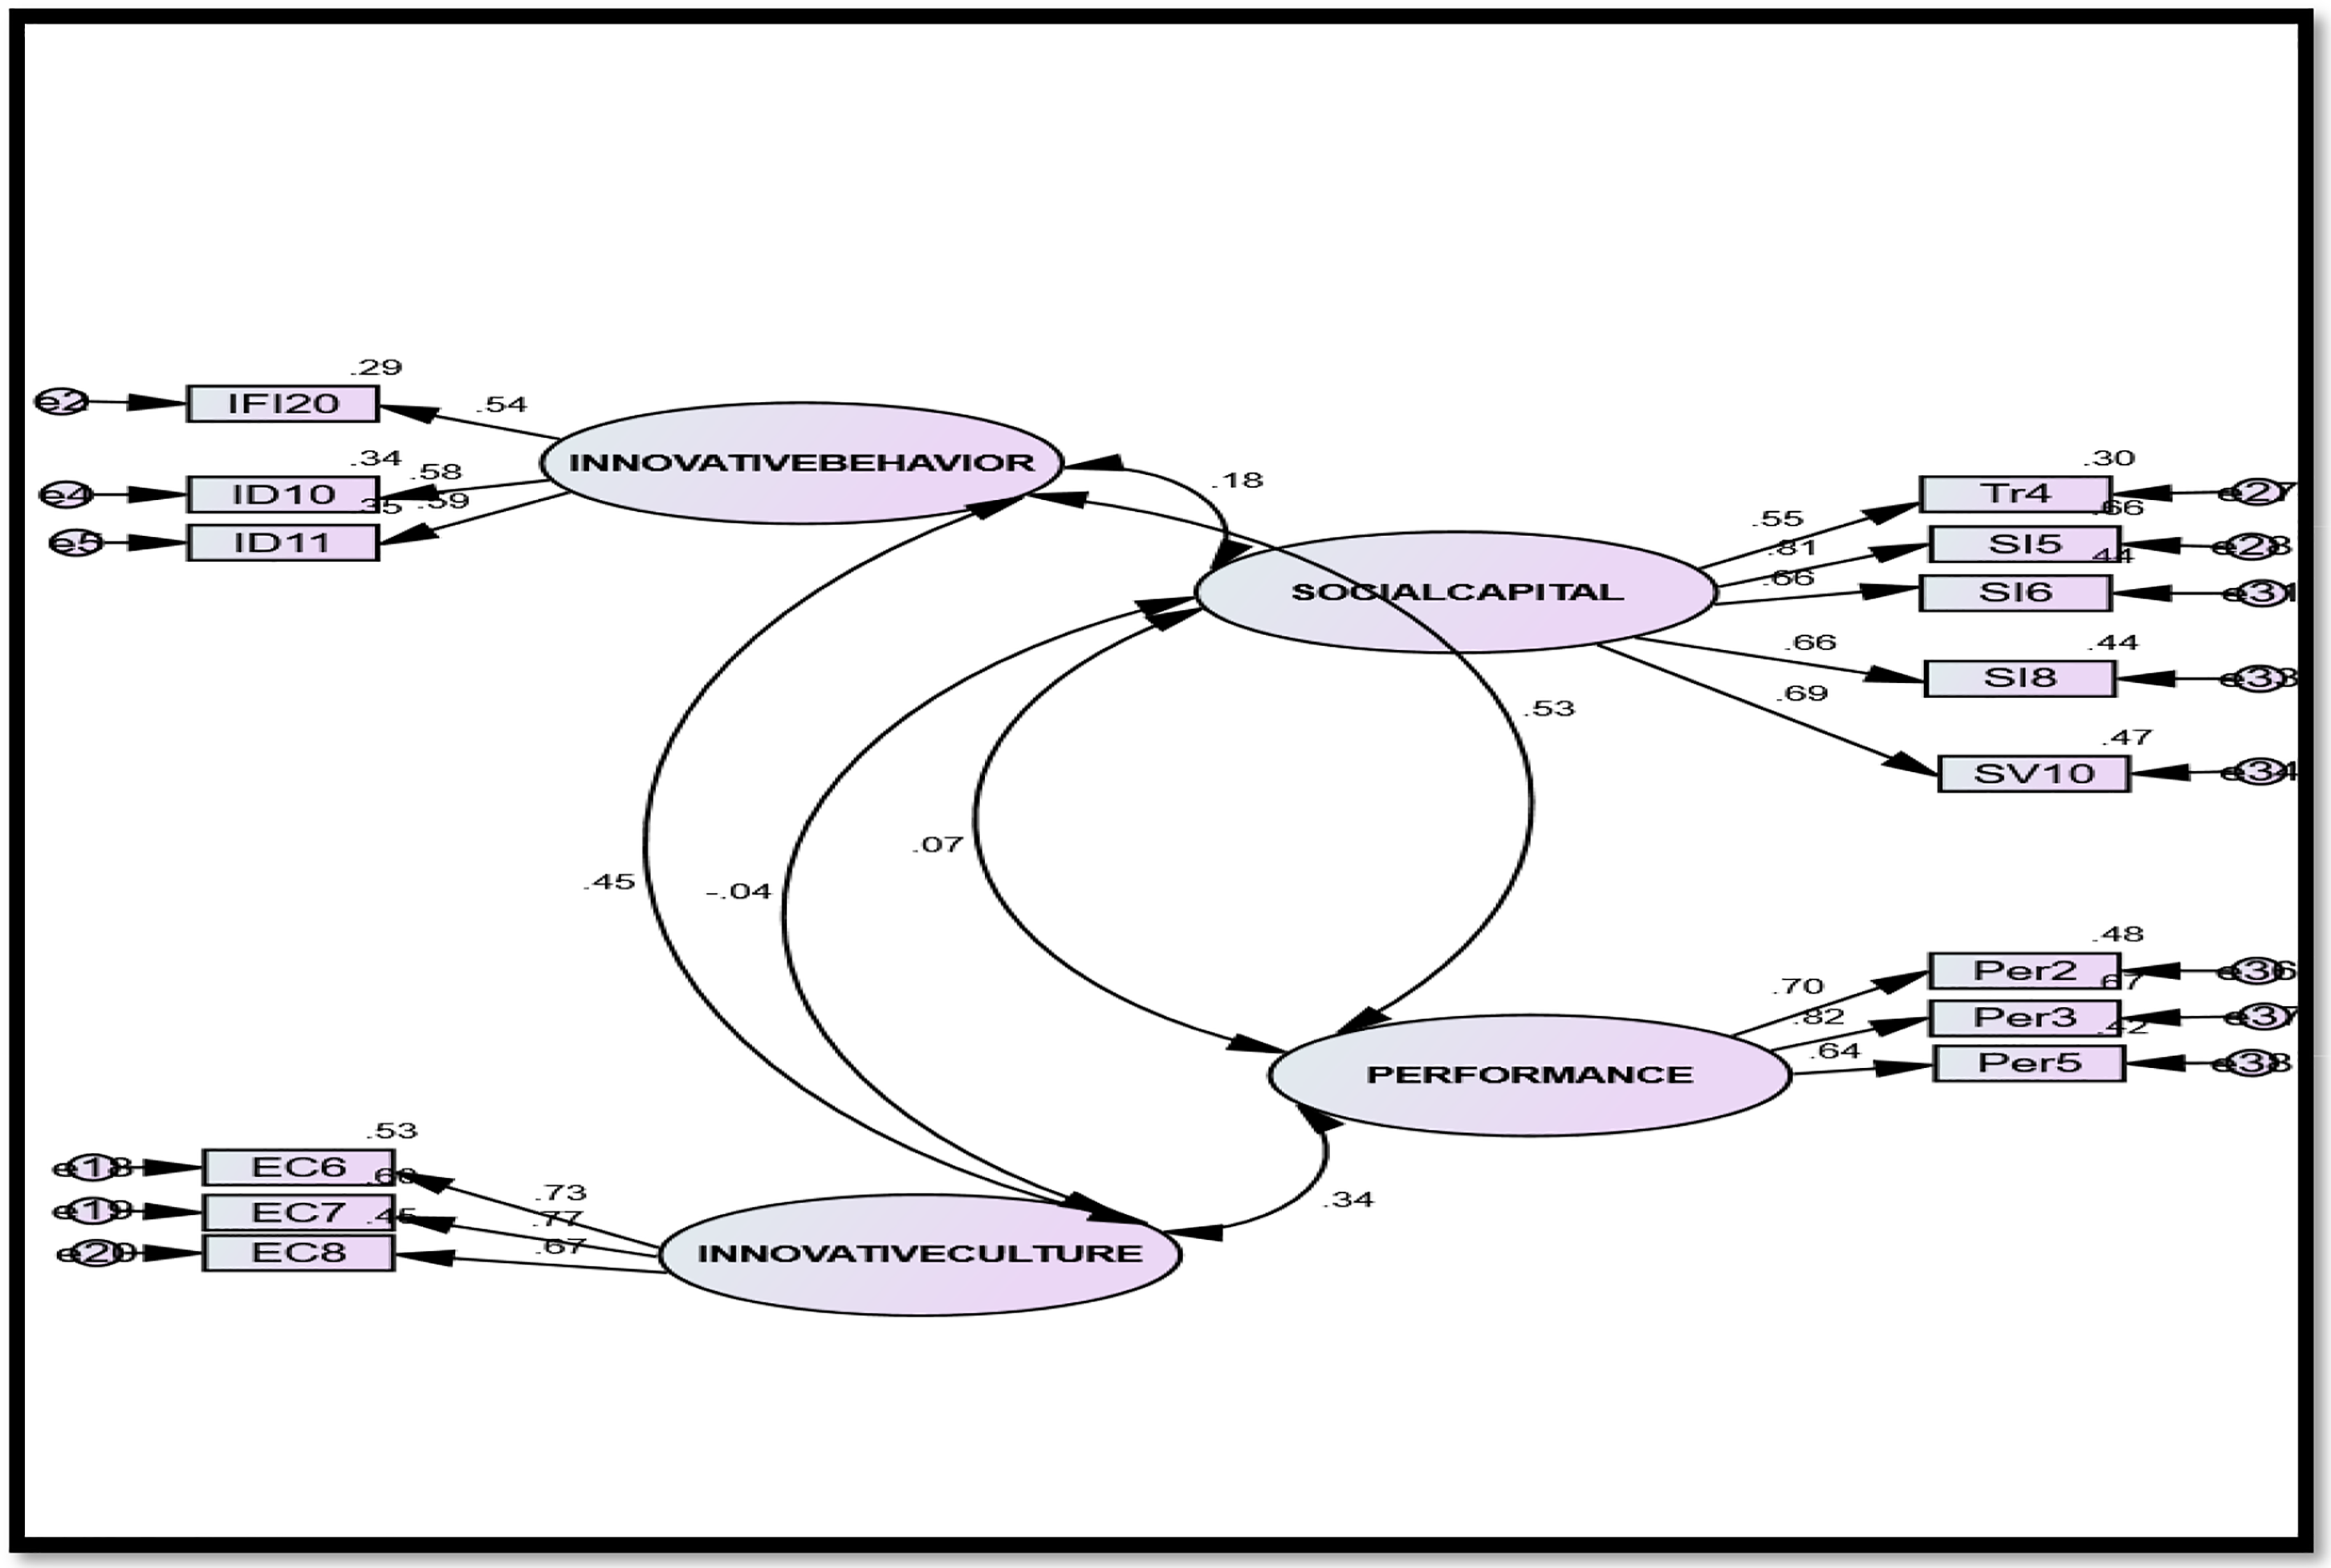
CFA model.
New CFA model. Model indices: P = 0.000, x2= 130.029, df = 71, GFI = 0.937, NFI = 0.892, CFI = 0.947, TLI = 0.932, RMSEA = 0.056(0.041–0.071), RMR = 0.037, SRMR = 0.058.
Though this model is the appropriate to address the research framework, but the solution is not admissible. Also, the variances are negative. The following covariance matrix is not positive definite (Group number 1–Default model).
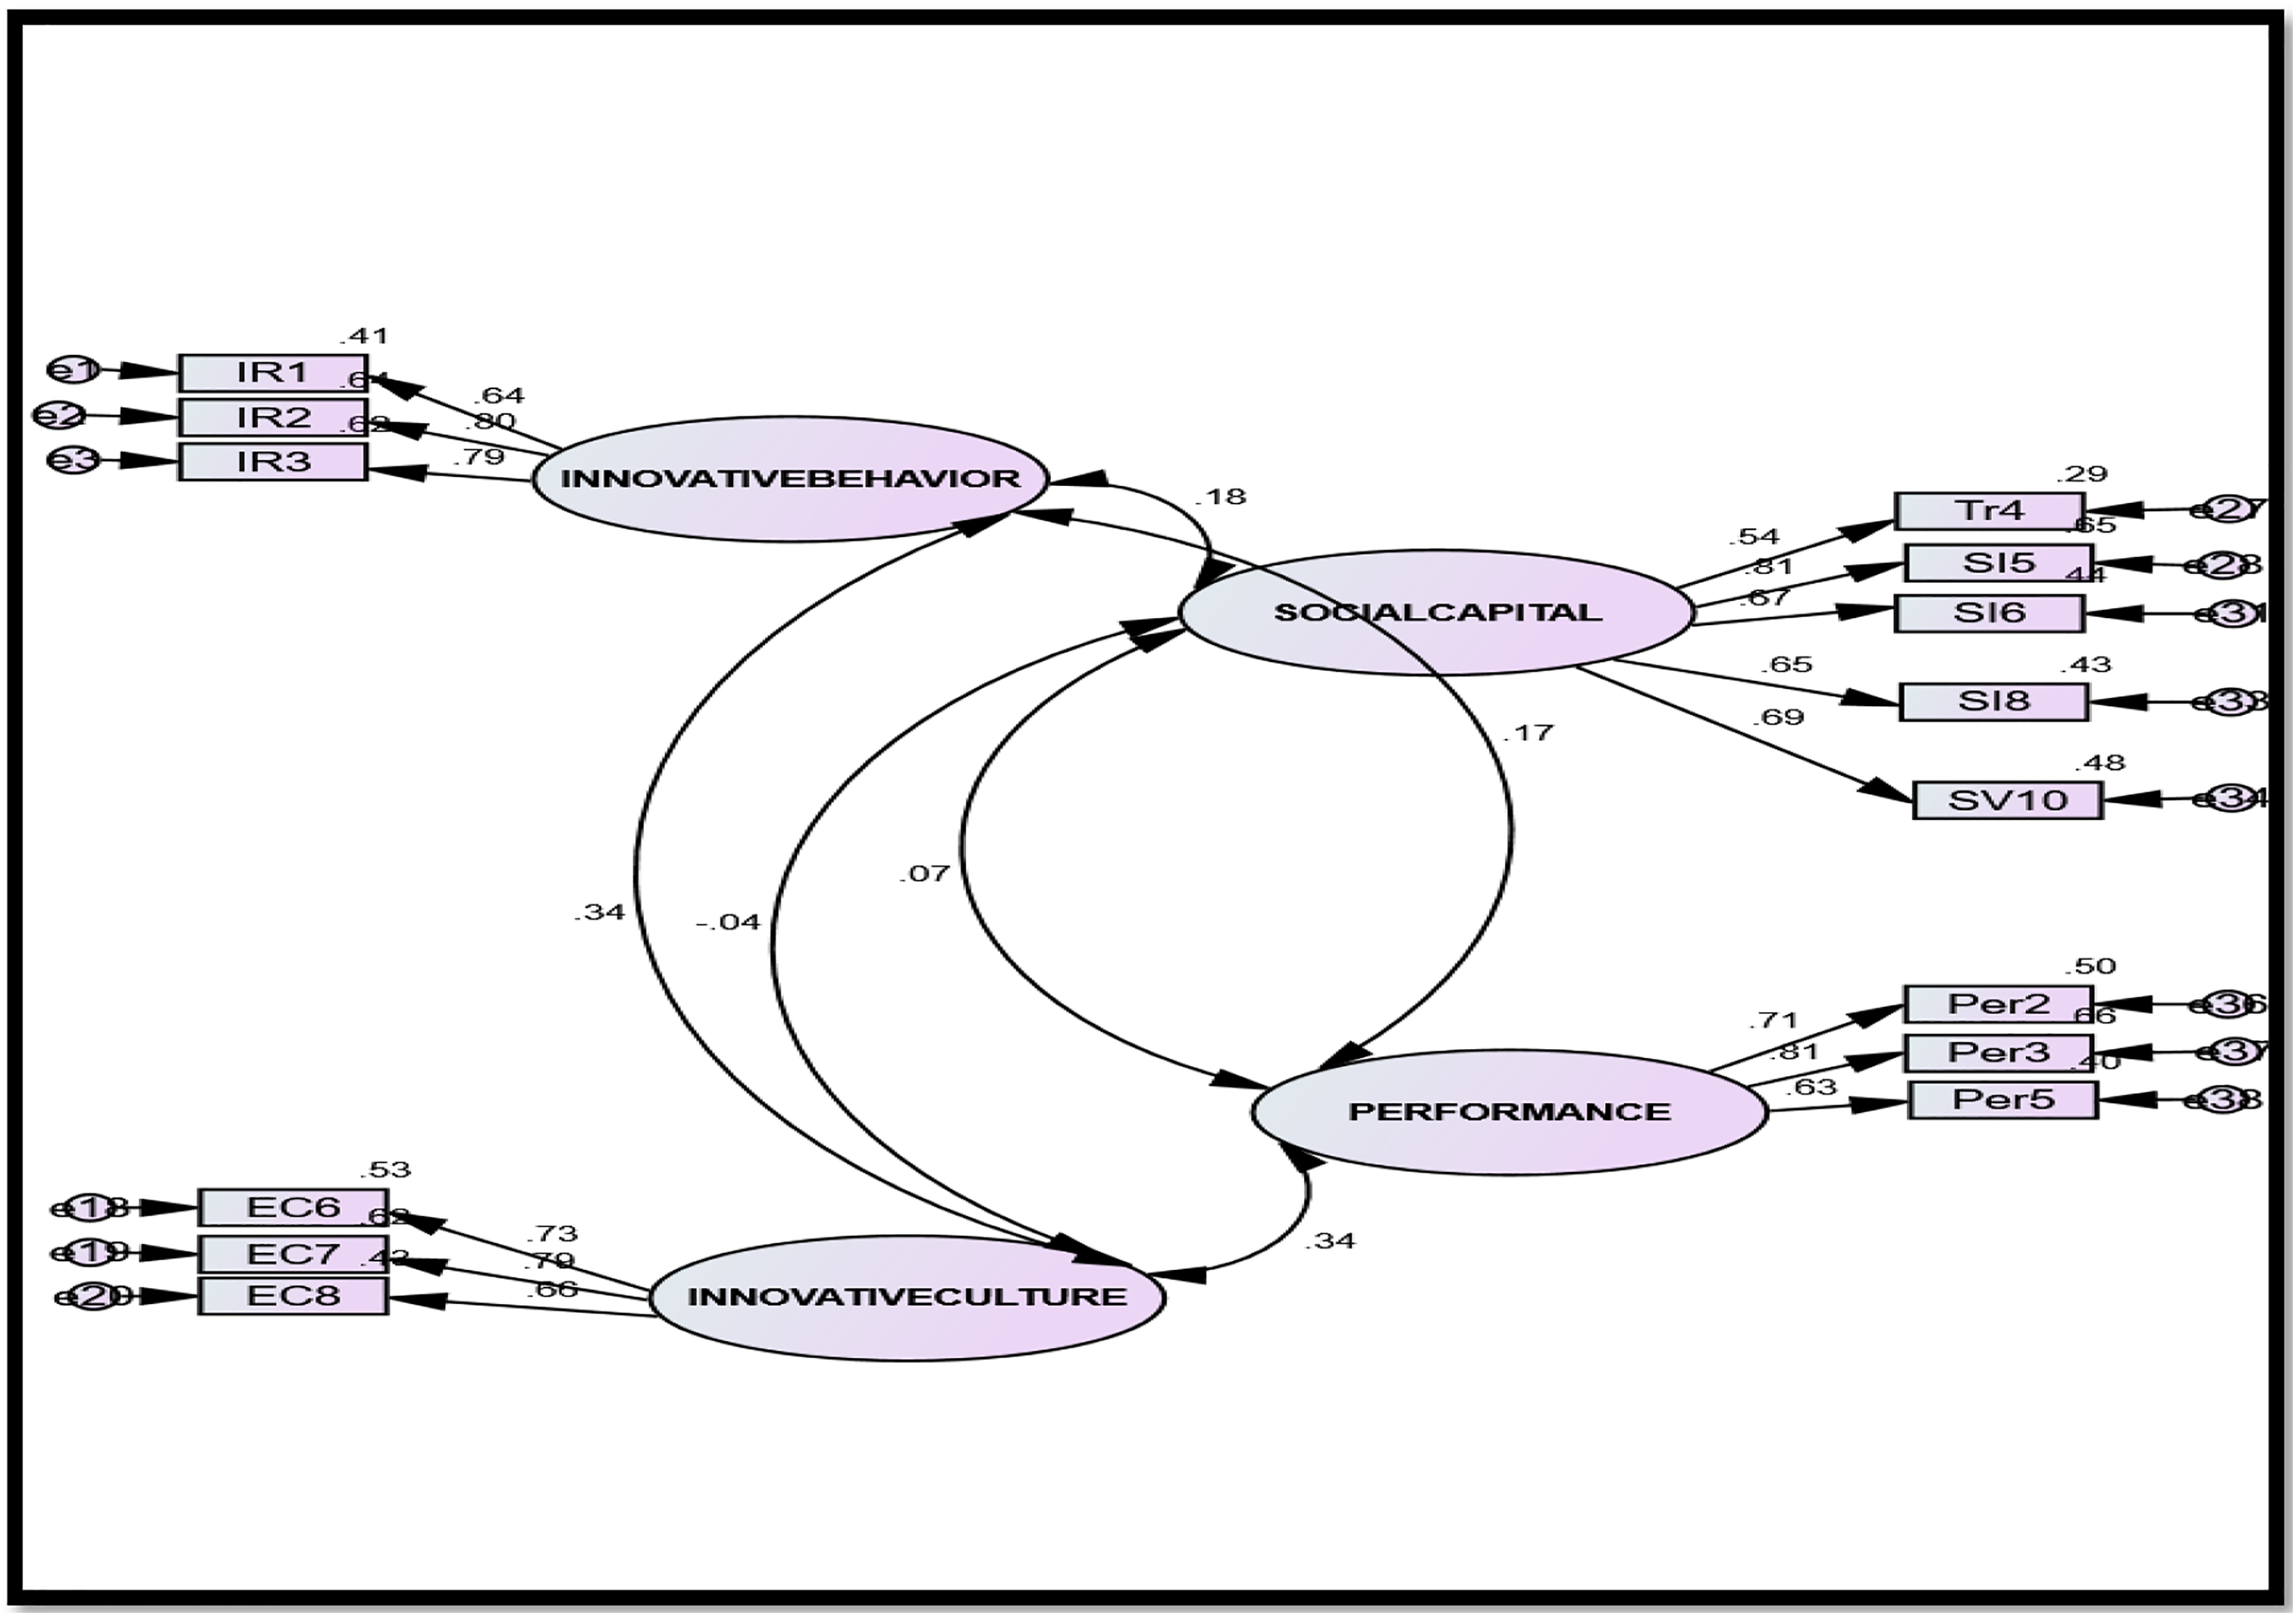
This suggests that some variance estimates are negative or that the estimated covariance matrix for some external variables is not positive definite. It implies that either your model is flawed, or the sample size is insufficient (Jöreskog and Sörbom, 1981). It also suggests extreme multivariate collinearity among manifest variables or subconstructs or the dataset contains highly redundant items that correlate near one among them. Hence, a model re-specification was done by deleting manifest variables or subconstructs having multivariate collinearity. Figure 4 shows a new CFA model.
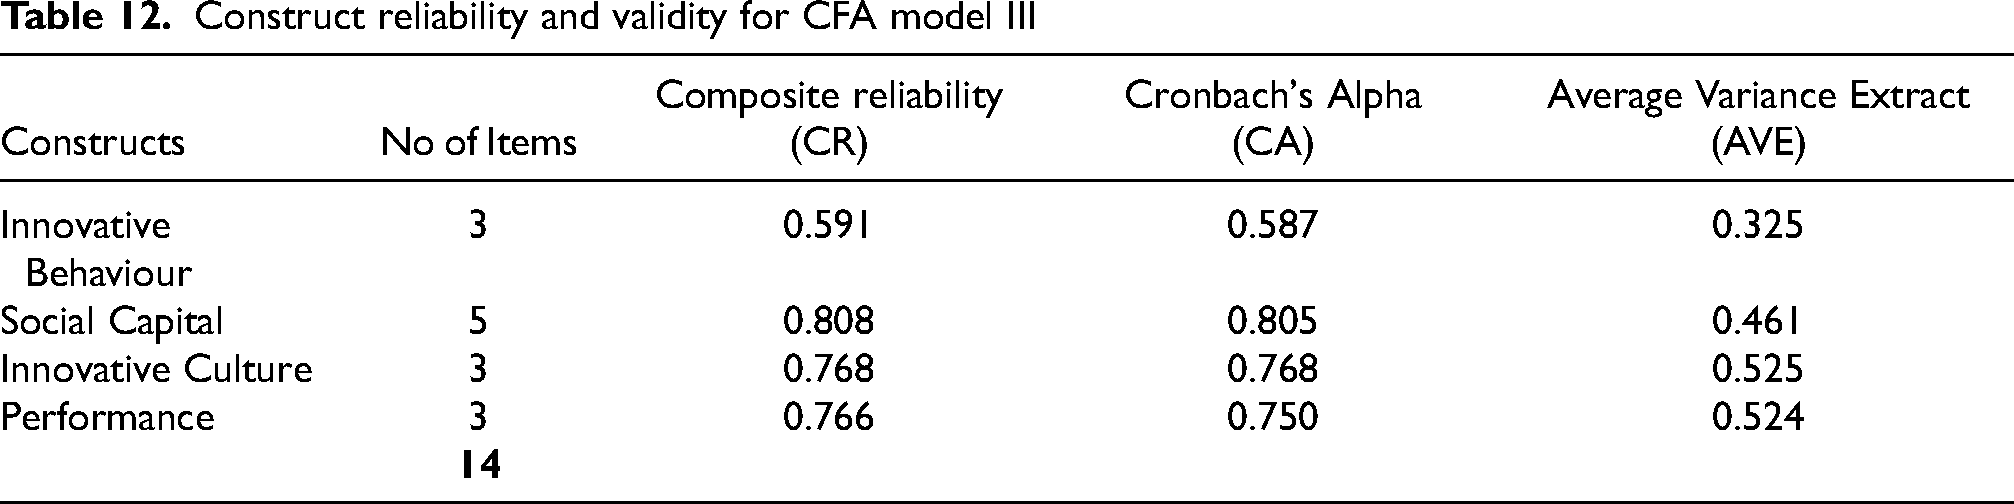
Table 12 presents the construct reliability and validity for CFA model 3. Though the model indices show that the model is acceptable, the results in Table 3 show that the reliability and validity of Innovative Behaviour could not be established because the values of CR, CA and AVE were below the acceptable estimates of CA and CR >0.70, and AVE > 0.5 as recommended by Fornell and Larcker (1981). Thus, further model re-specification was done. Figure 4 shows the new acceptable CFA model.
Construct reliability and validity for CFA model III
The model consists of Four First-Order Constructs, which are: (i) Social Capital, (ii) Innovative Behaviour, (iii) Innovative Culture, and (iv) Performance. According to Kline's (2011) advice, the model fit was evaluated using four goodness indices: the comparative fit index (CFI), mean-square residual (SRMR), standard root mean approximation (RMSEA) with 90% confidence interval, and chi-square (2) with degree of freedom. According to Kline (2011), RMSEA <0.10, CFI = 0.90, and SRMR < 0.10 are generally considered favourable. Thus, the model fit indices: χ2 = 130.029, df = 71, RMSEA = 0.056 (0.41–0.71), CFI = 0.947, and SRMR = 0.058 show that the model is acceptable for structural modelling.
(a) Construct Reliability
Table 13 shows that all the constructs are adequately reliable. Each construct has estimates of CA and CR >0.70 as recommended by Fornell and Larcker (1981).
Construct reliability and validity for acceptable model
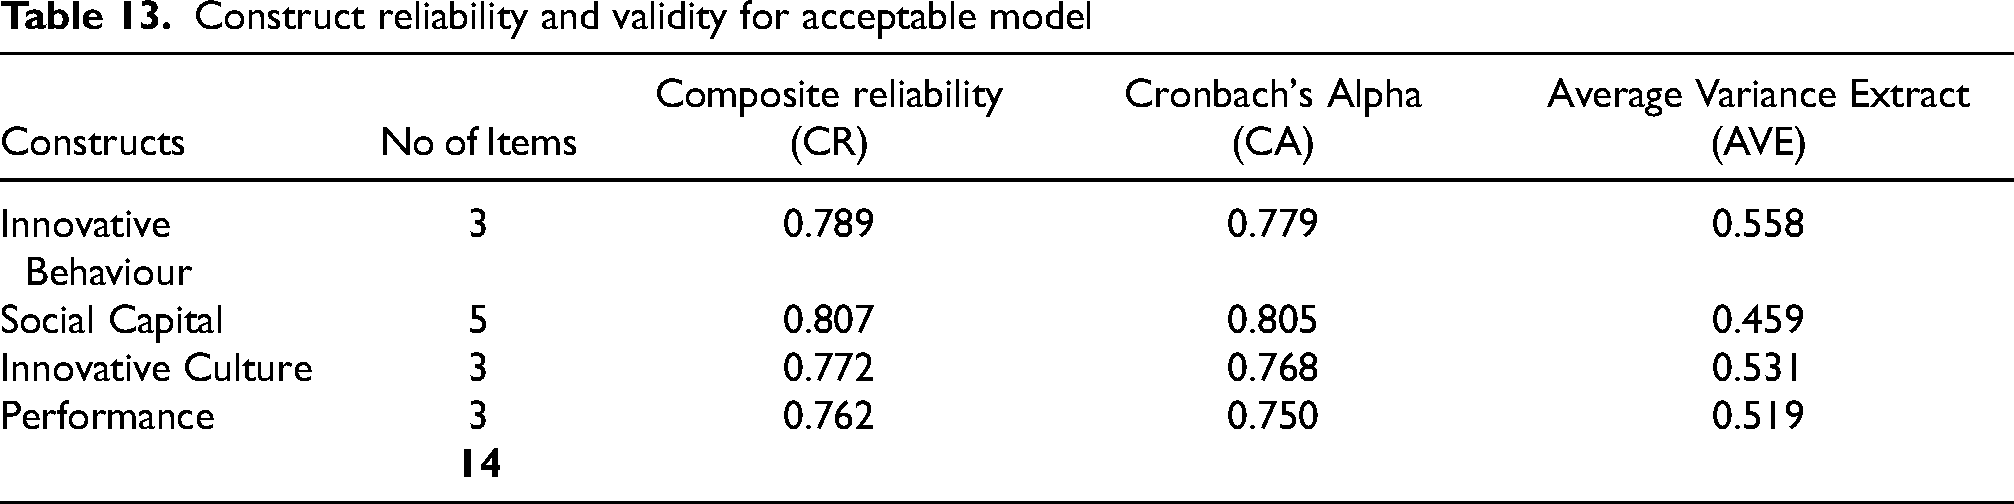
(b) Convergent Validity
This was assessed using Average Variance Extracted (AVE) for each. Table 13 shows that only one construct (Social Capital) has AVE value slightly less than 0.50 but the factor loadings are greater than 0.5 as recommended by Hair et al. (2010). The rest of the three constructs have average value of 0.50 and above as recommended by Fornell and Larcker (1981), therefore, the convergent validity of the constructs is acceptable.
(c) Discriminant Validity
Using Awang's (2015) recommendation that states that discriminant validity of measurement model is established if the correlation between constructs is not > 0.85, Figure 4 shows that intercorrelations of different constructs are not >0.85. Hence, the discriminant validity of the constructs is acceptable.
Assessment of normality
The normality of data for this study was assessed using AMOS 23. The skewness of the data falls within −0.394 to −2.040, while kurtosis falls within −0.051 to −6.543, and all were within the acceptable limit recommended by Byrne (2013), that acceptable cut off point for kurtosis of between ±2.0 and ±7.0.
Structural model assessment
Figure 5 presents the results of the structural model assessment. SEM technique was then used to test the hypotheses as illustrated on the modified research framework in Figure 5. Based on the acceptable measurement model, the modified Research Model is shown in Figure 5.
Research framework (modified).
Figure 6 shows the Structural Model. Kline (2011) states that RMSEA 0.10, CFI 0.90, and SRMR 0.10 are widely seen as favourable. According to the model's model fit indices, the model fairly matched the observed data. As a result, the model was approved for use in this study's investigation of the associations that were hypothesized (See Figure 6).
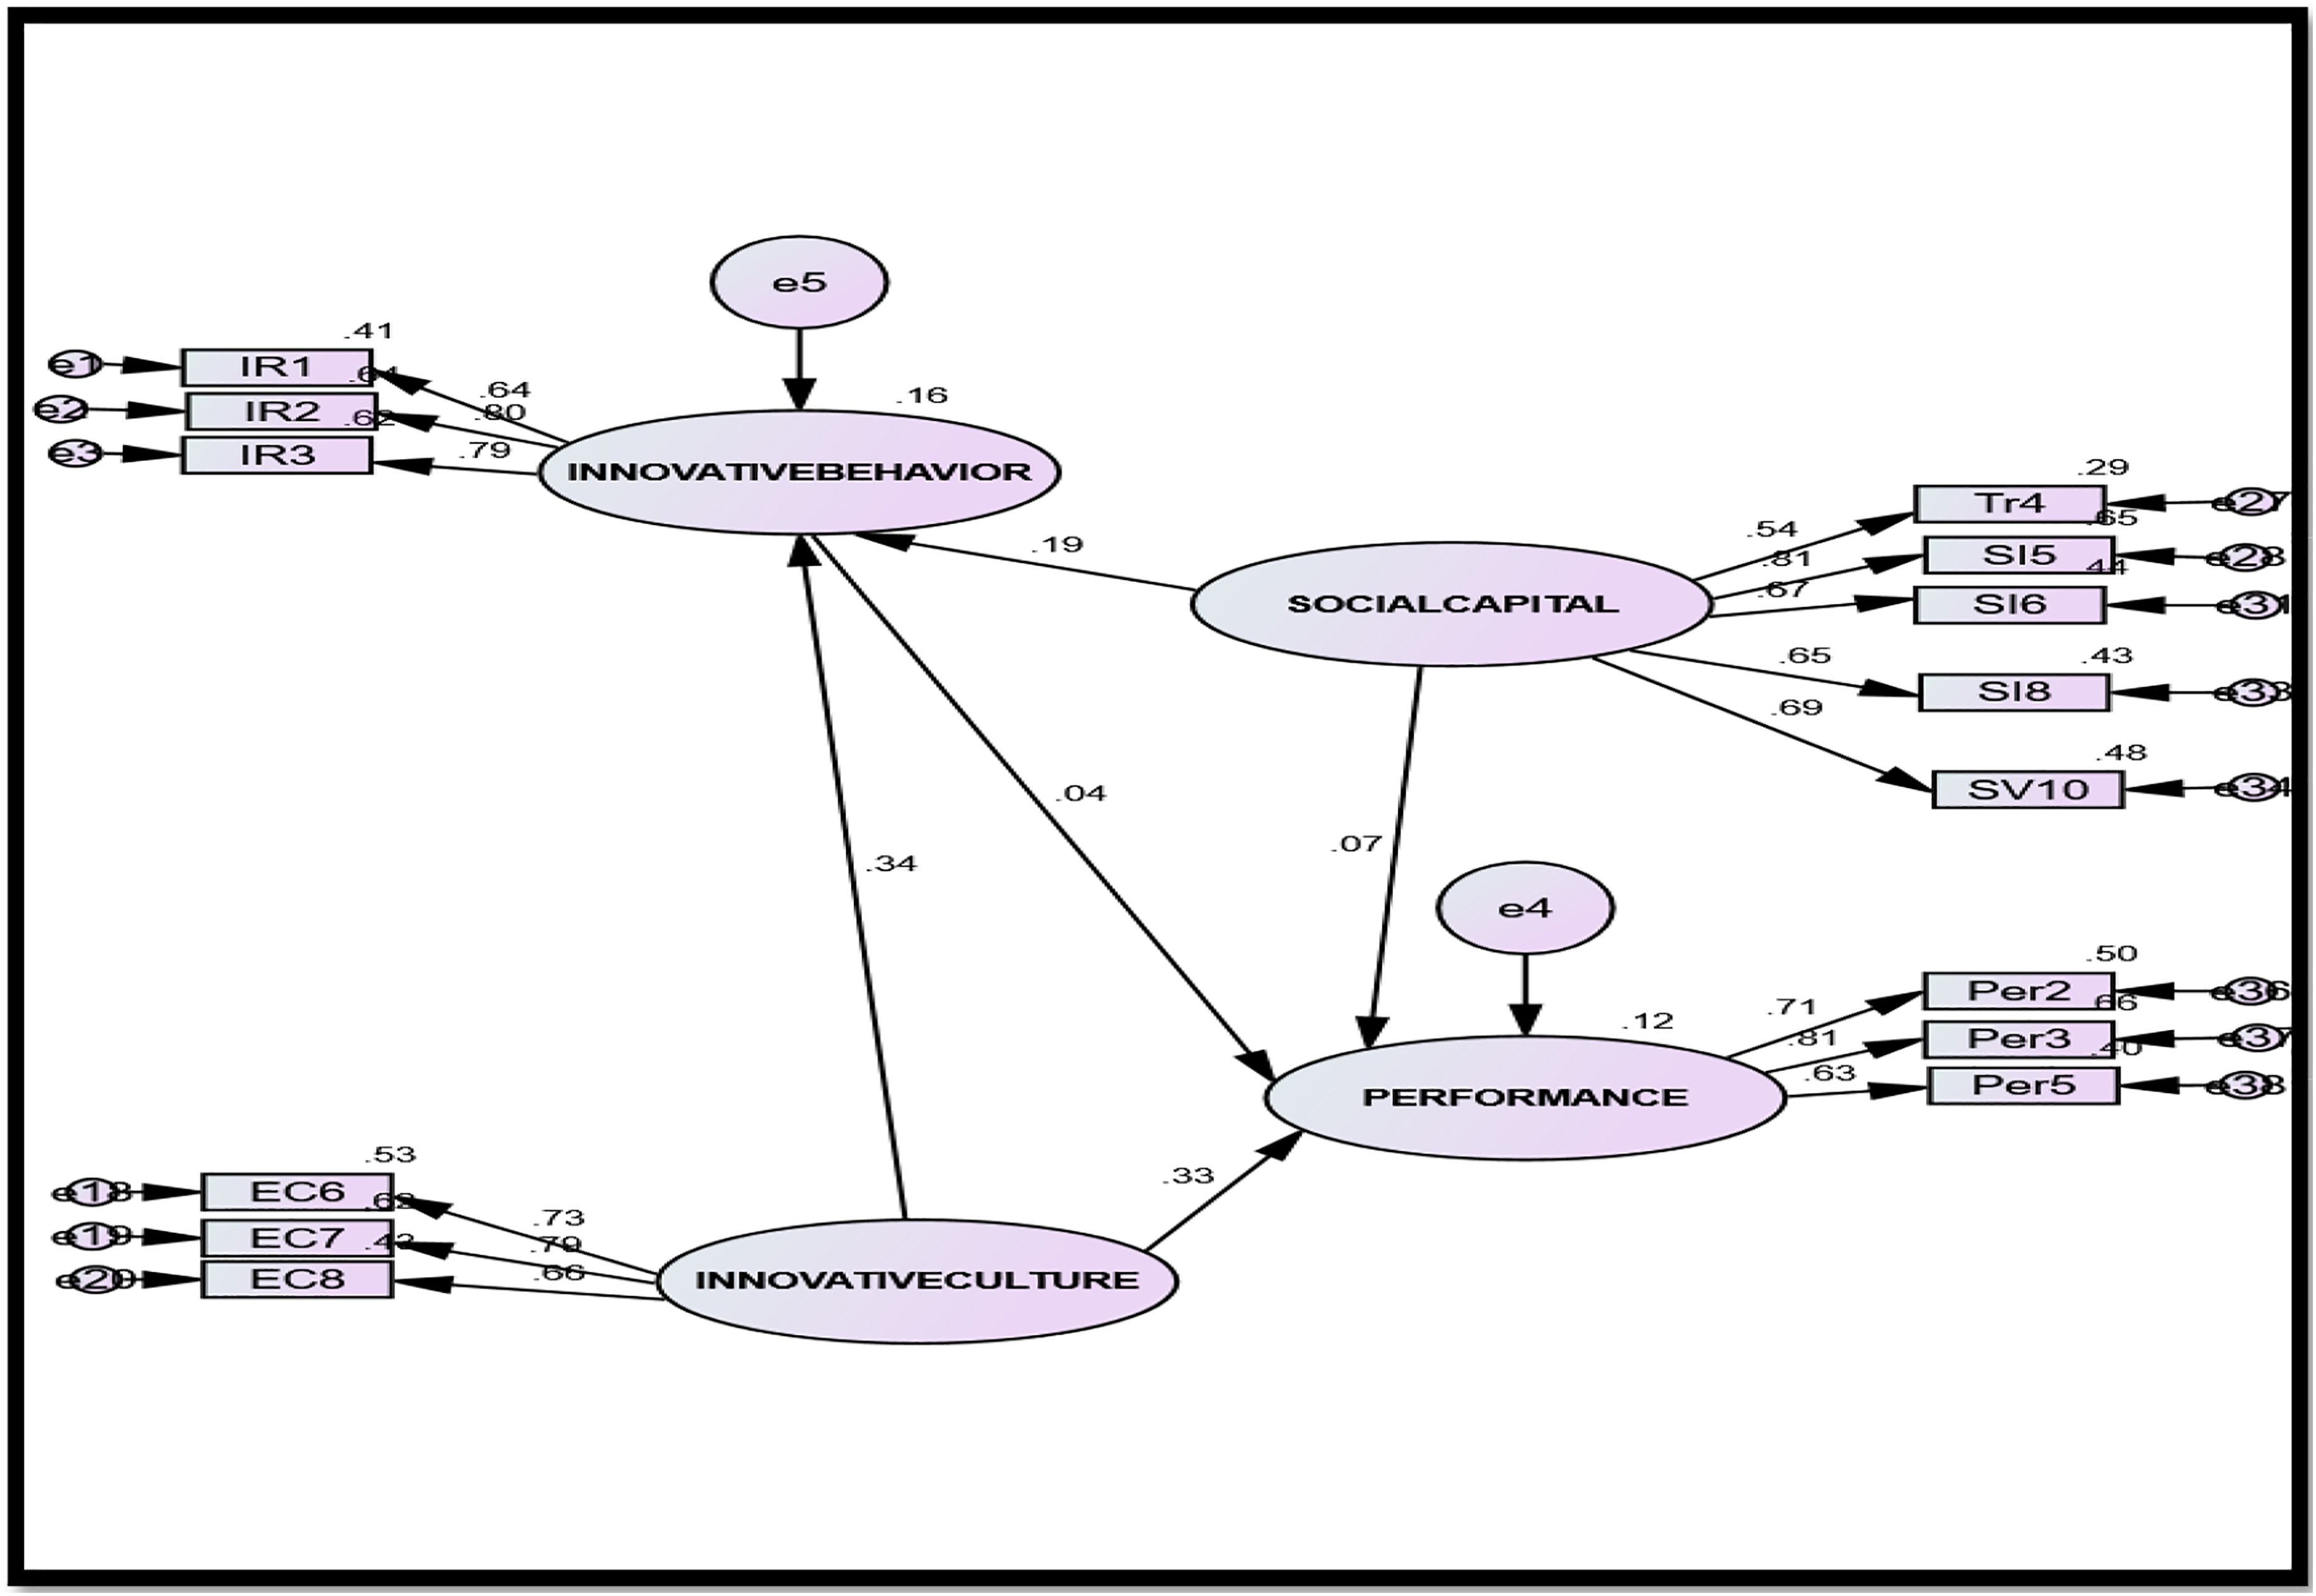
Structural model. Model indices: x2= 130.275, df = 72, GFI = 0.936, NFI = 0.892, CFI = 0.948, TLI = 0.934, RMSEA = 0.055(0.040–0.070), RMR = 0.038, SRMR = 0.058.
The predictive power of the model
The model in Figure 6 explained 81.3% of the variance in the four constructs (R2 = 0.813). Therefore, the predictive power of the model is 81.3%. Therefore, the variance explained by the model for this study has a practical value.
Evaluating the hypotheses
Table 14 presents the hypothesised paths of the SEM model. This shows the causal effects between the variables. Maximum likelihood estimation was deployed to generate the estimates. The null hypotheses (H0) were rejected at p ≤ 0.05. H01: There is no significant relationship between innovative culture and performance of Small and Medium ICT Enterprises in Lagos.
Hypothesised relationships
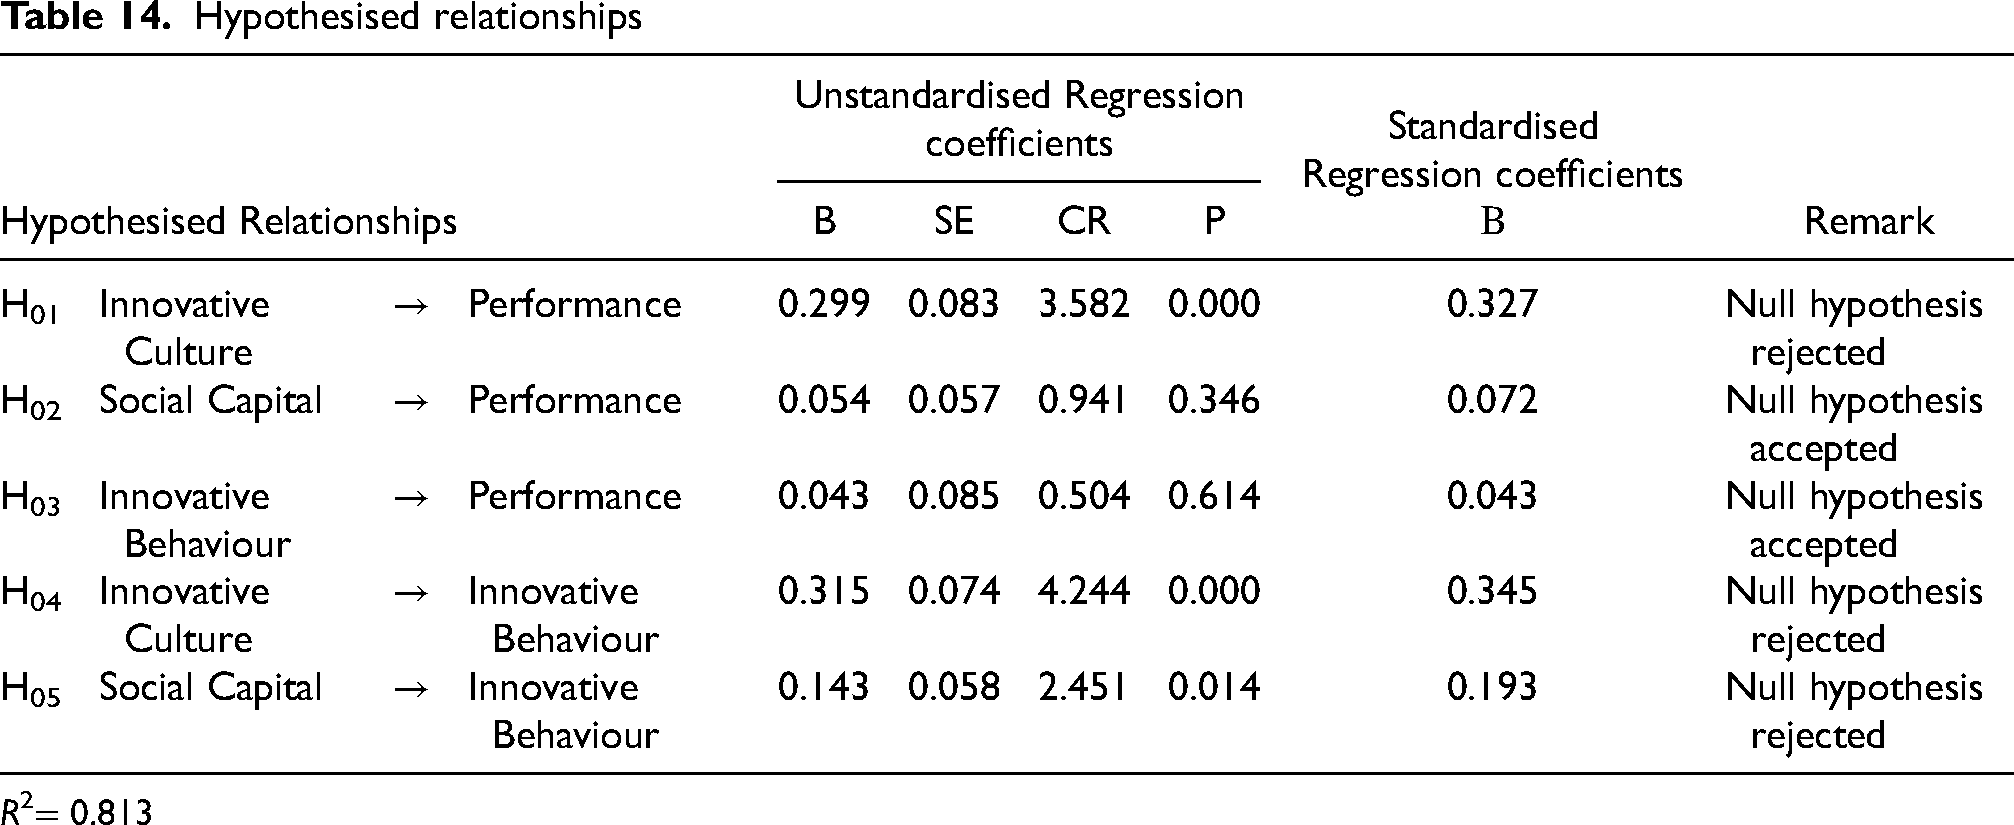
R2= 0.813
Table 14 shows a significant relationship between innovative culture (the exogenous variable) and performance (the endogenous variable) of ICT SMEs in Lagos (β = 0.327, p = 0.000). The null hypothesis was therefore rejected. This means that innovative culture had a significant positive effect on performance of Small and Medium ICT Enterprises in Lagos. H02: There is no significant relationship between social capital and performance of I Small and Medium ICT Enterprises in Lagos.
Table 14 shows no significant relationship between the exogenous variable (social capital) and the endogenous variable (performance) of ICT SMEs in Lagos (β = 0.072, p = 0.346). The null hypothesis was therefore accepted. In essence, social capital had no significant positive effect on performance of Small and Medium ICT Enterprises in Lagos. H03: There is no significant relationship between innovative behaviour and performance of Small and Medium ICT Enterprises in Lagos.
Table 14 shows no significant relationship between the exogenous variable (innovative behaviour) and the endogenous variable (performance) of ICT SMEs in Lagos (β = 0.043, p = 0.614). The null hypothesis was therefore accepted indicating that innovative behaviour had no significant positive effect on performance of Small and Medium ICT Enterprises in Lagos. H04: There is no significant relationship between innovative culture and innovative behaviour of Small and Medium ICT Enterprises in Lagos.
Table 14 shows a significant relationship between the exogenous variable (innovative culture) and the endogenous variable (innovative behaviour) of ICT SMEs in Lagos (β = 0.345, p = 0.000). The null hypothesis was therefore rejected. The implication is that innovative culture had a significant positive effect on innovative behaviour of Small and Medium ICT Enterprises in Lagos. H05: There is no significant relationship between social capital and innovative behaviour of Small and Medium ICT Enterprises in Lagos.
Table 14 shows a significant relationship between social capital (the exogenous variable) and innovative behaviour (the endogenous variable) of ICT SMEs in Lagos (β = 0.193, p = 0.014). The null hypothesis was therefore rejected. This implies that social capital had a significant positive effect on innovative behaviour of Small and Medium ICT Enterprises in Lagos. H06: Innovative behaviour does not mediate the relationship between innovative culture and performance of Small and Medium ICT Enterprises in Lagos.
Figure 6 shows that innovative behaviour mediated the relationship between innovative culture and performance of Small and Medium ICT Enterprises in Lagos (β = 0.346, P = 0.000) to (β = 0.327, p = 0.000). Nevertheless, the mediation was partial because the direct effect was still significant (β = 0.327, p = 0.000). The null hypothesis was rejected. This means that innovative behaviour mediated the relationship between innovative culture and performance of ICT SMEs in Lagos.
Discussion of findings
The study examined the innovative behaviors of Small and Medium ICT Enterprises (SMEs) in Lagos, drawing insights from existing literature. Key elements explored included innovation research, idea generation, innovation support, diversity in innovation practices, and intention for innovation. Findings underscored the proactive stance of SMEs towards generating ideas that address current and future challenges, emphasizing their reliance on internet resources such as YouTube videos for capacity building. Notably, SMEs in ICT clusters prioritize internal training, enabling them to tackle complex tasks like computer repairs independently, aligning with findings on the encouragement of internal learning processes (Ogunjemilua et al., 2020). While many SMEs replicate rather than originate ideas, there's a strong inclination towards sharing information for mutual benefit, echoing the collaborative ethos of ICT clusters (Nwagwu and Ibeku, 2016).
Moreover, SMEs incentivize innovation through monetary rewards and recognition, fostering a culture where employees are encouraged to contribute innovative solutions. Market research, operational methods, and customer sourcing are areas of focused innovation diversity, highlighting their commitment to enhancing operational efficiency and customer satisfaction.
Examining the cultural dimensions of SMEs revealed a robust learning culture where continuous skill enhancement and adaptation of cutting-edge techniques are prioritized. This includes sourcing technical information from manuals and engaging with online resources, underscoring their commitment to staying informed and agile in a competitive market.
Entrepreneurial culture among SMEs manifests in their proactive approach to wealth creation and capital expansion, demonstrating a willingness to undertake risk for potential rewards (Igweh and Stephen, 2019). This forward-looking mindset is bolstered by their engagement with professional associations and strategic commitment to seizing business opportunities.
Competitive culture drives SMEs to differentiate themselves through aggressive client engagement strategies, although they maintain supportive internal environments, avoiding punitive measures for sales setbacks. Resource allocation culture ensures adequate funding and time allocation for innovation, crucial for developing original solutions and maintaining market relevance.
Social capital analysis highlighted high levels of trust among SMEs, facilitating transparent interactions and information sharing essential for innovation (Wah et al., 2018). Social interaction is frequent and collaborative, fostering a climate conducive to idea exchange and collective problem-solving (Nwagwu and Ibeku, 2016). Shared business principles reinforce mutual support and knowledge sharing, transcending religious and tribal affiliations.
Performance indicators reflected the positive impact of innovation efforts on SMEs, including higher service prices, reduced operational costs, business expansion, and improved service quality. Knowledge sharing and innovation were instrumental in minimizing waste, enhancing customer connectivity, and boosting revenue streams (Ajor and Alikor, 2020). Statistical analysis revealed a significant positive relationship between innovative culture and SME performance, attributing 32.7% of performance variance to innovative cultural practices. This underscores the pivotal role of learning, entrepreneurialism, competitive strategies, and effective resource management in achieving business objectives (Arsawan et al., 2020; Eniola and Ektebang, 2014).
The study found no significant relationship between social capital and performance, with social capital explaining only 7.2% of the variance in performance. This suggests that while trust, social interaction, and shared values among ICT SMEs contribute to leveraging resources, they do not strongly correlate with overall performance. Nevertheless, the findings align with Tang et al. (2020), emphasizing the importance of organizational values and beliefs in enhancing small business performance (Afuah, 2020; Xerri and Bruneto, 2011). Similarly, Chowdhury et al. (2019) reported significant influence of social capital on performance, supported by social capital theory which underscores trust and interactions. Higher trust levels can enhance network formation and foster an innovative culture crucial for SMEs, especially under resource constraints. The implication is a need for deeper engagement among SMEs to enhance processes and possibly join cooperative associations (Zia, 2020).
Innovative behaviour showed no significant relationship with performance, explaining only 4.3% of the variance. Despite this, ICT SMEs engaging in research and idea generation see improvements in service quality and diversity (Hyland and Karlsson, 2021). This aligns with the importance of innovation in enhancing small business performance, as noted by Wale-Oshinowo et al. (2018) and Paraschiw et al. (2012). From a Resource-Based View perspective, SME managers should focus on fostering a culture that encourages employees to generate and implement innovative ideas. Effective reward systems are crucial in incentivizing creativity and improving performance outcomes (Dziallas and Blind, 2019).
There is a significant relationship between innovative culture and innovative behaviour, explaining 34.5% of the variance in innovative behaviour. This highlights how a culture supporting learning, competition, entrepreneurship, and resource allocation among ICT SMEs fosters the introduction of new ideas and processes (Martins and Terblanche, 2003; Xerri and Brunetto, 2011). This finding supports the view that fostering an innovative culture is vital for enhancing employee innovation (Roffeei et al., 2017). Such culture, rooted in social exchange theory, facilitates innovative behaviour through shared values and norms, crucial for sustained innovation efforts (Jegede and Jegede, 2018). SMEs should encourage continuous learning, networking, and entrepreneurial spirit among employees to enhance their innovative capacity (Ibidunni et al., 2021).
There is a significant relationship between social capital and innovative behaviour, explaining 19.3% of the variance. Trust, social interaction, and shared values among ICT SMEs facilitate the introduction and application of new ideas and processes (Dobni, 2008). This supports the role of social capital theory in promoting innovative cultures through high trust levels and robust networks, particularly beneficial in resource-constrained environments (Zia, 2020).
The theory of planned behaviour emphasizes the role of intentions in influencing innovative behaviour. SMEs must prioritize building trust and fostering quality interactions to support innovative initiatives (Igweh and Stephen, 2019). Strategic practices like after-sales support and customer loyalty programs can enhance customer relationships and business performance.
Innovative behaviour mediates the relationship between innovative culture and performance, suggesting that while innovative culture directly impacts performance, part of its effect is channeled through encouraging innovative behaviour (Baron and Kenny, 1986). Thus, fostering an environment supportive of innovation enhances SME performance, as innovative behaviour remains a critical driver of organizational success.
Conclusion
The findings underscore the significance of knowledge sharing, entrepreneurial spirit, and competitive strategies in enhancing ICT SME performance. Policies should focus on stimulating innovation and fostering supportive organizational cultures to bolster SME growth in the ICT sector.
Policy and action implications of findings
Policymakers should promote knowledge sharing and competitive strategies among ICT SMEs to enhance performance. National policies should integrate innovation support mechanisms tailored to THE ICT SME, fostering a conducive environment for growth. ICT SME managers should prioritize fostering learning, entrepreneurial, and competitive cultures to exploit new opportunities and improve performance.
Contributions to knowledge
The study contributes theoretical insights into how innovative culture, social capital, and innovative behaviour affect ICT SME performance. It also provides practical recommendations for enhancing SME competitiveness through innovation.
Recommendations
SME managers should invest in capacity-building and knowledge-sharing initiatives to stimulate innovation. Collaborative efforts among SMEs, research institutions, and other stakeholders can enhance social capital and knowledge exchange. Clear strategies for incentivizing innovation and supporting employee creativity should be implemented to improve SME performance.
Suggestions for further studies
Future research should expand to include diverse SME sectors and geographic regions to enhance generalizability. Objective measures of SME performance could also be integrated to complement subjective assessments.
Footnotes
Declaration of Conflicting Interests
The author(s) declared no potential conflicts of interest with respect to the research, authorship, and/or publication of this article.
Funding
The author(s) received no financial support for the research, authorship, and/or publication of this article.