
Abstract
This article evaluates the firm-level impact of the Employment Investment Incentive Scheme (EIIS), a tax relief programme designed to mobilise private capital for small and medium-sized enterprise growth. Drawing on the resource-based view and dynamic capabilities theory, we assess the effect of EIIS funding on employment, revenue, productivity, profitability and survival. Using a matched sample of 1254 firms and a staggered difference-in-differences approach, we find that EIIS recipients experience gains in employment, revenue and labour productivity, increasingly from the second-year post-investment. These gains do not translate into improved profitability, however, and recipient firms face a modest but persistent increase in failure risk. Our findings highlight that performance depends not only on acquiring capital but also on the ability to deploy it effectively. We offer theoretical and policy insights into the design of taxation-based business supports, emphasising the need to complement financial assistance with non-financial guidance and more targeted eligibility mechanisms.
Introduction
Small and medium-sized enterprises (SMEs) are widely recognised as the backbone of modern economies; yet, they continue to face persistent financing constraints that limit their growth and innovation potential (Beck et al., 2008; Lee et al., 2015). In response, governments have introduced a variety of tax-based investment incentives to mobilise private capital and stimulate SME expansion. However, despite their popularity, the effectiveness of such incentives remains inconclusive with some studies reporting improved growth and innovation (Boyns et al., 2003), while others find minimal or short-lived effects (Decramer and Vanormelingen, 2016). This inconsistency reflects a deeper conceptual tension: tax-incentivised capital may relieve financial constraints, but it does not guarantee that firms will deploy these new resources productively or sustainably. This study positions this growth–survival tension at the heart of its inquiry. Using Ireland’s Employment Investment Incentive Scheme (EIIS) as an empirical setting, we examine whether equity raised through public tax relief translates into meaningful and sustained improvement in firm performance. Introduced in 2011, the EIIS offers income tax relief of up to 40% to private individuals who invest in unquoted SMEs, requiring a minimum four-year holding period. The scheme’s design – mobilising private investors through fiscal incentives – makes it a powerful test case for evaluating the real-world impact of incentives to attract ‘patient capital’ on SME performance. Building on this motivation, the article addresses the following central research question: How does participation in a tax-incentivised equity scheme affect firm-level performance, relative to non-recipient firms?
To explore this question, we draw on the resource-based view (RBV) and dynamic capabilities (DC) frameworks to interpret these effects. RBV suggests that access to valuable and scarce resources, such as equity finance, enhances firm competitiveness and growth potential (Barney, 1991; Sirmon and Hitt, 2003). In contrast, DC emphasises the firm’s ability to integrate and reconfigure these resources to adapt and survive in changing environments. From this perspective, policy interventions that merely expand resource access may generate growth without necessarily improving profitability or long-term survival. This theoretical tension mirrors the empirical puzzle that motivates our study. In framing this study, we follow Alvesson and Sandberg (2011) and Locke and Golden-Biddle (1997), who emphasise that meaningful contributions often arise by problematising dominant assumptions within existing theories rather than simply identifying empirical gaps. In doing so, we challenge the implicit RBV assumption that resource acquisition alone ensures performance gains and instead extend this reasoning through a DC perspective that accounts for heterogeneous firm responses. By linking these theoretical perspectives to a major national policy initiative, we contribute to ongoing debates about the design and evaluation of SME financing supports; it advances understanding of when and how public tax incentives produce measurable benefits, and under what conditions their effects may be limited or even counterproductive.
Beyond traditional venture or angel investment, tax-mediated equity schemes such as the EIIS also share conceptual similarities with equity crowdfunding mechanisms. Like crowdfunding platforms (Crowdcube, Spark, Greencrowd), the EIIS mobilises dispersed, predominantly non-institutional investors who provide equity finance to early-stage firms, often motivated by non-pecuniary incentives such as social or environmental impact (Ahlers et al., 2015). Both mechanisms reduce information asymmetries through certification and signalling effects, either via government endorsement in the case of EIIS or platform-based due diligence in crowdfunding. Recognising these parallels situates the EIIS within the emerging literature on distributed equity finance impact (Cicchiello et al., 2019), and highlights its role as a hybrid policy-driven crowdfunding channel for SMEs. To date, much of the existing literature on tax incentives has centred on scheme design or investment volume (Gregson et al., 2017; Harrison et al., 2020), with limited analysis on firm performance post-investment. Broader evaluations of the effectiveness of state supports are also rare (Crawford et al., 2024; Decramer and Vanormelingen, 2016), especially regarding the direct effect of interventions on recipient firms (Prasannath et al., 2024). Where evaluations have been conducted, issues such as poor targeting, deadweight loss or minimal firm performance improvements have been highlighted (Bilau et al., 2017; Cowling, 2016; Denes et al., 2023). Concerns raised surrounding incentive implementation (Cicchiello et al., 2019), are reinforced by calls for further empirical investigation in the role of tax incentives within SME financing (Bergner et al., 2017).
We seek to fill this research gap by investigating potential firm-level effects of tax-incentivised investment in investee firms. Prior studies have evaluated the impact of tax incentives and other business supports on metrics such as revenue (Mole et al., 2009), firm productivity (Hosono et al., 2023), profit and survival (Boyns et al., 2003; Cowling et al., 2008). Building on this work, we provide a comprehensive analysis of the impact of the EIIS on key performance metrics. Specifically, we examine: How does the receipt of EIIS funding affect firm performance, including employment, revenue, productivity levels, profit and firm survival? To answer this question, we compile a dataset of 1254 firms, comprising EIIS recipients that raised investment between 2011 and 2019, and a matched control sample that did not. We conduct a staggered difference-in-difference (DiD) analysis, along with several robustness checks to assess whether EIIS participation improves post-investment performance.
EIIS programme context
The EIIS provides SMEs with a flexible form of equity capital that differs markedly from both bank lending and venture capital. Bank finance often requires collateral and regular repayments (Santos and Cincera, 2022), while venture capital can entail ownership dilution and investor control (Cumming et al., 2017; Manigart and Khosravi, 2024). In contrast, EIIS investment offers longer-term ‘patient capital’, requiring a minimum four year holding period. This structure allows SMEs to pursue expansion and employment growth without short-term repayment pressures while retaining strategic autonomy. The scheme’s government endorsement also generates a potential certification effect, enhancing firms’ credibility and signalling power with investors (Martí and Quas, 2018). In these ways, the EIIS represents a distinctive mechanism for mobilising private capital in support of SME growth when traditional or institutional equity finance may be inaccessible. The EIIS belongs to a broader family of European investor-side tax-relief schemes aimed at mobilising private equity for SMEs. Similar initiatives include the UK’s Enterprise Investment Scheme and Germany’s INVEST programme (Berger and Gottschalk, 2025), as well as France’s Madelin scheme and related international models studied by Gonzalez-Uribe and Paravisini (2017) and Solodoha et al. (2023). These programmes share the goal of reducing investor risk and stimulating early-stage equity flows but vary in design, particularly in required holding periods, relief magnitudes, and the degree of investor engagement. The Irish EIIS is distinctive for its longer four year holding requirement and higher relief rate, creating a form of medium-term ‘patient capital’ that allows firms time to deploy resources before investors can exit. This particular configuration provides a valuable comparative setting for analysing the real-firm impacts of tax-mediated investment.
SMEs represent close to 90% of businesses globally and account for over 99% of active enterprises in Ireland (OECD, 2024; World Bank, 2025). Despite their importance, SMEs consistently face difficulties in accessing capital for growth (Beck et al., 2008; Lee et al., 2015). While traditional finance providers remain dominant, access to equity-based finance has expanded through new sources of funding and policy interventions (Block et al., 2018; Cumming et al., 2019). However, barriers such as information asymmetries, perceived risk, and investor perceptions continue to limit equity investment within Irish SMEs (European Commission, 2017; Mason et al., 2019). The EIIS uses public tax incentives to mobilise private capital and stands out as one of the few accessible, state-backed avenues for non-institutional investment. Positioned within the broader landscape of public intervention in SME finance, it plays a central role in addressing early-stage funding gaps. Whether public interventions generate tangible improvements in recipient firms however, remains inconclusive, highlighting a critical gap in both academic and policy understanding (Chapman and Hottenrott, 2024; Fotopoulos and Storey, 2019).
Through this study, we offer three main contributions. First, we provide one of the first large-scale, firm-level causal evaluations of a tax-incentivised equity scheme by jointly examining its effects on firm growth, profitability, and survival using matched data and a staggered DiD design. In so doing, we move beyond input-based or investment-volume assessments of tax incentives and focus directly on post-investment firm outcomes. Second, by integrating the RBV with a DC perspective, we contribute theoretically by showing that access to equity capital can accelerate firm scaling without necessarily improving profitability or reducing failure risk, highlighting an important growth–survival trade-off in policy-supported equity finance. Third, we contribute to policy debates on SME finance by offering evidence that tax-based investment incentives can mobilise private capital and stimulate growth, but that their effectiveness depends critically on the firm’s capacity to deploy resources effectively. These insights have implications for the design of tax-incentivised equity schemes, suggesting a need to complement financial incentives with stronger targeting mechanisms and post-investment capability support. The remainder of the paper is structured as follows. We review the relevant literature and develops the study’s hypotheses. We then outline the data and methodology. We then present the empirical results, and discuss the findings and their implications for theory and policy.
Review of related literature and policy evaluation studies
SME financing constraints and business supports
Despite their importance to the economy, many SMEs still face difficulties in raising investment finance, hindering growth prospects (Beck and Demirguc-Kunt, 2006). These financial barriers are exaggerated in SMEs lacking collateral required to access traditional sources of debt financing (Bloom et al., 2019; Chiappini et al., 2022). Failures in the capital market pose a substantial obstacle to developing small firms (Chiappini et al., 2022) and while this obstacle has long been recognised, it remains insufficiently understood in terms of scale and form, limiting the development of effective policy response (Block et al., 2018; Cressy, 2012). Bank finance, while traditionally central to SME funding and associated with positive outcomes on employment and turnover (Honjo and Harada, 2006; Rahaman, 2011) is often inaccessible due to risk aversion considerations (Moscalu et al., 2020). Similarly, while venture capital (VC) has been associated with strong firm outcomes (Bertoni et al., 2011; Grilli and Murtinu, 2014), it tends to favour firms in later stages of development and therefore, SMEs may struggle to obtain such financing (Cumming et al., 2019).
Tax incentives are offered by governments to encourage specific activity or investment (Klemm, 2010). Historically, research has focused on the role of tax incentives in attracting foreign direct investment (Klemm and van Parys, 2012; Tavares-Lehmann et al., 2016), but their application in domestic SME policy has recently expanded, generating a growing body of research (Mason et al., 2019). These incentives are often directed at businesses to reduce corporate tax liabilities in return for carrying out specific activities such as research and development (R&D; Chiappini et al., 2022; Cowling, 2016). Alternatively, incentives can be directed at investors in order to mitigate risk and compensate for uncertainty, typically associated with investing in younger and smaller firms (Nicolas, 2022; Wilson, 2015). The overarching aim of these incentives is to increase capital inflows to SMEs (Boyns et al., 2003; Carpentier and Suret, 2016; Cowling et al., 2008). The EIIS exemplifies the latter approach. By providing income tax relief to private investors for investments in SMEs, the EIIS scheme attempts to improve capital access. As a policy tool, the EIIS reflects broader public intervention trends within SME and entrepreneurial finance policy, which is inherently multifaceted, involving a range of stakeholders and policy mechanisms (Acs et al., 2018).
Equity finance and public support measures have been identified as key tools for alleviating financial constraints hindering SME growth (Santos and Cincera, 2022). Government recognition of financing constraints has fostered the implementation of policies to either directly address equity gaps or indirectly support the development of private investment channels (Hulsink and Scholten, 2017; Manigart and Khosravi, 2024). One prominent example of such interventions is government venture capital (GVC; Crawford et al., 2024). However, in comparison to private VC, the results on firm performance of government financing are more mixed (Grilli and Murtinu, 2014). Firms receiving GVC funding have been found to exhibit lower productivity and weaker exit performances than privately funded companies (Alperovych et al., 2015; Cumming et al., 2017). These performance differentials are often attributed to contrasting investment objectives. While private VC is primarily profit and exit driven, public VC typically pursues broader development goals such as regional development or employment generation (Leleux and Surlemont, 2003; Tykvová, 2018).
SMEs can benefit from a broad suite of public financial supports. Government-backed loan schemes, grants and R&D subsidies have been linked to improved firm outcomes including employment, turnover, innovation, and capital expansion (Cowling and Dvouletý, 2023; Cravo and Piza, 2019; Dvouletý et al., 2021). Indirect financial supports such as government loan guarantees have also proven effective in addressing SME financing gaps (Cowling, 2010). These guarantees reduce risk for lenders (Cowling et al., 2025), encouraging credit flow to smaller and younger firms. Post-loan performance analysis reveals positive effects on sales growth, asset accumulation and employment (Bertoni et al., 2023). Furthermore, non-financial supports play a critical role in improving SME performance. Management advice, mentoring and training have been positively associated with sales and employment growth, especially when combined with financial assistance (Åstebro and Serrano, 2015; Park et al., 2020), highlighting the benefits that can be achieved from availing of one or multiple forms of business support. Despite extensive policy experimentation, empirical evidence on the effectiveness of business supports remains mixed and often context-specific. While some studies report positive effects on employment and turnover (Cowling and Dvouletý, 2023; Cravo and Piza, 2019), others identify only limited or short-term gains, with outcomes varying by firm size, sector and implementation design (Decramer and Vanormelingen, 2016; Dvouletý et al., 2021). Evaluations of tax-based investment incentives are particularly inconclusive: some highlight improved access to finance (Cicchiello et al., 2019), whereas others find negligible or even negative impacts due to poor targeting or substitution effects (Bergner et al., 2017; Denes et al., 2023). These mixed findings underscore the need for robust, firm-level analyses such as the present study to better understand how and when tax-supported investment translates into improved performance.
Investment incentives have existed for over a century (Pigou, 1920), they are widely used today as policy instruments to promote investment and influence investor behaviour (OECD, 2022). A key distinction within tax incentive policy lies between the statutory definition; concerning the intentions of policy makers, and the effective definition; determining the effect of incentives granted (Zee et al., 2002). This distinction illustrates a concern in the literature that incentives can fail to deliver the intended effects on the market. Although tax incentives are among the most widely used fiscal instruments to support early-stage financing (Harrison et al., 2020), evaluations of their effectiveness on recipient firms remain inconclusive (Bergner et al., 2017). In particular, the lack of firm-level studies that isolate performance impact following tax-incentivised investment leaves a critical gap in both the academic and policy literature. Recent reviews acknowledge this gap and call for post-receipt performance analysis and the evaluations of tax incentive effectiveness, both on firm specific, and macroeconomic levels (Cicchiello et al., 2019; Thomas, 2007). To address these concerns, researchers have proposed transferable metrics for assessing firm-level outcomes. Tavares-Lehmann et al. (2016) outline a framework of indicators, including revenue growth, and job creation, as benchmarks for evaluating tax incentive effectiveness. Although the application of incentives varies across jurisdictions and stakeholders, we adapt the indicators presented in Figure 1 to guide our empirical analysis. These metrics are particularly relevant to the current study seeking to evaluate whether EIIS investee firms exhibit improved performance.
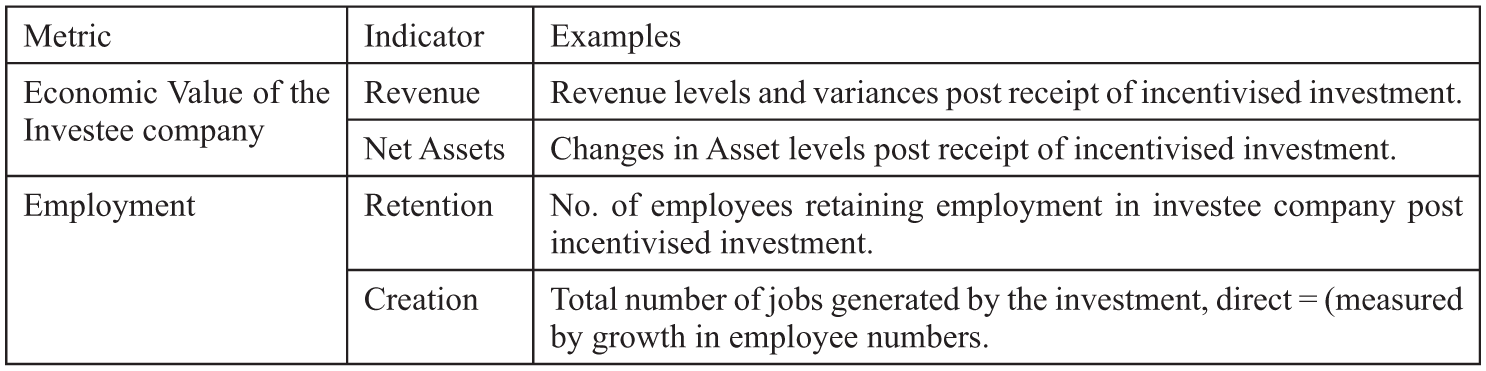
Potential metrics for measuring success of incentives.
Theorising the effect of tax-incentivised investment receipt: development of hypotheses
Building on the insights from the preceding literature, this section develops a theoretical framework and formal hypotheses for empirical testing. The RBV of the firm (Barney, 1991; Penrose, 1959; Wernerfelt, 1984), posits that a firm’s competitive advantage depends on its possession of, valuable, rare, imperfectly imitable and non-substitutable resources (Barney, 1991). Consistent with Alvesson and Sandberg (2011), our theorising adopts a problematisation approach by questioning taken-for-granted assumptions within existing theory. Prior SME-policy research frequently assumes that alleviating resource constraints directly enhances firm performance. We problematise this assumption by integrating the RBV, which emphasises resource possession, with the DC framework, which focuses on the managerial capacity to deploy and adapt resources effectively. This lens enables us to explore why the outcomes of tax-incentivised investment may vary across firms. However, criticism of the application of this framework within business support studies has led to extensions of the RBV, notably incorporation of the DC perspective (Brown and Mawson, 2016). Within DC framing, the ability of a firm to ‘integrate, build and reconfigure internal and external competencies’ is deemed crucial for sustaining a competitive advantage (Teece et al., 1997). In this context, access to equity capital provides recipient firms with valuable resources (Ireland et al., 2003) that have previously been limited due to funding limitations. In addition, the firm’s ability to deploy these financial resources is highlighted as a critical factor for growth prospects. (Grant, 1991; Sirmon and Hitt, 2003).
While early iterations of the RBV emphasise the importance of resource possession, the DC perspective shifts attention to how firms leverage and manage resources over time (Eisenhardt and Martin, 2000; Teece, 2014). Within this framework, the effectiveness of tax-incentivised investment, such as that provided by the EIIS, depends not solely on the receipt of external capital, but on the firm’s capacity to deploy that capital strategically. Performance heterogeneity among EIIS-supported firms thus reflects differences in DC rather than differences in access to funding per se (Eriksson, 2014; Schilke, 2014). This distinction is particularly relevant in our context, where the scheme reduces financial constraints, but outcomes vary depending on firms’ ability to integrate new resources into their operations (Newbert, 2007; Sirmon et al., 2007). This view is consistent with the argument that SMEs must tailor resource allocation practices to evolving business conditions to sustain long-term growth (Fainshmidt et al., 2017; Teece, 2012). It is important to acknowledge that the magnitude of these effects is unlikely to be uniform across all firms. Prior research suggests that sectoral capital intensity, firm age and managerial experience can shape how external equity is absorbed and deployed (Cowling and Dvouletý, 2023; Hernández-Linares et al., 2021). Younger firms or those operating in capital-intensive sectors may experience stronger growth effects but also greater volatility, while mature firms may channel funding towards consolidation rather than expansion (Colombo and Grilli, 2005; Vanacker et al., 2017). Although testing these conditional effects lies beyond the present study’s scope, recognising such heterogeneity provides a richer context for interpreting the hypotheses that follow.
Investor-oriented tax incentives such as EIIS are designed not only to ease financing constraints but also to attract investors who can deliver value-added benefits such as expertise, governance oversight, and network access, commonly referred to as smart capital (Berger and Gottschalk, 2025). In RBV terms, such investors can augment the bundle of valuable, rare, and inimitable resources available to the firm, while from a DC viewpoint, they may strengthen the firm’s ability to integrate and reconfigure those resources effectively. However, in the Irish EIIS model, the primary channel remains financial patient capital, with fewer structural mechanisms to ensure post-investment engagement, helping to explain why strong growth effects can occur without equivalent improvements in profitability or survival.
Programmes such as the EIIS target investors rather than subsidising firms directly because they harness private risk-bearing capacity, which public agencies cannot easily replicate. Investor-side relief encourages the supply of equity capital from individuals with the skills and networks to complement financial resources with so-called value-added investors (Berger and Gottschalk, 2025). This design also affects the firm’s capital structure and innovation incentives, as replacing debt with equity can lower default risk and enable more exploratory investment decisions (De Bettignies and Brander, 2007; Winton and Yerramilli, 2008). At the same time, differing objectives may emerge, investors often prioritise scalable returns, whereas founders may value employment or long-term expansion. Recognising these behavioural and financial trade-offs helps explain why the EIIS relies on investor engagement to mobilise capital while limiting direct state intervention, aligning with the broader policy aim of fostering private ‘smart capital’ that supports both growth and capability development. From an RBV perspective, capital facilitated by the EIIS can be seen as a valuable resource that can be leveraged to support growth (Barney, 1991; Sirmon and Hitt, 2003). From a DC perspective, the improvements post receipt of such investment depends on the ability to deploy this capital for strategic advantages (Teece, 2012). In this case, the increase in employee numbers may reflect a firm’s effective use of capital (Hernández-Linares et al., 2021), and prior research shows that employment is often among the first areas influenced by tax-incentive receipt (Guceri, 2018; Xue et al., 2024). Further, growth intentions, particularly regarding employee numbers, often motivate firms to seek support (Mole et al., 2017). These insights support our first hypothesis.
H1: Firms receiving EIIS investment are more likely to increase employment numbers compared to non-recipients.
Access to equity, such as that facilitated by the EIIS, can alleviate financial constraints and enable firms to pursue revenue-enhancing activities (Hottenrott and Richstein, 2020). Coordinating capabilities that focus on the ability to deploy resources into new operational activities can be a key enabler for revenue growth with empirical evidence suggesting that firms with strong DC, achieve higher sales (Fainshmidt et al., 2016). Complementary to this view, research on tax incentives demonstrates that incentive receipt is associated with revenue increases (Dechezleprêtre et al., 2023; Ding, 2024; Liu and Mao, 2019; Picas et al., 2021). Further, Antcliff et al. (2021) posit that revenue growth and new product development ambitions frequently motivate SMEs to avail of certain support mechanisms. Moreover, EIIS guidance outlines that eligible uses of funding include stock acquisition and expansion to business premises (Revenue Commissioners, 2024). These activities can be tied to revenue generation and serve as a direct means of increasing income. In comparison to alternative institutional investment schemes that may be tied to innovation-specific activities, the EIIS provides recipient companies with flexibility to respond to operational needs and avail of market opportunities. These findings support the following hypothesis.
H2: Firms receiving EIIS investment are more likely to experience an increase in revenue compared to non-recipients.
Labour productivity, commonly measured as revenue per employee (Alon et al., 2018), represents a key performance metric often used to measure firm-level efficiency and resource allocation (Hernández-Linares et al., 2021). From a DC perspective, improvements in productivity stem from the ability to orchestrate resources to extract maximum value (Fainshmidt et al., 2017; Teece, 2012). Recent research reports a positive post-investment trend in productivity amongst SMEs availing of tax breaks (Cui et al., 2025). In the context of the EIIS, Revenue Commissioners (2024) Guidance confirms that funding may be used for the purchase of fixtures, fittings, plant and machinery. These investments can improve the efficiency of the production process. When considered alongside the working capital applications of the scheme such as stock acquisition, the EIIS provides firms the opportunity to mobilise tangible resources that can support both operational capacity as well as productivity gains. These findings, when viewed through the RBV and DC lenses, suggest that EIIS funding, if deployed effectively, may enable firms to achieve greater labour productivity. Therefore, we propose the third hypothesis for this study below.
H3: Firms receiving EIIS investment are more likely to experience an increase in labour productivity compared to non-recipients.
Profit is not generated from the possession of financial resources, but their effective mobilisation towards strategic objectives (Grant, 1991). This view aligns with arguments that management of resources is vital for achieving superior performance. In line with this proposal, mixed empirical evidence linking tax-incentive receipt to profitability is unsurprising. Earlier studies offered inconclusive findings on the link between tax incentives and profit (Czarnitzki et al., 2011). Boyns et al. (2003) found positive profitability trends amongst firms receiving incentivised investment. Noabaly, Cowling et al. (2008) propose that profitability may initially decline post-investment, before stabilising and improving, reflecting a lag between capital deployment and financial return. The EIIS provides structural features that support profitability improvements. In contrast to debt financing, the EIIS does not require interest payments, thereby enabling cash flow to be invested into revenue-enhancing activities. Furthermore, the capital stability facilitated by the scheme can enable firms to undertake strategic projects without short-term financial pressure. These features facilitate the effective use of resources consistent with RBV and DC theories, emphasising the importance of not just resource acquisition, but deployment (Sirmon et al., 2007). In light of these findings and the trends identified in hypotheses 1–3, we propose the following hypothesis.
H4: Firms receiving EIIS investment are more likely to have higher profitability compared to non-recipients.
Firm survival is a core concern for SMEs, particularly to firms that are younger and more resource constrained (Lee et al., 2022). DC have been recognised as essential to survival, enabling firms to reconfigure resources to respond to changing environments (Weaven et al., 2021). Public financial interventions, including tax-incentivised equity schemes like the EIIS can improve firm resilience by alleviating financial stress and supporting operational stability (Dvouletý et al., 2021). Business supports are often concentrated on smaller firms with fewer resources (Antcliff et al., 2021). In this context, EIIS investment can perform a stabilising function, strengthening liquidity (Boyns et al., 2003). Similarly, Nicolas (2022) shows that external equity can help SMEs avoid liquidity issues, preventing the possibility of bankruptcy. This is particularly relevant for firms with limited financing alternatives, where such funding gaps could lead to financial distress and failure (Gupta and Gregoriou, 2018). These insights suggest that tax-incentivised equity, once integrated appropriately, may enhance SMEs survivability by improving liquidity. Therefore, we propose the final hypothesis below.
H5: Firms receiving EIIS investment are more likely to survive than non-recipients.
Data and methodology
This study draws on two principal data sources. First, information regarding companies that received investment through the EIIS for the period 2011–2019 was obtained from the Irish Tax and Customs (Revenue Commissioners, 2024) publication of beneficiaries. 1 These records provide firm-level details, including the years in which the EIIS investment was received, the amount of funds raised, and other identifying information such as company names and registration numbers. Second, firm-level financial and performance data were collected from the FAME database operated by Bureau van Dijk Moody’s and is an accepted and established record of financial evaluation in entrepreneurial finance research (Vanacker et al., 2017). FAME provides standardised financial statements and additional firm-level characteristics, such as industry classification, location, director information and incorporation date. By merging the EIIS beneficiary list with FAME’s historical financial records, we constructed a dataset capturing both ‘treated’ and ‘untreated’ (control) firms from 2011 onwards. The evaluation horizon covers up to 5 years post-investment, consistent with the EIIS’s structural design, which requires investors to retain their shares for a minimum of four years. This observation window, therefore, captures the medium-term period in which firms are expected to deploy capital and report measurable outcomes. Similar evaluation horizons have been applied in prior assessments of investment-based policy interventions (Bonini et al., 2019; Boyns et al., 2003; Cowling et al., 2008).
Sample construction
We begin with the full population of firms listed by the Irish Revenue Commissioners as EIIS recipients between 2011 and 2019 (N = 703). Then, using company identifiers, we match these firms to the FAME database to obtain historical financial statements and firm-level characteristics. Successful matches were obtained for 627 EIIS firms, representing approximately 89% of all EIIS investees during this period. The remaining EIIS firms could not be matched due to missing financial filings, incomplete identifiers, or the absence of available historical accounts; however, a comparison of matched and unmatched EIIS firms indicates no material differences in sectoral composition or incorporation age, suggesting that the analytical sample is broadly representative of the EIIS population with available data. To compile the control pool, we extract 13,500 non-EIIS Irish SMEs from FAME, restricting the initial set to firms operating in the same four broad sectoral groupings as EIIS firms, and with comparable size and age characteristics. This pre-screening step ensures feasible common support by limiting extreme heterogeneity before formal matching. Sector, firm age, and total assets (the most widely reported size measure in FAME) serve as the initial filtering criteria, consistent with best practice in policy evaluation studies (Cowling et al., 2008). We also winsorise key financial variables at the top and bottom 1% to reduce the influence of outliers. To ensure comparability, we verified that all potential control firms met standard SME eligibility thresholds relating to size (employees, total assets and turnover), and that none had previously received institutional equity such as VC funding. This confirms that the control pool consists of firms that would have been eligible to apply for EIIS in principle, thereby providing an appropriate counterfactual group for matching.
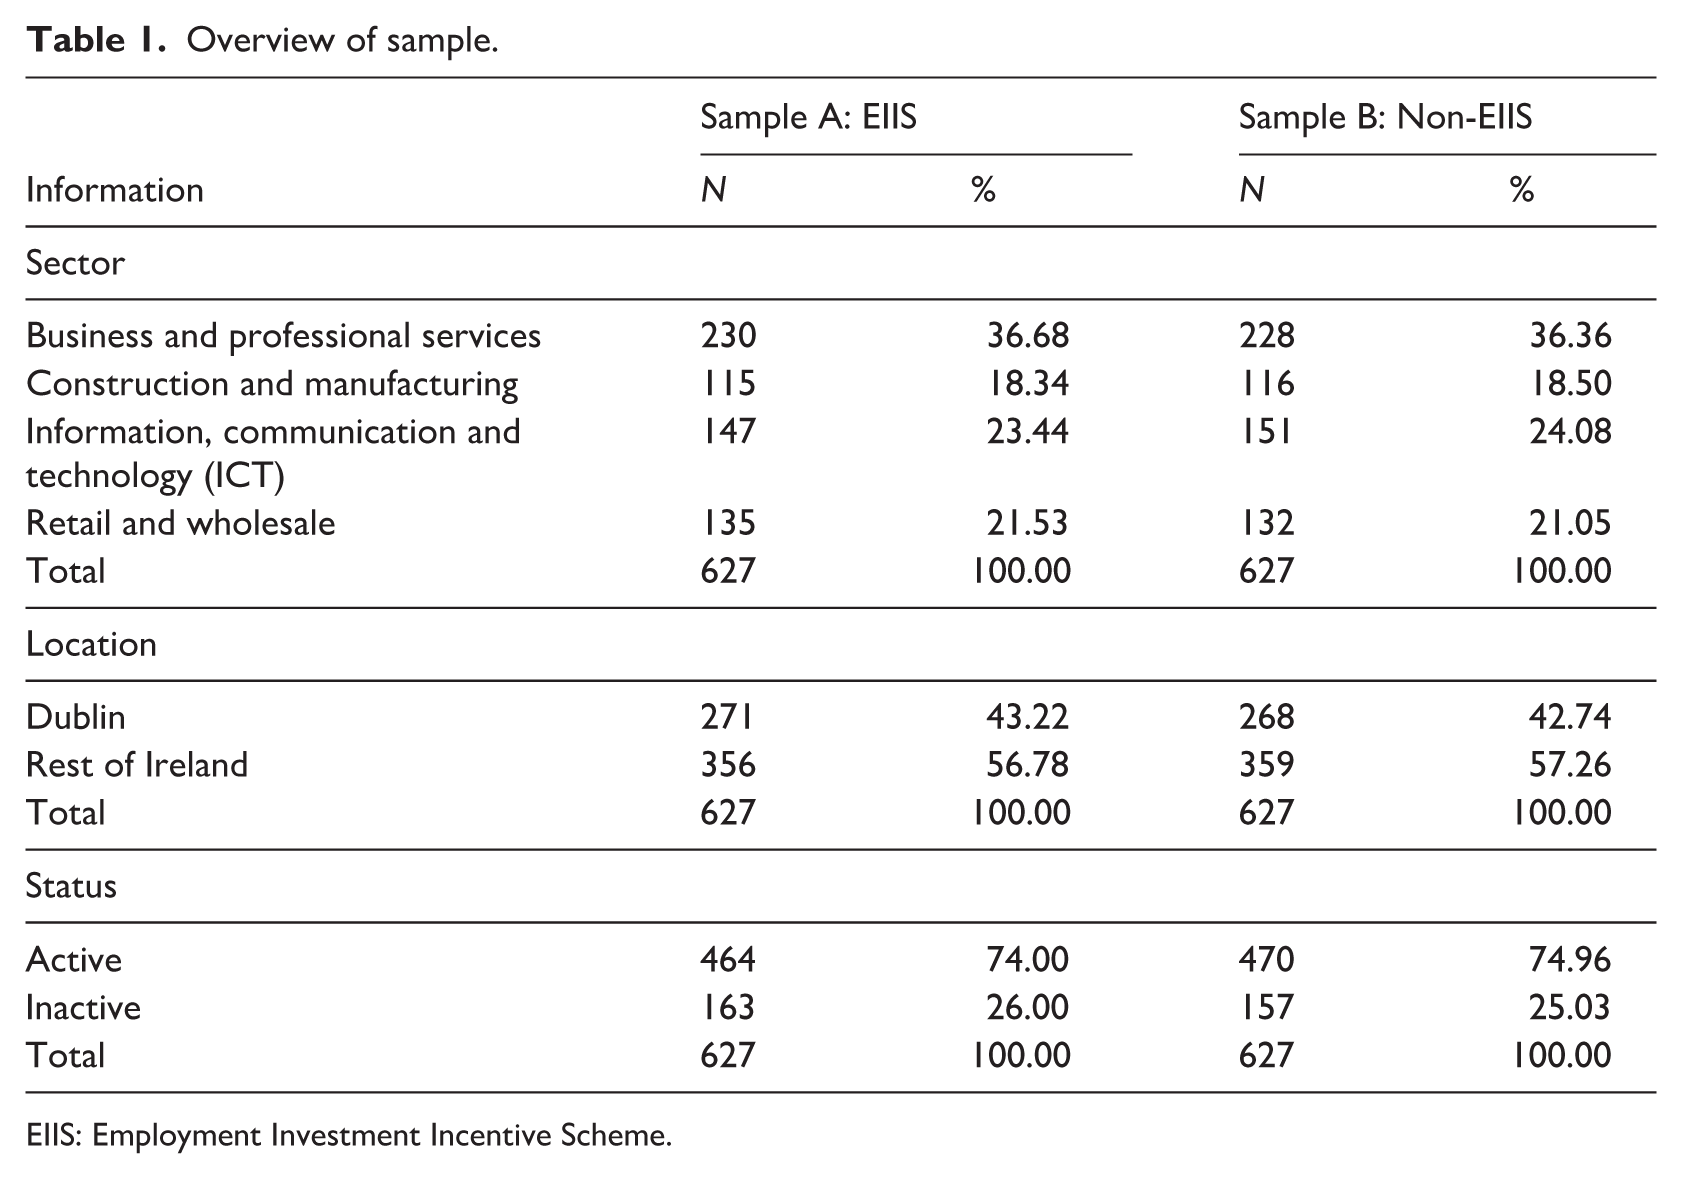
This process yields a combined dataset of 627 EIIS firms and a pre-screened pool of 13,500 non-EIIS SMEs. These firms form the basis for the propensity score matching (PSM) procedure described in the next subsection, which produces a final matched panel of 627 treated firms and 627 control firms. This matched panel is then used throughout the empirical analysis to evaluate the effects of EIIS participation on firm-level outcomes over time. A comparison of matched and unmatched EIIS firms indicates no material differences in sectoral distribution, firm age or incorporation year, suggesting that the analytical sample is broadly representative of the EIIS population with available financial records. An overview of both groups can be found in Table 1.
Overview of sample.
EIIS: Employment Investment Incentive Scheme.
Key variables and measures
We employ five primary outcome measures, reflecting multiple dimensions of a firm’s post-EIIS performance. The first variable we examine is the number of employees within the firm, serving as an indicator of growth and job creation. Similar to Cowling and Liu (2023), employment levels are frequently used to measure the real economy impacts of SME support policies. Second, we measure Revenue as the total annual turnover reported by each firm. Revenue provides an indication of market traction and overall business activity. An increase in revenue suggests improved competitiveness and commercial viability. As per Hosono et al. (2023), we also include Labour Productivity, which is classified as revenue per employee. To account for profit generation relative to firm size, we employ Return on Assets (ROA), calculated as net income divided by total assets. While total assets are included among the pre-treatment matching covariates, ROA is used exclusively as a post-treatment outcome, and all regressions include firm fixed effects. This implies that the matching procedure does not mechanically influence ROA estimates, as fixed effects absorb all time-invariant firm size differences and identification derives from within-firm changes over time. Finally, we assess Survival rates, which is consistent with Carpentier and Suret (2007). This approach aligns with prior SME finance studies that use ROA to mitigate issues arising from heterogeneity in firm size (Cowling et al., 2008). By tracking these measures, we capture both top-line performance (revenue), operational scale (employee growth) and overall financial health (profitability; Banerjee, 2014) as well as survivability (Chiappini et al., 2022).
Our core explanatory variable is an indicator of whether a firm received EIIS investment during the period 2011–2019. This binary measure takes the value of one if the firm appears in the Revenue Commissioners’ list of EIIS beneficiaries at any point in the sample window and zero otherwise. This coding enables us to compare the trajectory of ‘treated’ firms against those that never received EIIS funding, thereby isolating potential policy-induced effects on firm performance.
To account for other factors that may influence firm performance, we incorporate an array of firm-level and industry-level controls, beginning with firm age, measured as the number of years since incorporation, to capture the distinct growth trajectories younger firms may follow compared to more established counterparts (Colombo and Grilli, 2005). We then include firm size, proxied by total assets, to control for scale-related advantages or constraints that could influence performance outcomes. Next, we add sector indicators to account for industry-specific differences, recognising that certain sectors, particularly those that are technology-intensive, may exhibit higher growth potential or require more external financing. We also include geographic location variables, distinguishing between Dublin and outside of Dublin, to reflect potential variations in local economic conditions or cluster effects. Finally, because financial health can significantly affect performance, we incorporate liquidity and gearing ratios to capture liquid assets and levels of debt, respectively, thereby providing a more comprehensive view of each firm’s capacity to sustain and finance its operations (Kobayashi, 2014).
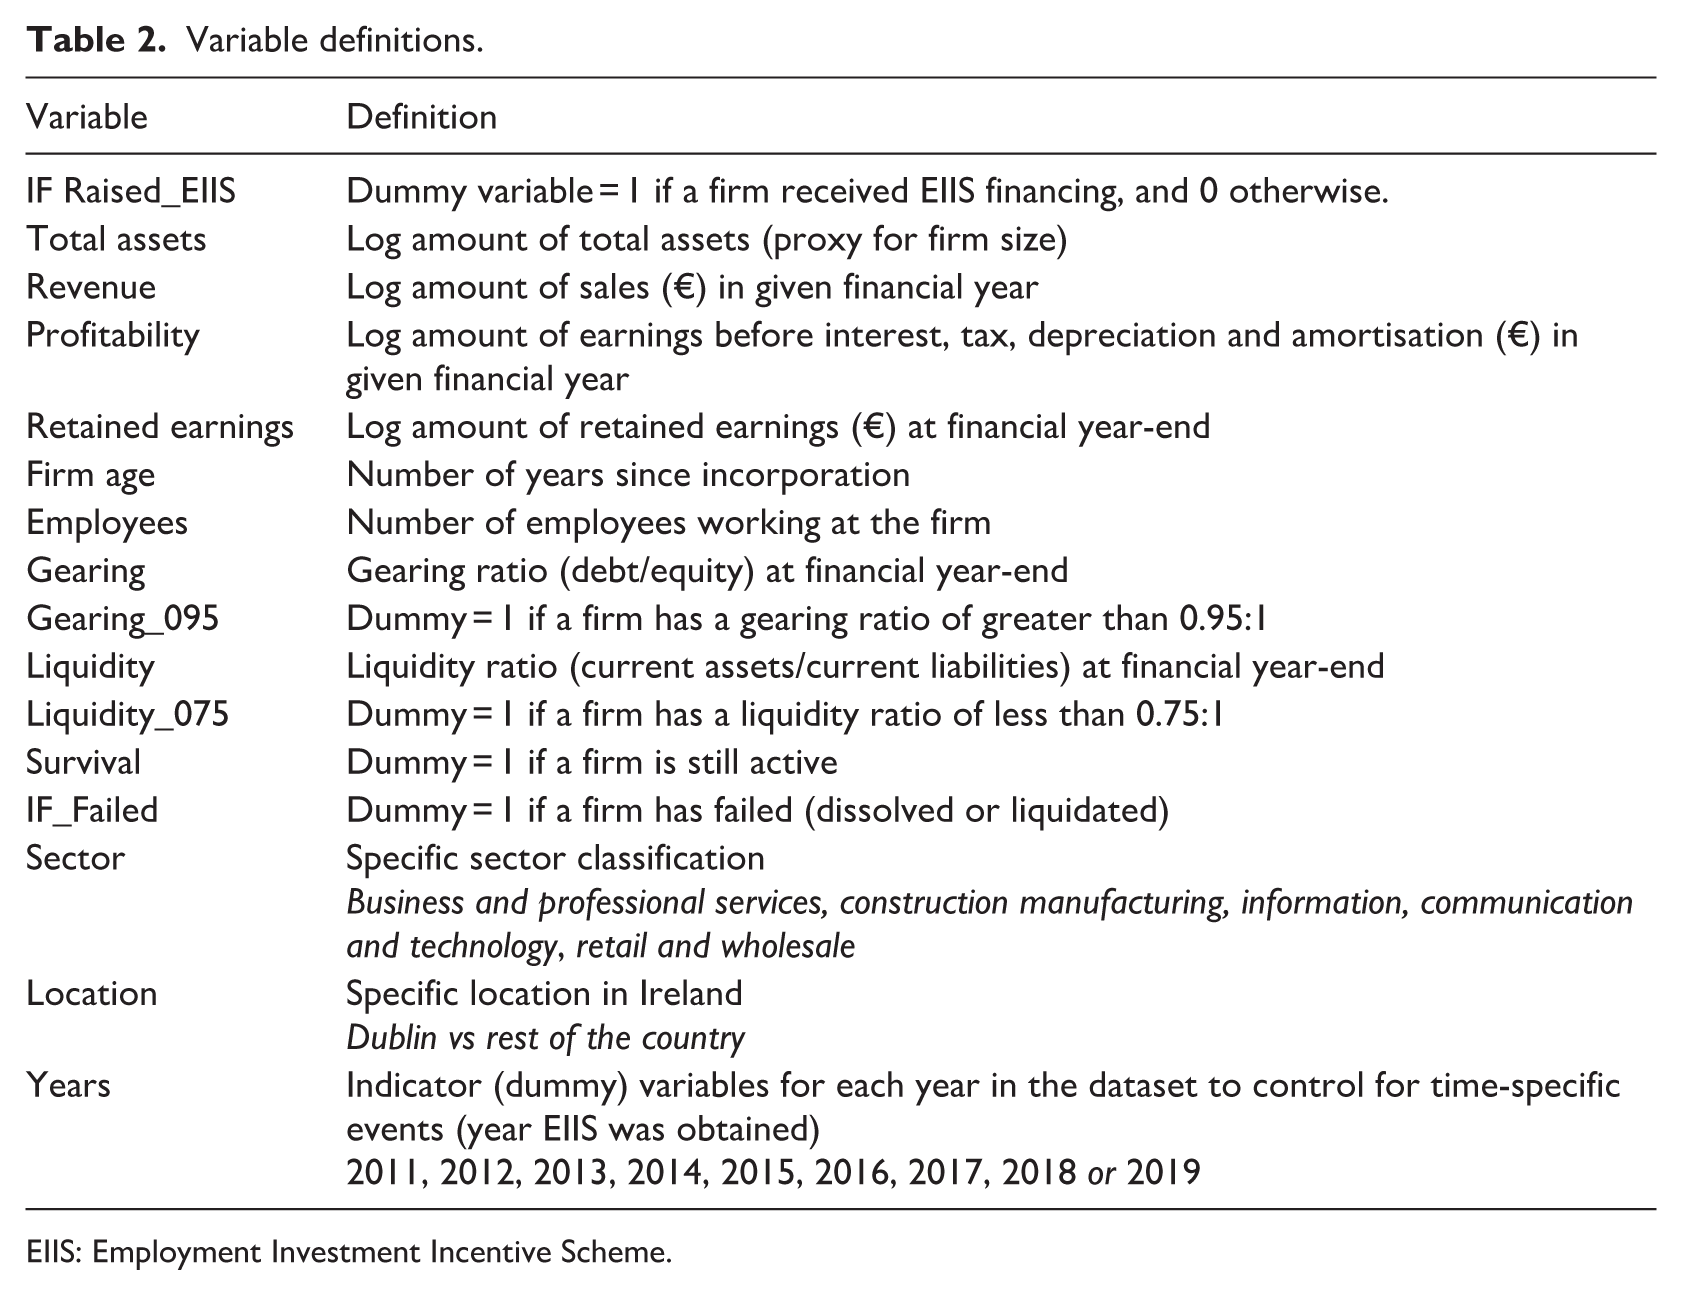
These control variables are included in all empirical specifications to help isolate the effect of EIIS participation from other firm-level determinants of performance. A complete description of all variables, along with their definitions, is summarised in Table 2.
Variable definitions.
EIIS: Employment Investment Incentive Scheme.
Descriptive statistics
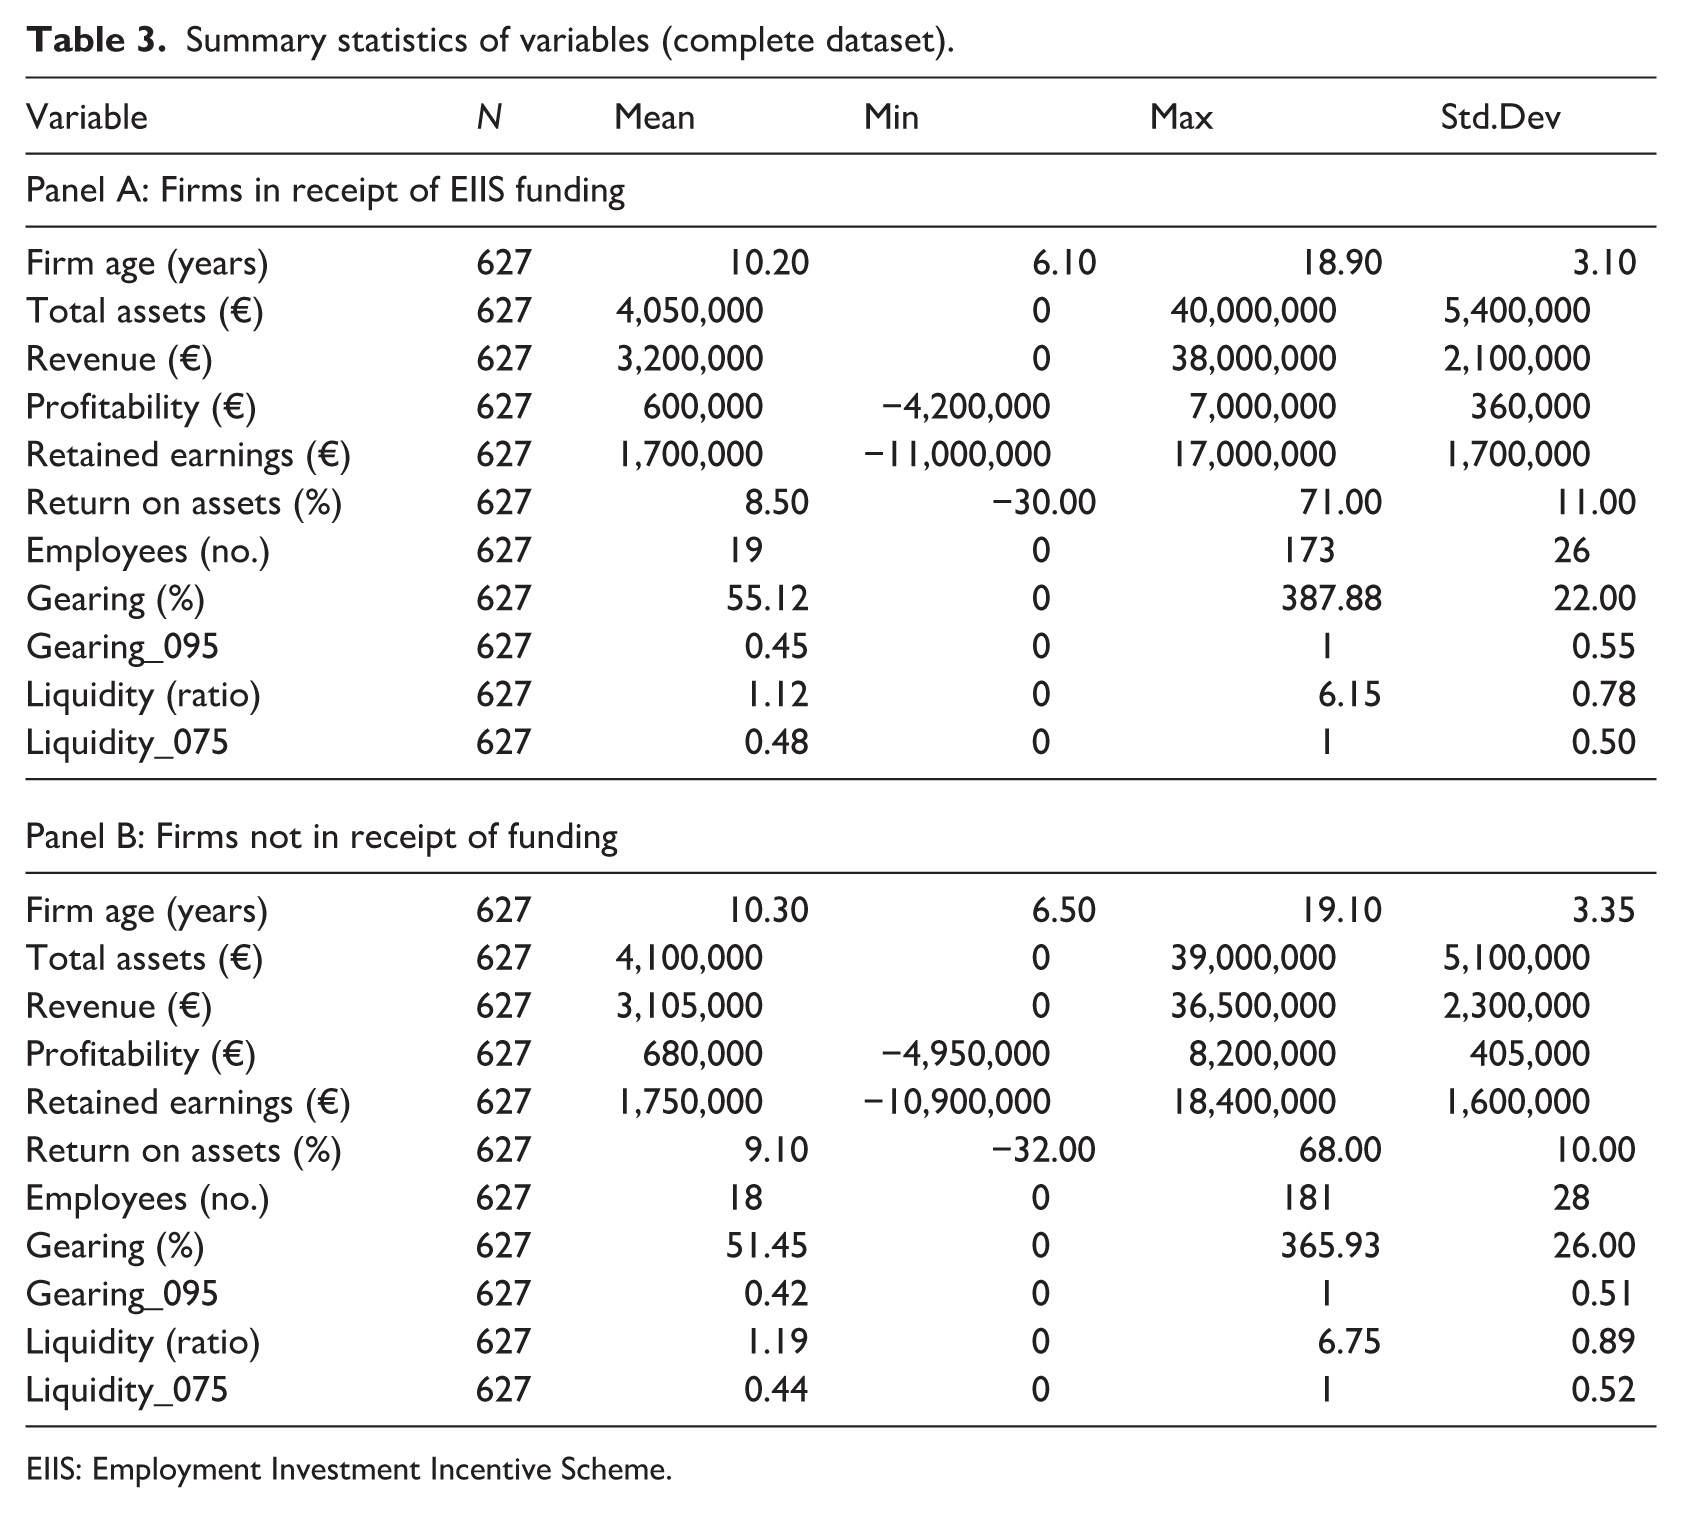
Table 3 (summary statistics) compares 627 EIIS recipients with 627 propensity-score-matched non-recipients with some patterns standing out. Although the two groups are balanced ex-ante on assets (mean log assets ≈ €4 m) and revenue, EIIS firms display slightly lower mean profitability (€0.60 m vs €0.68 m) and retained earnings, and markedly higher leverage (gearing 55% vs 51%). In other words, the scheme targets firms that are not obviously distressed. Liquidity ratios are similar, but they operate with smaller internal buffers and greater reliance on debt finance. Pre-investment headcount is modest (mean 19 employees, median ≈ 11) with large dispersion (σ = 26; max = 173). Combining these numbers with revenue implies a baseline labour productivity of roughly €168k per worker. Business and professional services (37%) and Information, communication and technology (23%) dominate both samples, while over 40% of firms are Dublin-based. Because sampling weights are identical across columns, subsequent outcome differences are unlikely to be driven by sector or location composition.
Summary statistics of variables (complete dataset).
EIIS: Employment Investment Incentive Scheme.
Propensity score matching
Given the non-random nature of EIIS participation, we employ a two-step matching approach to construct a comparable control group. In the first step, we compile a broad pool of 13,500 non-EIIS firms from FAME and pre-screen them on sector, firm age and firm size (proxied by total assets) to approximate comparability with treated firms. This pre-screening limits extreme heterogeneity before matching. In the second step, we apply PSM within this filtered subset, matching each EIIS-recipient firm to a non-recipient with a similar propensity score based on observable firm characteristics. This produces a one-to-one matched sample of 627 treated and 627 control firms. As an additional robustness test, we replicate the analysis using coarsened exact matching (CEM), which yields a comparable matched sample and produces consistent results (Supplemental Appendix Table A1).
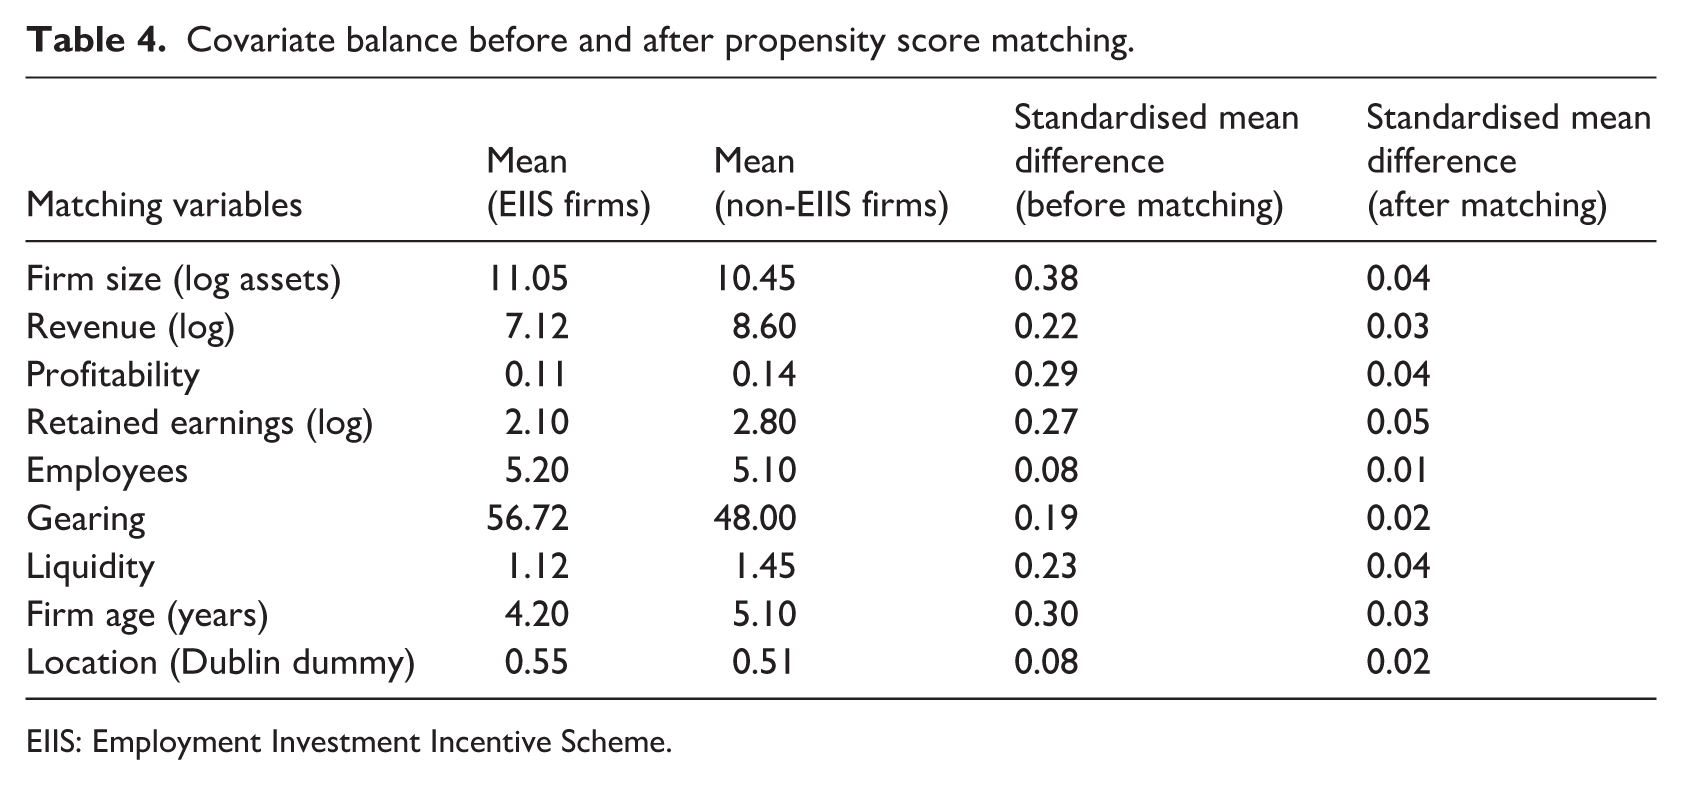
To assess the effectiveness of the matching procedure, we compare pre- and post-matching differences in the baseline covariates. Table 4 presents descriptive statistics and standardised mean differences for the matched and unmatched samples. Prior to matching, several firm characteristics, particularly size, liquidity, gearing and sectoral distribution, differed greatly between EIIS recipients and non-recipients. After applying PSM, however, all standardised mean differences decreased substantially, falling below the common threshold of 0.10. This improvement in balance indicates that the matched, treated and control firms are more comparable along the observed dimensions, lending greater credibility to subsequent analyses of EIIS impacts. Matching is performed using firm characteristics measured strictly in the pre-treatment period, ensuring that only information available before EIIS receipt influences the construction of the control group.
Covariate balance before and after propensity score matching.
EIIS: Employment Investment Incentive Scheme.
In addition to sector, total assets and firm age, the matching procedure also incorporated location (Dublin vs rest of Ireland) as a covariate, ensuring that regional financing differences were balanced between treated and control firms (see Table 1). The post-match balance statistics confirm that geographic location is not a determinant. While data on firms’ prior access to other external financing instruments is unavailable, EIIS investees are typically early-stage, unquoted SMEs with no previous institutional equity participation. Screening during data compilation excluded firms with prior venture capital or public market investment to further limit bias from pre-treatment financing history. We emphasise that no pairwise matching was conducted prior to estimating propensity scores; the initial filtering of the 13,500-firm control pool was performed solely to ensure feasible common support on sector, size and age before implementing one-to-one nearest-neighbour PSM. The resulting matched sample provides a basis for identifying the treatment effect of EIIS funding. By focusing on firms with similar observable attributes, we reduce the risk that any measured performance differentials are driven by pre-existing differences rather than by EIIS participation itself. We build on this matched sample to implement our staggered DiD estimation. As matching is used solely to construct a comparable sample and all treatment effects are estimated within a fixed-effects DiD framework, the Abadie and Imbens (2016) correction for matching estimators is not required in that standard errors are clustered at the firm level, following common practice in matched-panel DiD designs.
As a robustness check, we also construct an alternative matched sample using CEM applied to the full pool of 13,500 non-EIIS firms. CEM produces a sample closely aligned to the PSM results, with very similar balance statistics and treatment effects (Supplemental Appendix 1). This provides additional assurance that our results are not sensitive to the choice of matching algorithm.
Estimation strategy
To address our central research question, we adopt a two-stage econometric approach. First, we employ a staggered DiD framework to estimate the impact of EIIS on key performance outcomes. Studies have suggested that when firms adopt a policy like EIIS at different times, standard two-way fixed effects approaches can produce misleading results, especially if the programme’s impact varies across cohorts or over time. To address these issues, we draw on newer methods from Callaway and Sant’Anna (2021) and Sun and Abraham (2021), which break down the overall treatment effect by looking at each group of adopters at each point in time. This helps prevent the outcomes of early adopters and late adopters from being grouped together. Callaway and Sant’Anna (2021) use matching or regression adjustments to build group-specific counterfactuals, while Sun and Abraham (2021) propose an event-study setup that filters out confounding variation between different cohorts. By using these methods as our main strategy, we gain a clearer and more accurate view of how EIIS truly affects firms when adoption is staggered. Second, we employ a battery of robustness checks to validate our initial results using the staggered DiD. As firms receive EIIS at different points during our sample window (2011–2019), we adopt a staggered DiD framework. This approach acknowledges that there is no single ‘treatment date’ for all firms and mitigates the well-documented biases of standard two-way fixed effects models when treatment times vary across units. EIIS treatment is a time-varying indicator that switches from 0 to 1 in the first year a firm receives EIIS funding and remains 1 thereafter; as firms receive EIIS at different points between 2011 and 2019, treatment timing is staggered across the sample.
Our core specification focuses on five main outcome variables, employment, revenue, labour productivity, ROA and survivability, each measured at the firm-year level. Yit represent one of these outcome variables for firm i in year t. We estimate a model of the following general form:
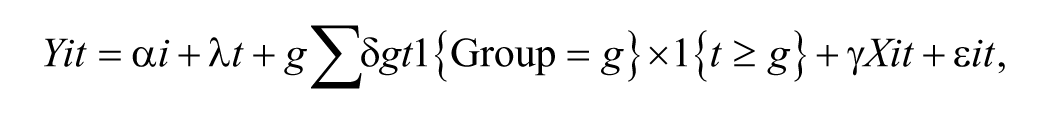
where αi is a firm-specific fixed effect, λt is a year fixed effect, and δgt captures the average treatment effect for firms that first received EIIS in year g. The term 1{Group = g} is an indicator that firm i belongs to the cohort treated in year g, and 1{t ⩾ g} indicates that we are observing the firm at or after its initial treatment. The vector Xit contains time-varying controls for firm age, size, liquidity, gearing and any relevant industry or geographic trends.
By distinguishing treatment cohorts according to the first year of EIIS uptake, we avoid conflating early- and late-treated firms in a single average treatment effect estimate. Instead, the staggered DiD framework allows for the estimation of group-specific average treatment effects, which can then be aggregated to obtain an overall effect of EIIS participation. Standard errors are clustered at the firm level to account for within-firm serial correlation over time. Both stages of our analysis rest on key identifying assumptions. For the logistic regressions, we assume that the firm-level controls adequately capture the primary factors influencing EIIS participation. In the DiD framework, the critical assumption is that, absent the EIIS, treated and untreated firms would have followed parallel trends in each performance outcome. While we cannot directly test this assumption, controlling for firm-level heterogeneity via fixed effects and incorporating time-specific effects and relevant covariates helps mitigate confounding influences. Further, the staggered adoption design ensures that firms are compared to appropriate control units that have not yet (or never) been treated at each point in time.
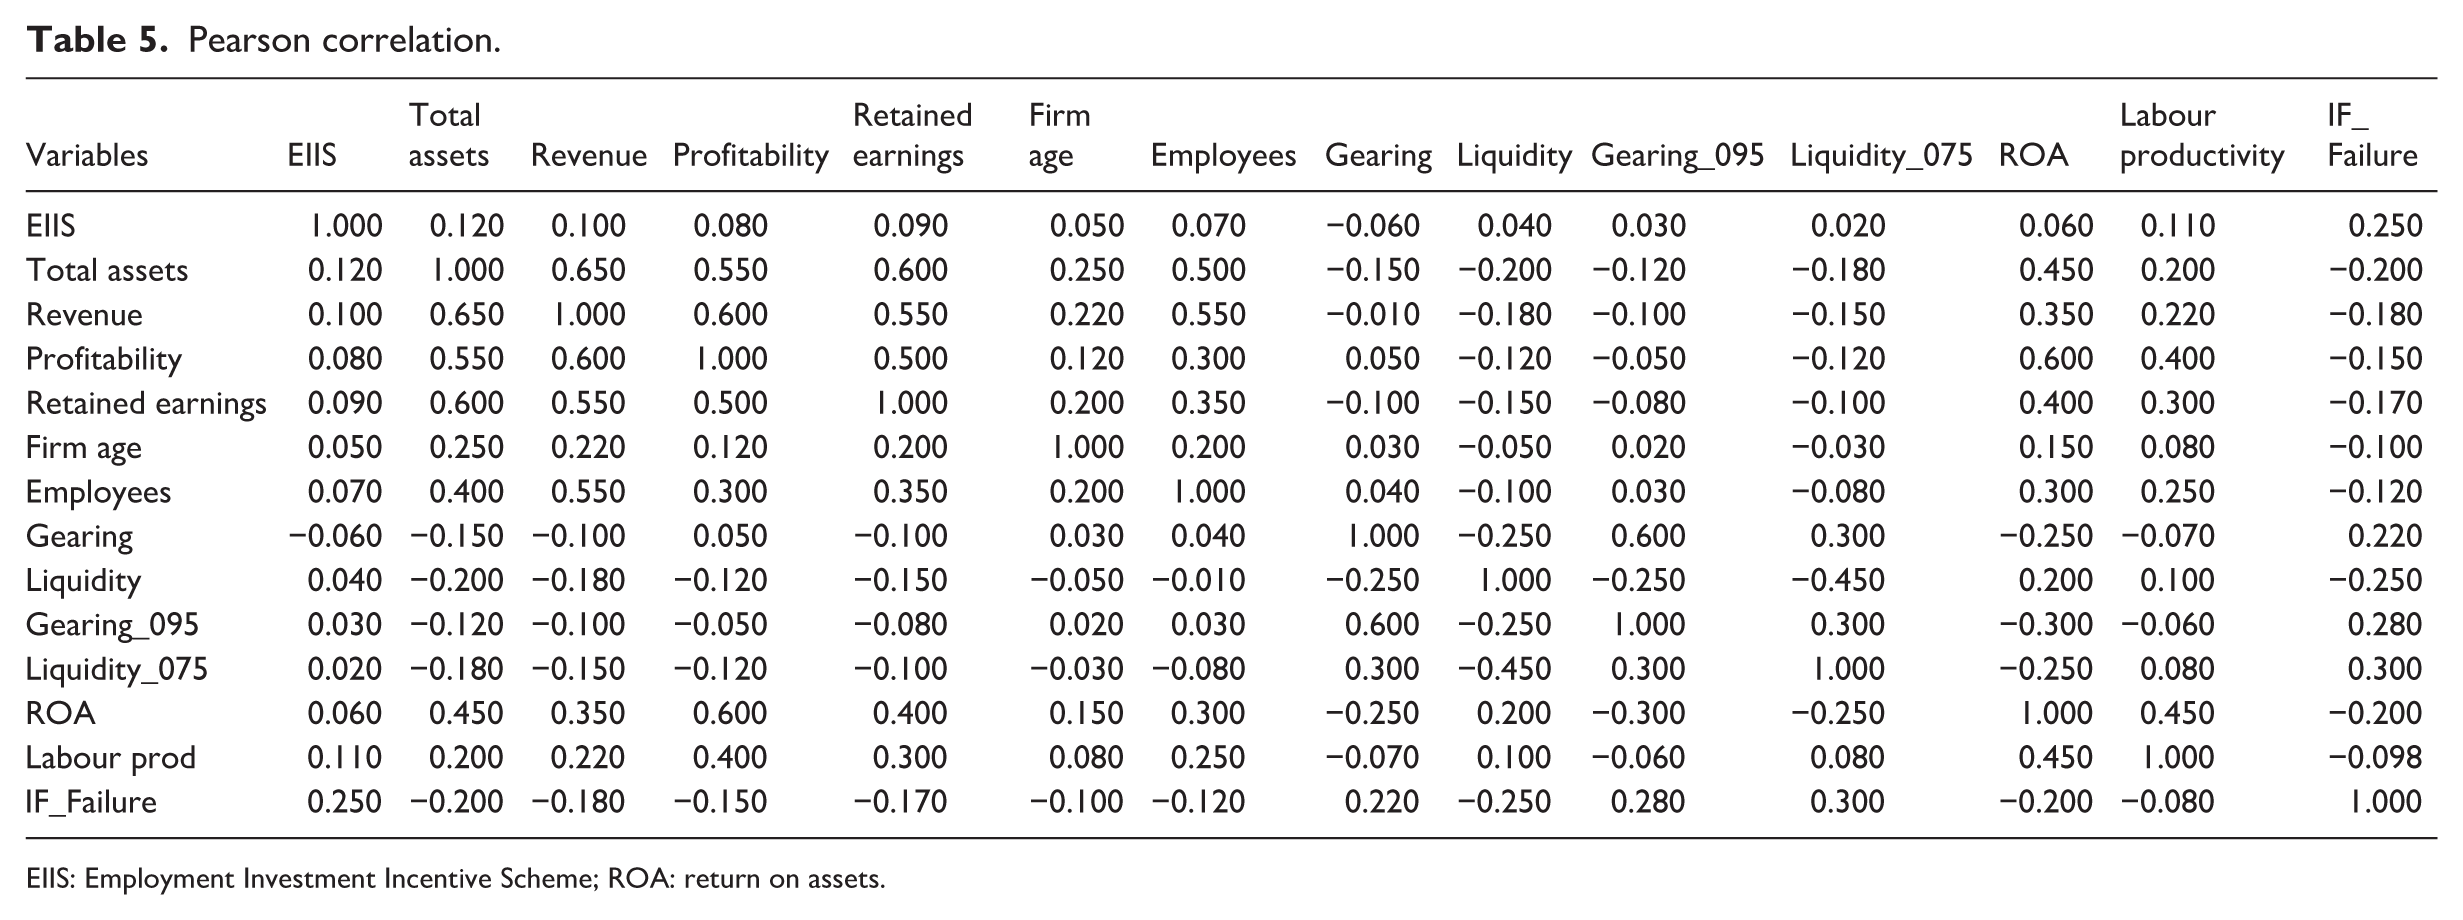
In summary, the staggered DiD strategy leverages variation in treatment timing to derive a more accurate estimate of the causal impact of the EIIS on firm employment, revenue, and profitability. An overview of the sample and variable definitions can be found in Tables 1 and 2. As an additional diagnostic, Table 5 presents a Pearson-correlation matrix for all variables used in the estimations. Pairwise correlations remain comfortably below conventional multicollinearity thresholds, supporting the assumption that the explanatory variables supply independent information and that collinearity is unlikely to bias the regression coefficients or inflate their standard errors. Table 4 presents the covariate balances before and after PSM. To benchmark our estimates, we also estimate a staggered DiD on the full unmatched sample of EIIS and non-EIIS firms. This avoids all matching assumptions and provides a direct comparison with the matched-sample estimates. To further assess identification validity, we follow Callaway and Sant’Anna (2021) and use an event-study specification to visualise pre-treatment dynamics. Supplemental Appendix Figures A1–A5 plots coefficients for t − 3, t − 2, and t − 1 relative to treatment, all of which cluster around zero and are statistically indistinguishable from each other. This provides additional support for the parallel trend’s assumption underlying the staggered DiD framework.
Pearson correlation.
EIIS: Employment Investment Incentive Scheme; ROA: return on assets.
Robustness checks
We note that the analyses reported in this section are designed solely to assess robustness and identification validity rather than to estimate heterogeneous treatment effects and that any exploratory subgroup patterns are discussed interpretatively in the ‘Discussion’ section and do not constitute separate heterogeneity models.
As an additional robustness check, we employ an event-study design by replacing the single post-treatment indicator with a series of leads and lags relative to the first year of EIIS funding for each treated firm. Specifically, we define t = 0 as the first year the firm receives EIIS, t − 1 as the year immediately prior, t + 1 as the year immediately after, and so on. By examining the years leading up to treatment, we can check whether treated and control firms followed comparable trajectories prior to EIIS. If outcomes diverge significantly before the point of treatment, it will raise concerns about the validity of the parallel trends assumption central to DiD methods. Therefore, by looking at the years after treatment, we can observe how quickly the effect of EIIS emerges and whether it persists, intensifies, or diminishes over time. This dynamic perspective offers insights that a simple pre versus post comparison cannot provide, thereby enriching our understanding of the EIIS’s influence on firm performance.
Supplemental Appendix 1 compares treatment effects across three alternative specifications: (1) the baseline PSM-matched sample, (2) a CEM-matched sample constructed from the full set of non-EIIS firms, and (3) the full unmatched panel using a plain staggered DiD. The magnitude and statistical significance of the treatment effects are highly consistent across all three specifications, indicating that our findings are not driven by the matching design or sample construction.
To assess the validity of the parallel-trends assumption, we estimate an event-study specification including three pre-treatment periods (T − 3, T − 2, T − 1). Supplemental Figures A1–A5 plot the dynamic treatment effects for all outcomes. Across all models, the pre-treatment coefficients are close to zero and statistically insignificant, indicating no systematic differences between EIIS and non-EIIS firms prior to investment. In Table 6, we additionally report a placebo pre-treatment coefficient (T − 1) for each outcome, all of which are small and insignificant, reinforcing the parallel-trends assumption. The post-treatment effects follow the dynamic patterns discussed above. These results provide strong support for the identification strategy underpinning our staggered DiD estimates. Together, the T − 1 coefficient reported in Table 6 and the T − 3 to T − 1 pre-treatment estimates shown in Supplemental Appendix Figures A1–A5 serve as formal placebo tests, all of which are statistically indistinguishable from zero.
Staggered DiD results for EIIS firms versus non-EIIS firms.
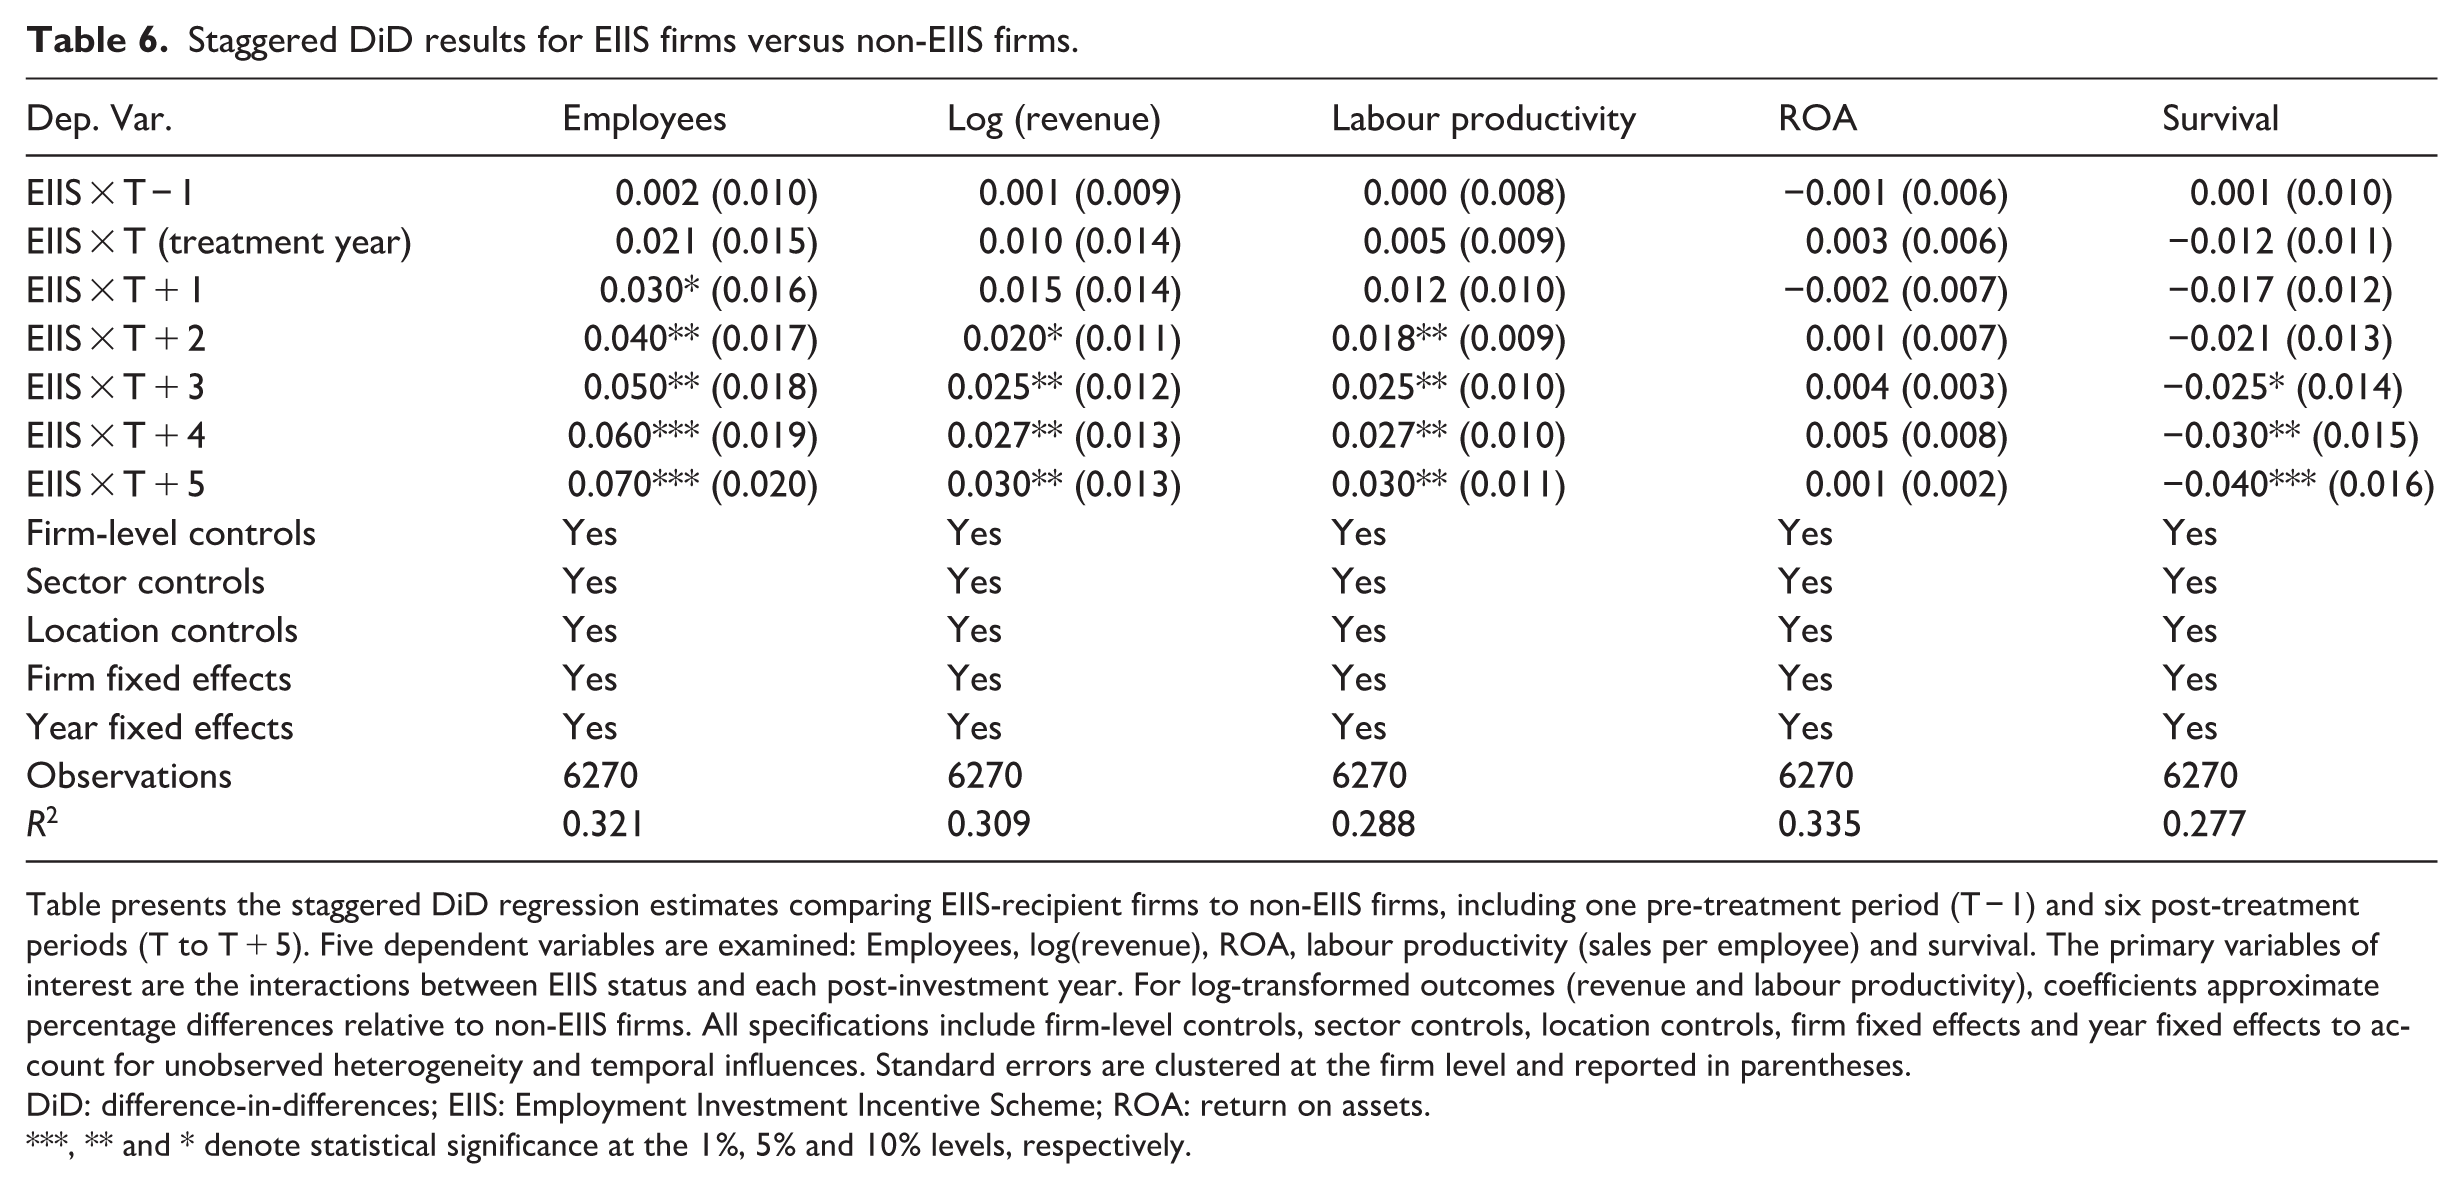
Table presents the staggered DiD regression estimates comparing EIIS-recipient firms to non-EIIS firms, including one pre-treatment period (T − 1) and six post-treatment periods (T to T + 5). Five dependent variables are examined: Employees, log(revenue), ROA, labour productivity (sales per employee) and survival. The primary variables of interest are the interactions between EIIS status and each post-investment year. For log-transformed outcomes (revenue and labour productivity), coefficients approximate percentage differences relative to non-EIIS firms. All specifications include firm-level controls, sector controls, location controls, firm fixed effects and year fixed effects to account for unobserved heterogeneity and temporal influences. Standard errors are clustered at the firm level and reported in parentheses.
DiD: difference-in-differences; EIIS: Employment Investment Incentive Scheme; ROA: return on assets.
, ** and * denote statistical significance at the 1%, 5% and 10% levels, respectively.
As an additional robustness check, we augment the staggered DiD specification to include industry-by-year and region-by-year fixed effects to account for differential growth trajectories across sectors and locations. These interacted fixed effects absorb any time-varying shocks experienced within specific industries or regions. The inclusion of these controls leaves the estimated EIIS coefficients virtually unchanged in magnitude and significance, indicating that our results are not driven by sectoral cycles or regional growth patterns.
Results
Staggered difference-in-difference
Model 1 in Table 6 presents the staggered DiD estimates for employment, while models 2–5 report the corresponding effects for revenue, labour productivity, profitability and survival. As shown in model 1 (Table 6), the employment coefficient starts at roughly 2.1% in the investment year itself and climbs steadily to about 7% by year five. The estimates become statistically distinguishable from zero in the second year post-investment and, when cumulated, imply that a typical recipient employs roughly 1.3 more workers than its matched non-recipient by the end of the window. This provides evidence that is fully consistent with hypothesis 1. Model 2 indicates that the revenue path is similar but slightly smaller, the treatment effect reaches about 3% by year five, which, given the log specification, translates into an extra €96,000 in annual sales for a median-sized firm. This positive and significant trajectory supports hypothesis 2. As the revenues accelerate faster than employees only after the first year post-investment, labour-productivity gains materialise with a short lag. By year five, EIIS firms produce roughly 3% more sales per worker than their counterfactuals, confirming hypothesis 3.
In contrast, model 4 (ROA) shows that the interaction terms fluctuate around zero and are never statistically significant. EIIS-financed expansion therefore leaves margins essentially unchanged, contradicting hypothesis 4, which predicted a profit increase. Finally, the coefficients for the survival outcome carry the opposite sign in that EIIS recipients exhibit a 3- to 4-percentage-point lower probability of remaining active within the observation period. Although economically modest, this reduction is robust across model variants and contradicts hypothesis 5, which had predicted a lower failure risk among faster-growing, EIIS-backed firms.
Based on our results, the evidence indicates that the EIIS achieves its principal objectives of boosting employment, sales and efficiency, does so without eroding profitability, but does coincide with a modestly greater likelihood of failure, which is perhaps the risk–return profile embedded in the programme’s design.
Robustness checks
To reinforce the causal interpretation of the staggered DiD results, we conduct a number of supplementary tests that probe both the dynamic path of the treatment effect and the sensitivity of the findings to modelling choices and sample construction.
A complementary approach compresses the entire post-treatment window into a single cumulative-growth metric. Models 1–8 in Table 7 compare the 5-year percentage change in each performance measure between treated and control firms. The ordinary least square (OLS) specifications (models 1, 3, 5 and 7) indicate that firms receiving EIIS funding experienced an average 4.0% increase in employment growth relative to non-recipient firms (p < 0.05), alongside a 2.5% gain in revenue growth (p < 0.1). Labour productivity growth also shows a positive and statistically significant difference of approximately 3.0 percentage points, while ROA does not register a statistically meaningful change.
EIIS impact on total accumulative firm growth: EIIS versus non-EIIS firms.
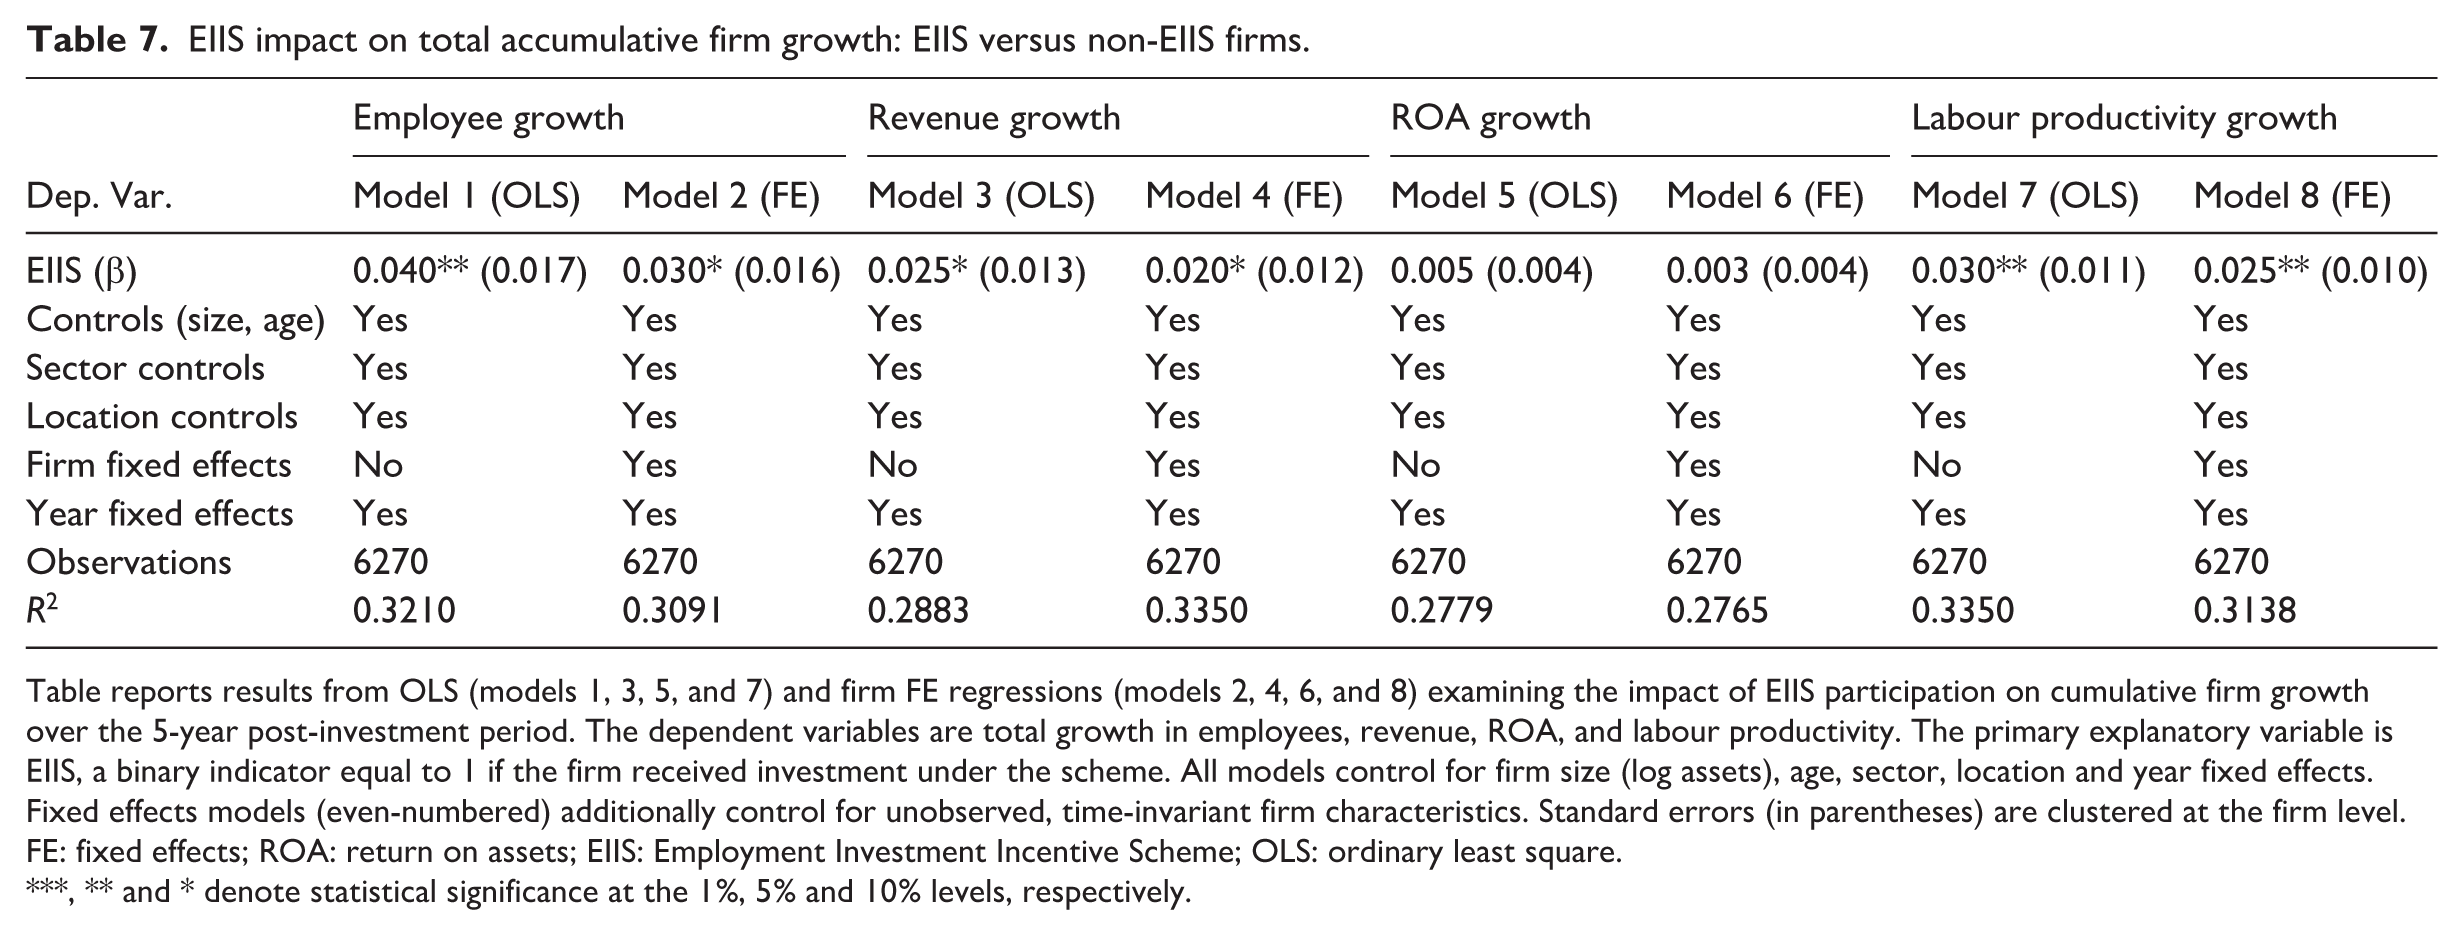
Table reports results from OLS (models 1, 3, 5, and 7) and firm FE regressions (models 2, 4, 6, and 8) examining the impact of EIIS participation on cumulative firm growth over the 5-year post-investment period. The dependent variables are total growth in employees, revenue, ROA, and labour productivity. The primary explanatory variable is EIIS, a binary indicator equal to 1 if the firm received investment under the scheme. All models control for firm size (log assets), age, sector, location and year fixed effects. Fixed effects models (even-numbered) additionally control for unobserved, time-invariant firm characteristics. Standard errors (in parentheses) are clustered at the firm level.
FE: fixed effects; ROA: return on assets; EIIS: Employment Investment Incentive Scheme; OLS: ordinary least square.
, ** and * denote statistical significance at the 1%, 5% and 10% levels, respectively.
To account for time-invariant unobserved firm characteristics, models 2, 4, 6 and 8 introduce firm fixed effects. As expected, the inclusion of fixed effects slightly attenuates the magnitude of the coefficients; however, the positive effects on employment, revenue and productivity growth remain statistically significant, highlighting the robustness of the findings. In contrast, the ROA coefficient continues to lack significance, suggesting that while EIIS funding supports topline and workforce expansion, it may not translate into short-run improvements in profitability. Overall, these cumulative results reinforce the earlier staggered DiD findings and provides evidence that EIIS participation is associated with meaningful gains in firm-level performance over time. The consistency of these effects across both OLS and fixed-effects models lends further credibility to the conclusion that EIIS-supported firms are on stronger growth trajectories than their non-supported counterparts.
An additional set of checks re-estimates the treatment effect in a simpler framework that replaces the panel level of each outcome with its period-to-period change. Tables 8–11 provide a complementary period-by-period perspective on changes in the main outcomes. These regressions do not introduce a new identification strategy; rather, they illustrate the temporal sequencing of the treatment effects observed in Table 6. They show that employment rises first, followed by revenue growth, and that productivity gains materialise once revenue begins to outpace additional hiring. These patterns help clarify the timing and dynamics of the treatment effects and are fully consistent with the staggered DiD estimates. Tables 8–11 report ordinary-least-squares regressions in which the dependent variables are ΔEmployees, ΔLabour Productivity, ΔRevenue and ΔROA for each post-investment year T + 1 through to T + 5. The pattern that emerges reiterates the DiD profile in that employment and sales gains appear immediately after receipt of EIIS funds and peak in the third post-treatment year; improvements in labour productivity surface 1 year later, as revenue growth begins to outpace head-count expansion; and ROA remains statistically indistinguishable from zero throughout. The adjusted R2 rises monotonically with the length of the horizon, evidence that the explanatory power of the treatment increases as firms have more time to deploy the new capital.
Regression analyses (ordinary least square) on the change in employee numbers.
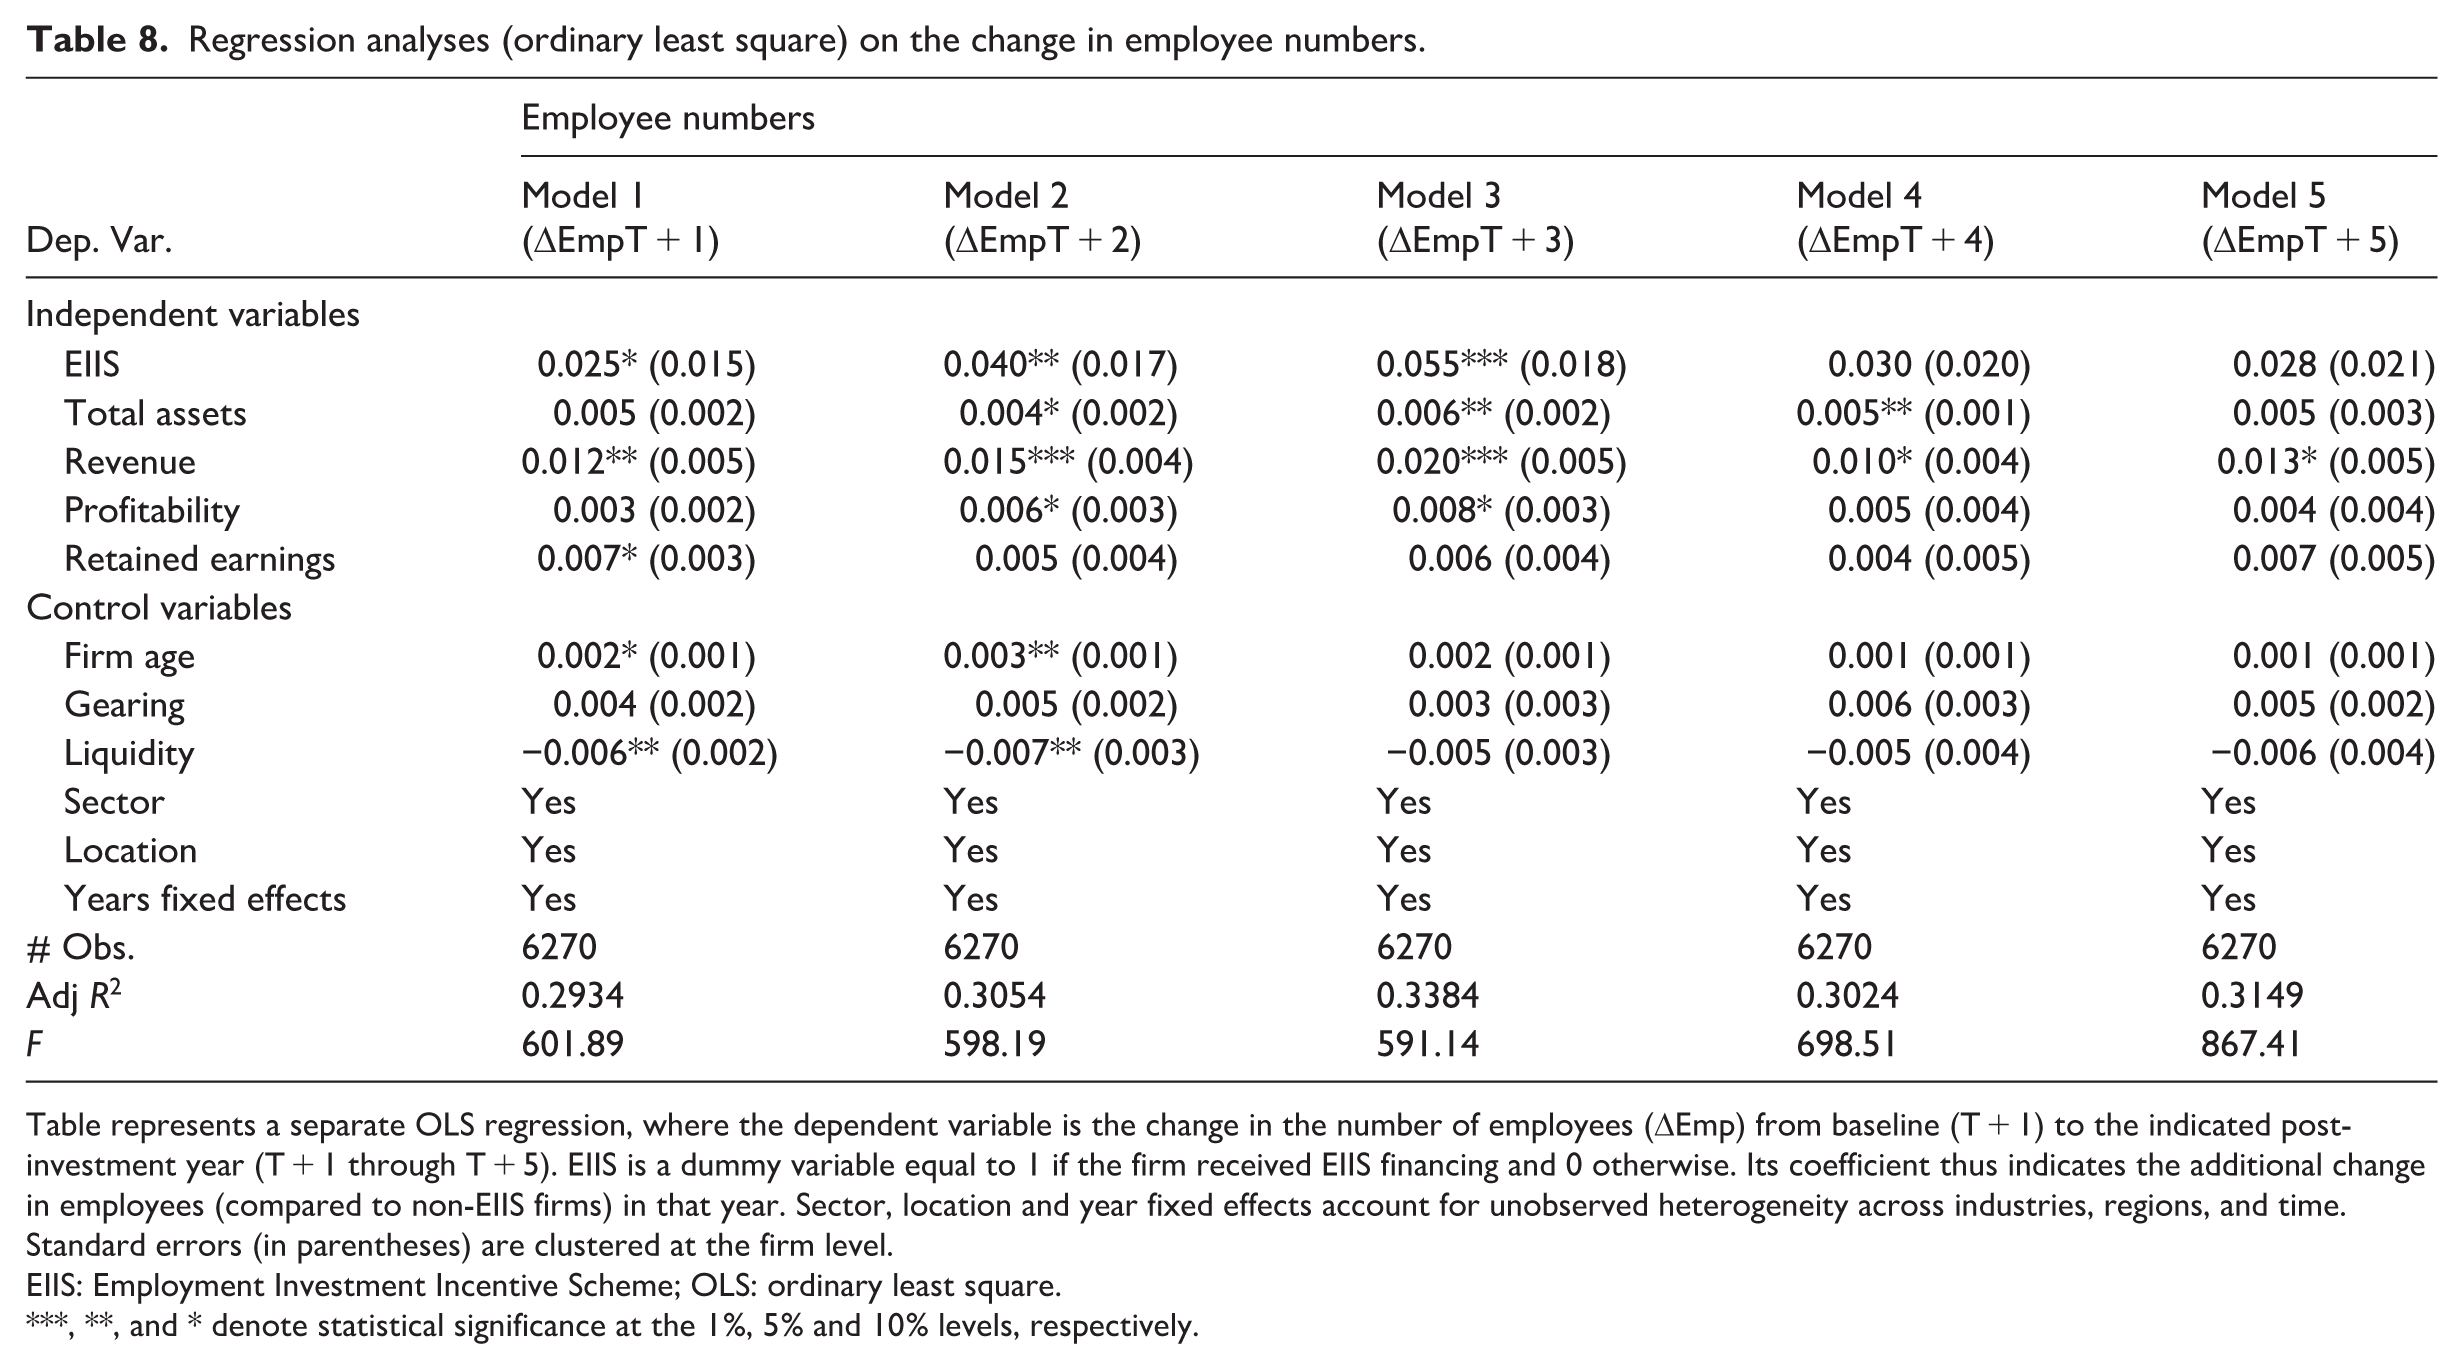
Table represents a separate OLS regression, where the dependent variable is the change in the number of employees (ΔEmp) from baseline (T + 1) to the indicated post-investment year (T + 1 through T + 5). EIIS is a dummy variable equal to 1 if the firm received EIIS financing and 0 otherwise. Its coefficient thus indicates the additional change in employees (compared to non-EIIS firms) in that year. Sector, location and year fixed effects account for unobserved heterogeneity across industries, regions, and time. Standard errors (in parentheses) are clustered at the firm level.
EIIS: Employment Investment Incentive Scheme; OLS: ordinary least square.
, **, and * denote statistical significance at the 1%, 5% and 10% levels, respectively.
Regression analyses (ordinary least square) on the change in labour productivity.
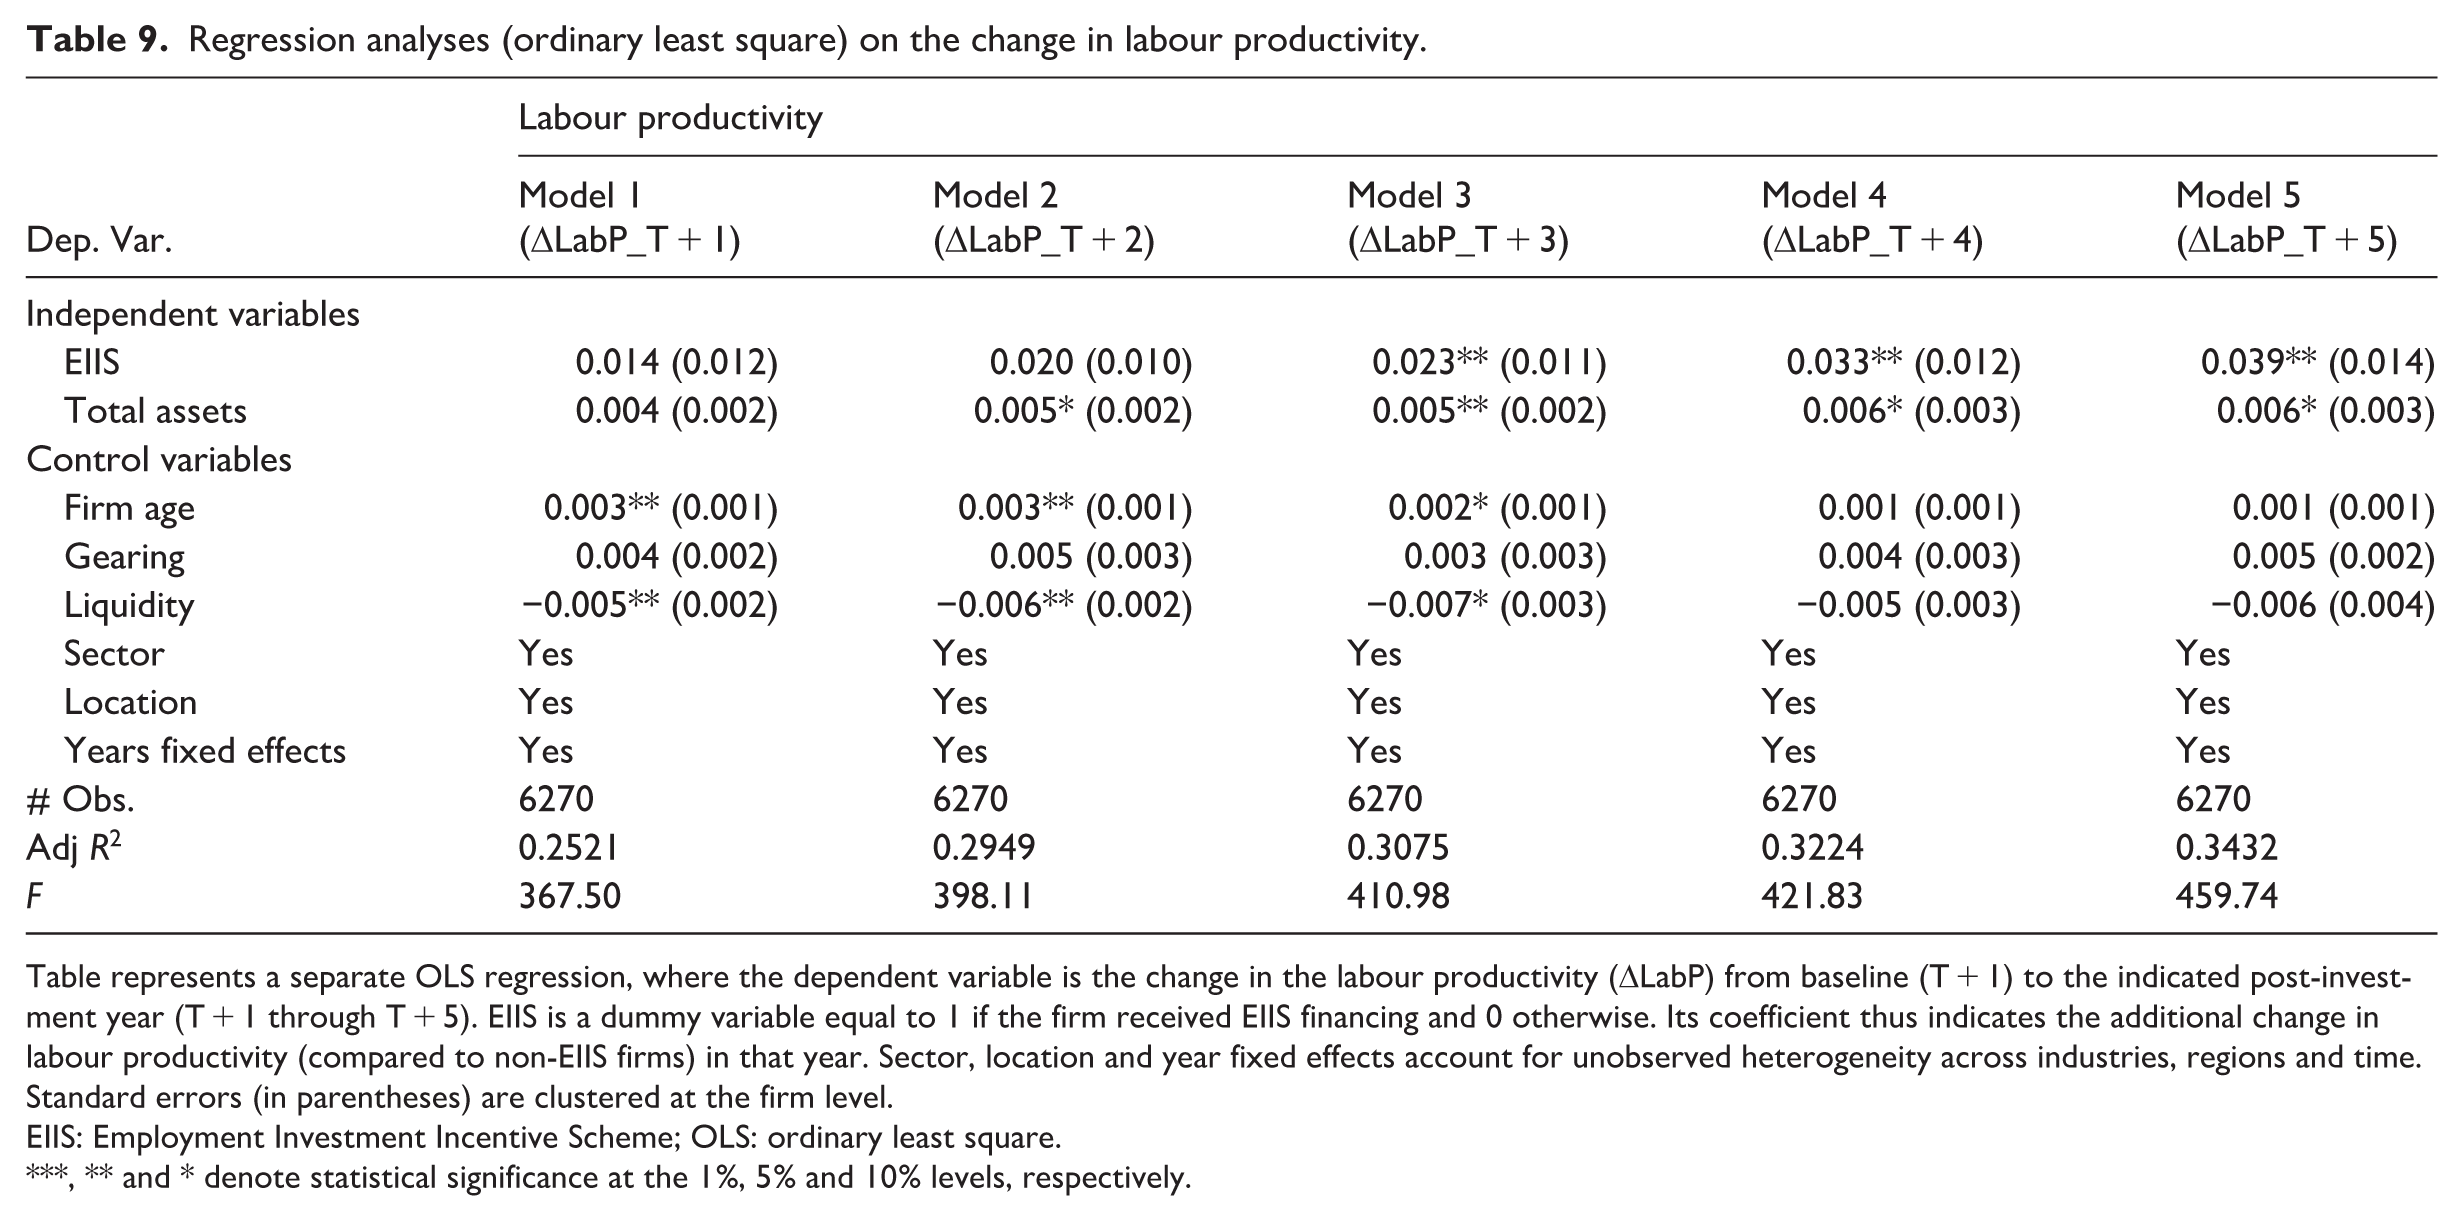
Table represents a separate OLS regression, where the dependent variable is the change in the labour productivity (ΔLabP) from baseline (T + 1) to the indicated post-investment year (T + 1 through T + 5). EIIS is a dummy variable equal to 1 if the firm received EIIS financing and 0 otherwise. Its coefficient thus indicates the additional change in labour productivity (compared to non-EIIS firms) in that year. Sector, location and year fixed effects account for unobserved heterogeneity across industries, regions and time. Standard errors (in parentheses) are clustered at the firm level.
EIIS: Employment Investment Incentive Scheme; OLS: ordinary least square.
, ** and * denote statistical significance at the 1%, 5% and 10% levels, respectively.
Regression analyses (ordinary least square) on the change in revenue.
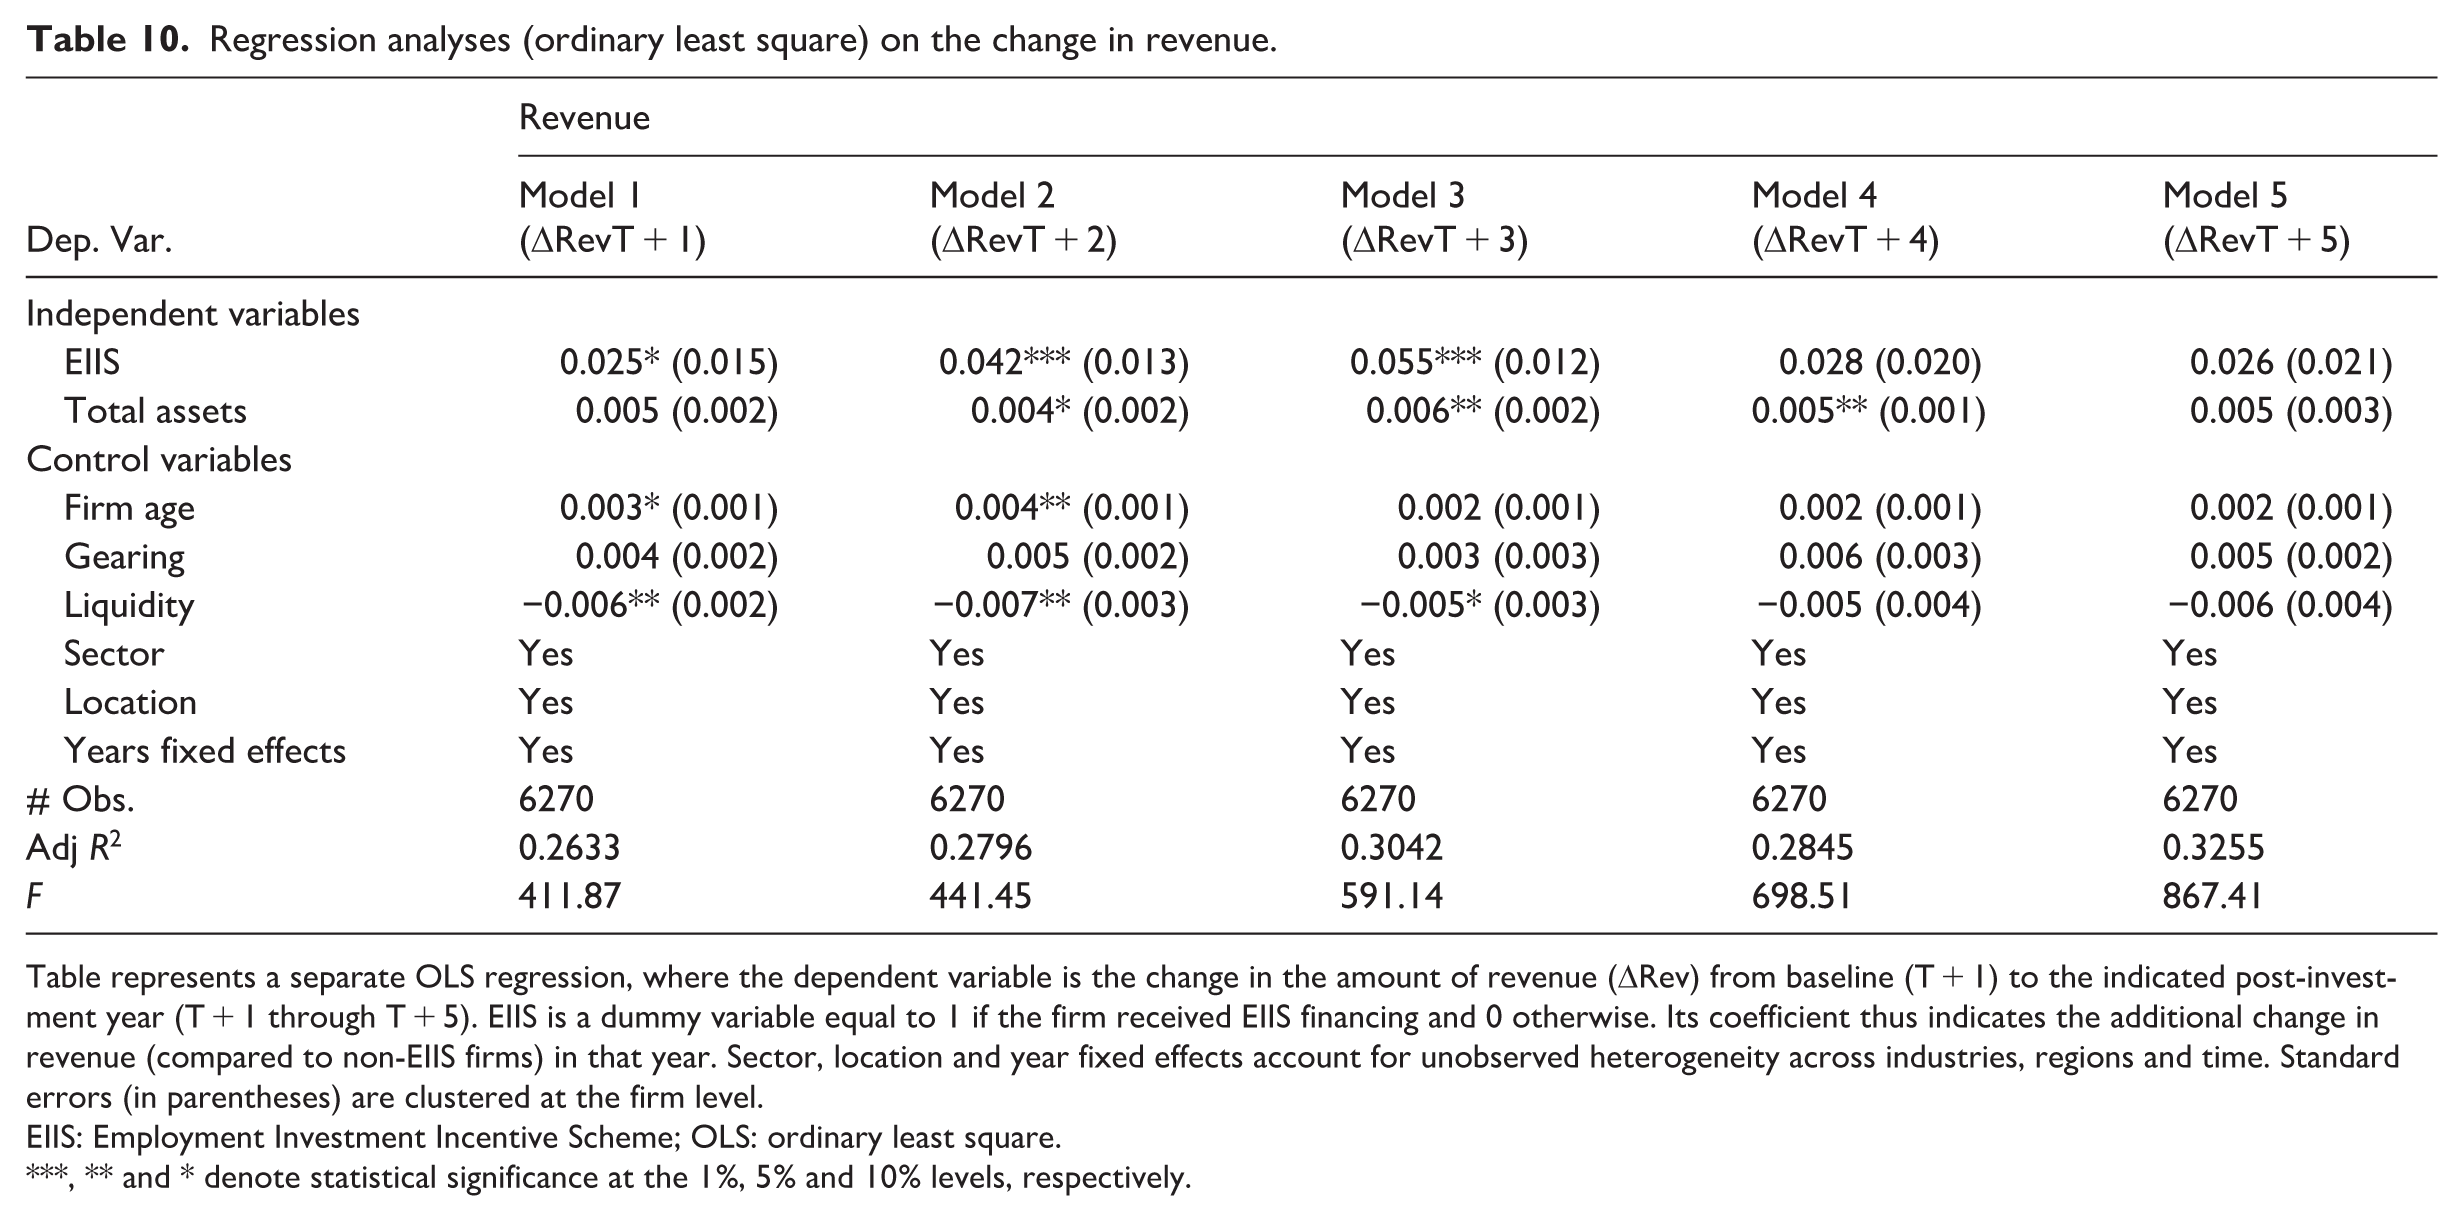
Table represents a separate OLS regression, where the dependent variable is the change in the amount of revenue (ΔRev) from baseline (T + 1) to the indicated post-investment year (T + 1 through T + 5). EIIS is a dummy variable equal to 1 if the firm received EIIS financing and 0 otherwise. Its coefficient thus indicates the additional change in revenue (compared to non-EIIS firms) in that year. Sector, location and year fixed effects account for unobserved heterogeneity across industries, regions and time. Standard errors (in parentheses) are clustered at the firm level.
EIIS: Employment Investment Incentive Scheme; OLS: ordinary least square.
, ** and * denote statistical significance at the 1%, 5% and 10% levels, respectively.
Regression analyses (ordinary least square) on the change in ROA.
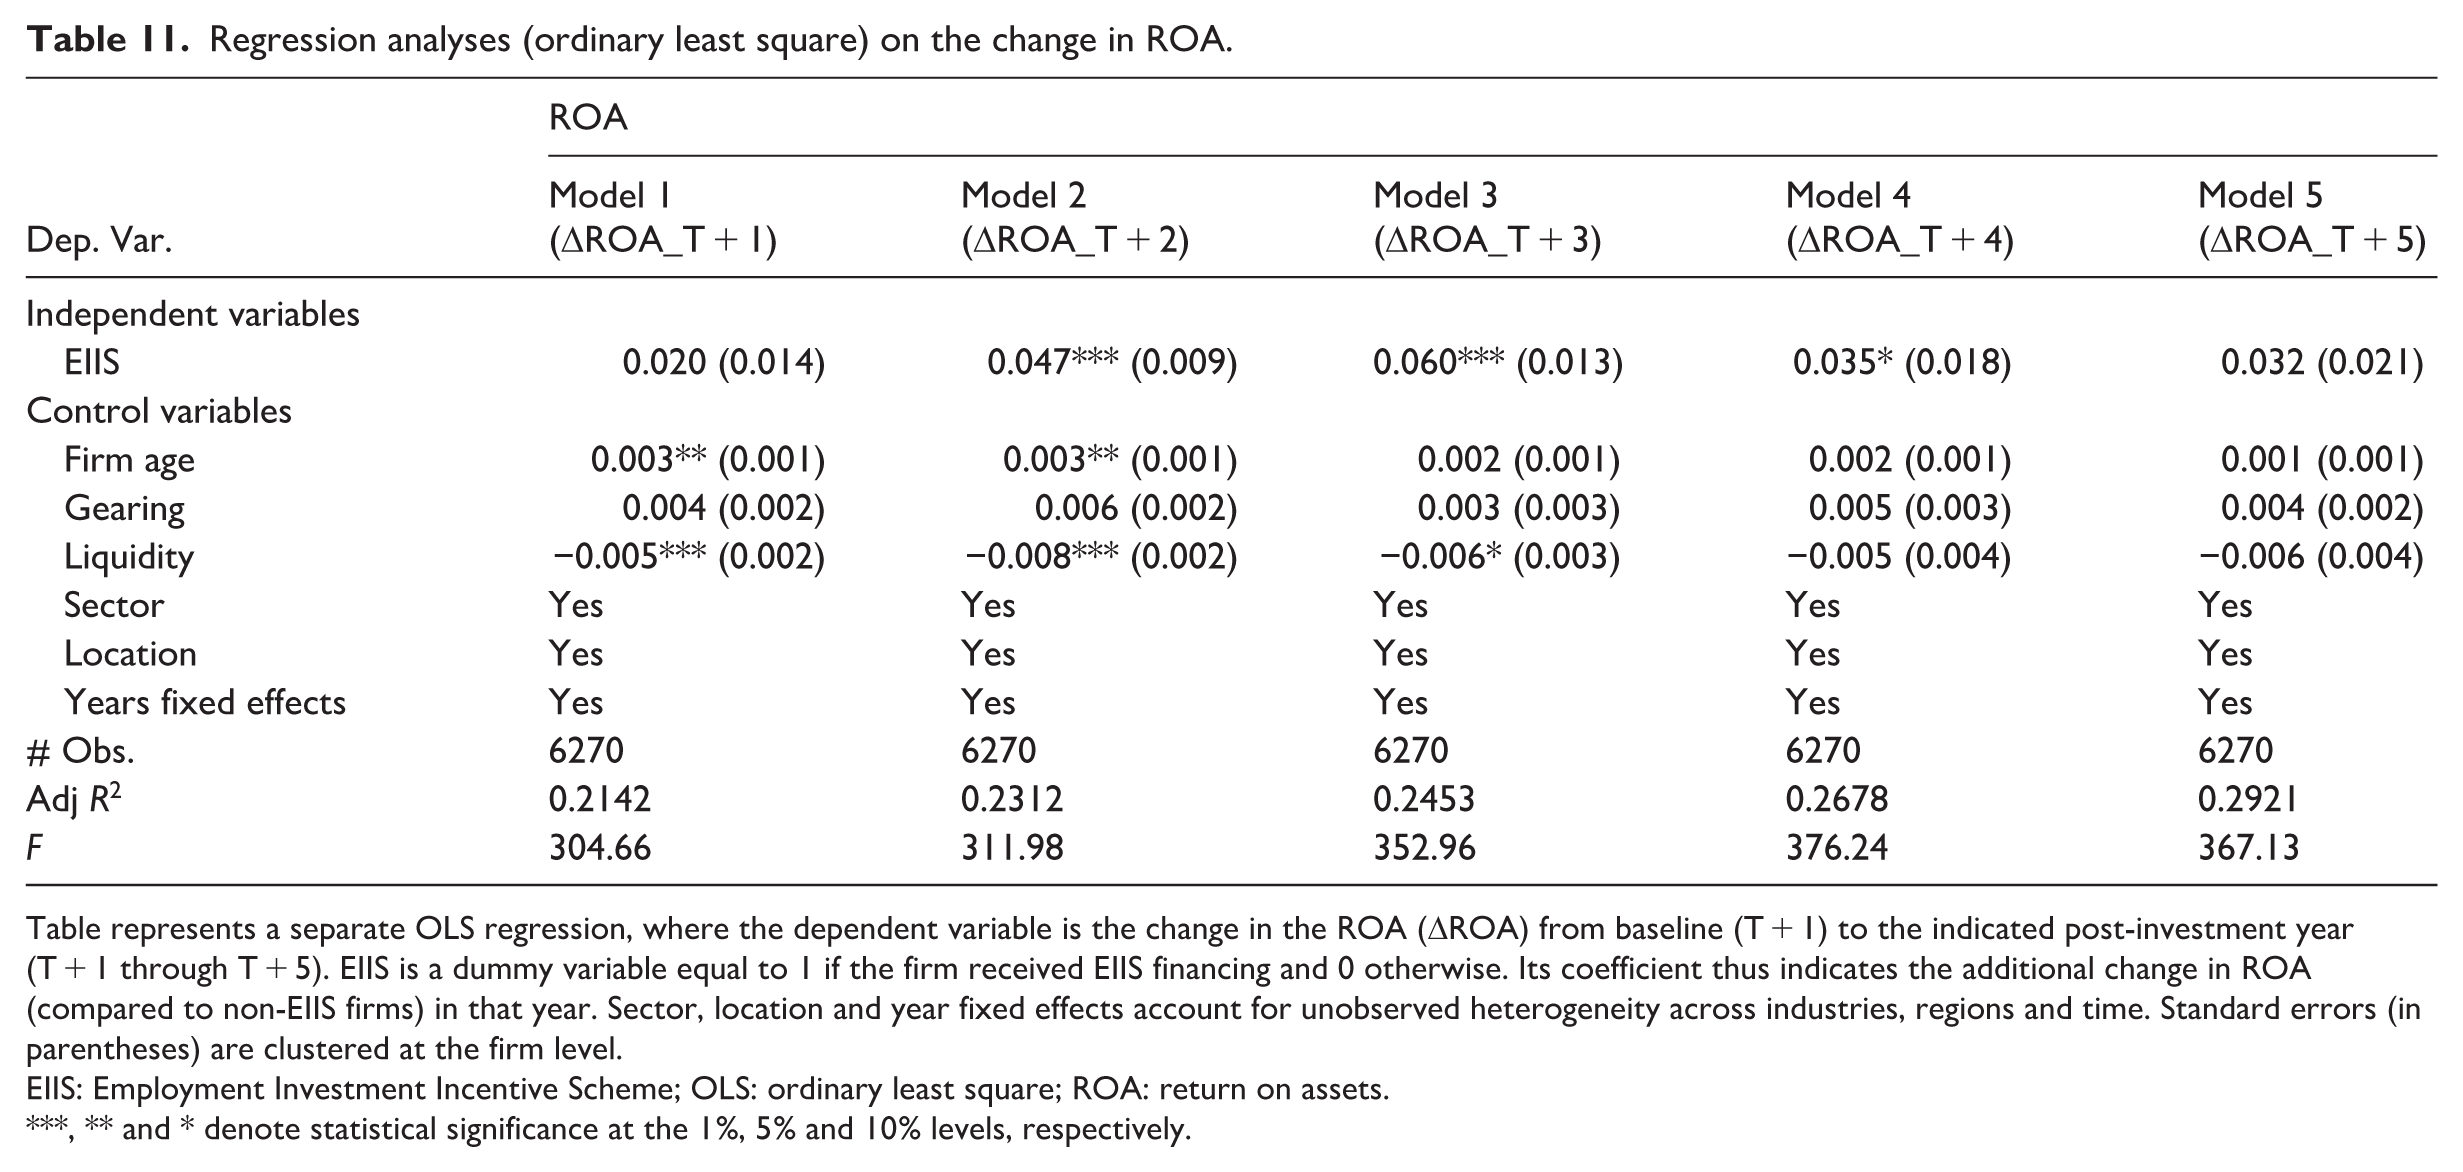
Table represents a separate OLS regression, where the dependent variable is the change in the ROA (ΔROA) from baseline (T + 1) to the indicated post-investment year (T + 1 through T + 5). EIIS is a dummy variable equal to 1 if the firm received EIIS financing and 0 otherwise. Its coefficient thus indicates the additional change in ROA (compared to non-EIIS firms) in that year. Sector, location and year fixed effects account for unobserved heterogeneity across industries, regions and time. Standard errors (in parentheses) are clustered at the firm level.
EIIS: Employment Investment Incentive Scheme; OLS: ordinary least square; ROA: return on assets.
, ** and * denote statistical significance at the 1%, 5% and 10% levels, respectively.
To further validate our findings on firm survival, we supplement the DiD analysis with alternative estimation techniques better suited to modelling failure as a time-to-event outcome. In Table 12, we present marginal effects from logit regressions where the dependent variable indicates firm failure, defined as dissolution or liquidation, over the observed period. Across all model specifications, EIIS participation is associated with a statistically significant increase in the likelihood of firm failure, with marginal effects ranging from 2.8 to 3.7 percentage points. These effects remain significant after controlling for firm size, revenue, profitability, sector, and location, underscoring the robustness of the result.
Logit regression (marginal effects): determinants of firm failure.
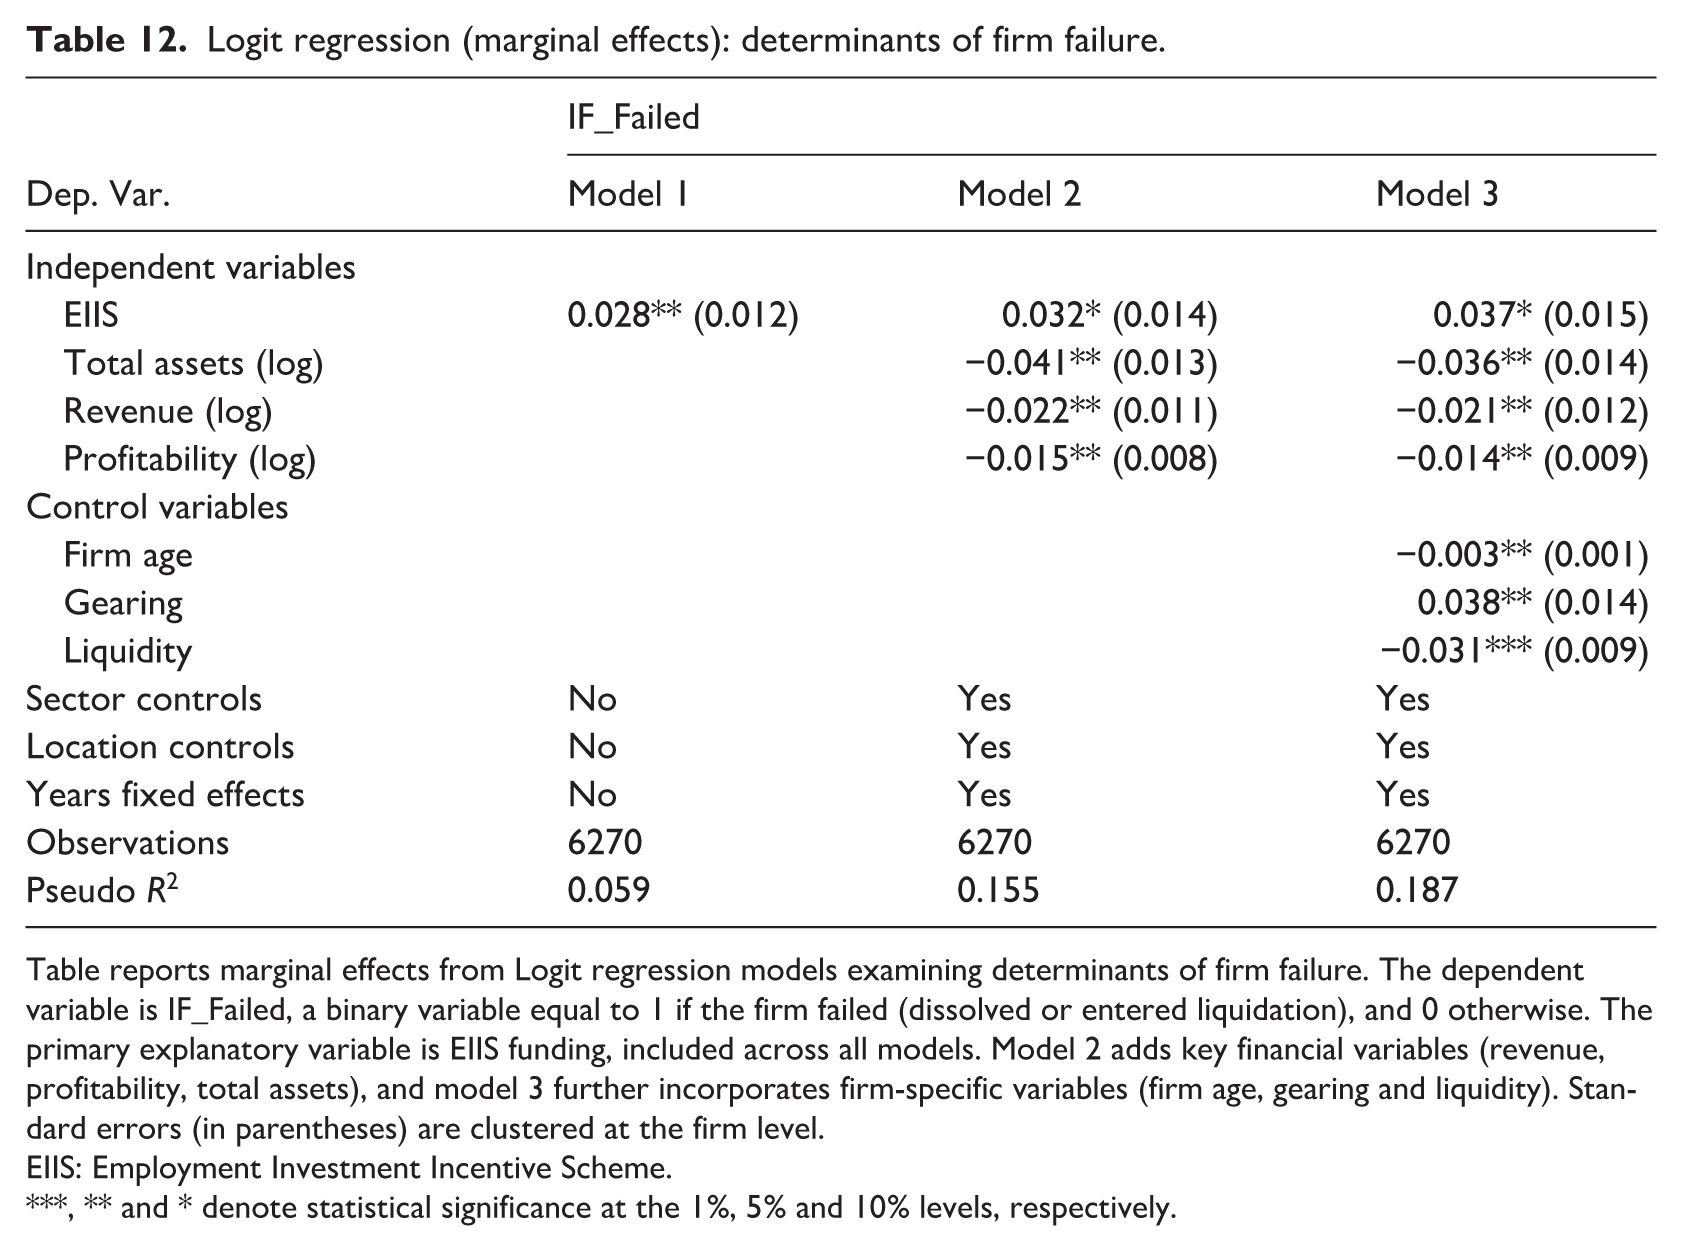
Table reports marginal effects from Logit regression models examining determinants of firm failure. The dependent variable is IF_Failed, a binary variable equal to 1 if the firm failed (dissolved or entered liquidation), and 0 otherwise. The primary explanatory variable is EIIS funding, included across all models. Model 2 adds key financial variables (revenue, profitability, total assets), and model 3 further incorporates firm-specific variables (firm age, gearing and liquidity). Standard errors (in parentheses) are clustered at the firm level.
EIIS: Employment Investment Incentive Scheme.
, ** and * denote statistical significance at the 1%, 5% and 10% levels, respectively.
To further test the persistence and timing of this risk, Table 13 reports Cox proportional hazards models, which estimate the hazard of failure over time while accounting for censored observations. The results confirm the findings from the logit models: the hazard ratio for EIIS-supported firms ranges between 1.009 and 1.023, suggesting that these firms are modestly but consistently more likely to fail than their non-recipient counterparts. Importantly, the effects remain significant even after adjusting for a comprehensive set of controls, including firm size (log of total assets), financial performance (revenue and profitability), leverage, liquidity and firm age. These variables behave as expected, larger, more profitable and more liquid firms face significantly lower hazards of failure, while highly leveraged firms are at elevated risk.
Cox proportional hazards ratios: firm failure.
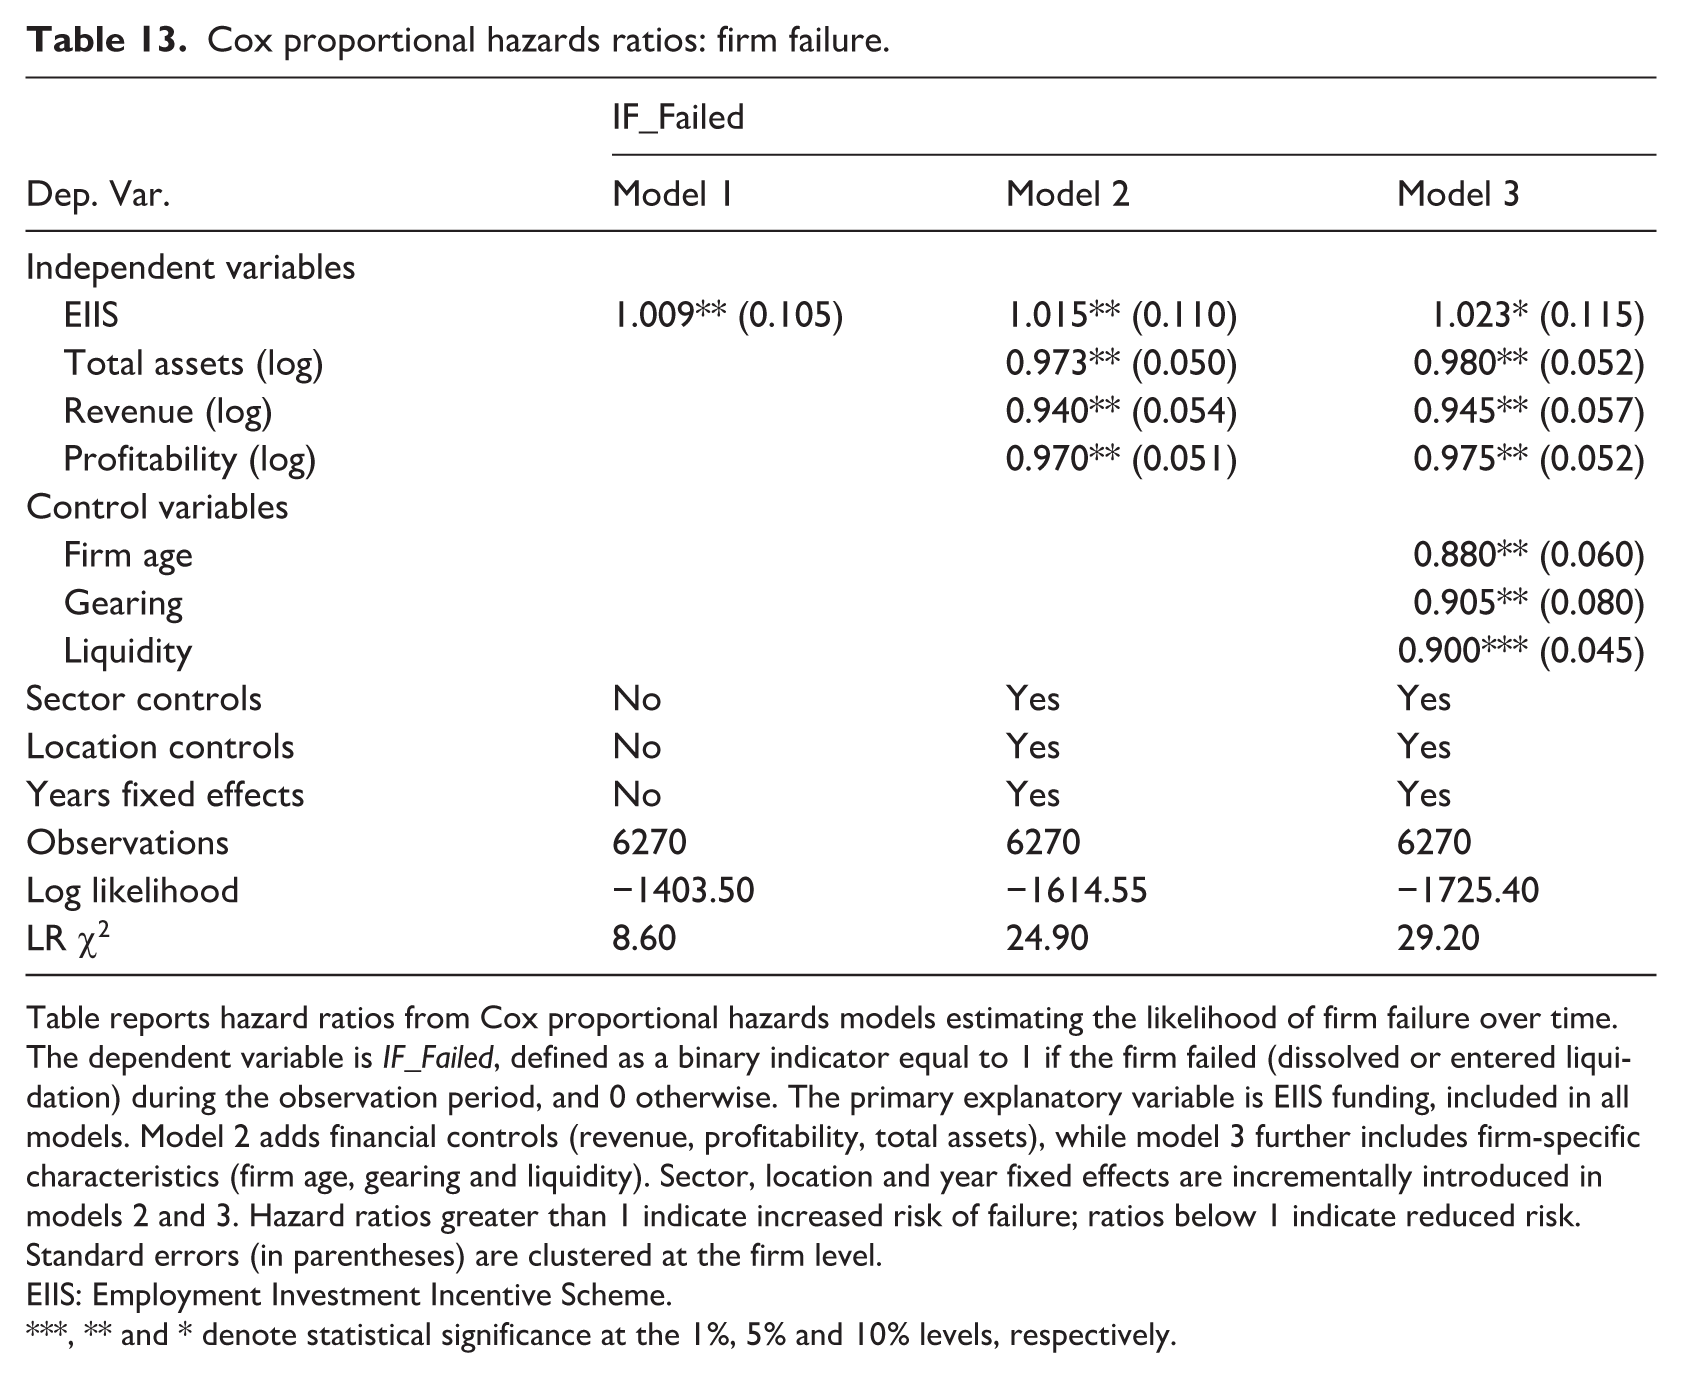
Table reports hazard ratios from Cox proportional hazards models estimating the likelihood of firm failure over time. The dependent variable is IF_Failed, defined as a binary indicator equal to 1 if the firm failed (dissolved or entered liquidation) during the observation period, and 0 otherwise. The primary explanatory variable is EIIS funding, included in all models. Model 2 adds financial controls (revenue, profitability, total assets), while model 3 further includes firm-specific characteristics (firm age, gearing and liquidity). Sector, location and year fixed effects are incrementally introduced in models 2 and 3. Hazard ratios greater than 1 indicate increased risk of failure; ratios below 1 indicate reduced risk. Standard errors (in parentheses) are clustered at the firm level.
EIIS: Employment Investment Incentive Scheme.
, ** and * denote statistical significance at the 1%, 5% and 10% levels, respectively.
Additionally, Schoenfeld residual tests do not reject the proportional hazards assumption, indicating that the relative increase in failure risk for EIIS firms is not confined to the immediate post-investment period but persists over the observed time horizon. This finding suggests that the elevated risk is not simply an artefact of early-stage volatility, but may reflect deeper structural characteristics of firms that attract EIIS funding, such as financial distress, aggressive growth models or limited absorptive capacity for external capital.
The logit and Cox models provide converging evidence that, while the EIIS may enable growth and employment gains, it does not reduce, and may slightly elevate, the risk of business failure. This nuanced finding highlights a potential trade-off embedded in the scheme in that the capital it provides supports scaling, but may also expose financially constrained or high-risk firms to greater downside volatility. From a policy perspective, these results highlight the importance of not only facilitating access to finance, but also ensuring that supported firms possess the strategic, managerial, and operational capabilities to deploy that capital effectively and sustainably.
We verify that the core results are not driven by deficiencies in the matching procedure or by functional-form choices. Propensity-score matching reduces each covariate’s standardised mean difference to below 0.05, satisfying the usual balance criterion. Re-estimating the DiD with inverse-probability weights or kernel-matched samples yields coefficient magnitudes and p-values that are virtually identical to those in the baseline specification (results not tabulated). Placebo treatments assigned to pseudo-intervention years preceding the actual EIIS issuance generate effects centred tightly on zero, reinforcing the credibility of the parallel-trends assumption that underpins the DiD design.
Across all robustness checks, the outcomes remain constant. EIIS funding is associated with statistically and economically meaningful gains in employment, sales and labour productivity, no detectable change in profitability, and a modest but persistent increase in the likelihood of firm failure. The convergence of evidence from alternative estimators, variable constructions and matched samples strengthens confidence that the main findings are not artefacts of model specification or sample selection but reflect genuine programme impacts.
Discussion
In this article, we generate a comprehensive firm-level evaluation of the EIIS, a tax relief mechanism aimed at mobilising private capital for SME investment and growth. By integrating data on EIIS recipients with firm performance indicators from FAME, we assess the effect of EIIS funding on key outcomes including revenue, employment, labour productivity, profitability and firm survival. Using a staggered DiD framework, supported by PSM and a suite of robustness tests, including logit and Cox hazard models, we respond to recent calls for more rigorous evaluation of tax-based business support mechanisms (Cicchiello et al., 2019; Crawford et al., 2024; Rao et al., 2023). Our empirical analysis reveals a nuanced performance profile of EIIS-supported firms. Specifically, we find statistically significant increases in employment, revenue, and labour productivity, though not in profitability or survival rates. The temporal structure of these results is especially revealing. For example, revenue and employment gains begin to materialise as early as T + 2, intensify in T + 3, and persist throughout the five-year post-investment period. OLS regressions demonstrate a 4 percentage point increase in employment and a 2.5 percentage point rise in revenue growth over the 5-year horizon for EIIS-backed firms (Table 7), with labour productivity gains of approximately 3 percentage points emerging from T + 3 onwards. These time-sensitive patterns suggest that EIIS capital is not only being used for headcount expansion, but also for productivity-enhancing investments that take time to mature, a finding aligned with prior research on capacity-building effects of patient capital (Cowling et al., 2008).
While employment rises more quickly than revenue in the early post-investment years, labour productivity still improves because revenue growth accelerates from T + 2 onwards and begins to outpace additional hiring. This pattern mirrors findings in other investment-support evaluations, where initial headcount expansion precedes efficiency gains. The absence of a clear ROA effect is also consistent with prior studies, reflecting that profitability depends on cost structures and capital deployment practices rather than revenue or employment growth alone. As assets form the denominator in ROA, changes in balance-sheet structure may dampen measured profitability despite genuine operational improvements. However, these positive top-line trends are not mirrored in bottom-line outcomes. Our DiD models report no statistically significant impact on ROA, while supplementary OLS regressions suggest modest but time-lagged improvements in profitability, visible only between T + 2 and T + 4, and only for a subset of firms. These findings imply that revenue expansion does not automatically translate into profitability, and that firm-specific absorptive capacity likely mediates whether capital inflows can be converted into financial returns. The delayed profitability effects highlight the importance of understanding firm heterogeneity, especially in relation to internal resource integration and strategic alignment.
Our findings on firm failure raise important concerns. Across DiD, logit and Cox models, EIIS-backed firms are consistently more likely to fail than matched controls. Logit marginal effects suggest an increased failure probability of 2.8–3.7 percentage points, while Cox models indicate a persistent elevation in the hazard of exit over time (Table 12). The proportionality of this risk (confirmed via Schoenfeld residual tests) suggests that heightened failure risk is not confined to the immediate post-investment period but reflects deeper firm-level vulnerabilities that persist throughout the growth phase. These patterns may reflect heterogeneity in firms’ ability to integrate and manage new resources effectively rather than direct causal differences in DC. Firms with less developed managerial systems or absorptive capacity may experience greater strain when scaling rapidly. Therefore, while our findings are consistent with arguments advanced by DC theorists, they should be interpreted as indicative rather than conclusive evidence of such mechanisms. The evidence from this study reiterates that from the business angel and early-stage equity literature, which shows that investor-backed firms often experience strong post-investment growth but also elevated volatility and failure risk (Bonini et al., 2019; Levratto et al., 2018). The EIIS programme appears to generate a similar growth–risk trade-off, albeit through a tax-incentivised, largely non-institutional investor base rather than formal angel groups.
While our analysis is restricted to a five-year post-investment window, this reflects both the availability of verified firm-level data and the structural features of the EIIS, which mandates a four-year minimum investment holding period. As such, the evaluation captures the programme’s intended medium-term effects rather than long-run firm trajectories. Comparable programme evaluations (Bonini et al., 2019; Cowling et al., 2008) adopt similar horizons for assessing early impacts on growth and performance. Future research extending the time window will be critical for observing whether profitability and survivability gains emerge once firms mature beyond the post-investment adjustment phase. From a policy standpoint, recognising that early-stage volatility and elevated exit risk are characteristic of equity-based SME finance can help refine expectations around scheme performance and risk-return trade-offs. The consistency of effects across the PSM-matched, CEM-matched and full unmatched samples suggests that the estimated EIIS impacts are not artefacts of matching choices or sample construction. The robustness of the employment, revenue, and productivity effects strengthens confidence that the observed post-investment growth trajectory is a genuine programme effect. Likewise, the persistence of negative survival effects across all estimation strategies reinforces the interpretation that the scheme supports rapid scaling but does not necessarily mitigate early-stage failure risks. We also explored whether the EIIS effects vary meaningfully across different types of firms. Interaction tests using sector groupings, firm age, and capital structure indicators reveal no material divergence from the main results. The positive post-investment effects on employment, revenue, and productivity arise consistently across subgroups, while the elevated exit risk is most pronounced among younger and more highly leveraged firms. These patterns are consistent with the idea that heterogeneity in managerial capacity and financial resilience shapes how firms absorb and deploy new external capital.
Our results support the view, rooted in the RBV tradition and interpreted through the lens of DC that tax-based supports such as the EIIS may act as amplifiers of existing firm trajectories. Capital inflows facilitate growth and commercial expansion, but their ultimate impact on profitability and survival depends on how well firms are positioned to manage these resources. This aligns with critiques of the RBV, which often assumes that addressing resource constraints will mechanically improve performance (Brown and Mawson, 2016). Our findings support an extension to the RBV, namely the DC perspective, which emphasises that it is not merely resource acquisition, but strategic deployment and adaptation that drive sustained competitive advantage (Antcliff et al., 2021). These patterns suggest that the observed heterogeneity in firm outcomes may be driven by underlying managerial and organisational mechanisms rather than by funding alone. Firms with stronger DC, those able to integrate and reconfigure resources effectively are more likely to convert EIIS funding into sustained growth, while firms with weaker absorptive capacity may struggle to manage rapid expansion or deploy new capital efficiently. This interpretation aligns with prior research emphasising the role of managerial quality and strategic resource deployment in mediating the effects of public financial supports (Åstebro and Serrano, 2015; Brown and Mawson, 2016). Future qualitative or mixed-method investigations could use interviews or case analyses to examine how EIIS-backed firms make allocation decisions and what differentiates those that successfully convert capital inflows into long-term stability.
We can also interpret scale versus survival through the RBV–DC lens. The EIIS results illustrate a classic trade-off between resource expansion and resource deployment. From an RBV perspective, access to tax-incentivised equity temporarily relaxes financial constraints, allowing firms, especially younger or fast-growing ones, to scale employment and sales rapidly. However, the DC perspective highlights that sustained advantage depends on managerial capacity to integrate and reconfigure these new resources. Firms lacking such capabilities may over-extend, leading to higher post-investment volatility and exit risk. This explains why positive growth effects emerge quickly, when performance divergences begin to appear (typically after T + 2), and for whom the programme is most beneficial.
While the EIIS appears successful in unlocking private investment and triggering growth, it falls short in delivering consistent gains in profitability or survival, especially in the short to medium term. Many recipient firms in our dataset are in early-stage phases of development, often receiving funding within seven years of their first commercial sale, the eligibility cut-off for the scheme. This aligns with the concept of the ‘valley of death’ (O’Reilly et al., 2024), a critical period during which revenue and headcount growth may outpace internal systems, thereby heightening operational risk. Research indicates that more than 50% of firms fail within five years of inception (Jayasekara et al., 2020; Romme et al., 2023), and our results confirm that even publicly backed firms are not immune to this trend. In this sense, the EIIS contributes to the wider international context about how tax-mediated capital mobilisation compares to other forms of support, such as direct subsidies or government venture funds, in addressing persistent equity gaps for SMEs. International comparisons reinforce the logic behind investor-oriented tax incentives. Recent evidence from Germany’s INVEST programme (Berger and Gottschalk, 2025), Israel’s natural experiment (Solodoha et al., 2023), and early-stage equity subsidies in the United States and United Kingdom (Gonzalez-Uribe and Paravisini, 2017) shows similar patterns in that such schemes effectively mobilise private capital, stimulate early-stage growth and may simultaneously expose firms to greater scaling volatility. The EIIS fits squarely within this global policy trend, offering comparable benefits and challenges.
While EIIS capital clearly enables early-stage scaling, our findings reinforce the idea that financial support must be complemented by non-financial inputs, including managerial guidance, performance monitoring and post-investment mentoring (Bloom et al., 2019; McCann and Ortega-Argilés, 2016). The case for transitioning from purely passive ‘patient capital’ to more engaged ‘monitored capital’ is strong. Linking investment to milestone-based disbursements or advisory services could help align investor-firm incentives and reduce failure risk without stifling growth potential. Although regional disparities in financing infrastructure and investor networks may shape firm outcomes, our analysis controls for location effects through a Dublin versus rest-of-Ireland variable included in both matching and regression models. The absence of significant differences suggests that the observed treatment effects are not regionally concentrated. Nonetheless, future work could explore how local investment ecosystems and place-based financing programmes interact with national tax-incentive schemes such as the EIIS. Building on these findings, several concrete policy adjustments could enhance the effectiveness of tax-based investment schemes such as the EIIS. First, introducing milestone-based or staged disbursements tied to employment or revenue targets could better align funding with firm progress. Second, integrating post-investment advisory or mentoring supports would help recipient firms strengthen managerial capabilities and improve capital deployment. Third, establishing regular eligibility and reporting reviews could ensure that incentives reach firms with credible growth potential while minimising misuse or deadweight loss. Such measures would modestly increase administrative oversight but could improve the balance between accessibility, accountability and long-term sustainability.
Another concern emerging from our findings is the potential misallocation of public incentives. Prior studies have warned of overly generous tax regimes that channel funds towards firms with limited commercial viability (Carpentier and Suret, 2016; Denes et al., 2023), driven more by investor tax advantages than business fundamentals. Our results reflect these concerns, as we observe increased risk of failure despite robust growth in revenue and employment. This calls for stronger targeting mechanisms to ensure capital flows to firms with viable business models and sufficient absorptive capacity.
Limitations and future research
While this study offers robust insights, several limitations remain. First, our analysis is restricted to quantitative measures and cannot capture firm-level motivations for seeking EIIS funding. Whether driven by liquidity constraints, tax advantages, or the signalling effect of government backing, these motivations remain unexplored. Second, our time window, though longer than many SME studies, is limited to five years post-investment, and we cannot speak to longer-term outcomes such as innovation, wage growth or export expansion. Finally, the study reflects the institutional context of Ireland, and cross-jurisdictional generalisability may be limited due to differences in tax policy and entrepreneurial ecosystems.
Future research should address these limitations by adopting mixed methods approaches, including interviews with founders to better understand behavioural drivers, and by engaging in comparative analysis with similar schemes such as the UK’s Enterprise Investment Scheme or France’s Madelin scheme. Further studies could also explore how firm-specific characteristics, such as founder experience, business model, or internal governance, mediate the effect of tax-backed investment on long-term viability. Also, as the event-study specification requires observing firms for several years prior to EIIS receipt, the analysis necessarily excludes very young firms for whom sufficient pre-treatment history is unavailable. While this is a standard requirement in staggered DiD designs, we acknowledge that it limits our ability to estimate treatment effects for the youngest cohort of EIIS recipients. We flag this as a promising area for future research once additional years of financial data become available.
Conclusion
The EIIS appears to succeed in unlocking growth potential for recipient firms, but this comes with risk. The challenge for policymakers lies in designing support mechanisms that balance accessibility with accountability, and growth potential with sustainability. Tax incentives alone may spark short-term gains, but without complementary support and strategic targeting, their ability to foster long-term firm success remains uncertain. More broadly, our findings contribute to ongoing international debates on the effectiveness of tax-based SME finance instruments, suggesting that mobilising private capital is necessary but insufficient without complementary capability-building supports.
Supplemental Material
sj-docx-1-isb-10.1177_02662426261431263 – Supplemental material for An evaluation of the impact of a government supported investment scheme on recipient firms
Supplemental material, sj-docx-1-isb-10.1177_02662426261431263 for An evaluation of the impact of a government supported investment scheme on recipient firms by Adam Lynch, Ciarán Mac an Bhaird and Seán O’Reilly in International Small Business Journal
Footnotes
Funding
The authors received no financial support for the research, authorship, and/or publication of this article.
Supplemental material
Supplemental material for this article is available online.
Notes
Author biographies
References
Supplementary Material
Please find the following supplemental material available below.
For Open Access articles published under a Creative Commons License, all supplemental material carries the same license as the article it is associated with.
For non-Open Access articles published, all supplemental material carries a non-exclusive license, and permission requests for re-use of supplemental material or any part of supplemental material shall be sent directly to the copyright owner as specified in the copyright notice associated with the article.