
Abstract
Word frequency has a long history of being considered the most important predictor of word difficulty and has served as a guideline for several aspects of second language vocabulary teaching, learning, and assessment. However, recent empirical research has challenged the supremacy of frequency as a predictor of word difficulty. Accordingly, applied linguists have questioned the use of frequency as the principal criterion in the development of wordlists and vocabulary tests. Despite being informative, previous studies on the topic have been limited in the way the researchers measured word difficulty and the statistical techniques they employed for exploratory data analysis. In the current study, meaning recall was used as a measure of word difficulty, and random forest was employed to examine the importance of various lexical sophistication metrics in predicting word difficulty. The results showed that frequency was not the most important predictor of word difficulty. Due to the limited scope, research findings are only generalizable to Vietnamese learners of English.
Introduction
For decades, word frequency has been operationalized as the main predictor of word difficulty (Hashimoto, 2021). This frequency-difficulty assumption has been widely adopted by vocabulary test creators (McLean & Kramer, 2015; Webb et al., 2017). In recent years, this assumption has been the topic of debate, and several attempts have been made to re-examine the predictive relationship between numerous variables of lexical sophistication and word difficulty (Hashimoto, 2021; Hashimoto & Egbert, 2019; Robles-García et al., 2023; Stewart et al., 2022; Vitta et al., 2023). While these studies offer useful insights into this relationship, all of them share certain limitations that warrant further research.
The first limitation concerns how word difficulty has been estimated. In all the mentioned studies, the researchers obtained word difficulty values by measuring the form-meaning knowledge of a group of learners and then computing Item Facility (IF) or Rasch item measures. This operationalization of word difficulty is appropriate, except in all cases, a Yes/No vocabulary test was used. The problem with Yes/No tests is that a “yes” response may correspond with a wide range of word knowledge, from understanding meaning to a bare awareness of form (Nation & Coxhead, 2021). We would argue that although form recognition is an important step in learning new words, it is insufficient for communication, and so tests of the form-meaning link are clearer measures of word difficulty.
The second limitation lies with the statistical methods employed to determine the best predictor of word difficulty. In previous studies, variable importance values were determined and compared using statistical techniques based on linear regression modeling. Statistics based on general linear modeling (GLM), while suitable for confirmatory analysis, can be inappropriate for exploratory research (Fife & D’Onofrio, 2023; Mizumoto, 2023). One reason is that they rely on many assumptions (independence, normality, homogeneity, and linearity) and protections (sample size and corrections for multiple tests) to yield reliable probability estimates (Fife & D’Onofrio, 2023; Hastie et al., 2009). These conditions are unlikely to be met in exploratory data analysis (Fife & D’Onofrio, 2023). Another reason is that, as the standardized beta coefficients obtained from multiple regression analyses cannot fully resolve the correlations between predictor variables, these statistical tools sometimes confuse which predictor to give credits to (Fife & D’Onofrio, 2023; Mizumoto, 2023). In addition, due to the lack of a built-in cross-validation mechanism, GLM-based statistics are vulnerable to overfitting (Fife & D’Onofrio, 2023). Overfitting refers to the situation where a model appears to perform better than it actually does, usually caused by the model accidentally fitting its error terms, or residuals. As these residuals are not reproducible, a model may perform well on the dataset used to build it but not with new data. The only way to detect overfit is cross-validation, that is, fitting the built model to another dataset, which is usually not feasible for GLM-based methods.
To address these limitations, the current study employed meaning-recall testing, the format that offers perhaps the deepest and most accurate measure of the form-meaning link (Nation & Coxhead, 2021). In particular, a meaning-recall version of McLean and Kramer’s (2015) New Vocabulary Levels Test (NVLT) was given to a cohort of 304 Vietnamese students. In the modified version, all the response options were removed, leaving only the item stems, and learners provided translations of the target words. In addition, random forest (RF, Breiman, 2001), a statistical method that addresses the limitations of regression for exploratory data analysis or data mining (Fife & D’Onofrio, 2023; Hastie et al., 2009; Mizumoto, 2023), was employed to compare the importance of word frequency and other lexical sophistication measures.
Machine learning and RF
Machine learning (ML) algorithms analyze data with the ability to learn and improve their predictions from experience without being explicitly programmed. ML can be categorized as supervised, unsupervised, semi-supervised, and reinforcement (Hastie et al., 2009). The key difference between the first three is the use of labeled or unlabeled data, with supervised ML using labeled data, unsupervised ML analyzing unlabeled data, and semi-supervised ML being able to analyze both (Sarker, 2021). Reinforcement ML uses a reward–penalty system to receive feedback from the environment and find the best solution (Sarker, 2021). Reinforcement ML is usually applied in the development of artificial intelligence (AI) in games such as chess. Supervised ML such as Decision Tree (DT), RF, artificial neural networks (ANN), support vector machines (SVM), and K-nearest neighbor (KNN) are most frequently used in exploratory data analysis where the importance of several independent variables is examined and compared. Recent studies of Brandić et al. (2023) and Moghadam et al. (2023) found that RF and ANN outperform other ML models in term of predictive performance. This paper is another attempt to extend the method showcase of Mizumoto (2023) and advocates the use of RF in applied linguistics.
As its name suggests, RF, a non-parametric ML model, is built on DTs, usually hundreds or even thousands in number (Fife & D’Onofrio, 2023; Hastie et al., 2009). In RF, the prediction is made based on the results of DTs by major voting or averaging. A DT, in non-technical terms, is an ML algorithm that employs tree-like structure to represent classifications and their possible outcomes. Figure 1 shows an example of a DT that predicts the BNC/COCA frequency band of 123 words in this study’s dataset based on their values of contextual distinctiveness (McD_CD), age of exposure (aoe_inverse_average, AoE), semantic distinctiveness (Sem_D), and lexical concreteness (Brysbaert_Concreteness_Combined_AW). For the DT used in this illustration, 20% (24 words) of the dataset is held out for cross-validation, leaving 99 (80%) words in the model.
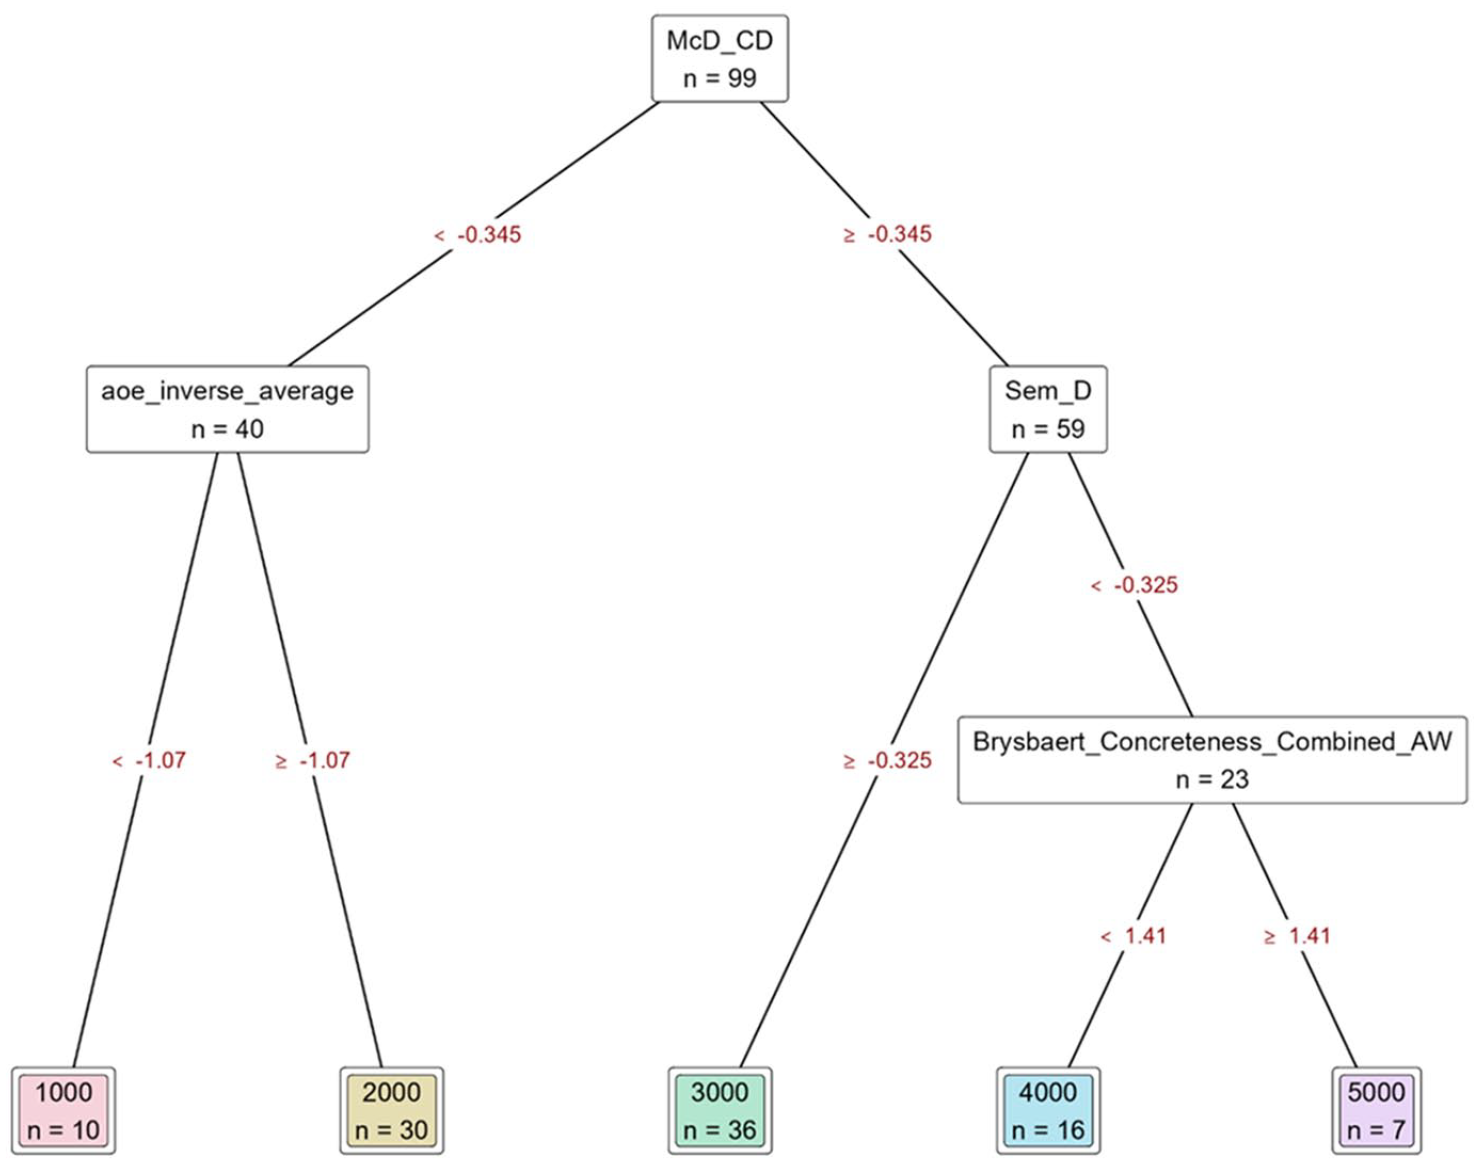
An example of a decision tree.
The top square, or the root node, separates words according to whether the co-occurrence probability value, an indicator of contextual distinctiveness, is −0.345 or greater. If the answer is no, then a second node, referred to as a branching or internal node, further separates words based on inversed average AoE. Words with values below −1.07 are predicted to belong to the 1 K band, and those above to the 2 K band. Returning to the root node, words with McD_CD values of −0.345 or greater are directed to a different branching node that separates words based on a semantic distinctiveness threshold of −0.325. This process continues until all words are predicted in the lowest nodes in the tree, which are called terminal or leaf nodes. Nodes that are in the middle of the tree, regardless of specific level, are called branching nodes or branches. The leaves in this DT are presented as square boxes. Classification accuracy can be identified at each node level using a metric called node purity, or sum of squared residuals (Fife & D’Onofrio, 2023).
In RF, each DT randomly samples with replacement, a process called bootstrapping (Breiman, 2001). Normally, the bootstrapped sample size is set at 67% of the original dataset, leaving the remaining 33% for cross-validation (Fife & D’Onofrio, 2023). The reserved sample for cross-validation is called the out-of-bag (OOB) sample (Breiman, 2001). After DTs are built using the bootstrapped dataset, the OOB sample is applied on each DT to generate another round of predictions. The degree of agreement between the OOB and bootstrapped data reflects the prediction accuracy of the RF model. In this study, the original dataset of 123 target words was split into (1) a training dataset, (2) a validation dataset and, (3) a test dataset. The training dataset was used to build the initial RF model, and then the test and validation datasets were used for cross-validation. OOB errors, or degree of agreement between the OOB and bootstrapped samples, were calculated for the training and validation datasets to evaluate model prediction accuracy.
In addition to OOB cross-validation, there is another built-in cross-validation mechanism in RF called the hold-out sample (Breiman, 2001). That is, RF compares mean-squared error (MSE) between the three models constructed using the training, validation, and test datasets mentioned in the previous paragraph. Low MSE values for training and test models indicate a good model fit, while high training and test MSEs may suggest underfitting, when the model does not perform well either in training or test data. Low training MSE but high test MSE may suggest overfitting. This means that the model fitted noise or random patterns in training data that do not generalize well in test data.
In addition to sampling participants, RF also samples variables. Normally, the minimum sample size is
RF is believed to outperform traditional regression models because it (1) is less vulnerable to overfitting (Breiman, 2001; Fife & D’Onofrio, 2023), (2) has fewer statistical assumptions as a non-parametric model (Fife & D’Onofrio, 2023; Mizumoto, 2023), (3) has built-in cross-validation mechanisms (Breiman, 2001; Fife & D’Onofrio, 2023; Mizumoto, 2023), and (4) can be used when there are more variables than participants (Breiman, 2001; Fife & D’Onofrio, 2023). To the best of our knowledge, no research has used RF to examine the predictive relationship between various metrics of lexical sophistication and word difficulty.
The general objective of the present research was to determine the strongest predictor of word difficulty under an RF approach. Therefore, the study is driven by the following research question:
Amongst several lexical sophistication metrics, what is the strongest predictor of word difficulty?
Methods
Participants
The study involved 304 second-year Vietnamese university students. All completed 9 years of compulsory English education at elementary, middle and high schools, plus three mandatory modules of Business English at the tertiary level, suggesting an average Common European Framework of Reference for Languages (CEFR) proficiency level of B1 or higher.
Target words
Out of 150 NVLT target words, 149 were included in our analysis. These included the 120 words sampled from the first five 1,000-word bands of the BNC/COCA lists, and 29 of the 30 items from the Academic Word List that were also from the first 5 K of the BNC/COCA. The AWL word “notwithstanding” was a 6 K word and therefore excluded as an outlier. The frequency variable used in our analysis was BNC/COCA band, with values from 1000 to 5000.
Word difficulty
A meaning-recall test was utilized as a word difficulty measure. This test consisted of the NVLT item stems, and participants were instructed to demonstrate target-word knowledge by providing written L1 definitions or explanations. Responses were marked by two Vietnamese applied linguists who are highly proficient in English. Any dictionary definition of a target word, regardless of part of speech or meaning sense, was marked as correct. Inter-rater reliability was “Almost Perfect” (κ = .95; Landis & Koch, 1977, p. 165). The Rasch item and person reliability indices were .98 and .97, respectively.
Word difficulty was operationalized as IF, or the proportion of correct responses to an item, with possible values ranging from 0.00 to 1.00.
Lexical sophistication
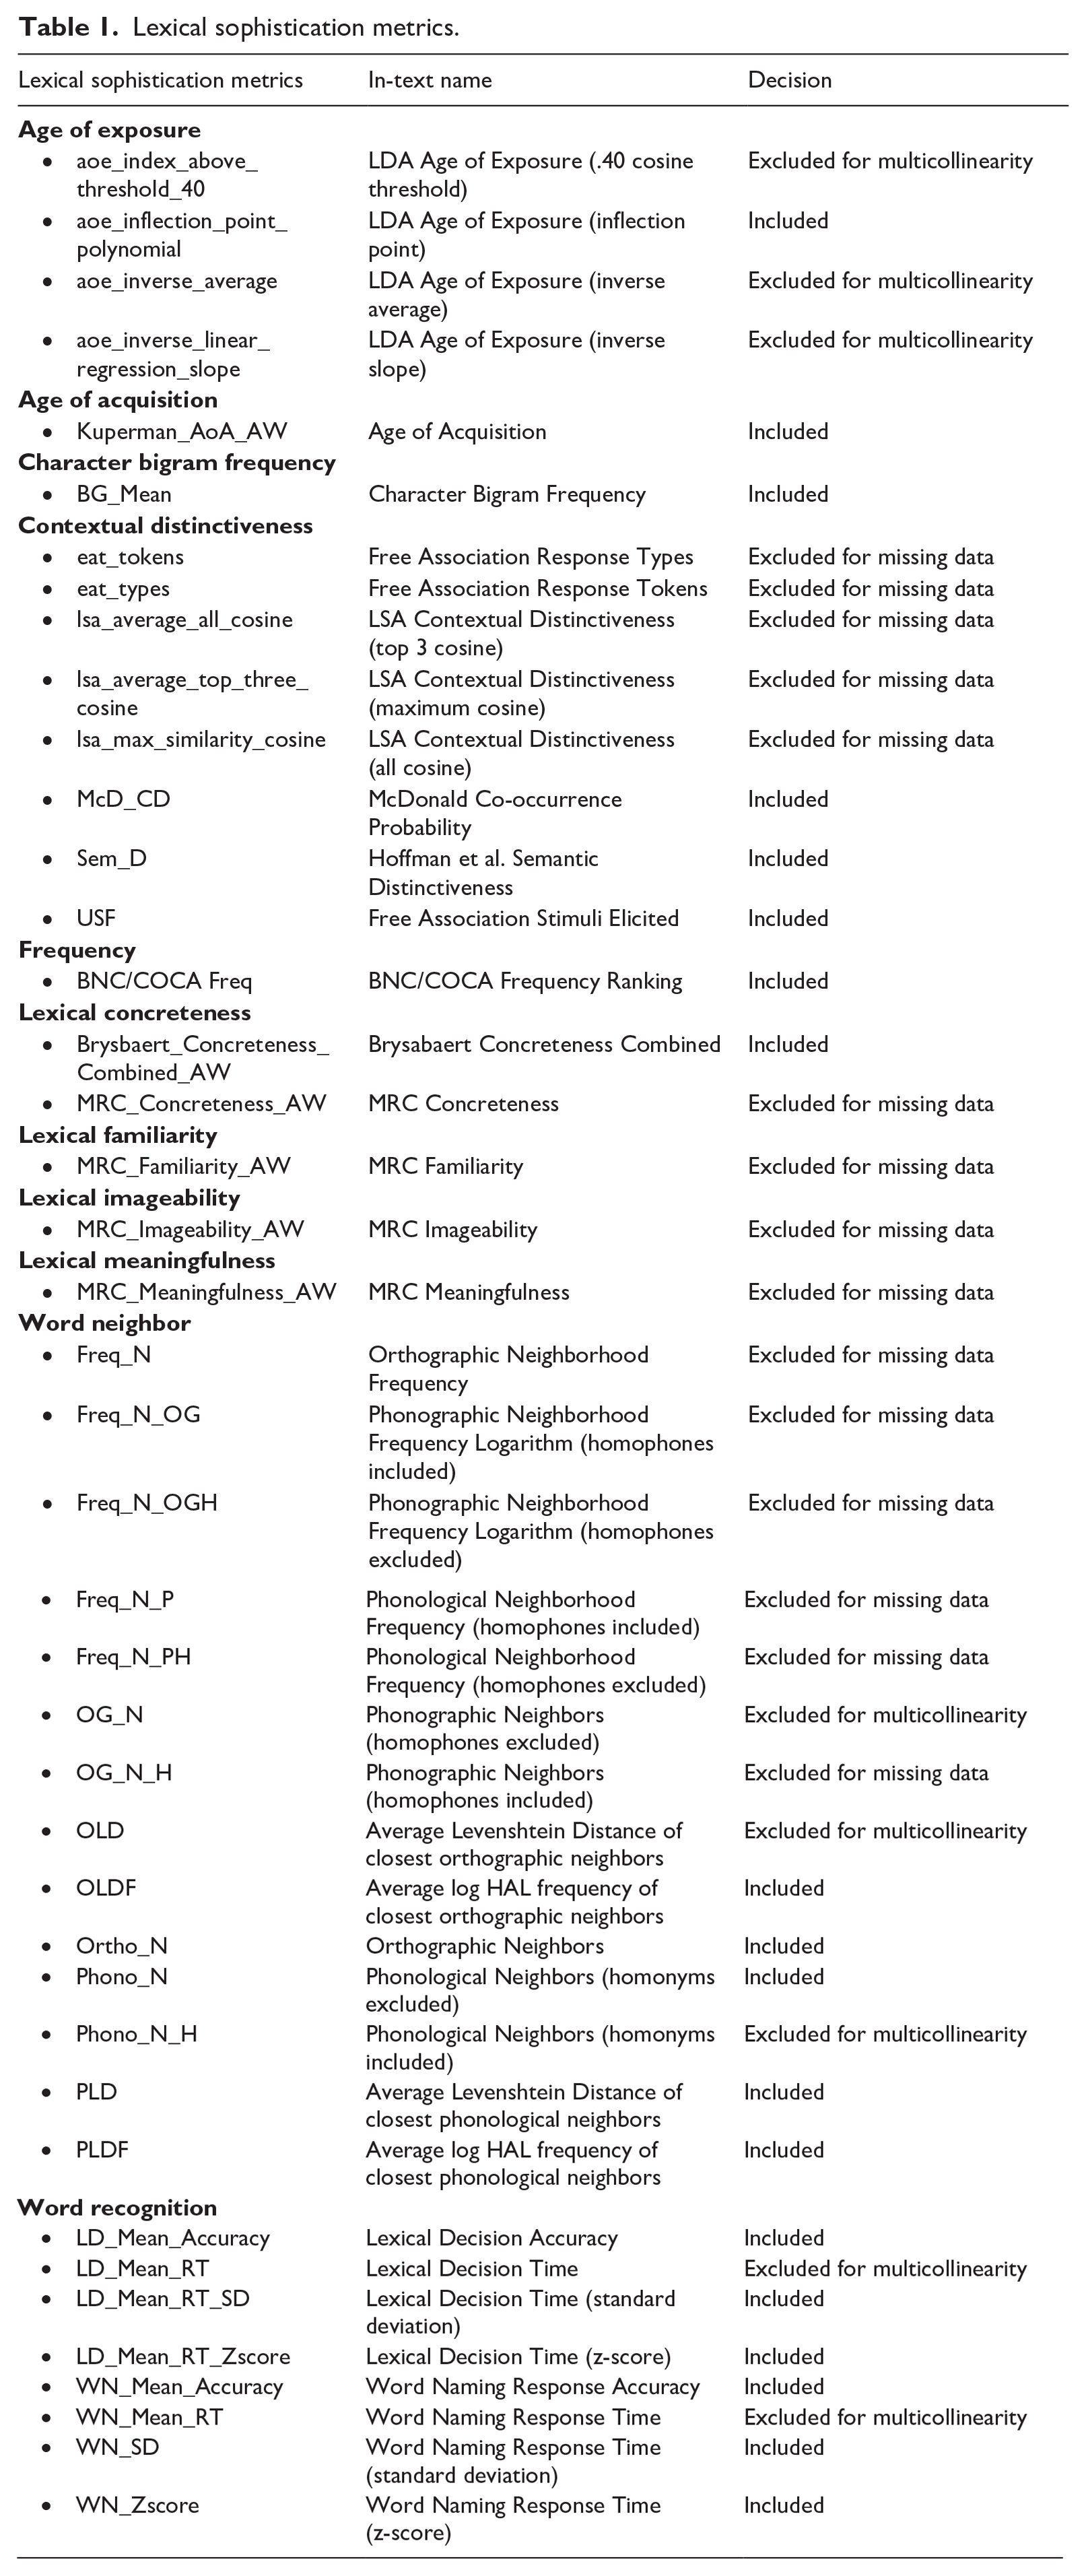
TAALES 2.2 (Kyle et al., 2018) was used to compute the lexical sophistication metrics for the 149 target words. As BNC/COCA frequency was operationalized as the main measure of frequency, all TAALES range and frequency measures were excluded. All options for isolating content words and function words were excluded, and only all-word measures were included in the analysis. This initially resulted in 42 lexical sophistication measures, including BNC/COCA frequency, for each target word.
However, TAALES is an incomplete dataset, with some metrics of lexical sophistication absent for some words. In this study, missing data are detected using the index coverage data offered by TAALES. Lexical sophistication metrics were classified as good coverage if missing data rate were less than 10%, or 12 words, moderate coverage if missing data rate is between 10% and 20% (12–25 words). Metrics that cover less than 80% of the data (missing from 26 words) were classified as bad coverage. Metrics with bad coverage were excluded from further analyses. 15 lexical sophistication metrics were excluded. Words that were not covered by the remaining metrics were removed. Twenty-six words were deleted.
The retained 27 features were checked for multicollinearity. RF is relatively robust to multicollinearity as each DT trains on a random subset of features which may not always highly correlate. However, multicollinearity may affect feature importance of highly correlated predictors, even in RF. Therefore, predictors with Pearson correlations of .80 or higher were flagged for multicollinearity, and those with the strongest correlations with IF were retained while the others were excluded from further analyses until all inter-predictor correlations were below .80. In this process, eight metrics were removed, and 19 remained in the final RF model. Table 1 shows the inclusion and exclusion of metrics. See TAALES 2.2’s index description spreadsheet for details on each metric (Kyle et al., 2018; https://www.linguisticanalysistools.org/taales.html).
Lexical sophistication metrics.
Data analysis
The open source statistical package, JASP 0.18.3.0 (JASP Team, 2024), was used for statistical analysis. RF (Breiman, 2001) was selected as the primary statistical technique to compute variable importance. For each DT, the ratio of training to OOB sample size was set at 67% and 33%, in the order given. For the RF model, 70% of the data was used to train the RF model, and the remaining 30% was split in half into test and validation datasets. The sample size (i.e., number of target words) for training, validation, and test datasets were 87 (70.7%), 18 (14.6%), and 18 (14.6%), respectively. It is worth noting that JASP holds out test and validation data consecutively, not simultaneously. This means that it first takes out a proportion of the data for the test model and later removes data for the validation model from the remaining data. As a result, the 70:15:15 ratio was obtained by setting test data at 15% of the original dataset, and setting validation data at 17% of the remaining data. Random seed was fixed at 1. The number of features per split was set at m/3 with m being the number of predictors (Fife & D’Onofrio, 2023). As a result, the RF model with 19 predictor variables had 19/3 = 6 features per split.
We applied feature scaling, a statistical method used to normalize the range of several independent variables or features. This variable standardization technique ensures values of features from different scales range into a particular, similar scale and therefore offers better stability (Hastie et al., 2009). The current version of JASP uses Z-score standardization with mean equals 0 and SD of 1 as the default option for feature scaling. JASP determined the optimal number of trees for the RF model to be 786 (with the maximum set at 500,000).
Correlation coefficients between the metrics of lexical sophistication and IF were computed for a rough comparison in predictor importance between RF and a GLM-based technique. As RF is non-parametric, a non-parametric method for estimating correlation coefficients, Spearman, was selected.
Data generated and used in this study are available on the Open Science Framework (Ha et al., 2024).
Results
Tables 2 offers descriptive statistics for each metric. Skewness and kurtosis values indicate departure from normality in some cases. However, as RF does not assume normality, this was not a cause for concern.
Descriptive statistics.
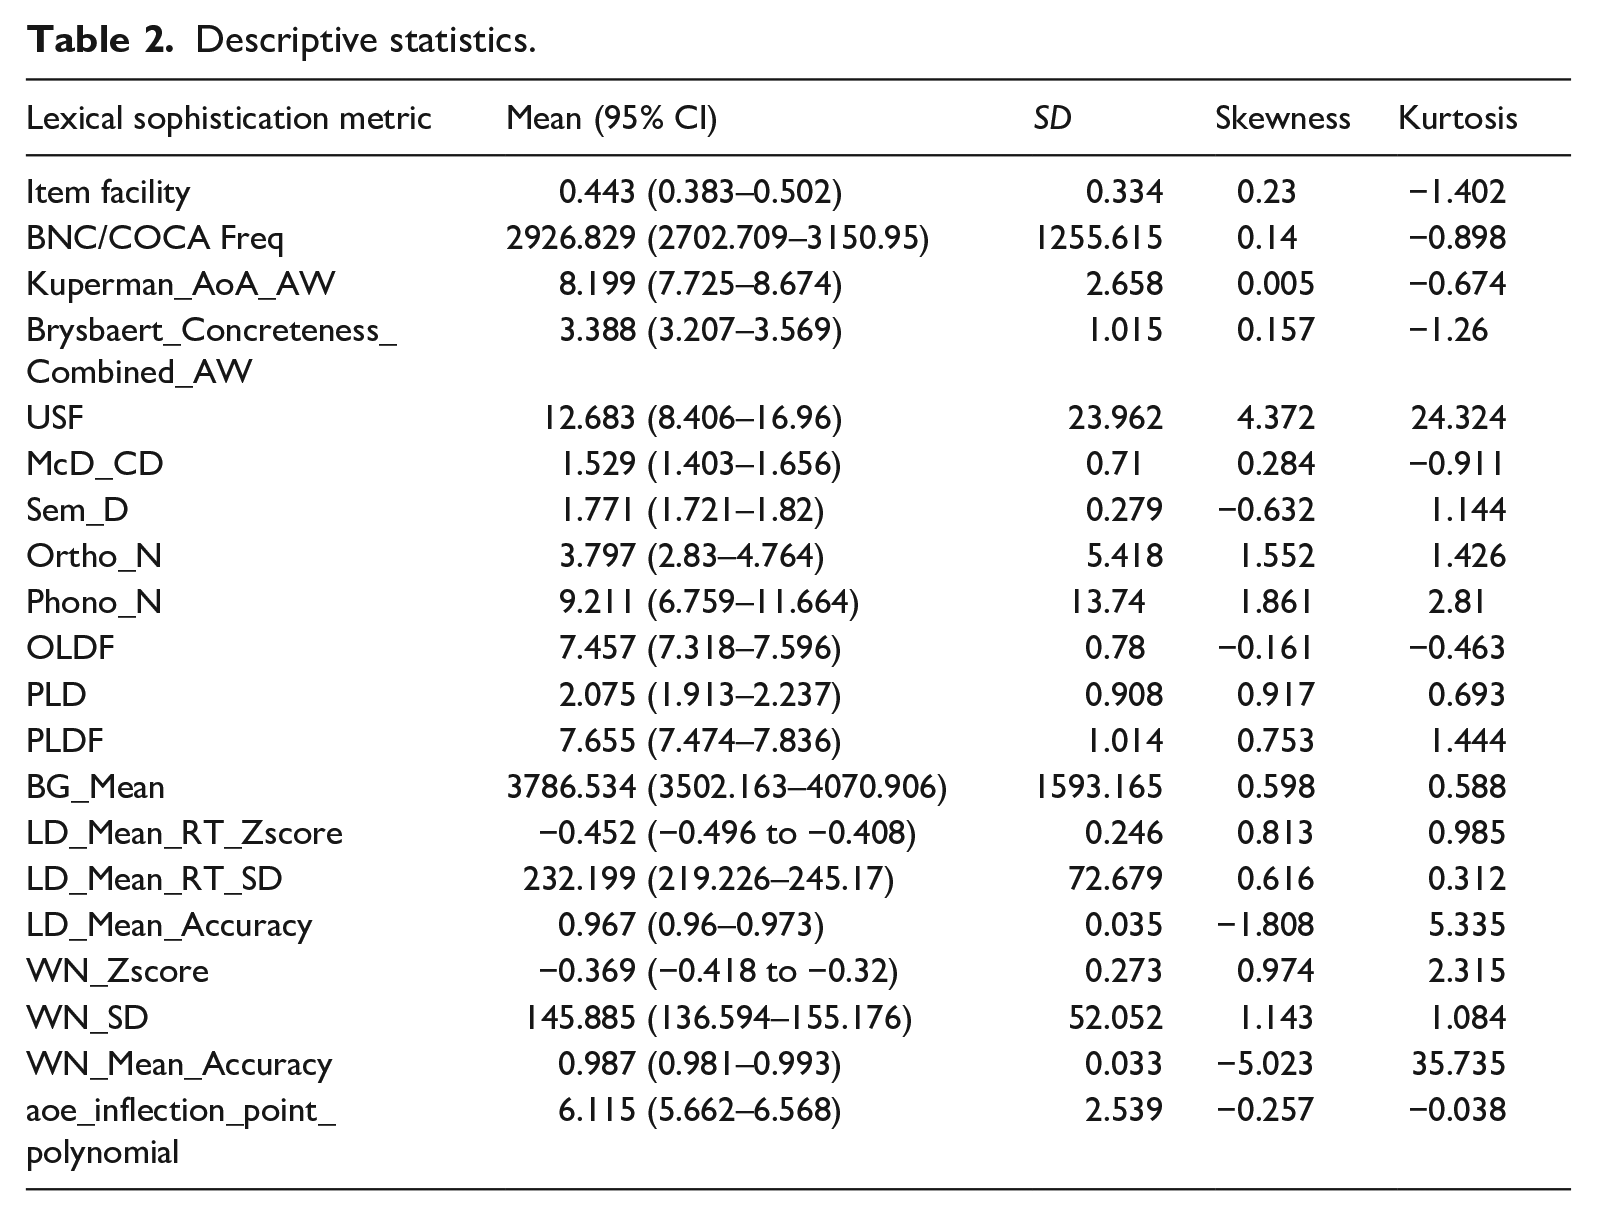
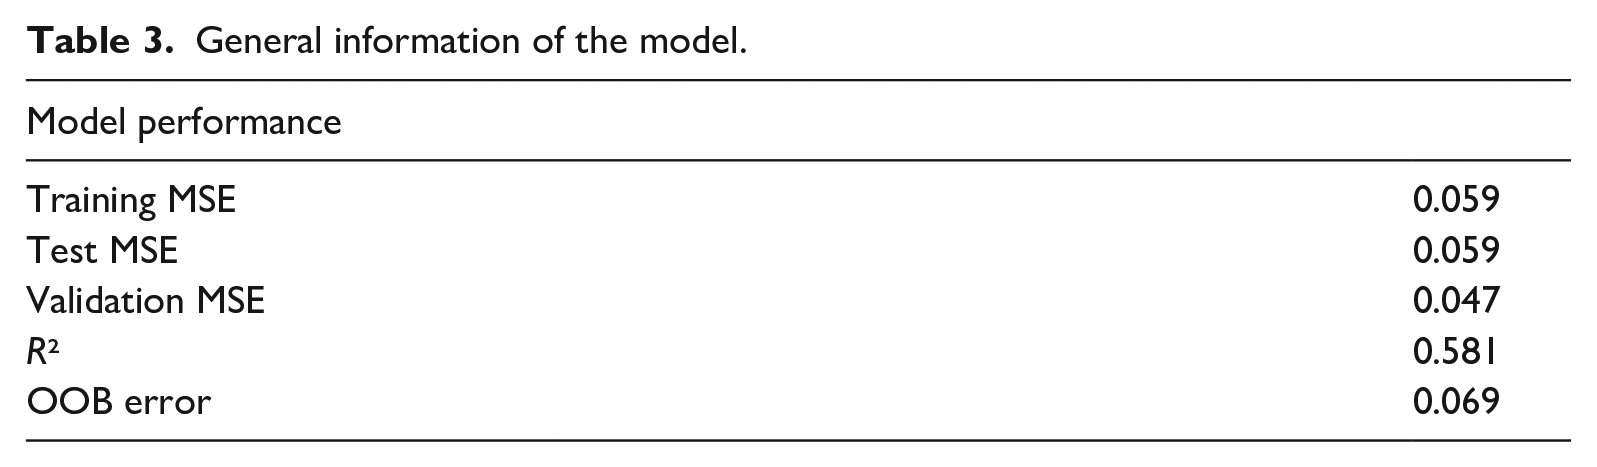
Table 3 shows general information on the first RF model and its performance. Similarly, low MSE values for the training, test, and validation models indicate good and consistent model fit. OOB error demonstrated a high degree of agreement at 1 – 0.069 = 93.1%. Figure 2 graphically depicts the strong agreement between the training and validation models. The R2 value of .581 indicates that the RF model explained a substantial portion of the total variance of word difficulty. Figure 3 provides a visual presentation of the model’s predictive performance of the test model.
General information of the model.
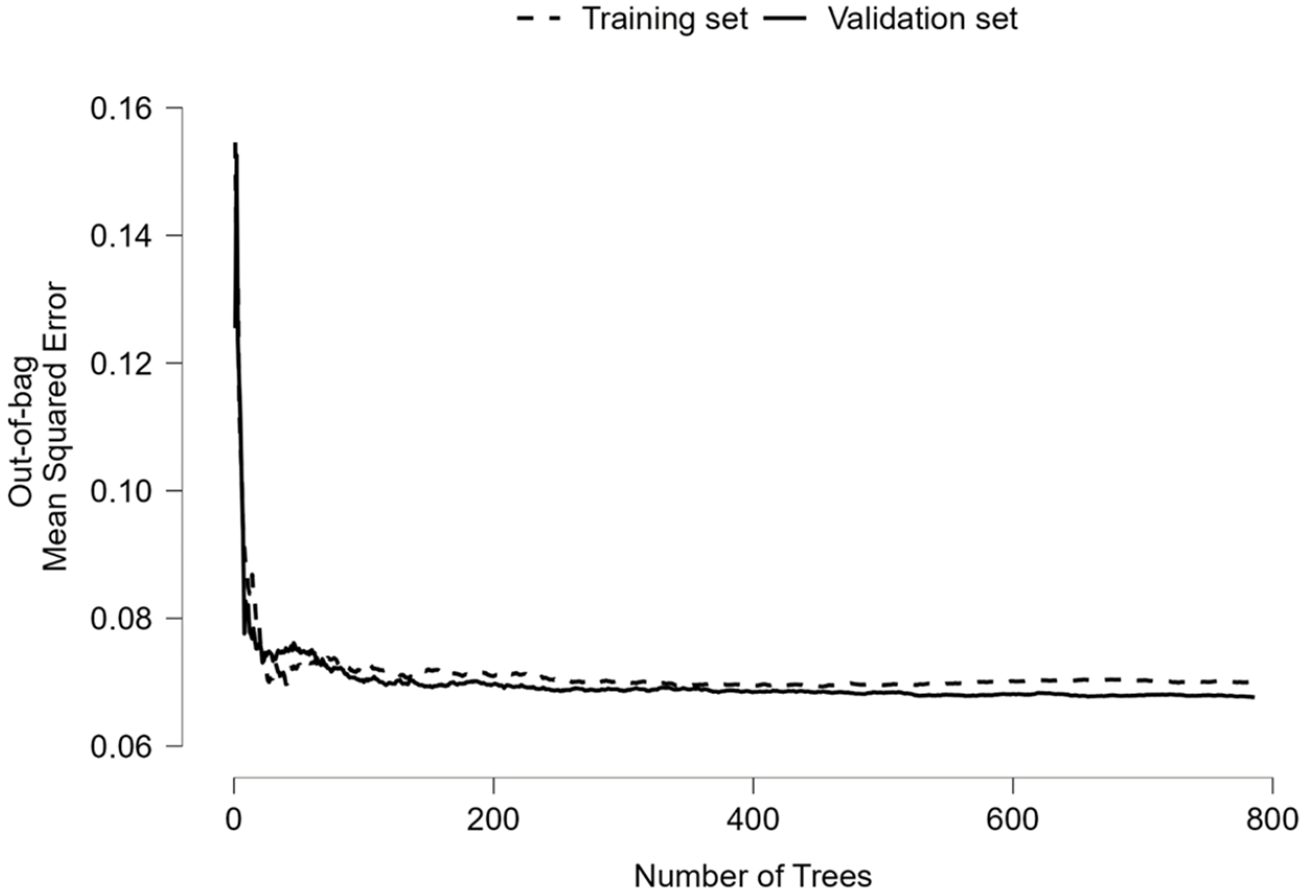
Out-of-bag mean-squared error plot.
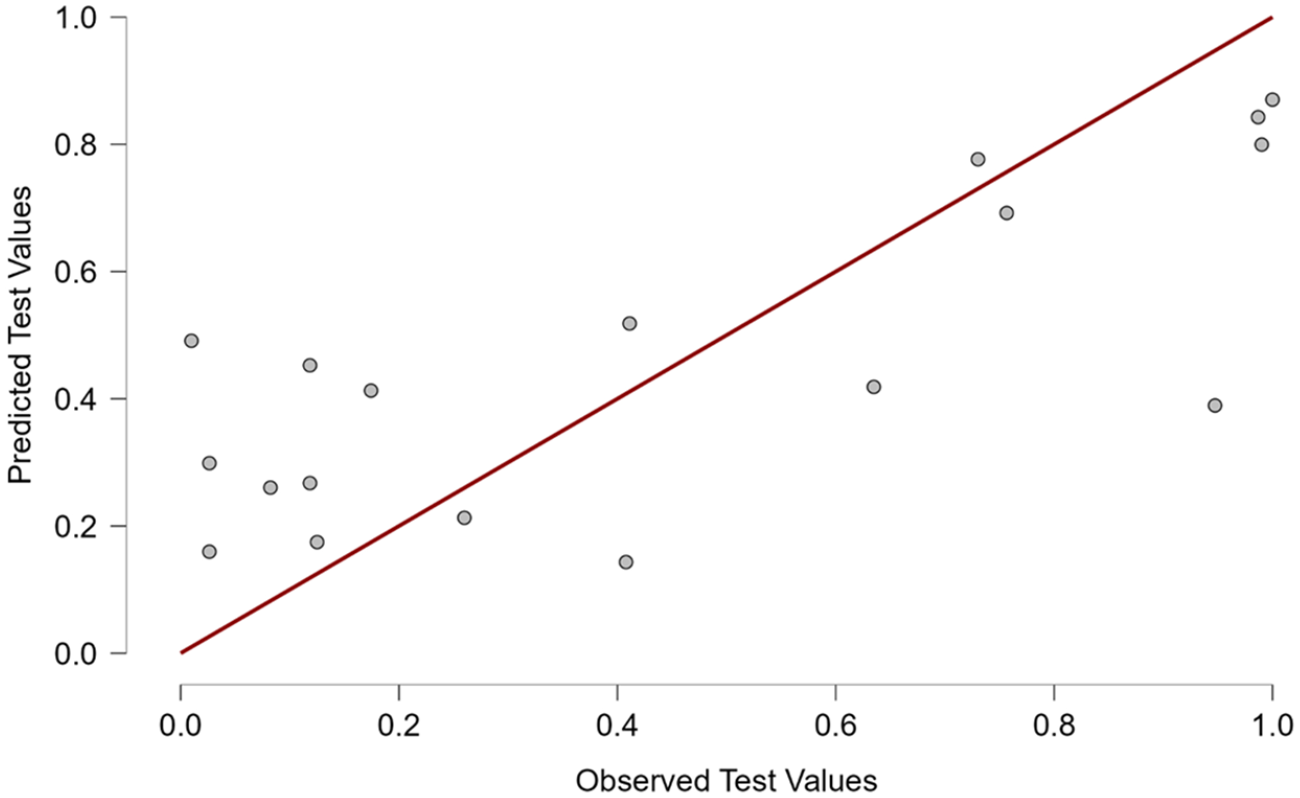
Predictive performance plot of the test model.
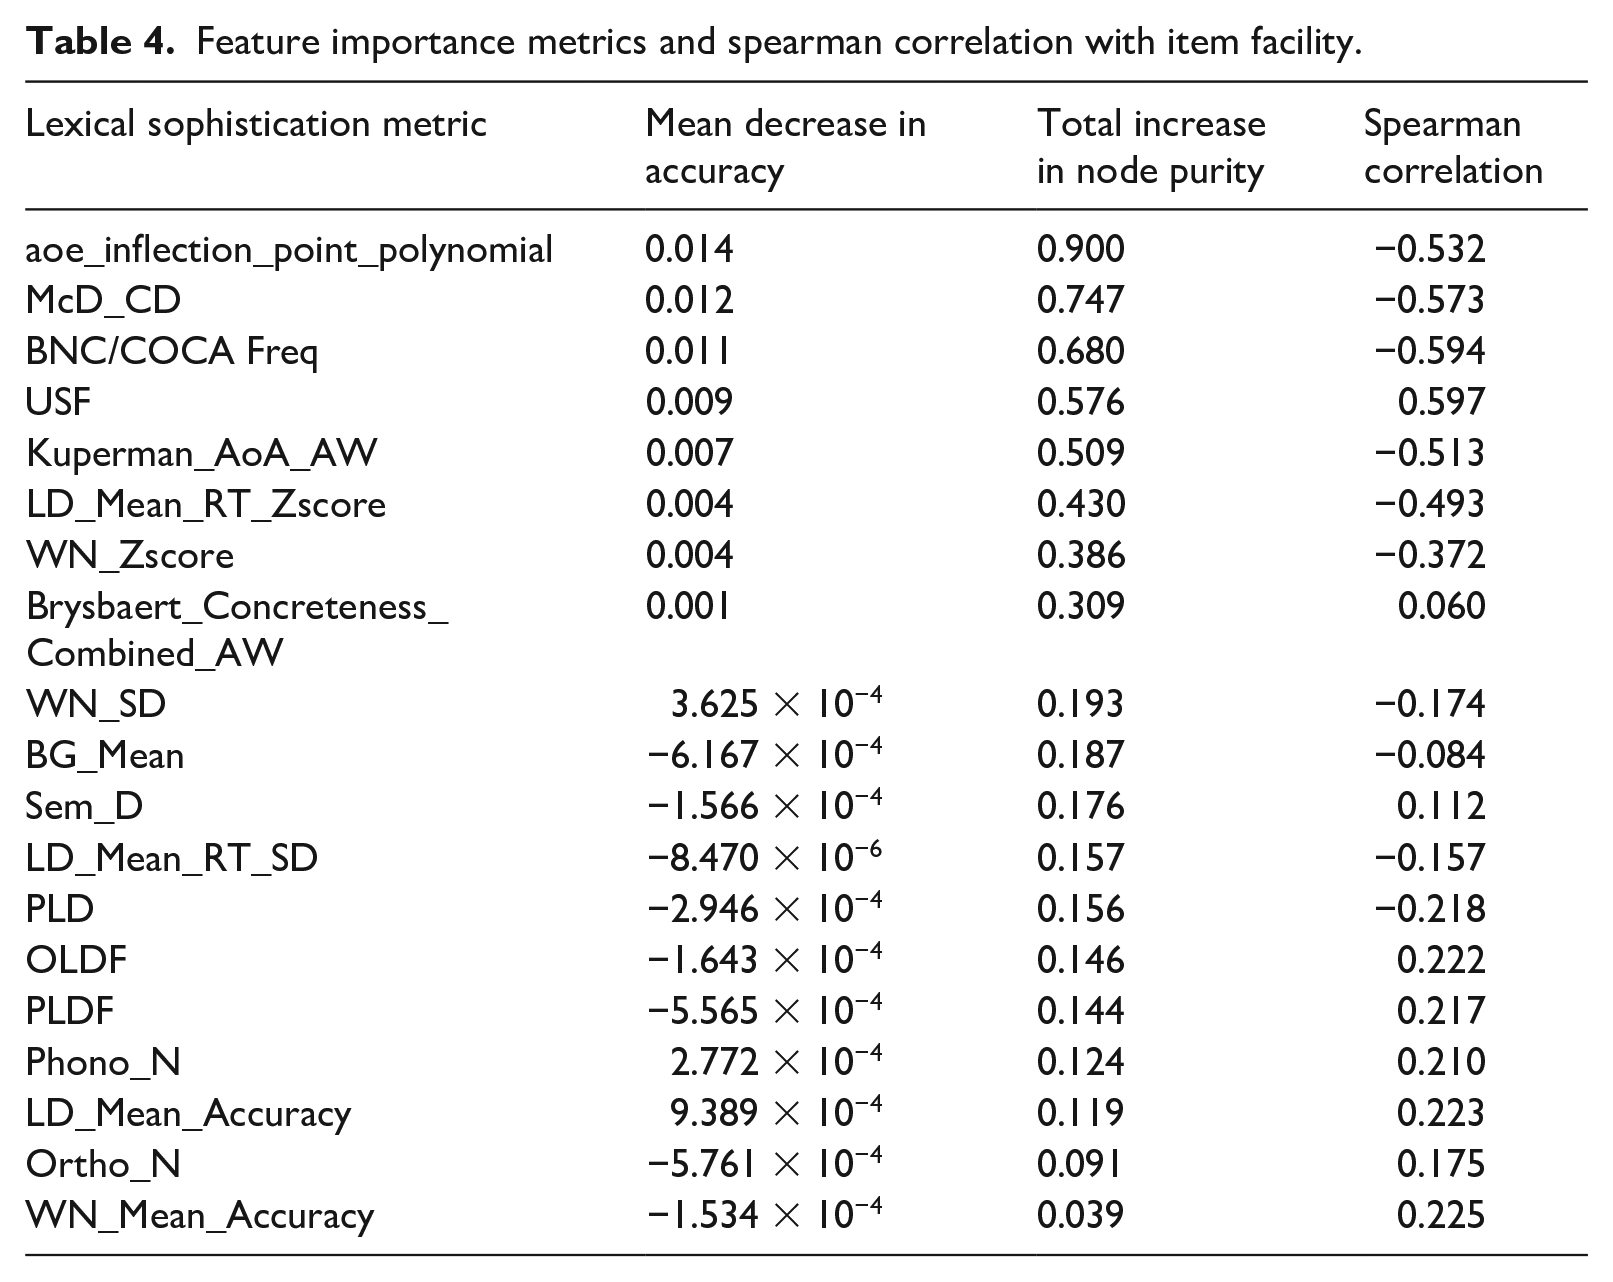
Table 4 lists the importance of the 19 predictors and their correlations with IF, in order by total increase in node purity. The result witnessed a strong degree of agreement between the two RF’s metrics of variable importance, namely total increase in node purity and mean decrease in accuracy, up to the 8th predictor (Brysbaert_Concreteness_Combined_AW). AoE (aoe_inflection_point_polynomial) was clearly the strongest predictor of word difficulty, with contextual distinctiveness (McD_CD) and word frequency (BNC/COCA Freq) ranking second and third. Fourth was USF, another metric of contextual distinctiveness, highlighting the importance of this subcategory to word difficulty. Age of acquisition (AoA) came fifth, and the next two places belonged to the standardized values of lexical decision time (LD_Mean_RT_Zscore) and word naming response time (WN_Zscore), which were the two metrics of word recognition. Although not shown in Table 4, USF and McD_CD correlated at −0.575 and LD_Mean_RT_Zscore and WN_Zscore correlated at 0.567, suggesting that their contribution to word difficulty was relatively unique. The presence of several unique predictors of word difficulty suggested multidimensionality of the word difficulty construct. Figures 4 and 5 offer graphic illustrations to the two metrics of predictor importance in RF.
Feature importance metrics and spearman correlation with item facility.
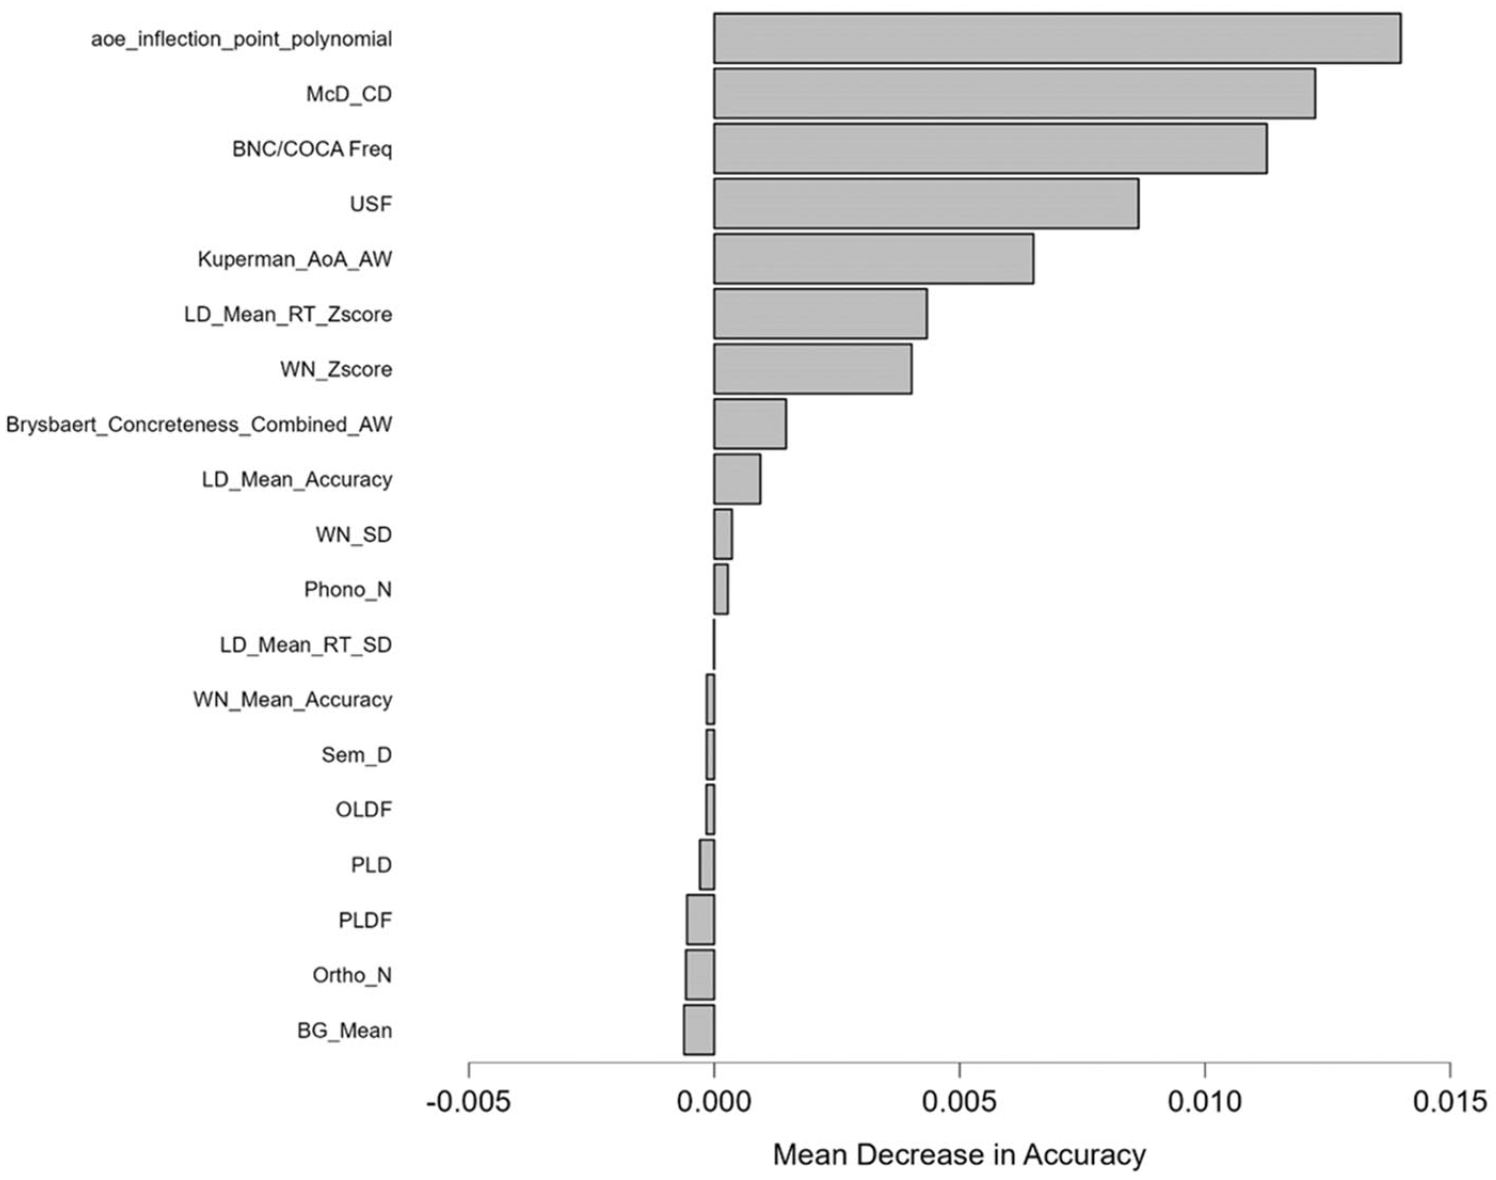
Mean decrease in accuracy plot.
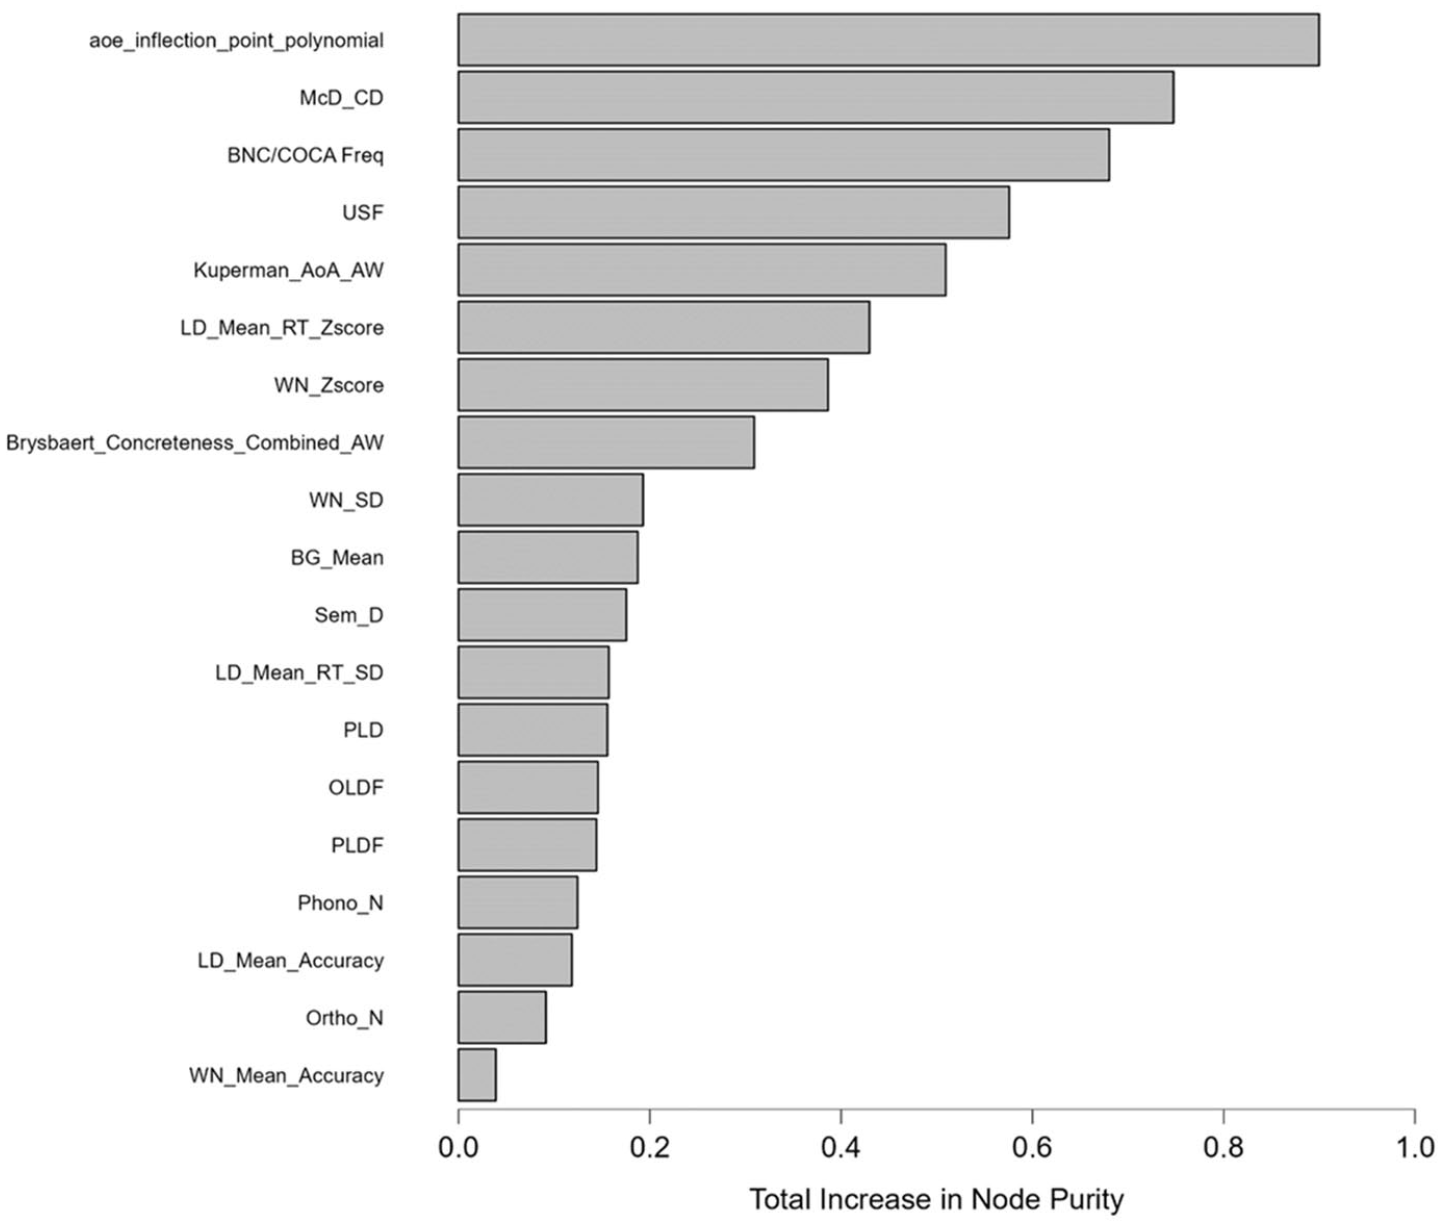
Total increase in node purity plot.
Table 4 also shows the correlations between 19 predictors and IF. There is some agreement between the correlation coefficients and the two RF’s metrics of predictor importance. However, the predictors with the strongest correlations with IF such as BNC/COCA frequency ranking and USF were not ranked first in the RF model. Similarly, Brysbaert’s Concreteness value, had a substantially lower correlation than LD_Mean_Accuracy and WN_Mean_Accuracy but was ranked higher than those predictors in the RF model.
Discussion and conclusion
By using a more rigorous measure of word difficulty and arguably better data mining procedures, this brief report represents another attempt to examine which lexical characteristics best predict word difficulty. The results support the findings of Vitta et al. (2023) and Hashimoto and Egbert (2019) that word difficulty is predicted by multiple aspects of lexical sophistication in addition to frequency. This study found AoE (aoe_inflection_point_polynomial) to be the most important predictor of word difficulty. This is a new and interesting finding as AoE has never been included in Hashimoto and Egbert’s or Vitta et al.’s models. Vitta et al. excluded AoE due to potential distributional violations which is not a concern for RF. In fact, Dascalu et al. (2016) introduced AoE as an improved model of word learning process that would overcome the limitations of AoA and Word Maturity (Landauer et al., 2011). The second most important predictor, McD_CD, were also ranked as one of the strongest predictors of word difficulty in Hashimoto and Egbert’s model.
Different from other studies that based their frequency measures on metrics provided by TAALES, this study used BNC/COCA bands so that the findings can be directly related to BNC/COCA-based vocabulary tests. The results indicate that word difficulty is predicted by several, unique variables, the most important of which is not BNC/COCA frequency. This could explain why Webb et al. (2017, p. 47) could only partially model word difficulty according to BNC/COCA frequency in their vocabulary test validation study.
These findings provide further evidence that frequency, particularly when it is based on corpora comprising of mostly written, British and American English, offers only a rough estimation of word difficulty. This may be especially true in EFL contexts where the exposure of learners to English words is heavily influenced by textbooks and teachers’ lessons, which may not always reflect natural frequency (Webb et al., 2017, pp. 46–48). In this study, the measure of word difficulty was based on a sample of Vietnamese learners, whose learning experiences may not relate well with British- and American-based frequency rankings. This is one of this study’s, and arguably all previous studies’, limitations. That is the misalignment between the subjects and the variables, or measures of word difficulty and lexical sophistication. This was why Hashimoto and Egbert (2019) excluded AoA from their analysis, stating that the metric pertained “only to learners from specific L1 backgrounds” (p. 850). In addition, the fact that the dataset included responses from only Vietnamese learners limits generalizability. That is, the results may differ if word difficulty included data from learners of different backgrounds. This is something that future research should examine.
As a tool for exploratory data analysis, RF’s estimation of variable importance does not involve significance testing, which is a feature of confirmatory data analysis (Fife & D’Onofrio, 2023). As a result, certain concerns may be raised regarding the statistical significance of the differences between values of predictor importance as well as the ranking of predictors. While we acknowledge this limitation of the method, it is worth noting that RF has been shown to make robust inferences beyond the data (Fox et al., 2017). Moreover, the results of an RF model are cross-validated, which warrants reproducibility. In other words, the cross-validation procedures make sure that the results do not occur by mere chance. In addition, as the estimation of mean decrease in accuracy involves random permutation of subjects’ OOB scores, it greatly reduces the effects of correlations between predictors and therefore reflects their unique importance to the outcome variable. Together, these warrant that the ranking of predictors is based on their unique importance, which is robust and reproducible.
Findings from the current study have implications for the sampling process in vocabulary test development, especially tests that sample from the BNC/COCA lists. That is, when selecting target words from a particular frequency level, perhaps attention should be paid to other word difficulty metrics so that the average difficulty of the sample better reflects that of the whole frequency level.
Footnotes
Acknowledgements
The authors would like to express their sincere thanks to the four anonymous reviewers who invested their valuable time in reviewing our paper. Their expertise and thoughtful suggestions have significantly improved the quality of our manuscript. They also wish to thank editors Ruslan Suvorov and Benjamin Kremmel for their efforts in facilitating a smooth and timely review process.
Author contributions
Declaration of conflicting interests
The authors declared no potential conflicts of interest with respect to the research, authorship, and/or publication of this article.
Funding
The authors received no financial support for the research, authorship, and/or publication of this article.
Ethics approval
We obtained ethics approval from the University of Economics Ho Chi Minh City (UEH). All participants provided written informed consent.
Availability of data and materials
The data that support the findings of this study are openly available on our Open Science Framework project page (Ha et al., 2024) at ![]()