
Abstract
Cognitive diagnostic assessment (CDA) intends to identify learners’ strengths and weaknesses in latent cognitive attributes to provide personalized remedial instructions. Previous CDA studies on English as a Foreign Language (EFL)/English as a Second Language (ESL) writing have adopted dichotomous cognitive diagnostic models (CDMs) to analyze data from checklists using simple yes/no judgments. Compared to descriptors with multiple levels, descriptors with only yes/no judgments were considered too absolute, potentially resulting in misjudgment of learners’ writing ability. However, few studies have used polytomous CDMs to analyze graded response data from rating scales to diagnose writing ability. This study applied polytomous CDMs to diagnose 1166 EFL learners’ writing performance scored with a three-level rating scale. The sG-DINA model was selected after comparing model-data fit statistics of multiple polytomous CDMs. The results of classification accuracy indices and item discrimination indices further demonstrated that sG-DINA had good performance on identifying learners’ strengths and weaknesses. The generated diagnostic information at group and individual levels was further synthesized into a personalized diagnostic report, although its usefulness still requires further investigation. The findings provided evidence for the feasibility of applying polytomous CDM in EFL writing assessment.
Introduction
With the increasing need for fine-grained information extracted from test performance data, cognitive diagnostic assessment (CDA) is gaining much attention from researchers and practitioners in the field of language assessment (Y. Lee & Sawaki, 2009). CDA aims to measure learners’ specific knowledge structures and processing skills to provide the learners with formative diagnostic feedback about their strengths and weaknesses (Leighton & Gierl, 2007).
To date, only a few CDA studies have been conducted on English writing (e.g., Effatpanah et al., 2019; He et al., 2021; Y. Kim, 2011; Shahsavar, 2019; Xie, 2017). Cognitive diagnostic writing assessment generally starts from developing descriptor-based checklists/scales to measure test-takers’ writing performances. Next, a Q-matrix specifying the relationship between attributes and descriptors (Tatsuoka, 1983) is constructed. Finally, test-takers’ strengths and weaknesses are estimated by cognitive diagnostic models (CDMs).
Previous studies mainly employed rating checklists with dichotomous scoring to assess learners’ writing performances (e.g., He et al., 2021; Y. Kim, 2011). These checklists contained a list of descriptors assessing presence or absence of skills or knowledge and were typically formulated as yes/no questions (Brookhart, 2013). Clearly, rating on such descriptors is in an all-or-nothing format. However, it is worth noting that simple yes/no judgments may not be able to truly reflect test-takers’ writing ability since their writing performances could partially, though not entirely, meet the requirement of the descriptors (Y. Kim, 2011). Rating scales are similar to dichotomous checklists, except that the rating scales assess the degree of accomplishment of skills or knowledge. Rating scales typically list one word descriptors in one column and the quality of the performance in descriptive words in other columns (Brookhart, 2013). With rating scales, test-takers’ writing performances should be evaluated with at least relativistic descriptors distinguishing them to reflect their writing ability as demonstrated their performance. However, in previous research, scoring data were generally analyzed by dichotomous CDMs in prior studies, potentially resulting in diagnostic inaccuracy considering test-takers’ mastery levels of the attributes because of shortcomings of rating checklists.
Recently, polytomous CDMs have been developed to analyze graded response data (e.g., de la Torre, 2010; W. Ma & de la Torre, 2016; Tu et al., 2018). However, to our knowledge, scant studies have examined the applicability of polytomous CDMs in real assessment settings, especially in English as a Foreign Language (EFL) writing assessment contexts. Moreover, in the Chinese context particularly, English writing is a crucial component in the curriculum and in the national standardized examinations of university students’ English proficiency, such as the College English Test-Band 4 (CET-4) and the College English Test-Band 6 (CET-6). Generally speaking, Chinese EFL learners face enormous challenges in English writing (Xiao & Chen, 2018). However, diagnostic assessment of writing is still in its infancy in China. Learners’ writing performances are usually assessed by holistic or analytic scoring methods, which provide limited diagnostic information for learners. There is a pressing need for diagnostic feedback including fine-grained diagnostic information of writing performance to promote learners’ writing ability. Therefore, this study intends to examine the feasibility of applying polytomous cognitive diagnostic modeling to diagnose Chinese EFL learners’ writing ability.
Literature review
The nature of writing ability
Understanding the nature of writing ability is essential to defining assessable attributes in writing. Writing refers to the process of thinking, composing, and encoding language into text, which entails discourse interactions within a socio-cultural context (Cumming, 1998). Hayes’s (1996) writing model and Bachman and Palmer’s (2010) communicative language ability (CLA) model further explains the nature of writing ability. According to Hayes, the writing process is influenced by individual and task environment factors. Specifically, as an individual factor, long-term memory stores knowledge concerning writing tasks, which includes task schemas, topic knowledge, audience, linguistic knowledge, and genre knowledge. The CLA model, however, postulates that language knowledge and strategic competence are crucial components of language ability. The former manifests as organizational knowledge (e.g., grammatical knowledge and textual knowledge) and pragmatic knowledge (e.g., functional knowledge and sociolinguistic knowledge), while the latter stresses goal setting, appraising, and planning. Although the two models reflect major components of writing ability, they mainly focus on elaboration of first language (L1) writing ability. Further exploration of EFL writing ability, on which the current study is based, is required.
EFL writing ability
Admittedly, EFL learners face greater challenges when writing in English compared to their L1 counterparts. Writing models and rating scales can be used to probe EFL writing ability. A model of writing as communicative language use (Grabe & Kaplan, 1996) suggests that the process of EFL writing comprises both external factors and writer internal processing. The former includes the writing situation (e.g., participants, setting, task, topic) and performance (i.e., textual output), and the latter is a series of cognitive activities involving internal goal setting, verbal processing, and internal processing output. Internal goal setting allows writers to set writing goals based on the contextual situation, internal motivations, performance attributions, and interest. During verbal processing and internal processing output procedures, writers employ language competence and world knowledge to produce internal output, which is compared to the goals of the tasks, and revisions are conducted if necessary. In particular, the importance of language competence comprising linguistic knowledge, discourse knowledge, and sociolinguistic knowledge is highlighted in the verbal processing procedure. An explanatory model of EFL writing (Sasaki & Hirose, 1996) suggests that the major explanatory variables influencing EFL writing ability are second language (L2) proficiency, L1 writing ability, and L2 metaknowledge. L2 proficiency influences L2 writing ability through writing fluency. Factors such as writing without pausing and the amount of written text are considered indicators of writing fluency. L1 writing ability mainly affects learners’ strategy application. L2 metaknowledge is a construct that comprises learners’ mastery of socio-cultural knowledge of the target language. According to these two models, EFL writing ability mainly includes linguistic knowledge, discourse knowledge, sociolinguistic knowledge, and strategic knowledge.
Weigle (2002) contends that the rating scale “represents the most concrete statement of the construct being measured” (p. 72). Deeply rooted in the CLA model from Bachman and Palmer (2010), EFL writing ability, as defined in China’s Standards of English Language Ability (CSE; Ministry of Education of the People’s Republic of China, & National Language Commission of the People’s Republic of China, 2018; see also Pan, 2019), is that learners utilize language knowledge including organizational knowledge (i.e., grammatical knowledge, textual knowledge), pragmatic knowledge (i.e., functional knowledge, sociolinguistic knowledge), and writing strategies to generate, construct, and integrate meaning to achieve various communicative purposes. Since learners’ writing strategies cannot be gleaned from texts, language knowledge is the primary focus of this study. In an English as a Second Language (ESL) composition profile (Jacobs et al., 1981; see also Weigle, 2002), constructs as content, organization, vocabulary, language use, and mechanics involving language knowledge were used to measure learners’ writing ability. The reviewed literature reveals that EFL writing ability involves multi-dimensional constructs, which can be captured as subskills through diagnostic procedures.
CDA studies on writing
Prior CDA studies on writing mainly employed rating checklists to evaluate test-takers’ writing performances and adopted dichotomous CDMs to estimate parameters. To illustrate, Y. Kim (2011) developed an empirically derived, descriptor-based (EDD) checklist, which contained 35 fine-grained descriptors measuring content fulfillment, organizational effectiveness, grammatical knowledge, vocabulary use, and mechanics using a reduced reparameterized unified model (RRUM) (Hartz, 2002) to diagnose learners’ writing ability. The results showed that CDA could accurately and reliably identify learners’ writing strengths and weaknesses. Following Kim, Xie (2017) examined the validity of the EDD checklist by diagnosing learners’ academic writing ability in Hong Kong with RRUM and found that more diagnostic information could be provided than just the traditional raw score. The EDD checklist was further validated in an Iranian English learning context using additive CDM (ACDM) (de la Torre, 2011) and RRUM (Effatpanah et al., 2019; Shahsavar, 2019). Different from these studies, He et al. (2021) applied a linear logistic model (LLM) (de la Torre & Douglas, 2004) to diagnose English learners’ writing ability in mainland China by extracting 15 descriptors from CSE to form a new checklist measuring grammatical knowledge, textual knowledge, functional knowledge, and sociolinguistic knowledge.
Although these studies have paved the way for cognitive diagnostic writing assessment, their limitations, especially dichotomous scoring, cannot be ignored. That is, learners’ writing samples were evaluated merely by yes/no judgments on descriptors due to the use of rating checklists. However, as Y. Kim (2011) has suggested, “learners’ writing competence cannot be dichotomized” (p. 534). Rating scales/checklists play crucial roles in rater-mediated performance assessment because rating scales channel the ways raters perceive and evaluate test-takers’ writing samples and then award scores (Eckes, 2008). Presumably, rating scales with multiple levels can better evaluate the degree of success with which the test-taker has carried out the writing task (Weigle, 2002). Hence, more score points (or levels) for descriptors are recommended in designing rating scales (Bachman & Palmer, 1996). Simple yes/no judgments may rule out learners’ ability to get at least partial scores on descriptors, which might result in an overestimate or underestimate of their writing ability and even cause a loss of diagnostic information. Therefore, it is possible that rating scales with descriptors with multiple levels are more appropriate for assessing writing ability than rating checklists without multiple levels. Driven by the application of rating scales, there is great potential for using polytomous CDMs designed to estimate polytomous response data in cognitive diagnostic writing assessment. However, whether polytomous CDMs can be applied in CDA studies on writing and how they are used are key issues to be addressed.
Polytomous CDMs
CDMs are psychometric models developed primarily for assessing test-takers’ mastery and non-mastery of attributes (de la Torre, 2011). The CDMs, which analyze dichotomous response data (i.e., 0/1) and polytomous response data (i.e., 0/1/2 . . .), are called dichotomous CDMs and polytomous CDMs, respectively. Most CDMs developed to date are only suitable for analyzing dichotomous response data. However, there are limitations in applying dichotomous CDMs in writing assessment because of the constraints of rating checklists mentioned above. Polytomous CDMs are thus in great need. Some polytomous CDMs were developed based on deterministic-input, noisy-and-gate model (DINA) (Junker & Sijtsma, 2001) and deterministic-input, noisy-or-gate model (DINO) (Templin & Henson, 2006), such as partial credit DINA (de la Torre, 2010) and DINA model for graded data (Tu et al., 2018). However, DINA and DINO may not be appropriate for estimating response data from writing assessment because their condensation rules are too restrictive for language test (Li et al., 2016). DINA is a completely non-compensatory model, which assumes that a test-taker has to master all the attributes required by an item to answer the item correctly. Non-mastery of any or some of the required attributes leads to equal probability of correct response. DINO is a completely compensatory model, which suggests that mastery of one attribute can compensate for non-mastery of other attributes required to answer an item correctly. In DINO, the probability of answering an item correctly is equal regardless of one or all the required attributes of the item are mastered. It seems that the two models are probably too restrictive to reflect complicated relationships of writing attributes. Therefore, polytomous CDMs building on DINA and DINO are not suitable for this study. Using a different approach, W. Ma and de la Torre (2016) developed the sequential G-DINA model (sG-DINA) based on G-DINA (de la Torre, 2011). As a general model, G-DINA does not assume any prespecified relationships among attributes (de la Torre, 2011). It allows for both compensatory and non-compensatory relationships among attributes within the same test. It can be converted into several reduced models (e.g., DINO, DINA) by adjusting constraints in the parameterization. sG-DINA is also a general model. Reduced models, such as compensatory models (i.e., sequential DINO [sDINO], sequential ACDM [sACDM], sequential LLM [sLLM]) and non-compensatory models (i.e., sequential DINA [sDINA], sequential RRUM [sRRUM]), can be obtained in the same way as G-DINA.
sG-DINA can handle polytomous response data from items in math tests, in which sequential steps are required to solve the problem or, alternatively, items in Likert scales, which may evaluate degrees of accomplishment of certain skills are used. In the former case, each step may require different attributes. A restricted Q-matrix specifying the relationships between steps (or categories) and different attributes involved in each step thus needs to be employed. In the latter case, however, each category of the item may measure the same attributes or the attribute-category relationships may be unknown. An unrestricted Q-matrix assuming that the attributes required by one category are needed by other categories of the item can be employed in such situations (see W. Ma & de la Torre, 2016 for more details). For example, as shown in Table 1, D11 is assumed to measure A1 (content) and A3 (vocabulary). The attribute–descriptor relationship is specified as “10100” in item-level Q-matrix. However, supposing D11 is evaluated with 0/1/2, each score would represent a responding category, such as 0 for Category 0, 1 for Category 1, and 2 for Category 2. Since no attributes are supposed to be measured when the test-taker’s score is 0, the descriptor would have only two categories, Category 1 and Category 2. In this way, D11 includes two attribute–category relationships. One is Category 1 coded as “10100,” and the other is Category 2 coded as “10100.” sG-DINA classifies learners as masters or non-masters of attributes at each category and, thus, more diagnostic information can be provided for learners.
Category-level and item-level Q-matrix.
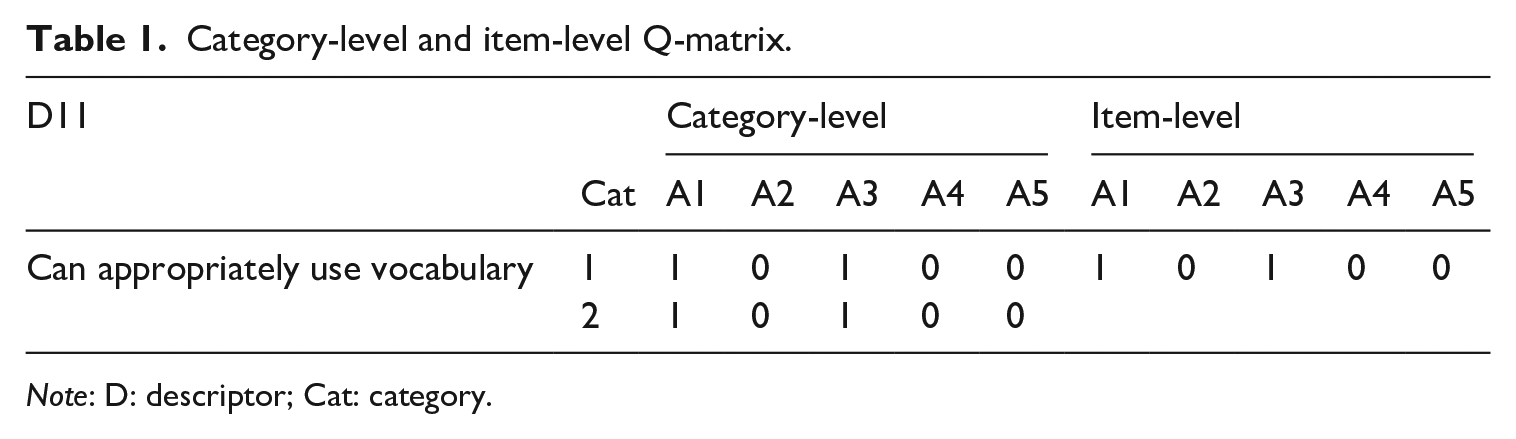
Note: D: descriptor; Cat: category.
An empirical study in the healthcare domain found that sG-DINA could handle polytomous response data from a Likert scale measuring individuals’ degree of depression, with fine-grained diagnostic information about degrees and symptoms of depression provided for patients (Zong, 2018). Taken together, sG-DINA is appropriate for estimating data from Likert scales and, thus, can be used in this study. Model-data fit statistics and Q-matrix validation methods particularly for sG-DINA have been proposed (Ma, 2020; W. Ma & de la Torre, 2020a), which provide guidance for applying the sG-DINA in real-world assessment settings. However, few studies have examined whether sG-DINA can be used or how it is employed in EFL writing assessment.
Given the above mentioned limitations, this study intends to employ a multi-level rating scale to evaluate learners’ writing performances and diagnose their writing strengths and weaknesses using polytomous CDMs.
Research question
The following two research questions guided the study:
To what extent can the polytomous CDM accurately diagnose Chinese EFL learners’ strengths and weaknesses of writing ability?
What are the strengths and weaknesses of Chinese EFL learners’ writing ability for the overall group and individual learners?
As far as we know, this study is the first example of applying polytomous CDMs in cognitive diagnostic language assessment, in which a multi-level rating scale was employed to assess learners’ writing performances instead of a rating checklist with binary judgment. Therefore, it is believed that this study’s results will not only contribute to the CDA application in writing assessment, but also extend insights to speaking assessment, where constructed responses are usually produced by test-takers.
Methods
Participants
A total of 1166 first-year college students (age range: 18–21 years; 569 male, 597 female) from three Chinese universities with different levels of prestige (287 studying at a national key university, 515 at an ordinary university, 364 at a non-governmental university) were recruited based on convenience sampling to write essays according to given prompts. The test-takers had an average of 10.45 years of English learning experience (range: 7-19 years). A wide range of undergraduate majors were represented in the recruited sample, ranging from arts and humanities to science and engineering.
Twelve college English language teachers (age range: 31–56 years; 4 male, 8 female) from four universities in China participated in a rating scale modifying procedure. They had an average of 15.58 years of EFL writing teaching experience (range: 5-30 years).
Seven domain experts (32–63 years; 2 male, 5 female), who had conducted research on writing assessment, instruction, and feedback, were invited to construct the Q-matrix.
Six raters (24–29 years; 2 male, 4 female) who were MA or PhD candidates majoring in applied linguistics, were recruited to assess essays. Two of them had been involved in rating writing for CET-4 or CET-6 three times, others had participated in such ratings at least once and had received rater training session before scoring CET-4 or CET-6 writing samples.
Instruments
Three writing prompts were extracted from a set of parallel CET-4 writing tests in 2014 (Xu, 2015). Test-takers were required to write an essay about (1) a classmate who has influenced them most (hereafter referred to as the person prompt), (2) a course that has impressed them most (hereafter referred to as the course prompt), (3) a campus activity that has benefited them most (hereafter referred to as the campus activity prompt) in college. Test-takers needed to state their reasons and wrote at least 120 words but no more than 180 words based on the directions of the writing task. Each test-taker completed only one of the three essay prompts. We obtained 415 completed essays for the first prompt, 372 essays for the second prompt, and 379 essays for the third prompt.
Procedures
Modification of a checklist into a rating scale
A rating scale was developed at this stage. First, X. Ma et al.’s (2022) checklist with 30 descriptors was modified into a rating scale because of its dichotomous constraints. In that study, the 30 descriptors had been extracted from think-aloud protocol data from 12 experienced EFL teachers rating essays on three prompts (the same as those in the current study) and validated using multi-faceted Rasch model (MFRM) analysis using FACETS 3.83.5 (Linacre, 2021) to confirm the checklist’s reliability and validity. Then, to make the descriptors align with the language proficiency scale in the currentis study, they were adapted according to CSE Levels 4 to 6 descriptors, which aligned with Chinese university students’ English language proficiency. The original 30 descriptors were supplemented by CSE descriptors and further integrated into 26 descriptors, which were refined by 12 college teachers through a questionnaire exploring whether the descriptors were (1) expressed clearly, (2) useful for assessing writing, (3) relevant to writing ability, (4) able to be polytomously scored (e.g., “0” for “not meeting the requirement:” “1” for “partially meeting the requirement;” “2” for “completely meeting the requirement”), (5) overlapping with each other, and (6) covering every aspect needed to assess writing. For the first four questions, teachers’ responded using a 4-point Likert scale ranging from 1 = strongly disagree to 4 = strongly agree. The latter two questions were open-ended questions eliciting problems and suggestions. The internal consistency reliability of the questionnaire was satisfactory (Cronbach’s alpha = .98). Based on the teachers’ suggestions, five descriptors were ultimately omitted because they were too difficult for learners. For example, the descriptor “Can use rhetorical devices effectively” was deleted, since few first-year university students employed rhetorical devices in writing. The difficulty indices for the five descriptors ranged from 1.06 logits to 2.77 logits, while the difficulty indices for the rest of the 21 descriptors was lower than 1.06 logits, except for D13 (1.91 logits), indicating their relative difficulty. D13 measures vocabulary complexity, which was closely related to students’ writing ability (Y. Kim, 2011) and, thus, was kept in the rating scale. Considering both qualitative and quantitative results, five descriptors were deleted. For the remaining 21 descriptors, the average scores were 3.64 (SD = 0.27), 3.82 (SD = 0.13), 3.83 (SD = 0.14), 3.49 (SD = 0.19) for the first four dimensions of the questionnaire, indicating that the descriptors were expressed clearly, useful in assessing writing in this context, relevant to the writing ability of the sample, and able to be polytomously scored. Hence, the rating scale containing 21 descriptors was preliminarily found to be useful to assess writing in the context of this study (see the full set of descriptors in Appendix 1).
Definition of attributes
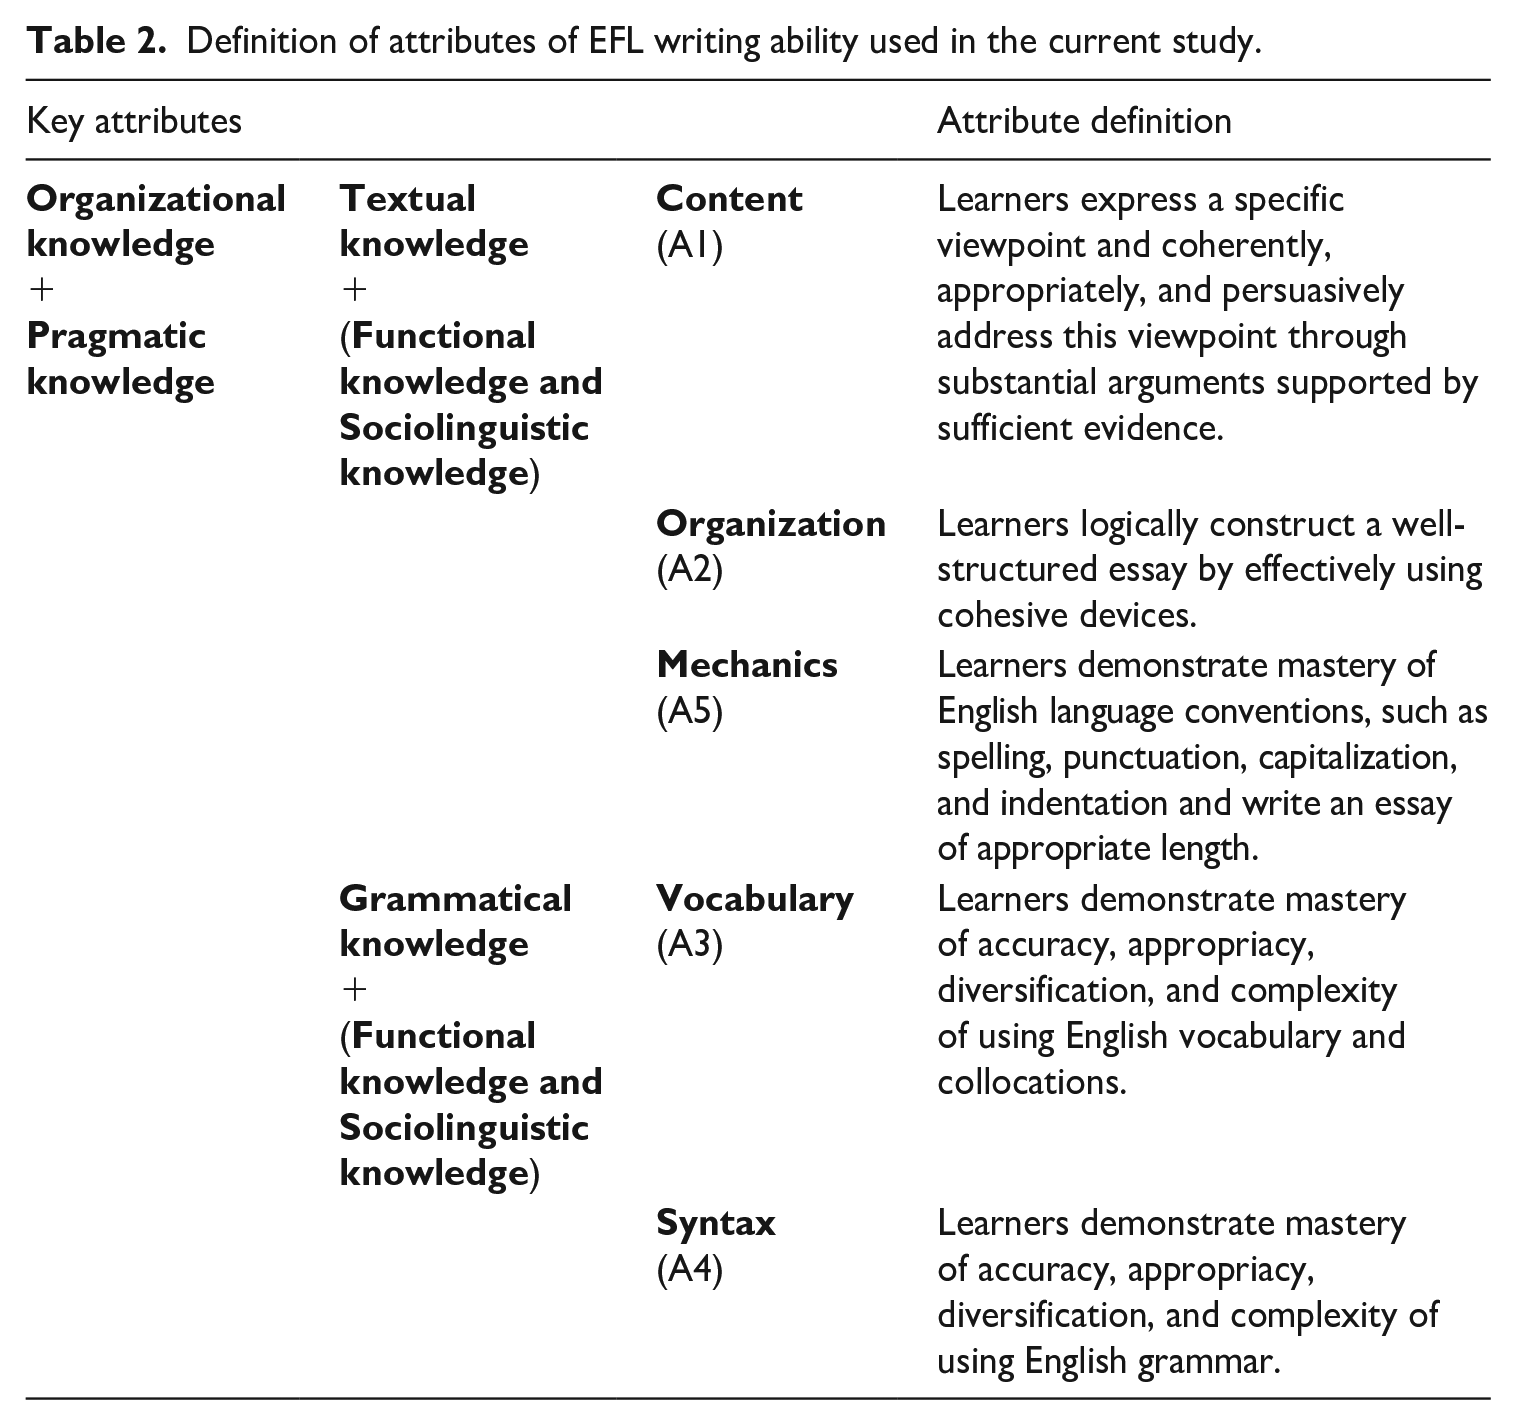
Based on EFL writing models (Grabe & Kaplan, 1996; Sasaki & Hirose, 1996), previous literature on assessing writing (Jacobs et al., 1981; Y. Kim, 2011), the CSE, and the college English curriculum requirement of writing in mainland China, five attributes concerning EFL writing ability were identified. These were content, organization, vocabulary, syntax, and mechanics (see Table 2).
Definition of attributes of EFL writing ability used in the current study.
Q-matrix construction
The construction of Q-matrix involved three steps (see Figure 1). In the first step, seven domain experts determined which descriptor was related to a certain attribute by coding 0 or 1 to construct an attribute–descriptor relationship as a Q-matrix. This resulted in the development of seven Q-matrices (QE1-QE7). Inter-rater agreement for each descriptor was calculated using Fleiss kappa.
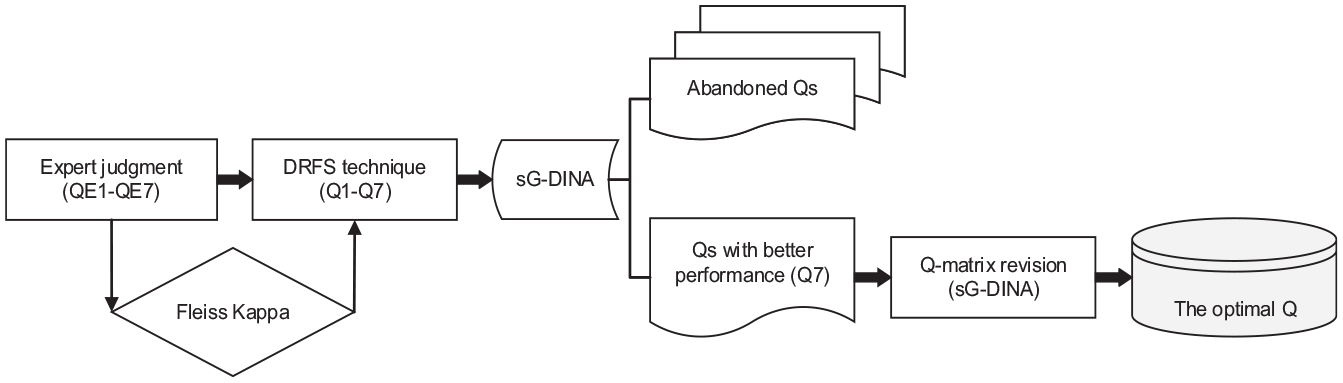
Q-matrix construction procedure.
Second, the disassemble-reconfigure-fit-screen (DRFS) technique (Dong et al., 2020) was used to choose the optimal Q-matrix. Specifically, each Q-matrix specified by experts was disassembled into two Q-matrices, one of which contained descriptors with higher Fleiss kappa (>0.41, indicating moderate agreement (Landis & Koch, 1977)), and the other included descriptors with lower Fleiss kappa (<0.41). For the descriptors with higher Fleiss kappa, the attribute–descriptor relationship was coded if most experts made the same decision, thus forming a common Q-matrix (Q-C). Then, the Q-C was matched with descriptors with lower Fleiss kappa from seven QEs. In this way, seven new Q-matrices (Q1–Q7) were reconfigured. These Q-matrices (Q1–Q7) were transformed into category-level Q-matrices and screened by model-data fit in sG-DINA in R-package’s G-DINA version 2.8.7 (W. Ma & de la Torre, 2020b). The absolute fit statistic, the root mean square error of approximation (RMSEA), relative fit statistics, −2 log-likelihood (−2LL), Akaike’s information criterion (AIC), and Bayesian information criterion (BIC) were used to examine the validity of the seven matrices (Q1–Q7) (Ma, 2020), among which Q7 showed best performance, but still did not reach the acceptable level of absolute fit. Thus, the model required further revision.
Third, the stepwise Q-matrix validation method (W. Ma & de la Torre, 2020a) provided revising suggestions for experts. For example, for D5, it was suggested that apart from A1, A2 needed to be added. After discussing with domain experts, it was agreed A2 was required by D5. For D6, it was suggested that A1, specified by experts as one of the requirements of the descriptor, be removed from the Q-matrix. The experts further inspected the content of D6 and agreed that A1 could be removed. Based on both CDM estimation and experts’ judgment, the suggestions to revise were adopted. After several rounds of revisions, the final Q-matrix (see Table 3) was generated, and its absolute fit statistic (i.e., RMSEA) reached the acceptable level.
Final Q-matrix.
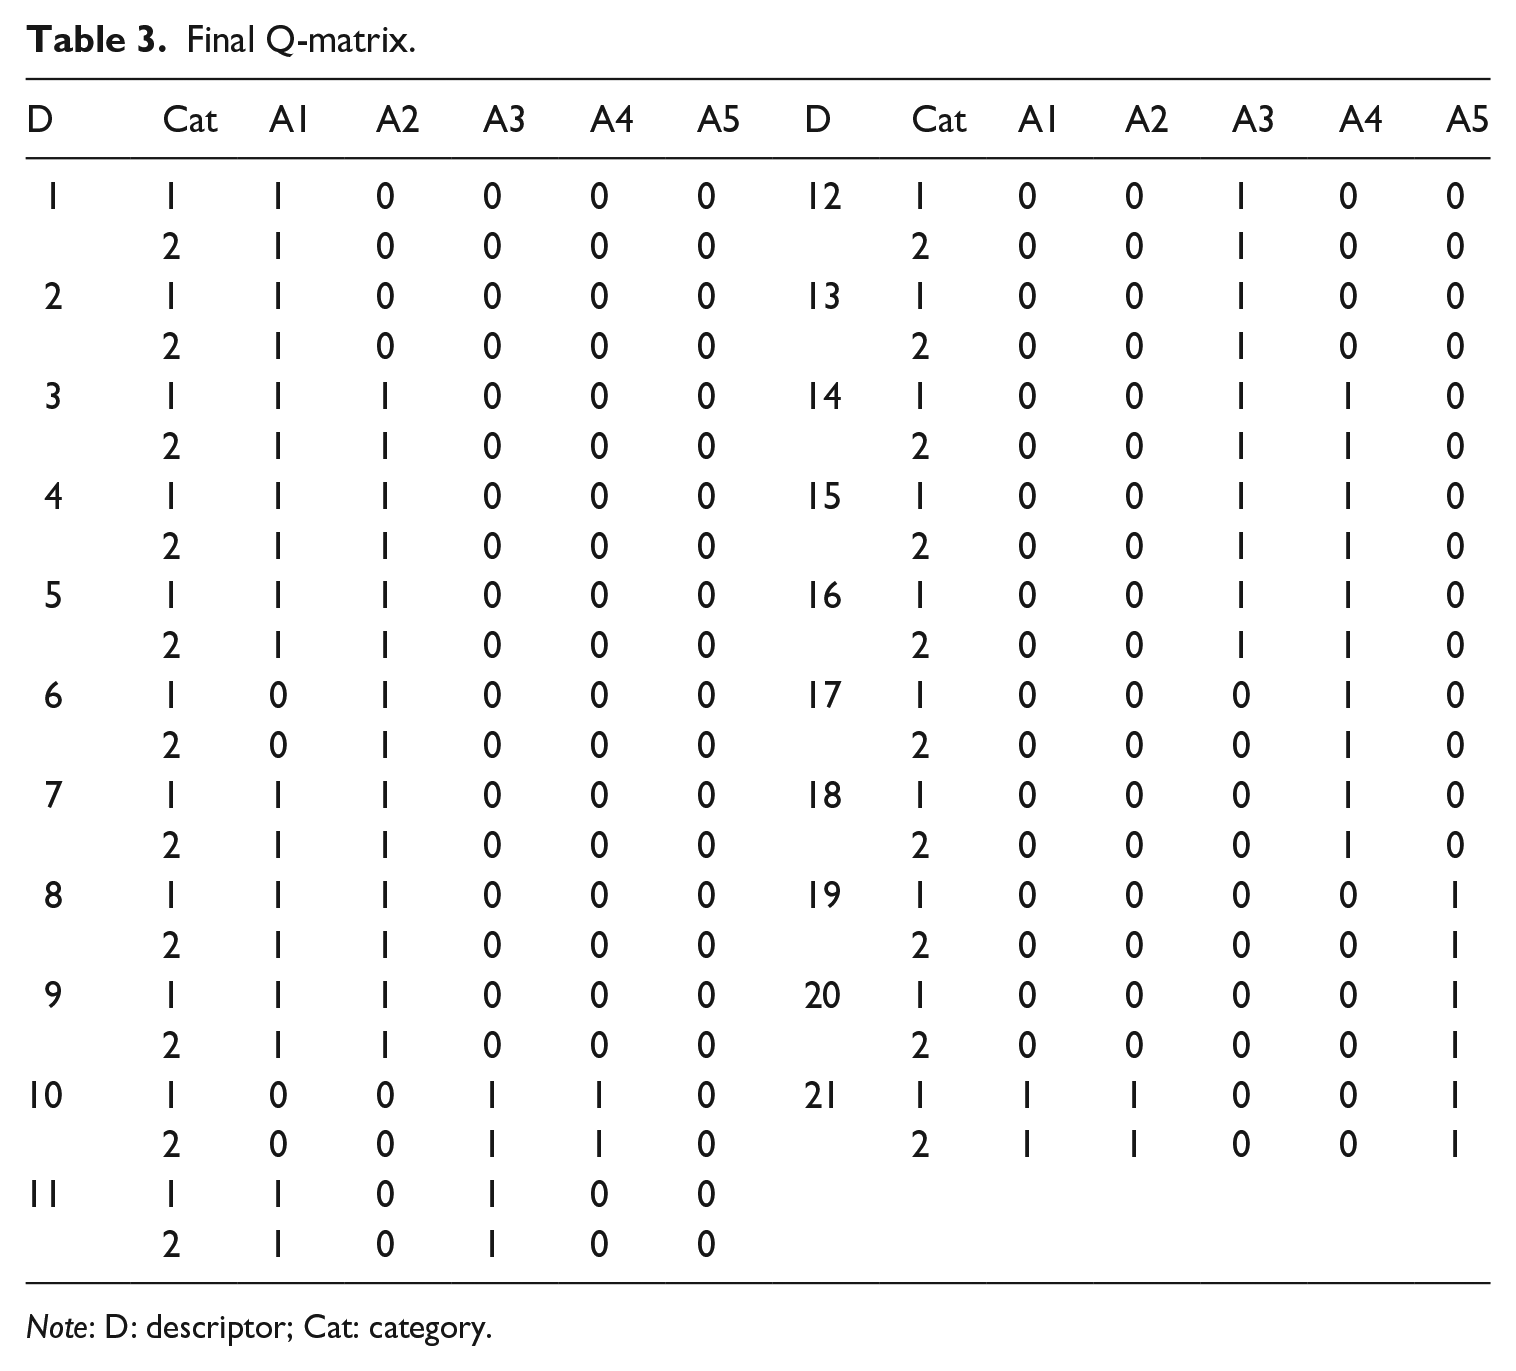
Note: D: descriptor; Cat: category.
Pilot and formal scoring
Pilot scoring included three steps. First, cutoff values were set up for 0/1/2 scoring. Three raters reviewed the contents of the rating scale and then scored 20 essays (six to seven essays each with different levels of writing proficiency for each prompt). Two rounds of MFRM analysis, with 10 essays for each round, showed that nine significantly biased cases (|Z|> 2) (1.4%) in the first round and two (0.3%) in the second round were observed among 630 measurable responses. Although the biased cases were rare, raters showed significant bias toward D1, D2, D4, D10, D11, D14, D15, D16, D17, most of which measured vocabulary and syntax. Average errors test-takers made on these descriptors, except for D1, D2, and D4, were calculated, and then cutoff values were established after a discussion with the raters. Take D10 “Can accurately use topic-related vocabulary and collocations” as an example. Its average errors were 1.15, and then learners obtained 0 (>4 errors), 1 (2–3 errors), or 2 (⩽1 error) points, respectively. For D1, D2, and D4, typical examples for 0/1/2 points were provided.
Second, a rater training session was conducted. The purpose of the current study was introduced to six raters, followed by detailed explanations of the rating scale and descriptors. In particular, examples and cutoff values for descriptors were provided in rating guidelines. Five selected sample essays were scored by all raters and discussions followed in the event of discrepancies to improve rating consistency.
Third, pilot scoring was conducted. Six raters each scored 30 essays (10 essays × 3 prompts). Nine essays (3 essays × 3 prompts) of Rater 1’s (pseudonamized as T1) were also scored by other five raters as common essays. The results were analyzed by MFRM to examine inter-rater and intra-rater consistency.
During MFRM analysis, a four-faceted model was established. Figure 2 shows the vertical ruler of all facets. The first column is Rasch logit scale and the second column shows test-taker ability measures, followed by the facets of raters, tasks, and descriptors. Rater severity measures were nearly between ±1 logits, revealing no large differences in rating severity. Although raters’ separation ratio (8.13), strata index (11.18), and rater separation reliability (.99) demonstrated that raters’ severity varied, the results concurred with the previous research (e.g., He et al., 2021; Xie, 2017) indicating that the findings were “not surprising” (Xie, 2017, p. 31), since raters did not “passively transform an observed performance into a score but actively construct(ed) an evaluation of the performance” (Eckes, 2019, p. 153). During this process, raters’ overall tendency to assign severe or lenient scores, their rating experience, and their understanding of the rating scale exerted some influence on ratings (Eckes). Infit mean square (MnSq) and outfit MnSq values ranging 0.81–1.15 and 0.82–1.23, respectively, fell in Linacre’s (2012) acceptable range of 0.5–1.5, suggesting that satisfactory intra-rater consistency was achieved in scoring essays using the descriptors. Regarding three tasks, their difficulty measures were between −0.4 logits and 0.3 logits with a 0.7-logit spread. With a spread of 7.41 logits (ranging from −2.63 logits to 4.78 logits), the range of the test-taker ability measures was 10.59 times as wide as the range of the task difficulty measures. Thus, the tasks differed relatively little in difficulty, and the impact of task difficulty on test-takers’ scores was minimal (Myford & Wolfe, 2000). After pilot scoring, six raters refamiliarized themselves with the rating guidelines and scored the remaining essays.
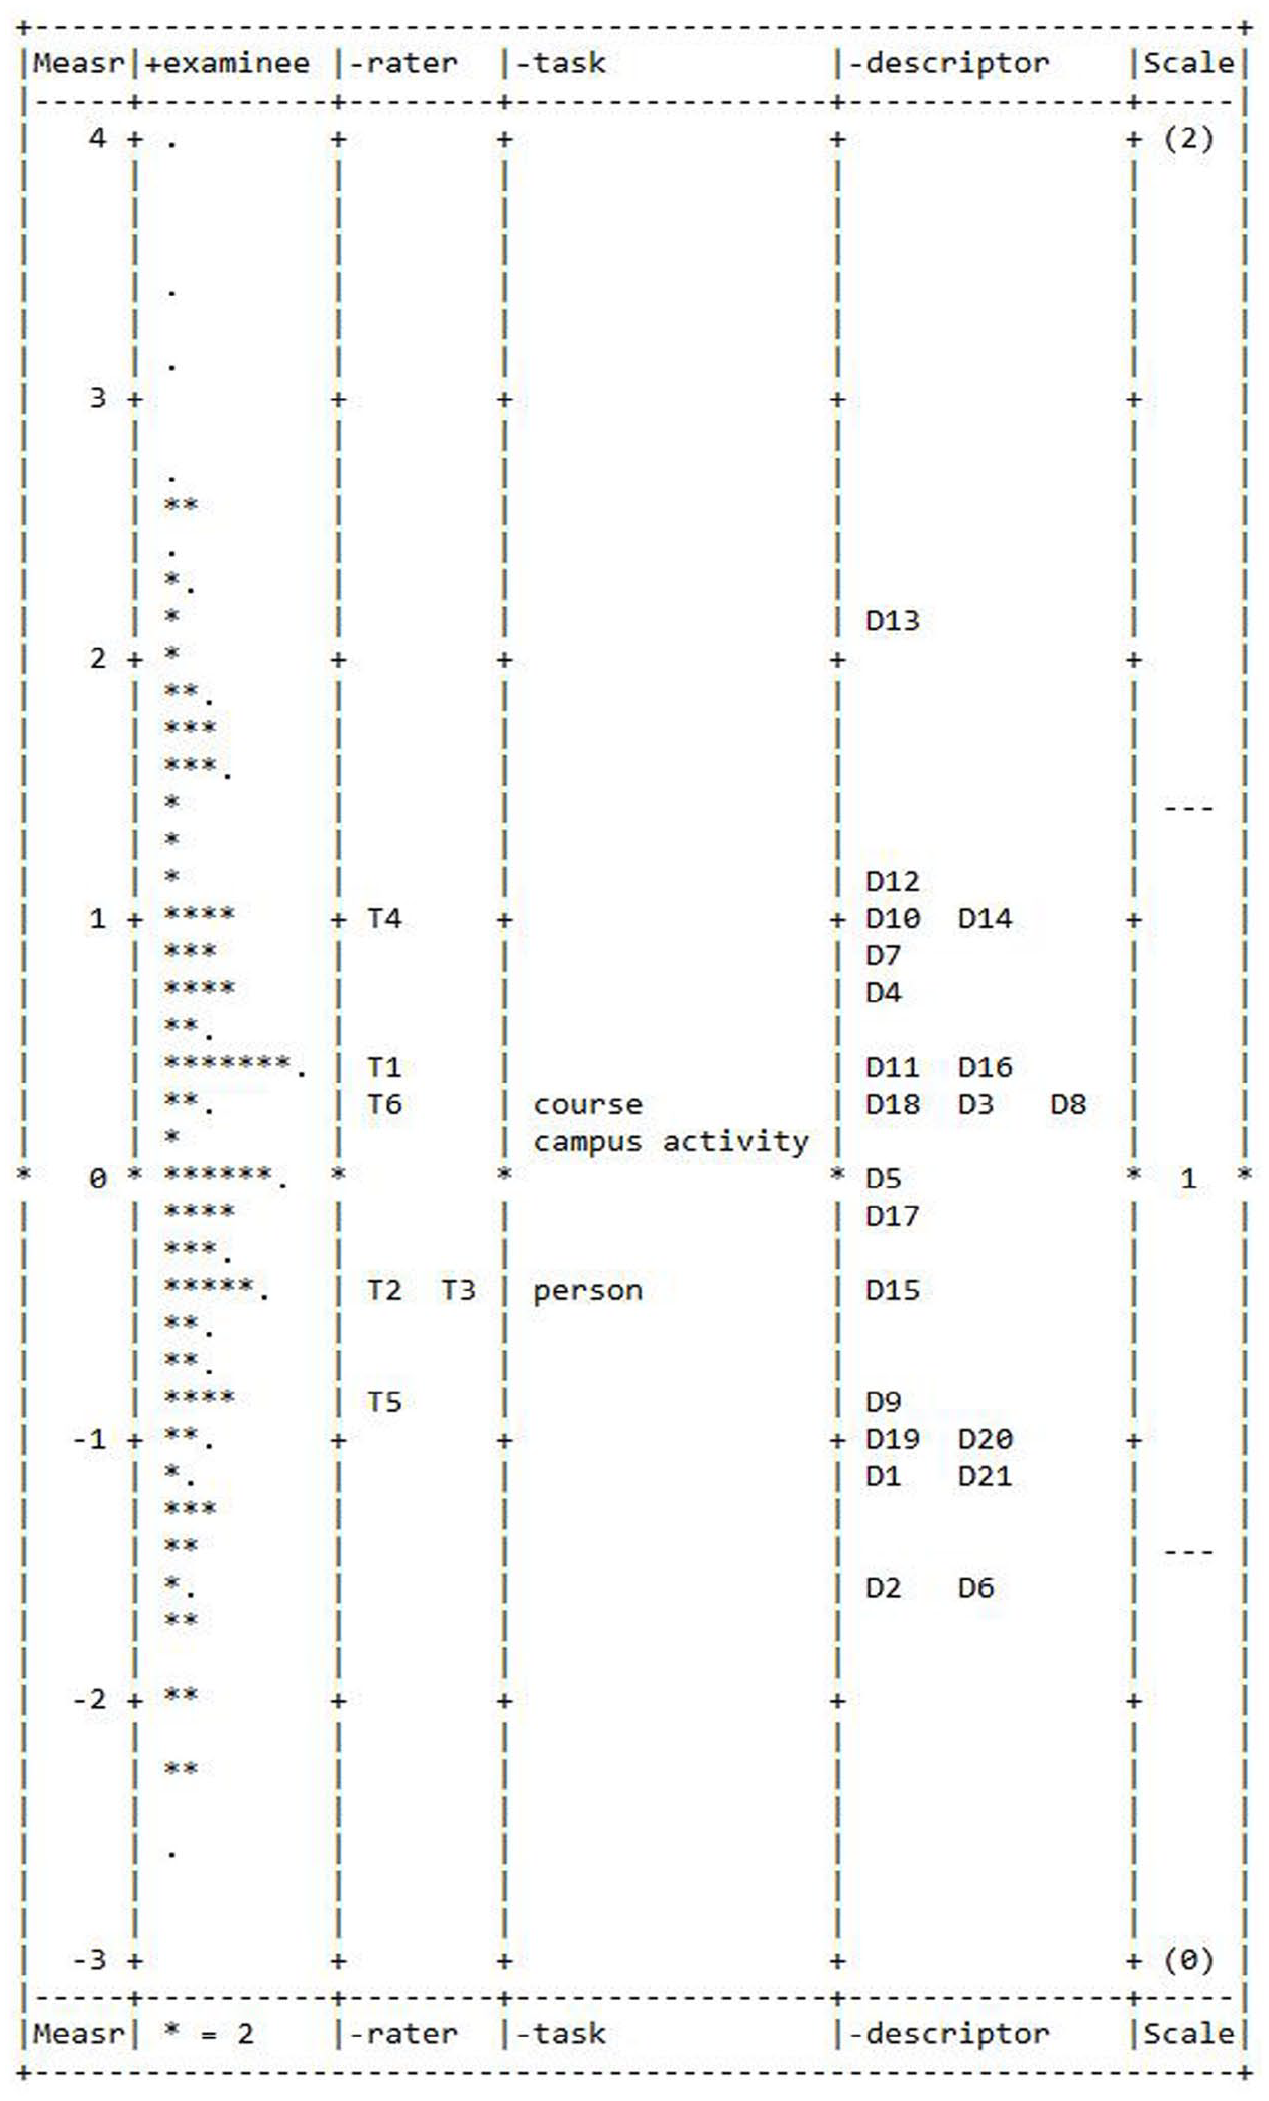
MFRM vertical ruler (facets test-taker ability, rater severity, task difficulty, and relative descriptor level).
Model selection
The appropriate CDM was selected based on theoretical evidence regarding the attribute relationship and model-data fit statistics. Previous studies employed both compensatory and non-compensatory models in diagnosing writing, demonstrating that the relationship among writing attributes could be either compensatory or non-compensatory. Therefore, the comparison of model-data fit statistics among a saturated model (sG-DINA), compensatory models (sDINO, sACDM, sLLM), and non-compensatory models (sDINA, sRRUM) provides empirical evidence for choosing the appropriate CDM.
Table 4 displays an absolute fit statistic (i.e., RMSEA) and relative fit statistics (i.e., −2LL, AIC, BIC) for six models. It was suggested that a model with RMSEA below 0.045 is a well-fitted model (Liu et al., 2016). Only sG-DINA achieved this level of acceptable fit. Relative fit statistics were then used to compare models, with smaller values denoting better fit. The results showed that sG-DINA had the smallest values of −2LL (38,329.52) and AIC (38,671.52). sLLM had the smallest BIC (39,411.19), which was slightly lower than sG-DINA (39,537.01). Considering both absolute and relative fit statistics, sG-DINA was used to generate diagnostic results.
Absolute and relative fit statistics for six models.
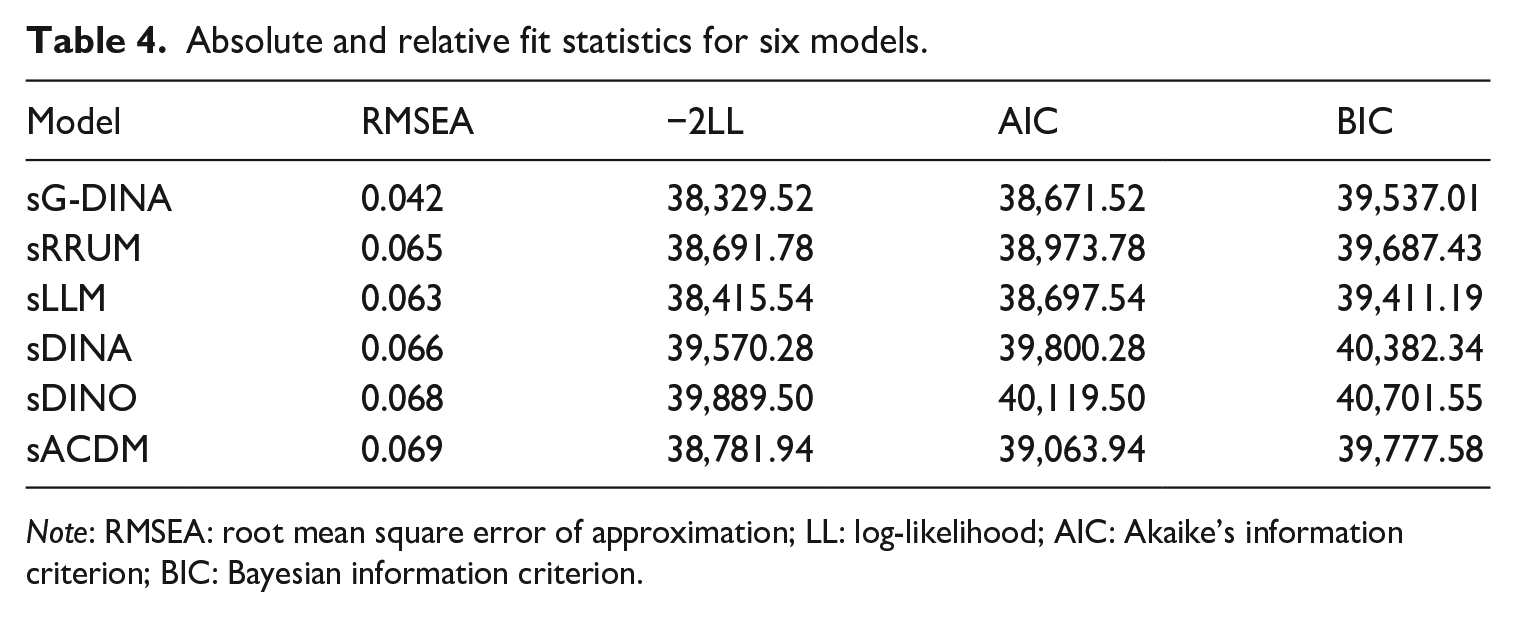
Note: RMSEA: root mean square error of approximation; LL: log-likelihood; AIC: Akaike’s information criterion; BIC: Bayesian information criterion.
Data analysis
The data analysis conducted with sG-DINA included two steps. In Step 1, the classification accuracy indices were applied to investigate whether test-takers’ attribute classification matched their true latent class (Ravand, 2016). With a range of 0–1, the value of 0.7 for test-level classification accuracy and the value of 0.8 for attribute-level classification accuracy were found to be acceptable (Johnson & Sinharay, 2018). Next, item discrimination indices intended to estimate the discriminating power of items were examined (He et al., 2021). In category-level Q-matrix, each category has its own discrimination index calculated as: pdiff = phat(m)-phat(nm). Phat(m) refers to the probability of correctly responding to an item given mastery of the attributes for that item and phat(nm) refers to the probability of correctly responding to an item given non-mastery of the attributes required for that item. It was assumed that items with pdiff above 0.4 could distinguish masters from non-masters (de la Torre et al., 2018). The value of pdiff ranging from 0.3 to 0.4 was also in the acceptable range (Ebel & Frisbie, 1991).
In Step 2, attribute prevalence and attribute mastery profiles were analyzed. Attribute prevalence indicates test-takers’ mastery probability of each attribute (Xie, 2017). The higher the value of an attribute prevalence is, the easier attributes are. Attribute mastery profiles represent different latent classes that test-takers are placed into. sG-DINA classifies test-takers into mastery or non-mastery categories along five attributes. Test-takers with attribute mastery probability greater than 0.5 are classified as masters of that attribute (denoted as 1); otherwise, they are considered as non-masters of the attribute (denoted as 0). On an individual level, with the same observed score, their mastery probability for five attributes were compared.
Results
To what extent can the polytomous CDM accurately diagnose Chinese EFL learners’ strengths and weaknesses in writing ability?
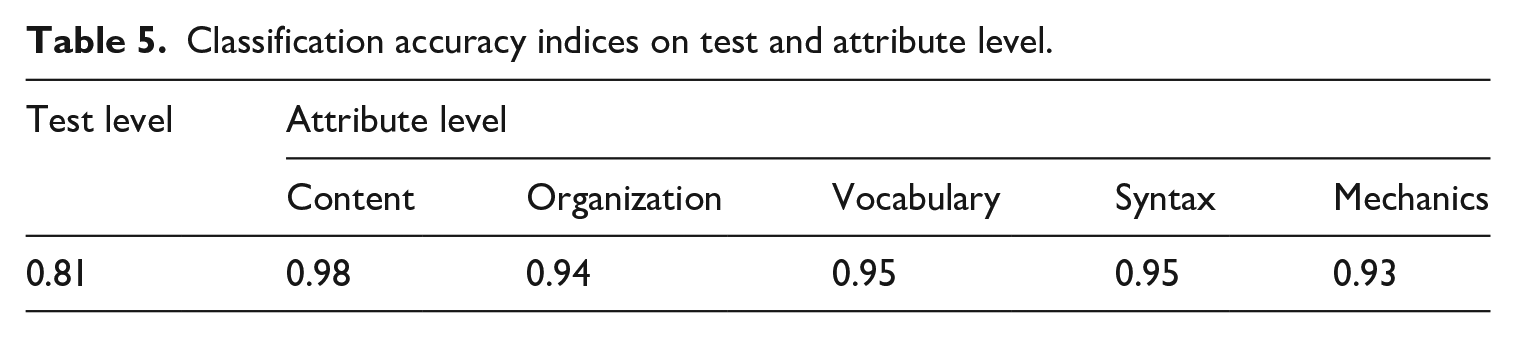
As shown in Table 5, the test-level classification accuracy index was 0.81, which exceeded the acceptable rate (i.e., 0.7). Attribute-level classification accuracy indices were all above 0.9, which were also satisfactory.
Classification accuracy indices on test and attribute level.
The results of item discrimination indices displayed in Table 6 showed that the average phat(m) across all descriptors was 0.8, indicating the average probability of getting scores on a descriptor by masters of the attributes was quite high at 80%. In contrast, the average phat(nm) across all descriptors was 0.28, suggesting the average probability of getting scores on a descriptor by non-masters of the attributes was much lower at 28%. The average pdiff across all descriptors was 0.52, which was much higher than the 0.3 threshold, suggesting that descriptors could distinguish masters from non-masters in that masters of attributes on a descriptor outperformed non-masters on average by 52%.
Item discrimination indices.
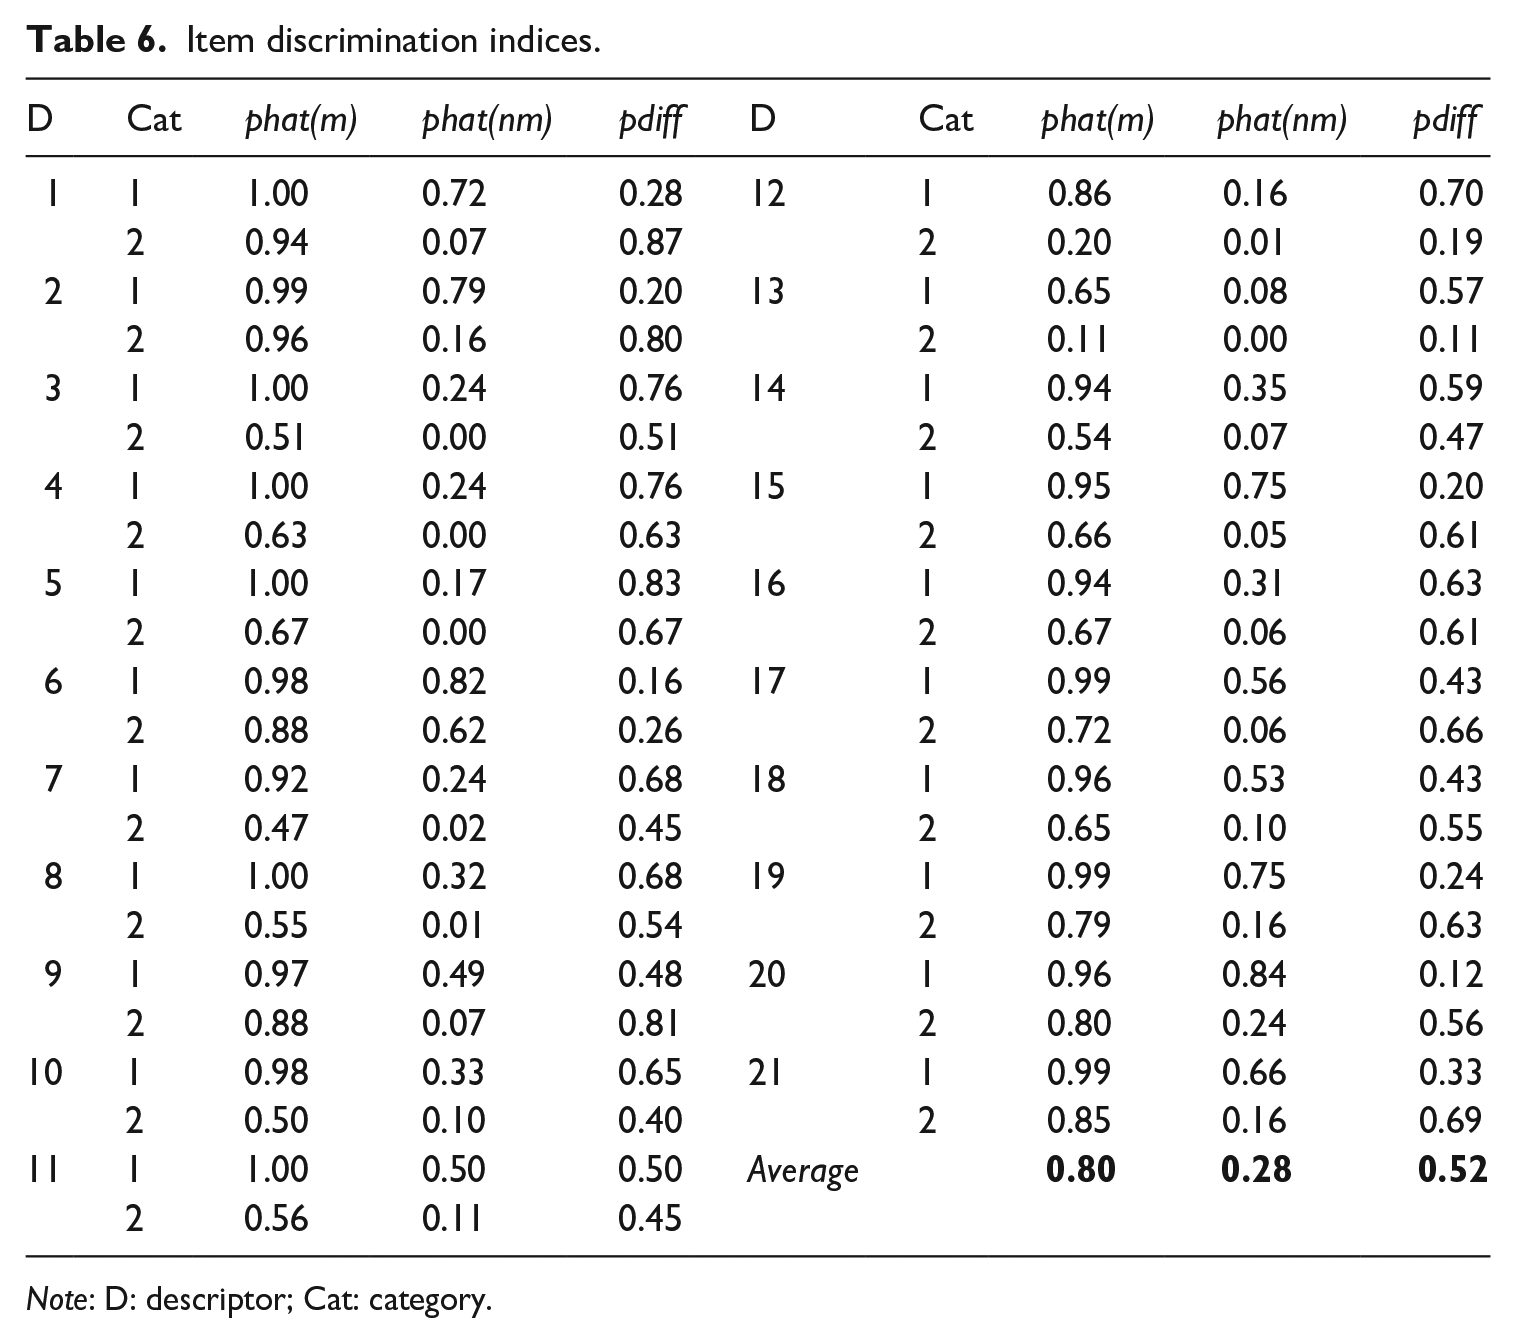
Note: D: descriptor; Cat: category.
In short, classification accuracy indices suggest that test-takers’ attribute classification to a large extent matched their true latent class. Acceptable discrimination indices indicated a good fit between the estimated model and the observed data, hence demonstrating the strong diagnostic power of the model. The results show that sG-DINA can accurately diagnose Chinese EFL learners’ strengths and weaknesses.
What are the strengths and weaknesses of Chinese EFL learners’ writing ability for the overall group and individual learners?
At group level, attribute prevalence showed that mechanics had the highest proportion of masters (71%), and vocabulary had the lowest (39%), indicating that mechanics is the easiest attribute and vocabulary is the most difficult one. Content was the second easiest attribute (62%), followed by syntax (61%) and organization (52%).
Test-takers’ attribute mastery profiles were extracted. With five EFL writing attributes, sG-DINA could generate 25 = 32 attribute mastery profiles theoretically. Figure 3 displays the top 10 attribute mastery profiles. The 1/0 numeric strings represented content, organization, vocabulary, syntax, and mechanics, respectively. To illustrate, “11111” was the most prevalent attribute mastery profile, with 23.27% test-takers classified in it, indicating that they have mastered all the attributes. In second place, 10011 showed that 15.98% test-takers have mastered content, syntax, and mechanics. The attribute mastery profile of “00000” had the third highest class probability, indicating that 14.79% test-takers have not mastered any attributes, whereas, “11011” in fourth place indicated that 8.2% test-takers have mastered content, organization, syntax, and mechanics. The mastery probability of the rest of the profiles in Figure 3 ranged from 4.38% to 2.92%.
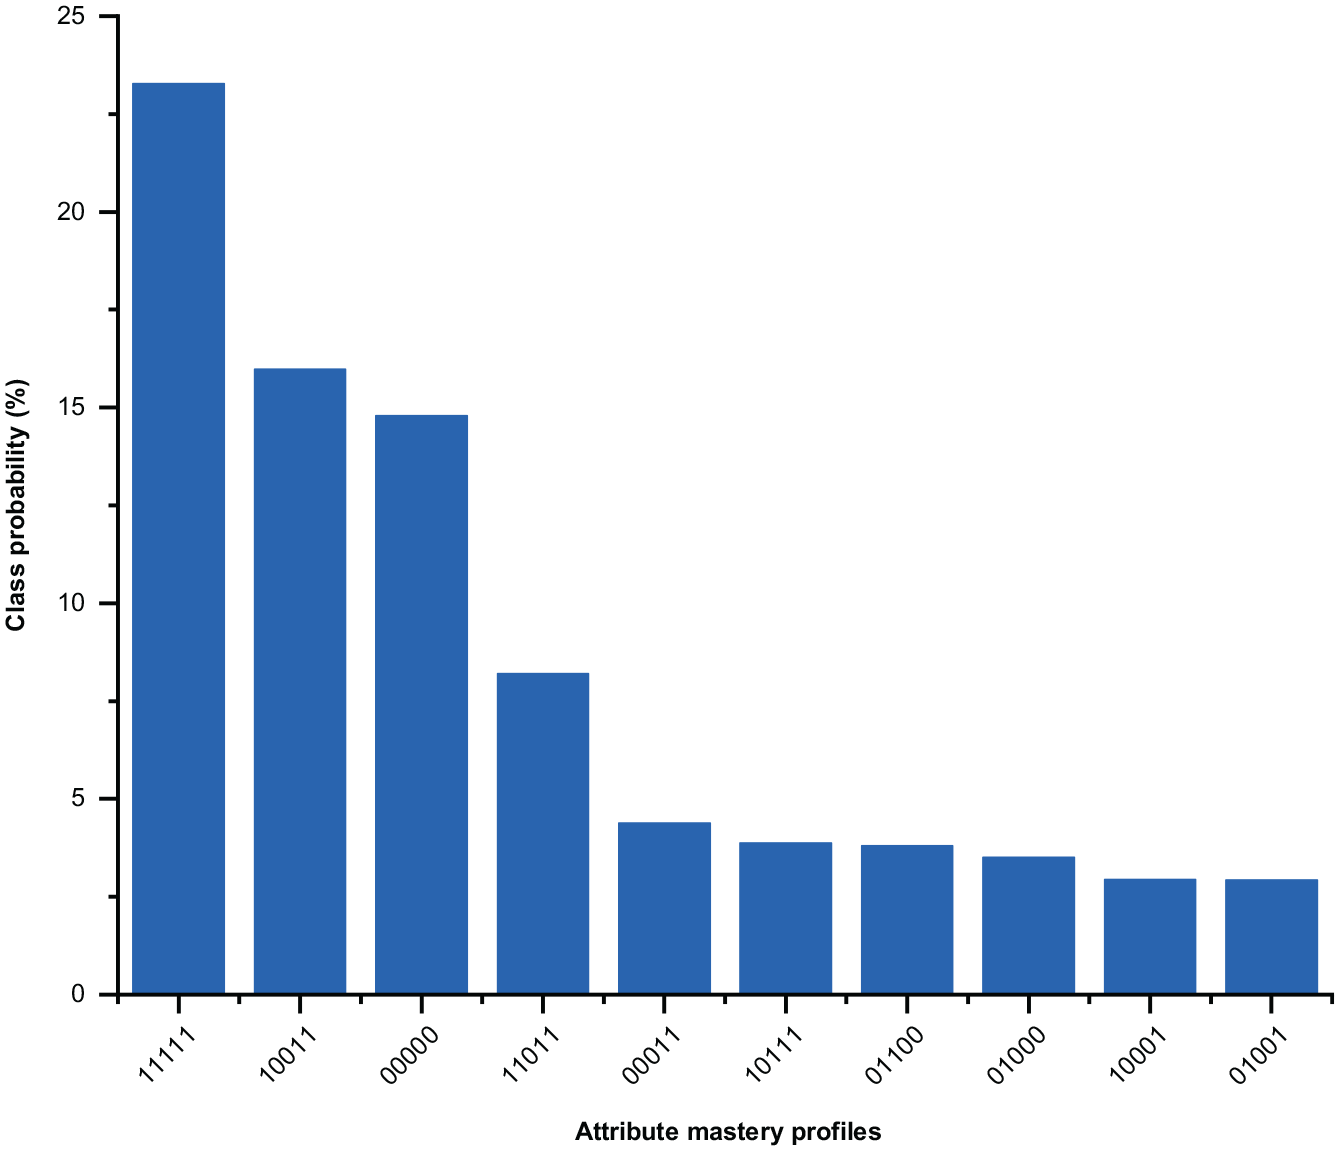
Top 10 attribute mastery profiles.
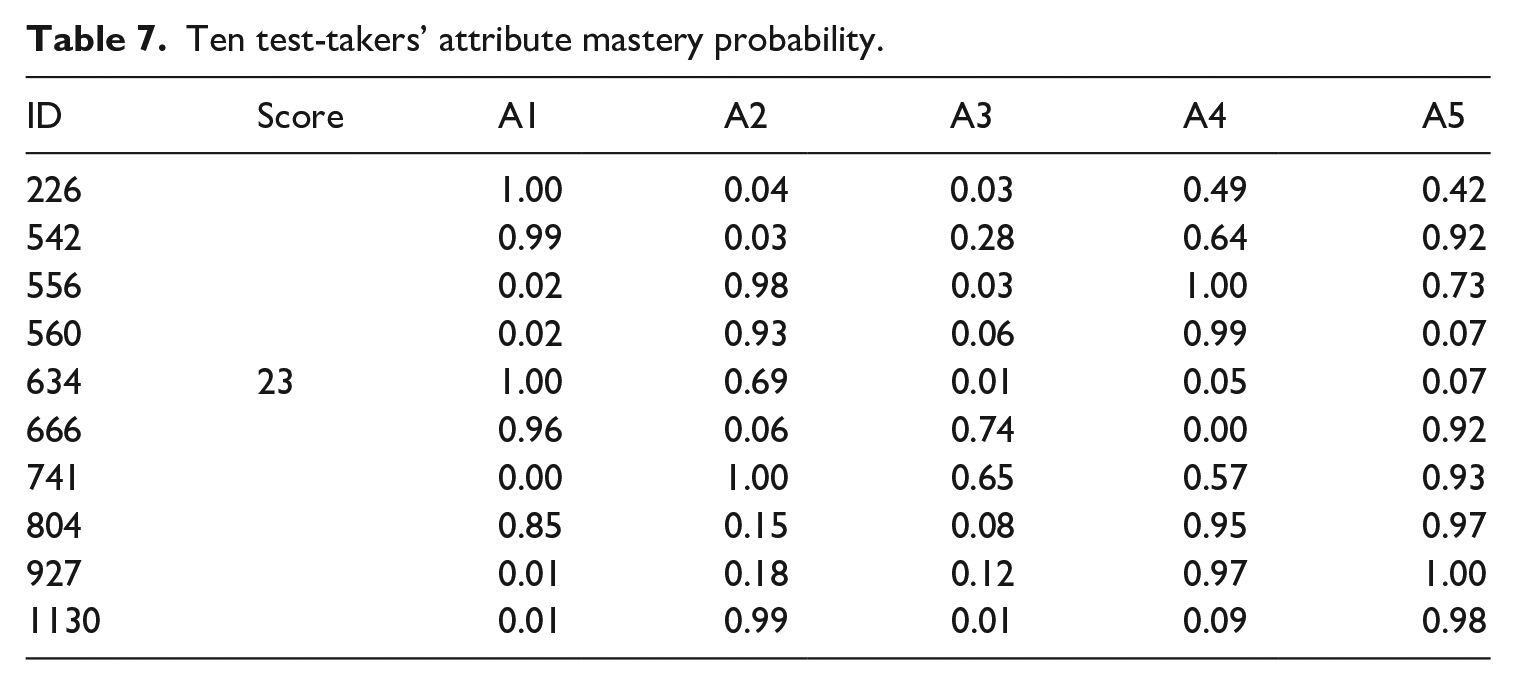
At an individual level, Table 7 presents 10 test-takers’ different attribute mastery probabilities with the same observed score (23). They represented medium level writing proficiency among participants (Mscore = 23.53; total score = 42). The data in Table 7 demonstrates that these test-takers showed different mastery probabilities for five attributes even if they shared the same observed score, indicating that test-takers manifested diverse strengths and weaknesses in writing performances. To address such differences and help individuals improve their weaknesses in writing, a personalized diagnostic report was developed. Except for diagnosing test-takers’ learning strengths and weaknesses, diagnostic feedback and remedial learning are another two core components in CDA (Y. Lee, 2015). Through diagnostic feedback, test-takers will be informed of their current “knowledge/skill states and performance” to remediate and direct future learning (Y. Lee, 2015, p. 307). An example of the diagnostic report is shown in Appendix 2. To help learners better understand scores assigned by raters, cutoff values and typical examples of descriptors for 0/1/2 scoring should be provided to learners along with the report.
Ten test-takers’ attribute mastery probability.
Discussion
This study investigated the applicability of polytomous CDMs to diagnose EFL learners’ writing ability. To this end, a descriptor-based rating scale measuring content, organization, vocabulary, syntax, and mechanics adapted from Jacobs et al. (1981) and described in Weigle (2002) was employed to mark essays. The Q-matrix was constructed and further validated by sG-DINA. By comparing several CDMs, sG-DINA showed the best model-data fit and was used to generate diagnostic information.
Regarding RQ1, the results of the model-data fit statistics, classification accuracy indices, and item discrimination indices demonstrated that sG-DINA could accurately diagnose Chinese college learners’ strengths and weaknesses of English writing ability. The classification accuracy indices were satisfactory, suggesting that test-takers were reliably classified into each latent class. Moreover, the average item discrimination indices (pdiff) across all descriptors was 0.52, which is higher than the 0.49 average item discrimination indices obtained in Y. Kim (2011). The results of the current study suggest that sG-DINA could distinguish masters from non-masters and has strong diagnostic power (A. Kim, 2015). However, it is worth noting that the pdiff of several descriptors was lower than 0.3. This is probably because descriptors were either too easy or too difficult (Toprak & Cakir, 2021) for this sample. The values of pdiff for Category 1 of D1, D2, D6, D15, D19, D20 and Category 2 of D6 were much lower because of their high values of phat(nm), which means that non-masters of attributes could easily get one or two scores on these descriptors. The six descriptors belong to proficiency levels that are lower than Level 4 in CSE, which would be expected to be relatively easy for participants in this study, since they are supposed to have English language proficiency at CSE Level 4 based on their amount of prior (pre-college) English learning. The values of pdiff for Category 2 of D12 and D13 were much lower due to their low values of phat(m), suggesting that masters of attributes hardly get two scores on these descriptors. D12 and D13 are related to vocabulary richness and complexity. The result is partially consistent with Xie’s (2017) research, in which she found that the descriptor relating to vocabulary richness showed poor discrimination because of its difficulty. D12 and D13 belong to CSE Levels 5 and 6, respectively, which are relatively difficult for the participants. Therefore, few participants could demonstrate vocabulary diversification and complexity in writing.
As for RQ2, strengths and weaknesses of writing ability for overall group and individuals were extracted. At a group level, the results of attribute prevalence showed that vocabulary was the most difficult attribute and mechanics the easiest, which concur with the results from Y. Kim (2011) and Xie (2017). The difficulty of vocabulary further shows that learners demonstrated less vocabulary diversification and complexity. Similarly, J. Lee (2020) found that South Korean EFL learners made the largest proportion of errors on vocabulary compared to morphology and mechanics errors when writing essays. Silva (1993) argued that EFL learners “exhibited less lexical control, variety and sophistication overall” (p. 668), since English writing required cognitively advanced skills to use words in an accurate, diverse, and sophisticated way (Y. Kim, 2011). In sum, EFL learners need to make great effort when learning English vocabulary. Thus, teachers should adjust their instructional plans to address learners’ weakness in vocabulary. Regarding attribute mastery profiles, “flat” patterns “11111” and “00000” were the first and the third most prevalent profiles. The high-class probability of “flat” patterns may be attributed to high correlations between attributes, which is often found in the domain of language assessment (e.g., Y. Lee & Sawaki, 2009; Toprak & Cakir, 2021). Results indicated that correlations between five attributes were relatively weak, ranging from 0.26 to 0.43, except for the groups of content-syntax (r =0.82), content-mechanics (r = 0.80), organization-vocabulary (r = 0.77), and syntax-mechanics (r = 0.94), which suggest that masters of one attribute are likely to be masters of the other. The number of attributes may also have influenced the distribution of learners. Only five attributes were identified, which makes it possible that many learners were distributed in the same attribute mastery profiles. Another possible explanation is that there are one or two descriptors with low discrimination indices (e.g., D1, D6, D12, D15, D19) relating to each attribute, which may influence the diagnostic power of CDA. On an individual level, learners with the same observed score showed different attribute mastery probabilities, which concurs with previous studies (Y. Kim, 2011; Xie, 2017). Based on fine-grained diagnostic information generated from sG-DINA, a diagnostic report was designed to further remediate the English language learners’ learning. Apart from the information of learners’ current attribute mastery status quo and personalized instructions for improving weaknesses generally covered in diagnostic reports of previous studies (e.g., Y. Kim, 2011), the inclusion of different degrees of writing performances in descriptors in the report should help learners know if their essays completely, partially, or do not completely meet the descriptor requirements for certain scores. This should help them realize which areas require more effort to improve, and which require less effort, thus helping them adjust their learning plans. The gradient diagnostic feedback involving different degrees of writing performance is more specific in the presentation of learners’ writing strengths and weaknesses than a traditional feedback modality, which in this context contains only binary information about whether writing performances meet the requirement of descriptors or not.
The results provide implications for CDA studies on writing. First, as a performance assessment, factors such as the rating scales used may contribute to writers’ scores (Weigle, 2002). Compared to rating checklists with binary judgments, rating scales with multiple levels of descriptors, indeed, are more appropriate to evaluate writing performances in this context and with this sample. The rating scales and polytomous CDMs employed in this study suggest the possibility of using rating scales when conducting CDA studies on performance assessment. Second, sG-DINA fit the data better compared to the uniquely compensatory and non-compensatory models. Writing is a complicated process of thinking, composing, and encoding language into text, which entails discourse interactions within a socio-cultural context (Cumming, 1998). During such a process, both compensatory and non-compensatory interactions of attributes appear to be involved, suggesting that writing attributes are neither solely compensatory nor non-compensatory, but involve a combination of both.
The findings also have practical implications. Most importantly, the study has provided a methodological demonstration of employing polytomous CDMs in performance assessment. Researchers in writing assessment could employ sG-DINA to diagnose learners’ writing ability through writing samples with different genres, such as exposition or narration. Similarly, sG-DINA may also be used by researchers in other performance assessments, such as speaking and translation diagnostic assessment. Moreover, the rating scale developed in this study could be adopted by EFL teachers to assess their students’ writing ability or used by EFL learners as part of self-assessment, thus helping them develop assessment literacy and improve agency and self-regulation. EFL teachers could also distribute the diagnostic report to students to provide remedial and directed instructions to further improve students’ writing ability.
Some limitations in this study cannot be ignored. First, for a three-level rating scale, raters may be likely to choose the score in the middle among 0, 1, and 2. Four-level (without a middle, non-committing choice option) or five-level rating scales (for even better discriminating power) are recommended in future studies. Furthermore, although it was not the main purpose of this study, the usefulness of diagnostic reporting is still under investigation and is underresearched in the context of assessing writing. Whether EFL learners’ writing ability can be improved and what learners’ perceptions of diagnostic reporting are important issues to be addressed. Future CDA studies should, therefore, examine such matters in dedicated investigations on the usefulness of diagnostic reporting.
Conclusion
This study applied polytomous CDMs to diagnose Chinese EFL learners’ strengths and weaknesses in writing ability. By model comparison, it was found that the sG-DINA fit the data best. sG-DINA could accurately diagnose learners’ strengths and weaknesses in EFL writing ability. Fine-grained information on both group and individual levels was generated and included in a diagnostic report. The results demonstrated the feasibility of applying polytomous CDMs to diagnose writing ability. The present study contributes to knowledge through providing empirical evidence to further verify the theories of polytomous CDMs in CDA and enriches existing research on CDA in writing assessment.
Footnotes
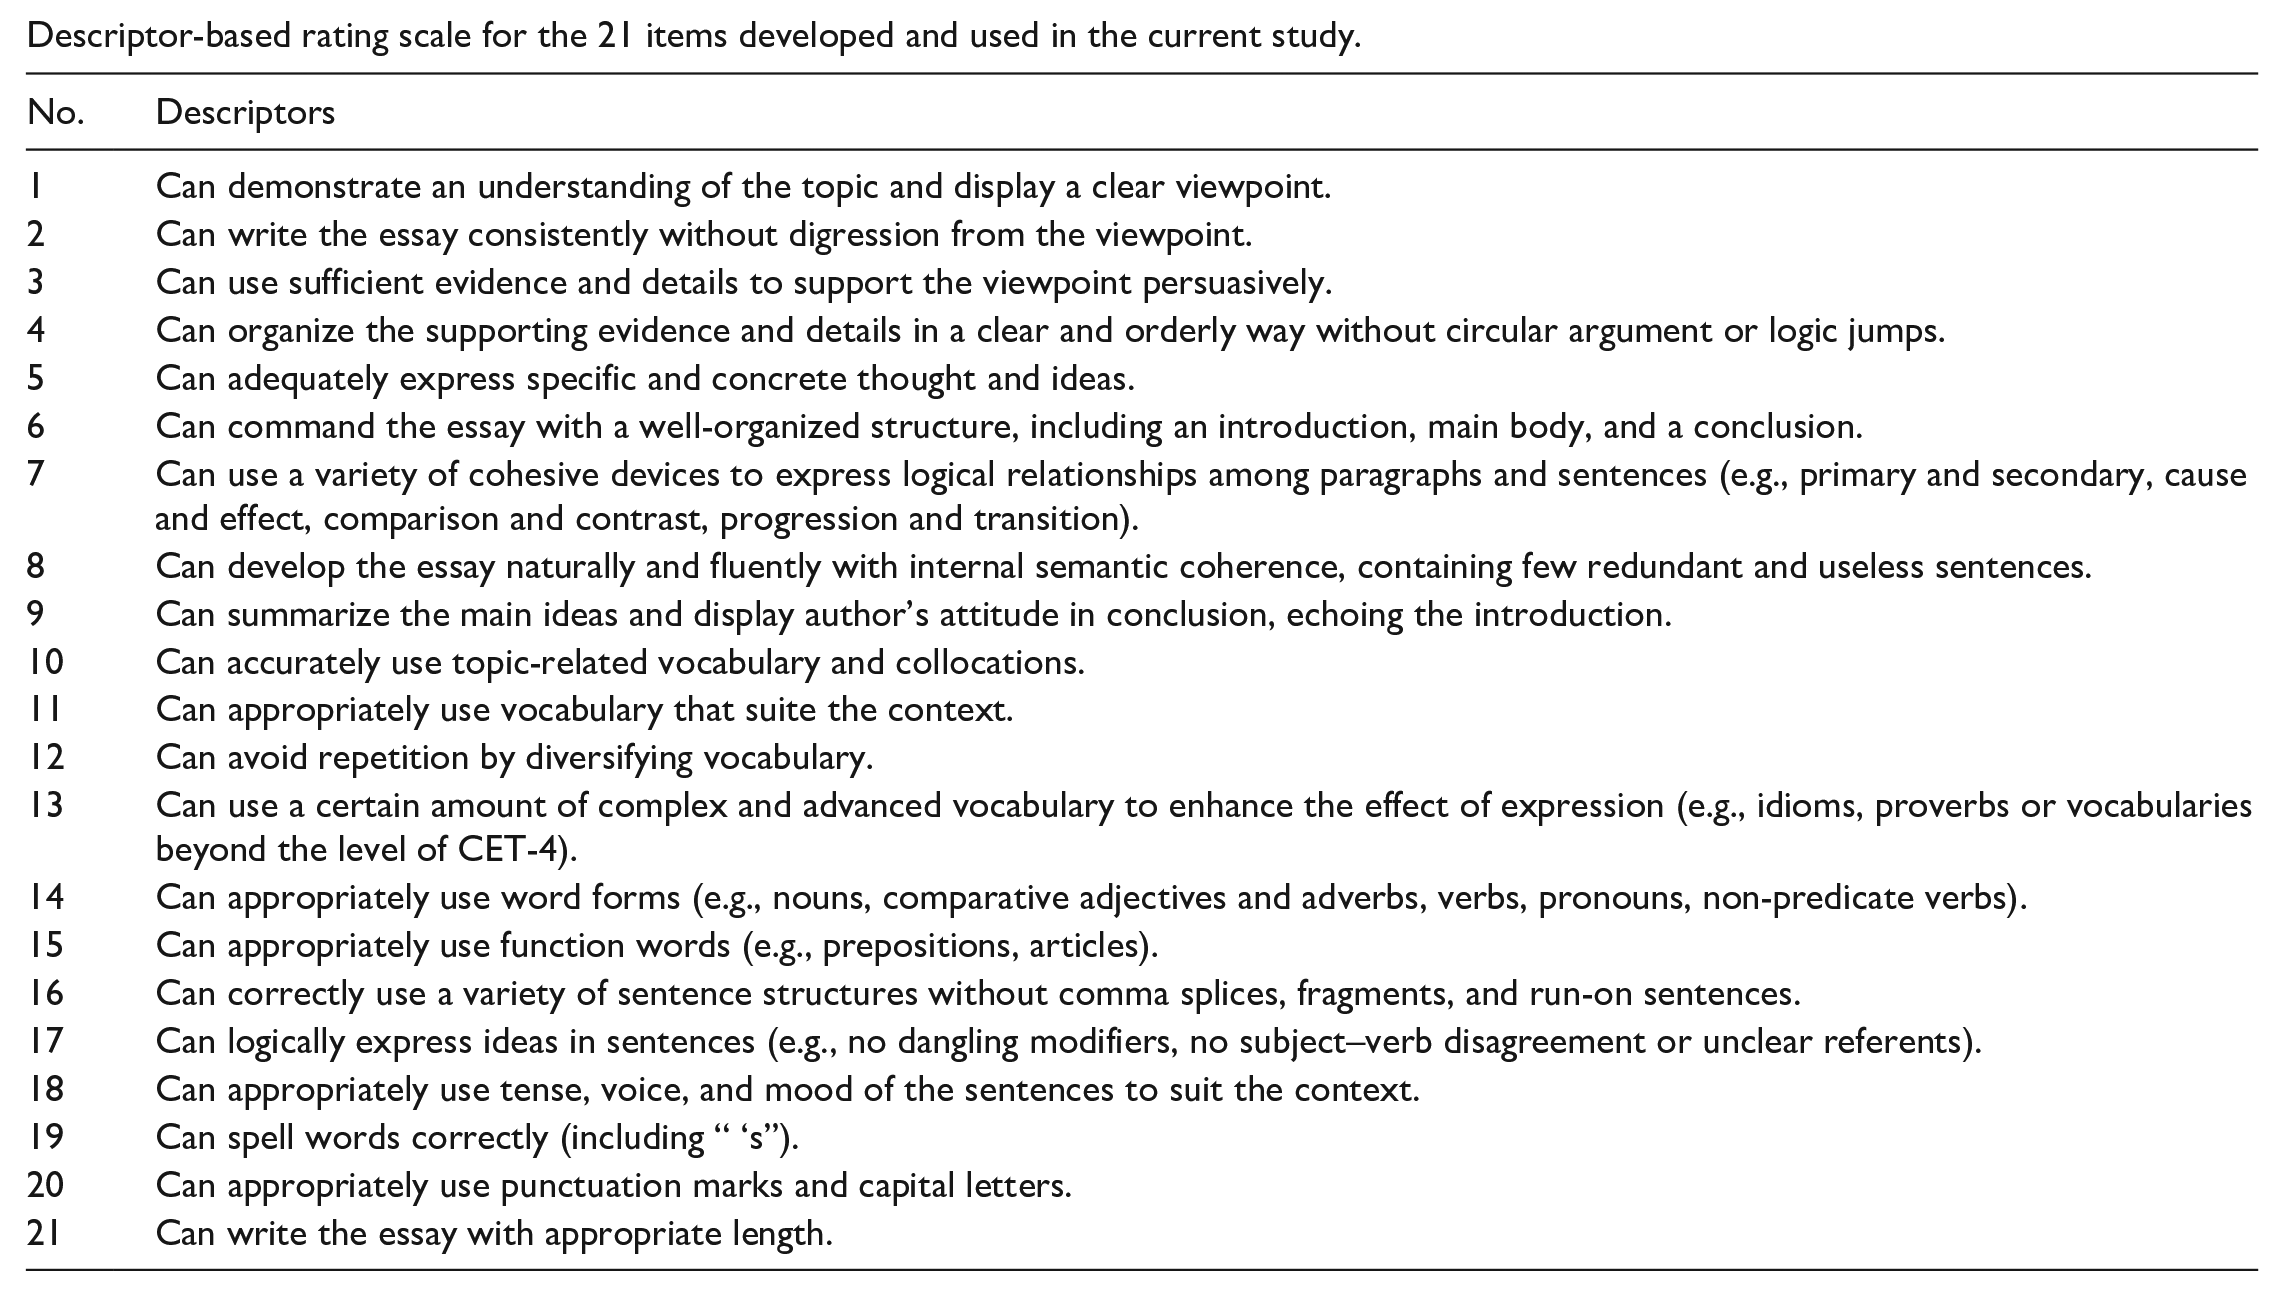
Appendix 1
Descriptor-based rating scale for the 21 items developed and used in the current study.
| No. | Descriptors |
|---|---|
| 1 | Can demonstrate an understanding of the topic and display a clear viewpoint. |
| 2 | Can write the essay consistently without digression from the viewpoint. |
| 3 | Can use sufficient evidence and details to support the viewpoint persuasively. |
| 4 | Can organize the supporting evidence and details in a clear and orderly way without circular argument or logic jumps. |
| 5 | Can adequately express specific and concrete thought and ideas. |
| 6 | Can command the essay with a well-organized structure, including an introduction, main body, and a conclusion. |
| 7 | Can use a variety of cohesive devices to express logical relationships among paragraphs and sentences (e.g., primary and secondary, cause and effect, comparison and contrast, progression and transition). |
| 8 | Can develop the essay naturally and fluently with internal semantic coherence, containing few redundant and useless sentences. |
| 9 | Can summarize the main ideas and display author’s attitude in conclusion, echoing the introduction. |
| 10 | Can accurately use topic-related vocabulary and collocations. |
| 11 | Can appropriately use vocabulary that suite the context. |
| 12 | Can avoid repetition by diversifying vocabulary. |
| 13 | Can use a certain amount of complex and advanced vocabulary to enhance the effect of expression (e.g., idioms, proverbs or vocabularies beyond the level of CET-4). |
| 14 | Can appropriately use word forms (e.g., nouns, comparative adjectives and adverbs, verbs, pronouns, non-predicate verbs). |
| 15 | Can appropriately use function words (e.g., prepositions, articles). |
| 16 | Can correctly use a variety of sentence structures without comma splices, fragments, and run-on sentences. |
| 17 | Can logically express ideas in sentences (e.g., no dangling modifiers, no subject–verb disagreement or unclear referents). |
| 18 | Can appropriately use tense, voice, and mood of the sentences to suit the context. |
| 19 | Can spell words correctly (including “ ‘s”). |
| 20 | Can appropriately use punctuation marks and capital letters. |
| 21 | Can write the essay with appropriate length. |
Appendix 2
Acknowledgements
We thank all the participants in this study for their time and effort. We are also grateful to the editor and anonymous reviewers for their constructive comments and suggestions on previous drafts of this article.
Declaration of conflicting interests
The authors declared no potential conflicts of interest with respect to the research, authorship, and/or publication of this article.
Funding
The authors disclosed receipt of the following financial support for the research, authorship, and/or publication of this article: This work was supported by the National Social Science Fund of China, Grant No. 17BYY015.