
Abstract
Assessing integrated reading-into-writing task performances is known to be challenging, and analytic rating scales have been found to better facilitate the scoring of these performances than other common types of rating scales. However, little is known about how specific operationalizations of the reading-into-writing construct in analytic rating scales may affect rating quality, and by extension score inferences and uses. Using two different analytic rating scales as proxies for two approaches to reading-into-writing construct operationalization, this study investigated the extent to which these approaches affect rating reliability and consistency. Twenty raters rated a set of reading-into-writing performances twice, each time using a different analytic rating scale, and completed post-rating questionnaires. The findings resulting from our convergent explanatory mixed-method research design show that both analytic rating scales functioned well, further supporting the use of analytic rating scales for scoring reading-into-writing. Raters reported that either type of analytic rating scale prompted them to attend to the reading-related aspects of reading-into-writing, although rating these aspects remained more challenging than judging writing-related aspects. The two scales differed, however, in the extent to which they led raters to uniform interpretations of performance difficulty levels. This study has implications for reading-into-writing scale design and rater training.
Introduction
Reading-into-writing tasks, a type of integrated task in which test-takers are presented with reading texts and required to integrate information from these texts into their writing, are increasingly adopted to either replace or supplement independent, writing-only tasks in second language assessments. Research has shown that reading-into-writing elicits, for example, composing processes similar to those employed when writing in academic contexts (Chan, 2013; Plakans, 2008, 2009) and written products which are more similar to disciplinary writing than elicited by writing-only tasks (Staples et al., 2018). Reading-into-writing tasks’ authenticity is largely due to the fact that, to succeed in these tasks, test-takers are required to demonstrate their understanding of source material and their ability to appropriately and effectively use this source material in their writing (Cumming, 2013; Ohta et al., 2018). The centrality of reading comprehension and source use in the successful completion of reading-into-writing tasks thus makes evaluation of these aspects in the scoring of performances imperative (Plakans & Gebril, 2015); otherwise, rating underrepresents the construct, hence potentially raising concerns over the validity of score interpretations and uses.
The scoring of reading-into-writing performances has received growing research attention (e.g., Gebril & Plakans, 2014; Ohta et al., 2018; Shin & Ewert, 2015; J. Wang et al., 2017), and it is well established that scoring reading-into-writing performances is highly complex, as raters have to attend to both test-takers’ own written production and their uses of the source material. To facilitate the rating of reading-into-writing performances in a reliable and valid manner, different reading-into-writing rating scales have been developed and researched. Analytic rating scales have been found to result in more reliable scores than holistic ones for rating reading-into-writing performances (Ohta et al., 2018), and to increase raters’ confidence in scoring such performances (Chan et al., 2015). One possible reason is that analytic rating scales for integrated testing often contain one or more distinct criteria that guide raters to make more consistent judgements on source use–related aspects specifically. However, existing analytic rating scales for reading-into-writing are not uniform in how they operationalize the construct. Some scales assign one or more specific, separate criteria to represent the reading and source use aspects exclusively. Other scales interweave the reading and source use aspects into criteria also capturing writing and language aspects; thus, the reading and source use aspects are spread across several, multifaceted rating criteria in those scales. Little is known regarding the impact on raters’ rating of these different approaches to construct operationalization, which in turn may affect the validity of reading-into-writing score inferences and uses. This paper reports on a study investigating two different approaches to reading-into-writing construct operationalization in analytic rating scales and the two approaches’ potential impact on rating reliability and consistency.
Literature review
The reading-into-writing construct and implications for rating
Previous research investigating the construct of reading-into-writing found that the presence of and requirement to integrate source texts in reading-into-writing tasks elicit cognitive processes and writing performance distinct from those elicited by independent writing-only tasks. In terms of cognitive processes, reading-into-writing tasks are known to uniquely elicit discourse synthesis processes (Spivey, 1997), which comprise, organizing ideas both while reading the source texts and composing the written response, selecting relevant ideas from the source texts, and connecting ideas across the source texts and with their own ideas (Chan, 2018; Plakans, 2008, 2009; P. Wang, 2018). Given these unique cognitive processes, reading-into-writing scores typically correlate only weakly with reading comprehension scores and independent writing scores (Delaney, 2008). Studies comparing the discourse features of reading-into-writing versus writing-only performances generally found that the former are more lexically sophisticated (Cumming et al., 2005; Gebril & Plakans, 2016) and syntactically complex (Cumming et al., 2005). However, especially regarding lexical sophistication, this might partly result from the integration of source information (Gebril & Plakans, 2016; Yu, 2013). Plakans and Gebril (2012), for example, observed that source texts assisted test-takers in idea generation as well as with language support, providing them with vocabulary, spelling, and organization models.
The need for test-takers to comprehend information from source texts and later integrate the information into their writing has been lauded as contributing to the authenticity of the reading-into-writing task type (Cumming, 2013) and, therefore, must be included in the rating scales to ensure scoring validity and valid interpretation of scores. However, this very feature of integration poses challenges in the scoring of reading-into-writing performances (Chan et al., 2015; Cumming, 2013). First, the measurement of writing ability is confounded with that of reading ability, leading to what is often termed task dependency (Cumming, 2014): difficulty in source text comprehension likely impedes successful reading-into-writing task completion. It is consequently often argued that integrated tasks require certain thresholds of proficiency to allow meaningful performance (Cumming, 2014), raising questions about the usefulness of such tasks for lower proficiency levels. Second, raters, especially human raters, are required not only to attend to the language produced by test-takers (as when scoring writing-only performances) but also to distinguish text derived from the source texts from test-takers’ own text and then to evaluate whether the textual borrowing practices are appropriate and effective for the task requirements (Cumming, 2014). Research investigating the scoring processes of reading-into-writing performances has collectively shown the complexity of these processes. For example, raters in Cumming et al.’s (2002) study reported evaluating test-takers’ understanding of the source texts and the appropriateness and effectiveness of source use in relation to the task, but at the same time, they also admitted requiring more guidance on how to do so. Likewise, raters in Gebril and Plakans’ (2014) study reported evaluating various aspects of source use (e.g., accuracy, relevance, adequacy, effectiveness, and appropriacy) and facing difficulties distinguishing between text borrowed from the source texts and test-takers’ own language production. Furthermore, J. Wang et al. (2017) found that textual borrowing was a source of rating inaccuracy, defined as the difference between scores awarded by professional raters and so-called criterion scores from expert raters.
Previous studies on reading-into-writing rating scales
Several studies have reported on the development and use of rating scales for assessing reading-into-writing that specifically include reading-related aspects. For example, Chan et al. (2015) reported on the development and validation of analytic reading-into-writing rating scales for a suite of reading-into-writing tasks at four Common European Framework of Reference for Languages (CEFR) levels. The resulting rating scales had four rating criteria, one of which, Reading for Writing, was specifically designed to operationalize the reading and source use aspects of the reading-into-writing construct, while the remaining three criteria focused more on writing and language aspects. In the initial round of piloting, raters reported difficulties using the new criterion, Reading for Writing. Nonetheless, the analytic rating scales were well received by the raters and were considered to provide more explicit guidance for rating compared to the holistic rating scales they had previously used; therefore, the analytic scales increased the raters’ confidence in their marking. Quantitative analysis of the scores awarded by the raters also suggested that the analytic rating scales facilitated consistent and reliable marking, including for the Reading for Writing criterion.
Shin and Ewert (2015), in an investigation of what contributes to reading-into-writing performance, developed an analytic rating scale comprising five criteria with two of these specifically representing reading and source use aspects, respectively, named Viewpoint Recognition and Text Engagement. In Shin and Ewert’s study, the raters were found to use the rating scale fairly consistently across the rating criteria. However, rater reliability on the reading and source use–related criteria was lower than that on the other criteria. As Shin and Ewert did not collect qualitative data on the raters’ perceptions of the scale, no explanation was offered to elucidate this quantitative finding. Nonetheless, evidence from this study further indicates the complex nature of scoring reading-into-writing, particularly with regard to the reading and source use aspects.
Holistic rating scales have also been used for scoring integrated writing. A well-known example, which has been used in a number of empirical studies, is the Test of English as a Foreign Language (TOEFL) iBT holistic rating scale for the test’s reading-listening-writing task (see https://www.ets.org/content/dam/ets-org/pdfs/toefl/toefl-ibt-writing-rubrics.pdf). Ohta et al. (2018), for example, compared an adapted version of this holistic scale with an analytic one comprising five rating criteria (Source Use, Organization, Development of Ideas, Language Use, and Authorial Voice). The findings suggested that scores resulting from using the analytic rating scale were more reliable than those from the adapted TOEFL iBT holistic rating scale. Notably, the Source Use criterion was found to be the most reliable and consistently used criterion of the rating scale. This contradicts other similar studies which found that source use caused significant variability among raters (Gebril & Plakans, 2014), that textual borrowing was one source of rating inaccuracy (J. Wang et al., 2017), and that rater reliability in source use–related criteria was lower than that in writing and language-related criteria (Shin & Ewert, 2015). As Ohta et al.’s (2018) study was purely quantitative, it did not explore further how the analytic rating scale used in the study was able to facilitate raters to reliably score the reading and source use aspects.
Usability and variability of analytic rating scales for reading-into-writing tasks
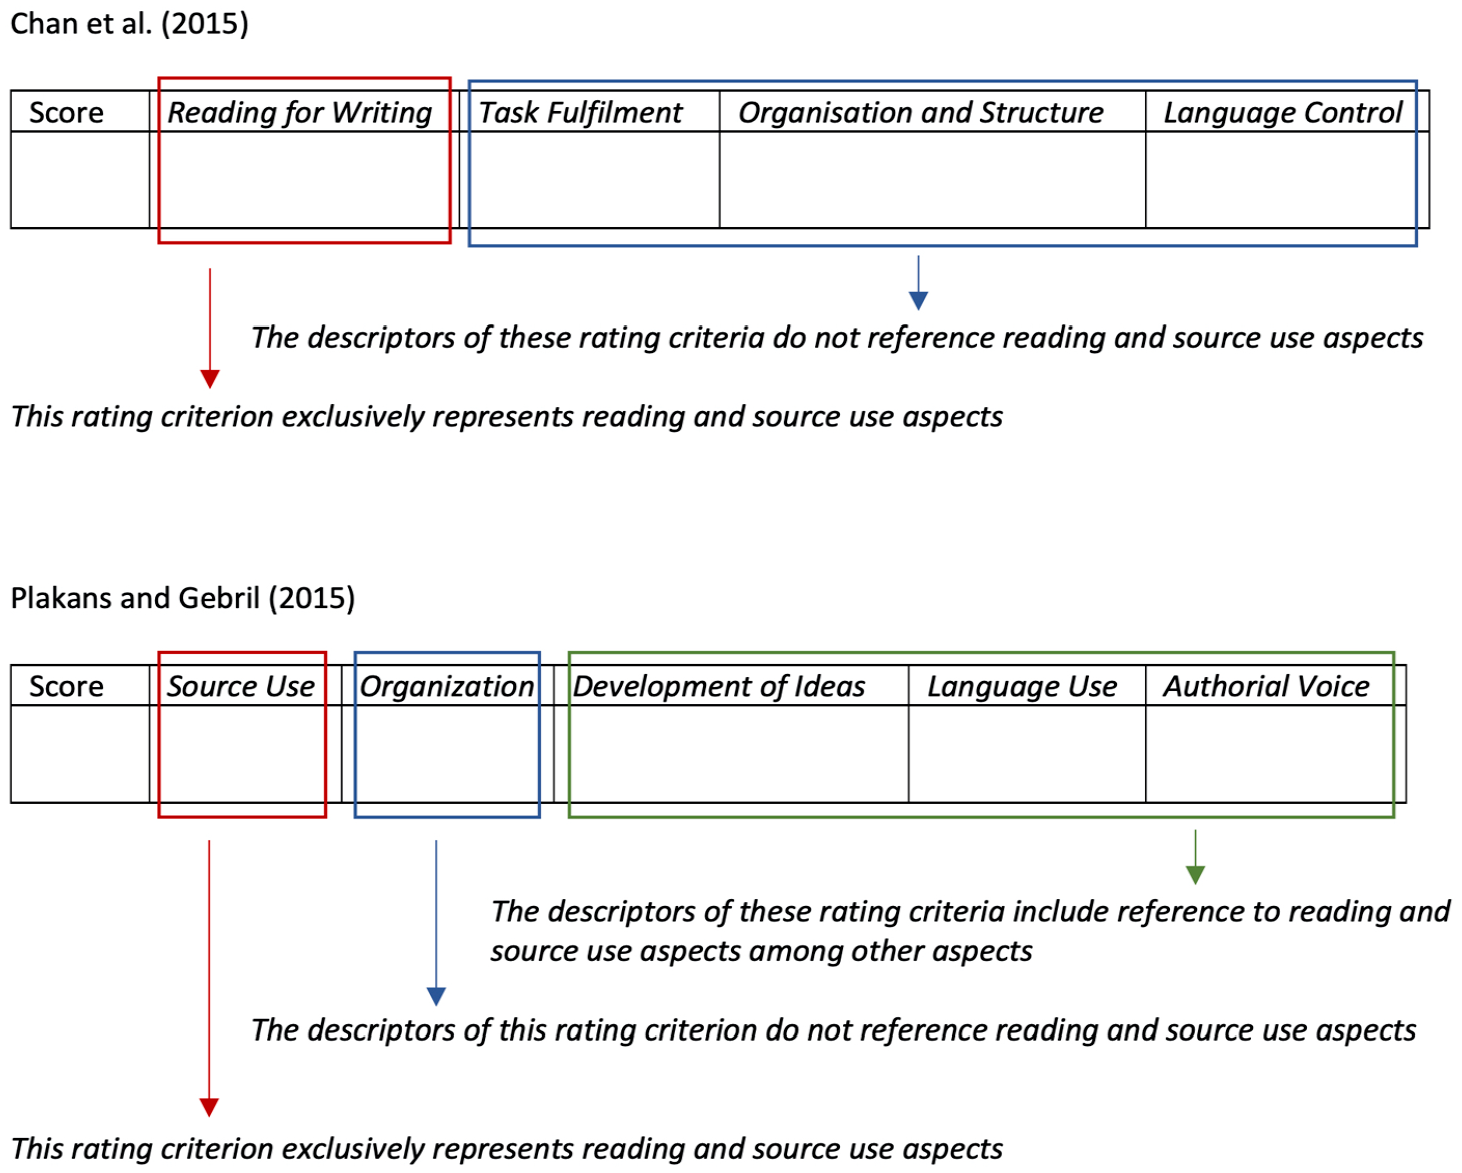
Analytic rating scales appear to be more commonly used than other types of rating scales for reading-into-writing tasks. Findings from some of the studies reviewed above (Chan et al., 2015; Ohta et al., 2018; Shin & Ewert, 2015) have further shown the usability of analytic rating scales for guiding raters to mark reading-into-writing performances more reliably and consistently, particularly on the reading and source use aspects. However, it is also apparent that analytic rating scales for reading-into-writing tasks vary in how they operationalize the reading and source use construct in the scales. This is partly because identifying and evaluating the role of reading-related aspects of the reading-into-writing construct is rather complicated (Chan et al., 2015). Reading-related aspects can be operationalized in one or more specific rating criteria exclusively focusing on reading-related aspects, for example, a Reading for Writing criterion, while other criteria in the rating scale are free from any mention related to reading. An example of this can be found in the analytic rating scale developed by Chan et al. (2015; see Figure 1). Alternatively, reading-related aspects can be operationalized in multiple criteria, with some of these aspects also interwoven into criteria related to writing and linguistic resources, to account for the influence of source texts on various aspects of writing performances as identified in the literature. Such an example is the analytic rating scale developed by Plakans and Gebril (2015; see Figure 1), also used in Ohta et al. (2018).
Reading-into-writing operationalization in analytic rating scales.
While both types of analytic rating scales were found to function favourably with reading-into-writing tasks in these studies, questions emerged as to the extent to which these different ways of operationalization affect raters’ rating. In addition, as with other analytic rating scales, it is important to investigate the extent to which the criteria within an analytic rating scale are distinguishable while still converging, to warrant their usefulness. Analytic rating scales are known to have issues with fuzziness, that is, lacking distinction across rating criteria (Knoch et al., 2021); therefore, studies examining the usability of analytic rating scales also investigated the distinguishability of criteria (e.g., Brown, 2006; Xi & Mollaun, 2006). At the same time, the different criteria within an analytic rating scale also need to converge (Knoch et al., 2020), especially when only the overall or composite score is reported, as is often the case.
Research questions
The utility of analytic rating scales for reading-into-writing assessment requires further investigation, especially given the fact that they often differ in the way they operationalize the reading-into-writing construct. Using two different analytic rating scales as proxies for two approaches to reading-into-writing construct operationalization, this study investigates the extent to which these different approaches potentially affect raters’ rating reliability and consistency. More specifically, the study seeks to do so (1) quantitatively by collecting evidence of rating reliability and consistency at the level of each rating scale as a whole and at the level of each individual rating criterion within each scale, as well as (2) qualitatively by gathering raters’ perceptions of each rating scale. Therefore, four research questions were posed:
RQ1. To what extent do individual raters vary in applying two different analytic rating scales for assessing reading-into-writing?
RQ2. How do raters apply the two analytic rating scales across individual rating criteria?
RQ3. To what extent do each analytic scale’s ratings provide unique but complementary information?
RQ4. What are raters’ perceptions of the two analytic rating scales?
While we appreciate that rating reliability and consistency have a direct impact on the evaluation of test-takers’ performance, in this paper, we focus on the raters’ use of the rating scales rather than on scoring consequences.
Methods
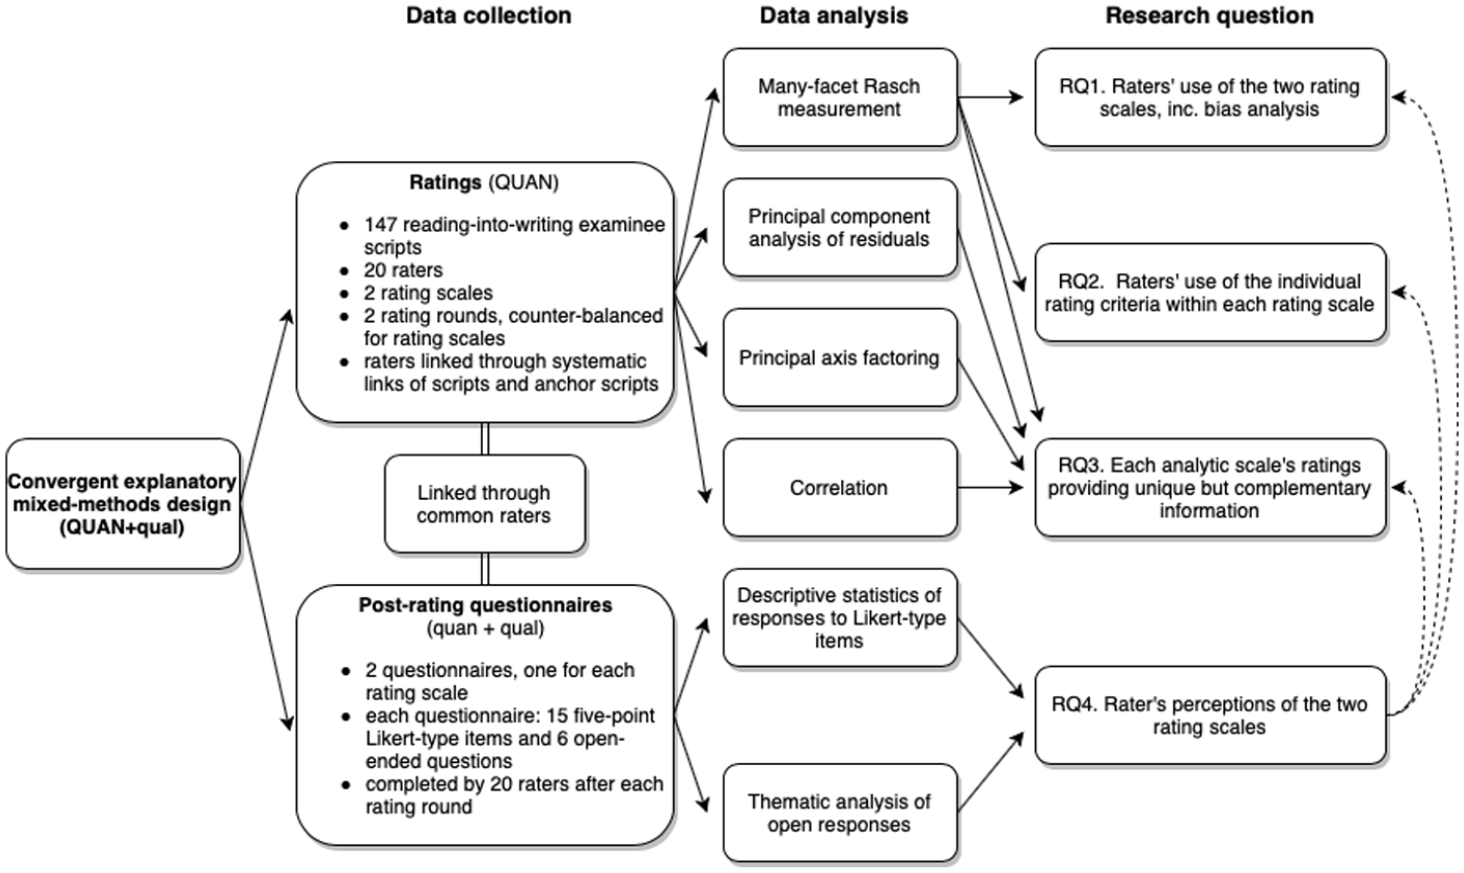
To address the research questions, a convergent explanatory mixed-method research design was implemented, taking advantage of both quantitative and qualitative methods to arrive at a more complete understanding of the issue under investigation (Creswell & Plano Clark, 2018). The overall research design is presented in Figure 2. The study comprised mainly a quantitative method involving multiple statistical analyses of rating data to address RQ1 to RQ3, and a combination of quantitative and qualitative analyses of post-rating questionnaire responses to address RQ4 and elucidate the results of RQ1 to RQ3.
Research design.
Raters
Twenty raters (24–71 years old; M = 38) participated in this study. Thirty percent were males, 70% were females. The majority were English first language (L1) speakers (65%), while 35% were L1 speakers of Finnish, Greek, Italian, Spanish, or Turkish. Eighty-five percent held a master’s degree in fields such as (Applied) Linguistics or English Language, with most pursuing a PhD in (Applied) Linguistics at the time of data collection. Fifteen percent held a BA and/or PGCE as their highest qualification. All raters had taught English as a Foreign Language (EFL) (2–32 years; M = 11.6). Thirty percent had also worked as professional raters for high-stakes standardized English language tests, but none were familiar with the rating scales used in this study before participation. The raters were recruited through personal and professional contacts.
Instruments
Reading-into-writing task and performances
The task used in this study was a reading-into-writing task of the ISE II exam (CEFR B2) from Trinity College London. This task requires test-takers to write a 150- to 180-word magazine article on a popular science topic using only information presented in four reading source texts (about 500 words in total). The task aims to assess the ability to identify information from the texts relevant to the prompt; identify common themes and links across the four source texts; and paraphrase, summarize, and synthesize information from the source texts (Trinity College London, 2015). A sample task (Task 3; Trinity College London, n.d., p. 7) can be found on https://www.trinitycollege.com/resource/?id=7202. For test security reasons, the specific prompt used in this study cannot be shared here.
A total of 159 test-taker performances on the task were used in the present study: 12 scripts for rater training and 147 for rating data collection. These had been written by test-takers under live exam conditions and were sampled from approximately 500 scripts to which the researchers were given access. The sampling criteria used were score distribution based on ISE II operational raters’ scores on the live test administration (to represent all four ISE II performance levels), legibility of test-takers’ handwriting, and text length to ensure an adequate amount of rateable language. The sample constituted a well-balanced ratio of scripts across ISE Score Levels 1 to 3, but limited scripts at Level 4, which represents the typical ISE II test-taker population.
Rating scales
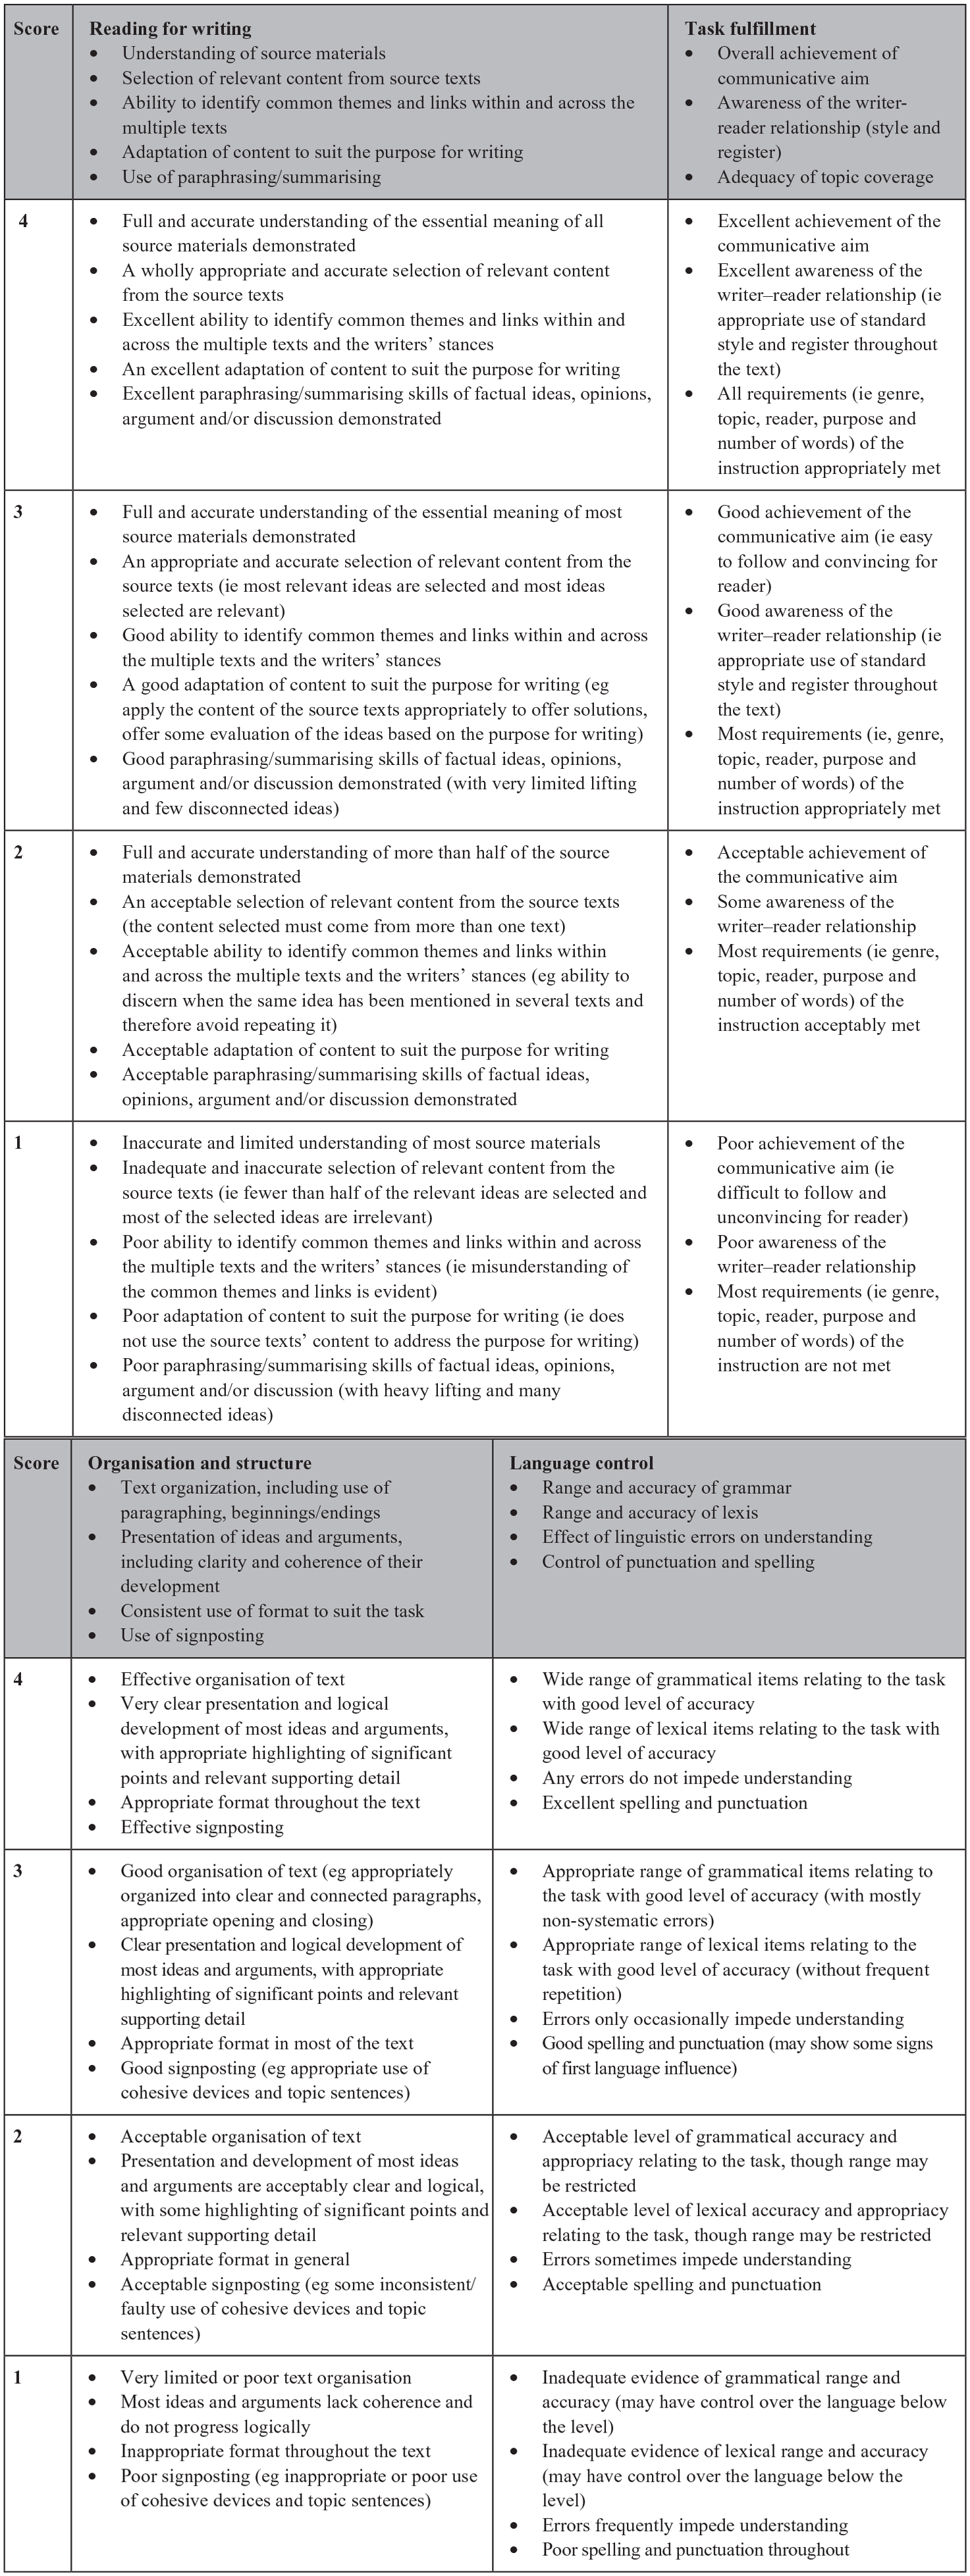
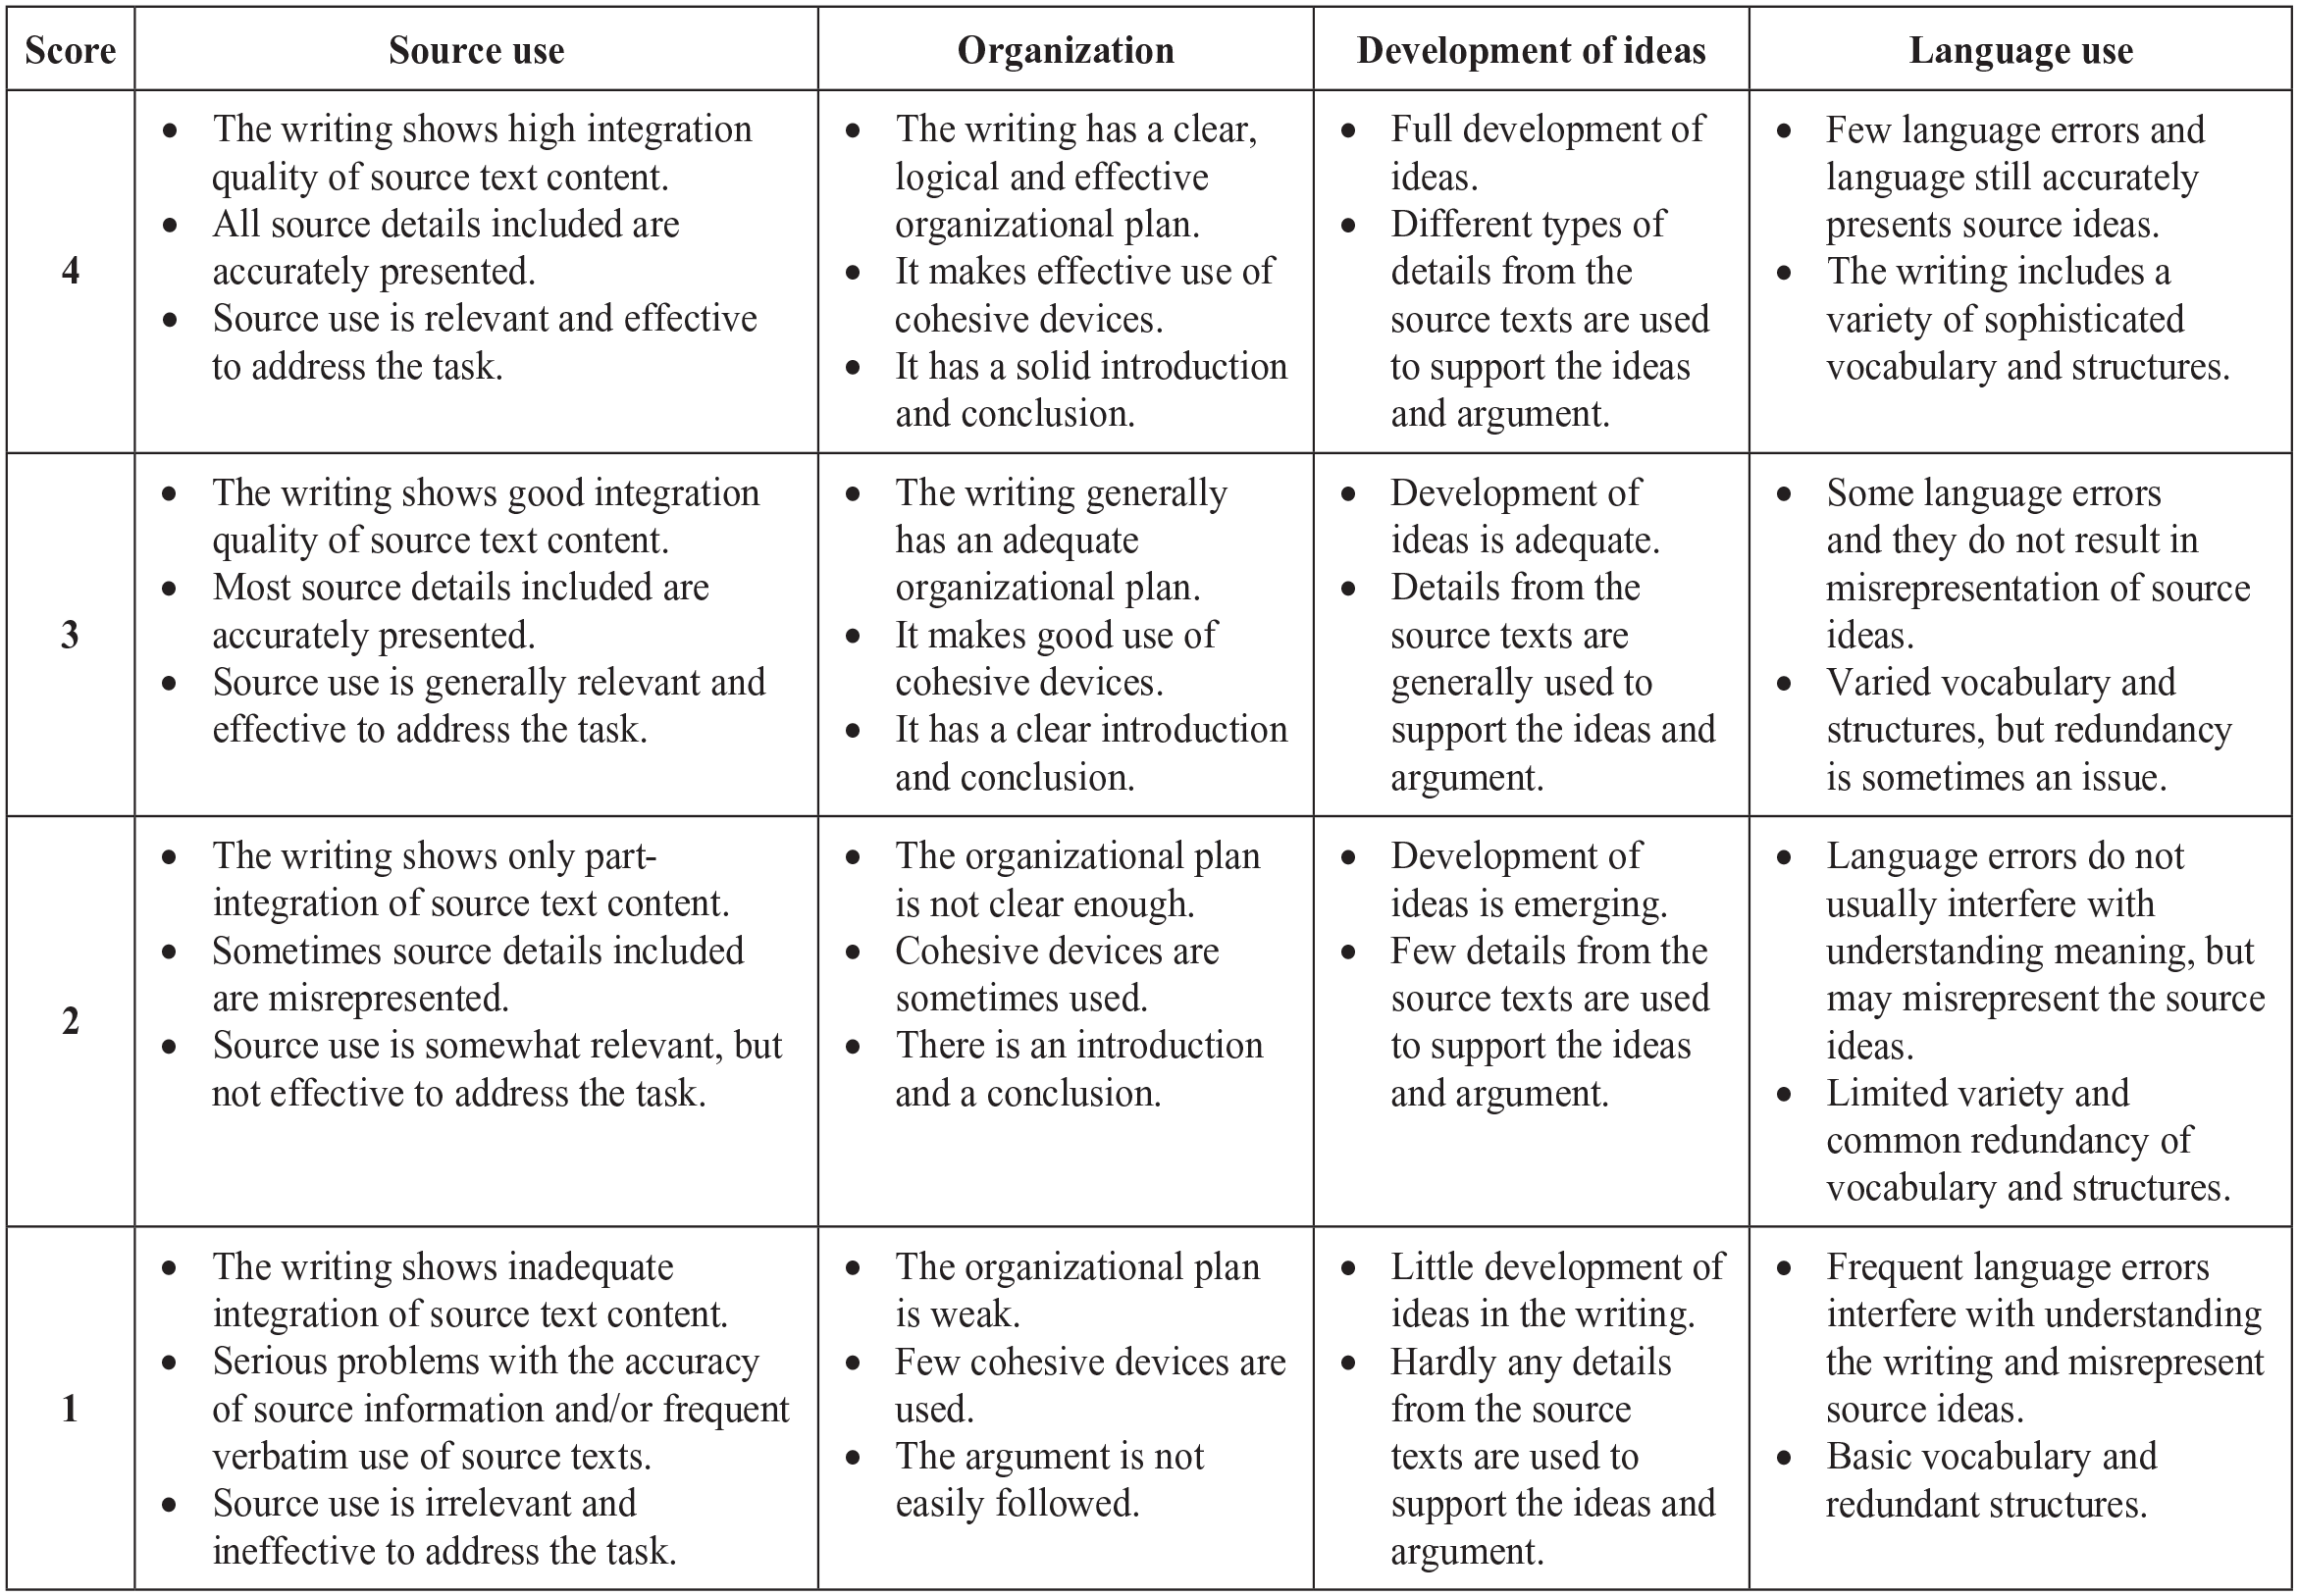
Two analytic rating scales specifically designed for rating reading-into-writing were used in this study. The two scales were deemed comparable in terms of target construct, especially in that the two are used to score reading-into-writing tasks involving multiple source texts, thereby targeting the important construct of discourse synthesis. At the same time, the scales differ fundamentally in their source use construct operationalization (the variable of interest in this study). The first rating scale (henceforth Rating Scale 1, Figure 3) was adapted from Trinity College London’s ISE II reading-into-writing scale developed by Chan et al. (2015). The adaptations comprised (1) deleting Band 0 (as no scripts in this study were at this band level) and (2) modifying the scale layout. The scale has four rating criteria: Reading for Writing, Task Fulfilment, Organization and Structure, and Language Control. The reading-related and source use construct is operationalized exclusively in one specific criterion, Reading for Writing. The second rating scale (henceforth Rating Scale 2, Figure 4) was adapted from a reading-into-writing rating scale developed by Plakans and Gebril (2015). The modifications comprised (1) removing one criterion—Authorial Voice—because the task used in this study did not require test-takers to present their personal view on the topic discussed, making this criterion irrelevant and (2) modifying some of the scale descriptors to suit the ISE II reading-into-writing task. This scale also has four rating criteria: Source Use, Organization, Development of Ideas, and Language Use. The reading-related and source use construct in this scale is operationalised in Source Use, but also interwoven in the descriptors under Development of Ideas and Language Use, reflecting the idea that test-takers’ use of sources affects their topic development and language production.
Rating Scale 1.
Rating Scale 2.
Rater training material
Two online, self-paced rater training modules (one for each rating scale) were developed to familiarize raters with the reading-into-writing task and the relevant rating scale. Delivered via Qualtrics, each training module consisted of three parts: (A) task familiarization, (B) rating scale familiarization, and (C) rating practice. Part A required reading the four source texts of the ISE II task and answering comprehension questions. Part B comprised activities to match and order rating scale descriptors. Part C involved two rounds of rating practice: first, raters were asked to mark three scripts, write short rationales for the marks they awarded, and then compare their marks and rationales with those of an expert rater. Next, raters were assigned another three scripts for marking and do the same as in Round 1.
Post-rating questionnaires
Two post-rating questionnaires were designed to gather raters’ perceptions of the usability of the rating scales, to shed light on the quantitative findings from the analyses of the rating data. Each questionnaire comprised two sections: 15 five-point Likert-type items and six open-ended questions. The Likert-type items were designed to gauge raters’ perceptions of (1) the clarity of descriptors in terms of helping them mark consistently and reliably on the various criteria in the rating scales, and (2) the general practicality and usefulness of the rating scales. The items can be found in the “Results” section, Table 12. The open-ended questions of the post-rating questionnaires aimed to elicit raters’ views on (1) the distinguishability of the criteria, (2) usefulness of features, and (3) challenges while using the scales:
Did you find the criteria adequately distinguishable? Please elaborate.
Are there any particular feature(s) of the rating scale that you found useful to help you mark the performances? Please explain.
Are there any particular feature(s) of the rating scale that you found confusing or not very helpful or difficult to operationalize? Please explain.
Is there anything that you feel is important but not covered in the rating scale?
Are there any challenges that you faced while marking the performances using the rating scale?
Please write here any other comments on the rating scale.
Data collection
Data collection spanned two rating rounds, one for each scale, with a 4- to 6-week interval in-between. A counter-balanced design was used to mitigate potential order effects; raters were randomly assigned to either Group A or Group B, with Group A using Rating Scale 1 in the first round and Rating Scale 2 in the second round, and Group B, the opposite. Adopting an incomplete rating design combining systematic links and anchor performances (Wind & Jones, 2019), each rater was assigned 35 scripts for marking, 7 of which were common scripts assigned to every rater (see Figure 5). In each rating round, raters had to complete the relevant rater training module, mark 35 scripts, and fill out the relevant post-rating questionnaire. Raters were given a maximum of 1 week to complete all three activities, and the majority completed each round within one or two consecutive days. This resulted in two types of data: (1) reading-into-writing scores generated from using the two rating scales and (2) post-rating questionnaire responses.
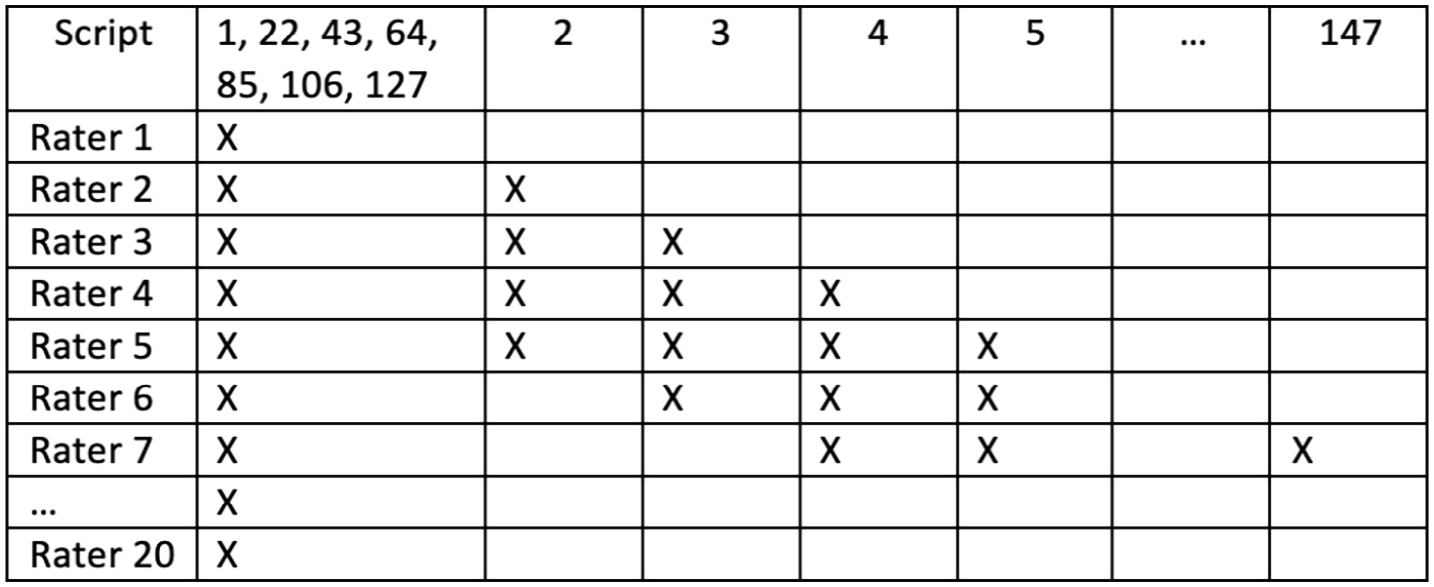
Rating design.
Data analysis
Rating data
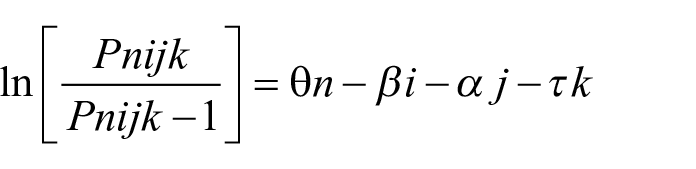
The rating data gathered with each rating scale were separately subjected to 3 three-facet (i.e., scripts, raters, rating scale criteria) many-facet Rasch measurement (MFRM) analyses (Linacre, 1989) using Facets software version 3.71.4 (Linacre, 2015a). First, the Rating Scale Model (Andrich, 1978) was applied to the data to examine the extent to which the rating data fit the MFRM model. MFR-RSM assumes that all the criteria within an analytic rating scale have the same threshold parameters (Eckes, 2015; McNamara et al., 2019) and is commonly used to inspect the overall functioning of analytic rating scales. The mathematical expression of this model is
where
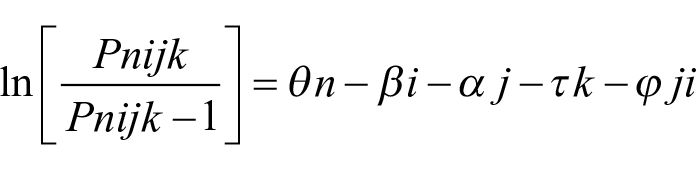
Second, interactions/bias analysis was run to detect potential interactions between raters and rating scale criteria. The mathematical expression of the model is
The
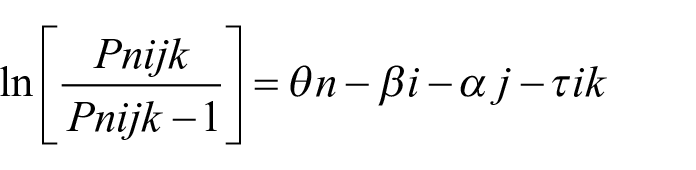
Third, to address RQ2, a hybrid model was used by applying the Rating Scale Model (Andrich, 1978) to the scripts and raters facets, and a Partial Credit Model (Wright & Masters, 1982) to the rating scale criteria. The mathematical expression of this hybrid model is
The
Further analyses were conducted to provide evidence relevant to RQ3, that is, principal components analysis of residuals using Winsteps v3.81.0 (Linacre, 2015b), and principal axis factoring and correlation analyses using SPSS version 28 (https://www.ibm.com/products/spss-statistics).
Post-rating questionnaire data
To address RQ4, responses to the Likert-type items were analysed using descriptive statistics. Responses to the six open-ended questions—totalling 9209 words (4317 for Rating Scale 1 and 4892 words for Rating Scale 2; contributed by all 20 raters)—were analysed, using Atlas.ti 8.4.5 (https://atlasti.com), for common themes and insights that could elucidate the quantitative results on the ratings data.
Results
Prior to interpreting the MFRM results, data-to-Rasch model fit was examined mainly by inspecting the fit statistics of the three facets involved. Fit statistics, which provide information about the residuals between model expectations and empirical observations, have an expected value of 1.0 and range from 0 to infinity (Linacre, 2020). Table 1 shows that all three facets (examinee, rater, and criterion) for both rating scales had mean infit and outfit statistics of (very close to) 1. Other indicators of data-to-model fit (i.e., unexpected responses, fit statistics, estimated discriminations, and inter-rater agreement) also confirmed that the rating data gathered using the two analytic rating scales fit the Rasch measurement model satisfactorily to warrant further interpretations of the results.
Summary statistics of the three facets.
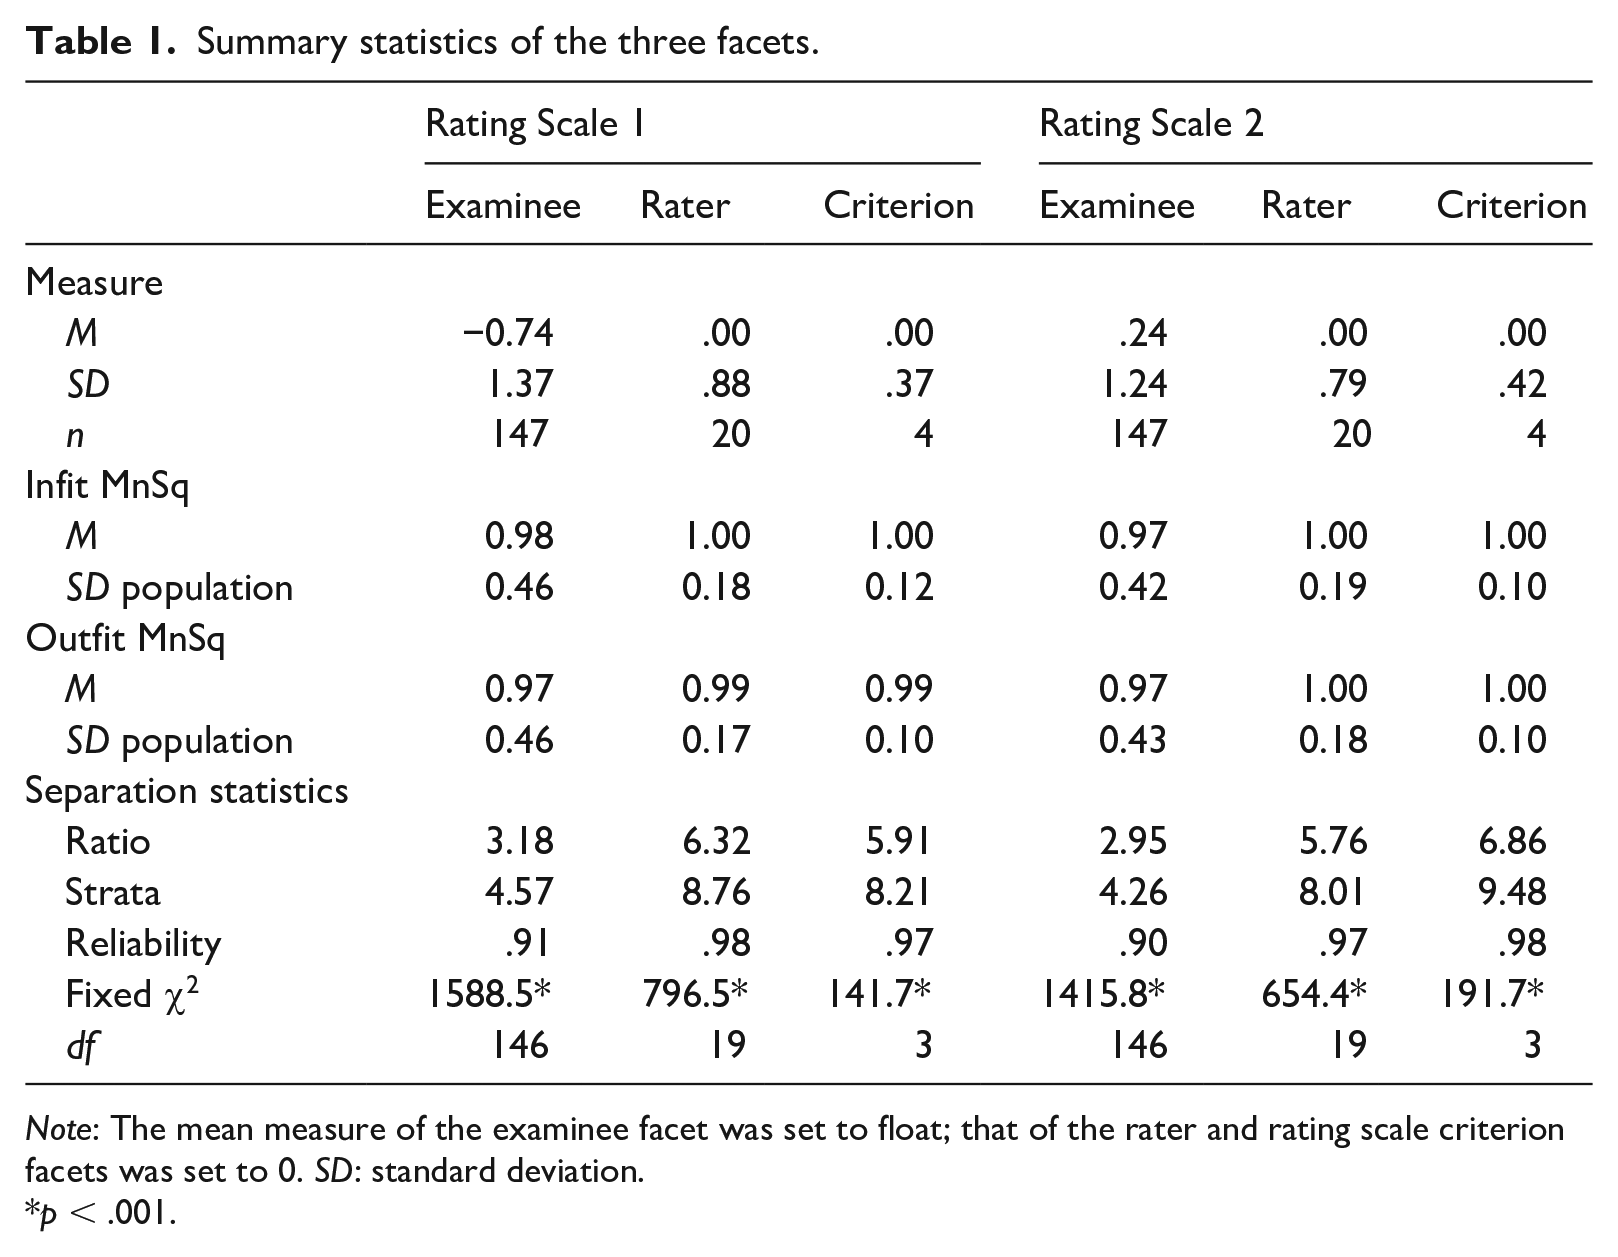
Note: The mean measure of the examinee facet was set to float; that of the rater and rating scale criterion facets was set to 0. SD: standard deviation.
p < .001.
RQ1. To what extent do individual raters vary in applying two different analytic rating scales for assessing reading-into-writing?
Rater functioning, rating scale overall functioning, and rater-rating criterion interactions/bias were examined to address RQ1. Table 2 presents abbreviated rater measurement reports for Rating Scales 1 and 2. The severity of the 20 participating raters differed when they were using either Rating Scale 1 or Rating Scale 2. Rater severity variance spread over 2.75 logits from −1.39 to 1.36 logits (SD population: 0.88, SD sample: 0.90) when using Rating Scale 1, and over 3.38 logits from −1.31 to 2.07 (SD population: 0.71, SD sample: 0.81) for Rating Scale 2. These results suggest that raters were not homogeneous under both circumstances, yet this lack of consensus is not unexpected (Eckes, 2015; Knoch et al., 2020).
Rater measurement report.
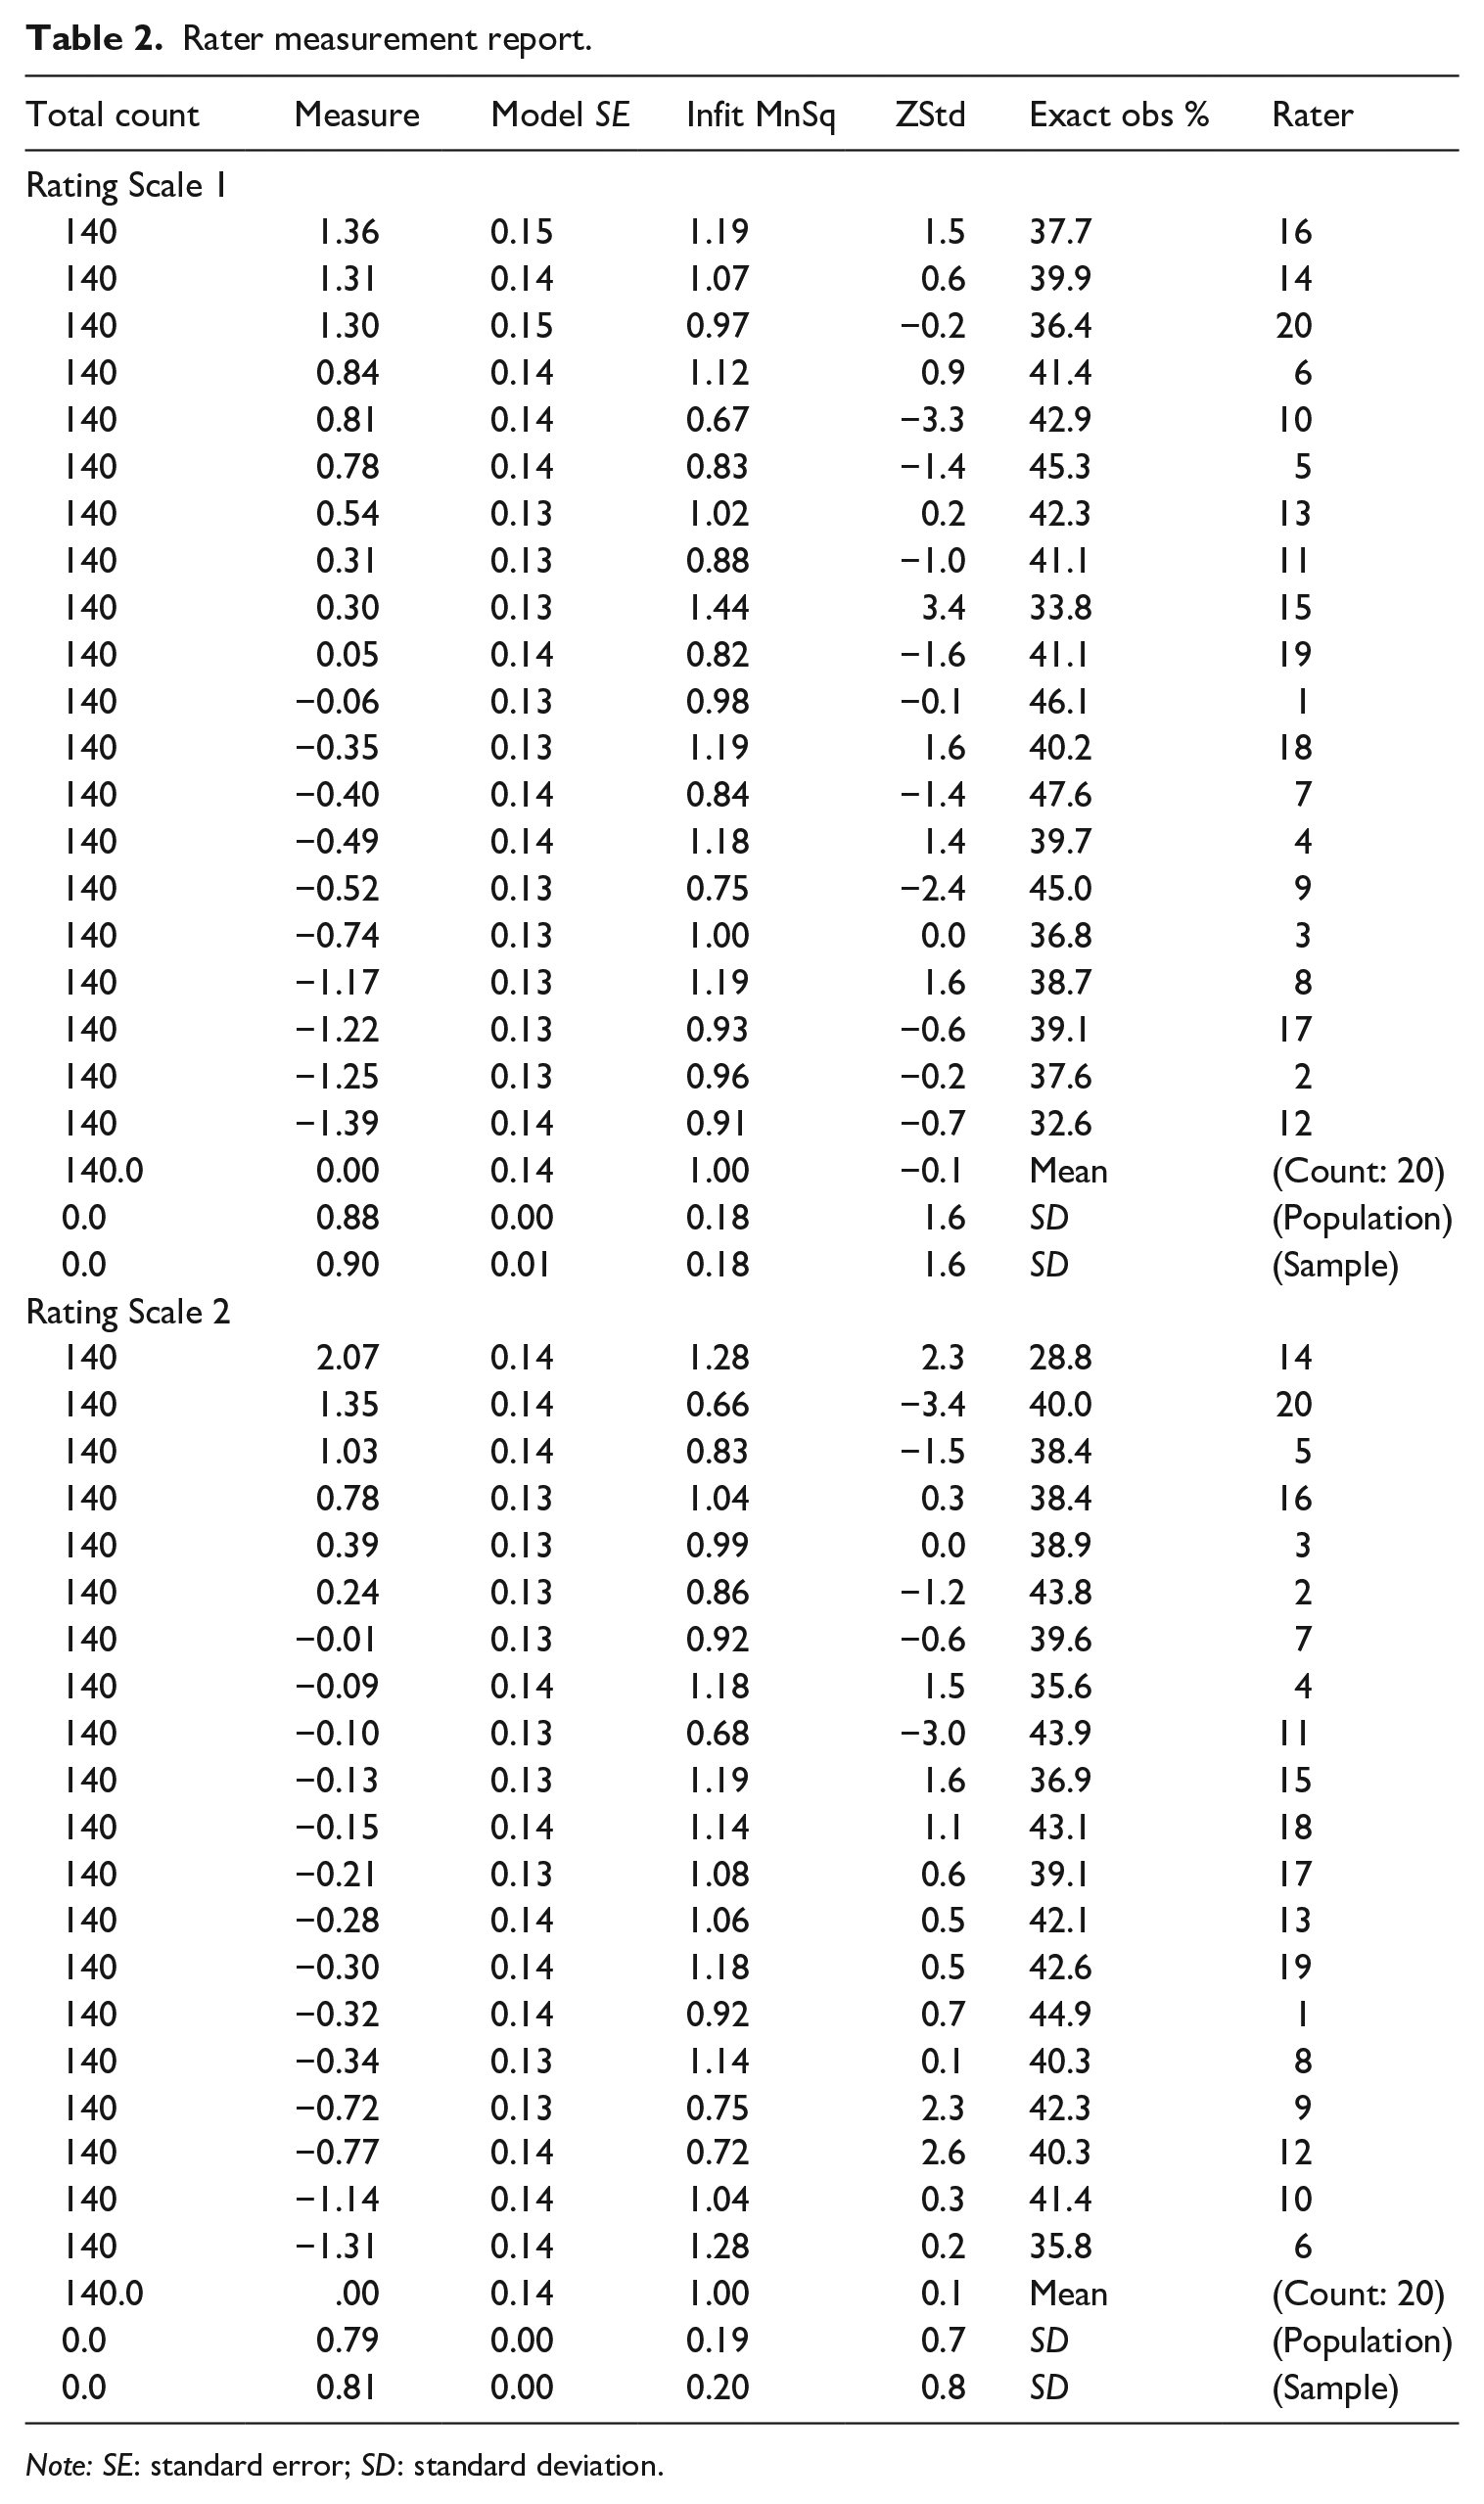
Note: SE: standard error; SD: standard deviation.
In terms of rating consistency as indicated by the fit statistics from the MFRM results, raters were found to be acceptably consistent when using both Rating Scale 1 and Rating Scale 2. The infit and outfit mean square values of the 20 raters using the two analytic rating scales were well within Linacre’s (2002) recommended range of 0.50 to 1.50, with the majority close to 1.0. When using Rating Scale 1, one rater’s (Rater 15) infit and outfit statistics (1.44 and 1.42, respectively) were close to the upper limit, suggesting that this rater was rather inconsistent. Another rater (Rater 10) had infit and outfit statistics of 0.67, close to the lower limit, thus leaning towards a slight overfit. When Rating Scale 2 was used, two raters (Raters 20 and 11) also had infit and outfit statistics of .66 and .64, and .68, tending towards a slight overfit. Overfitting raters rate with less variance than expected, possibly indicating a central tendency effect, but this is not detrimental to measurement (McNamara et al., 2019).
Rating scale criterion fit statistics and category statistics showed that both rating scales functioned very well. The infit and outfit mean square values of the criteria in Rating Scale 1 ranged between 0.86 and 1.18 and 0.85 and 1.12, respectively, and for Rating Scale 2 between 0.82 and 1.09 and 0.84 and 1.08, respectively (see Table 3). Examination of rating scale category statistics showed that both Rating Scale 1 and Rating Scale 2 met all the seven requirements for optimum functioning outlined by McNamara et al. (2019) (see Table 4): (1) there were at least 10 observations per score category to ensure the stability of the measurement results; (2) average measures increased by approximately the same value at each score category; (3) average measures increased monotonically; (4) the frequency of data points in each score category formed a reasonably smooth distribution with only one peak; (5) average measures were close to expected measures; (6) mean square values were all below 2.0; and (7) Rasch–Andrich thresholds increased monotonically at each score point by between 1.4 and 5 logits.
Rating scale criterion measurement report.
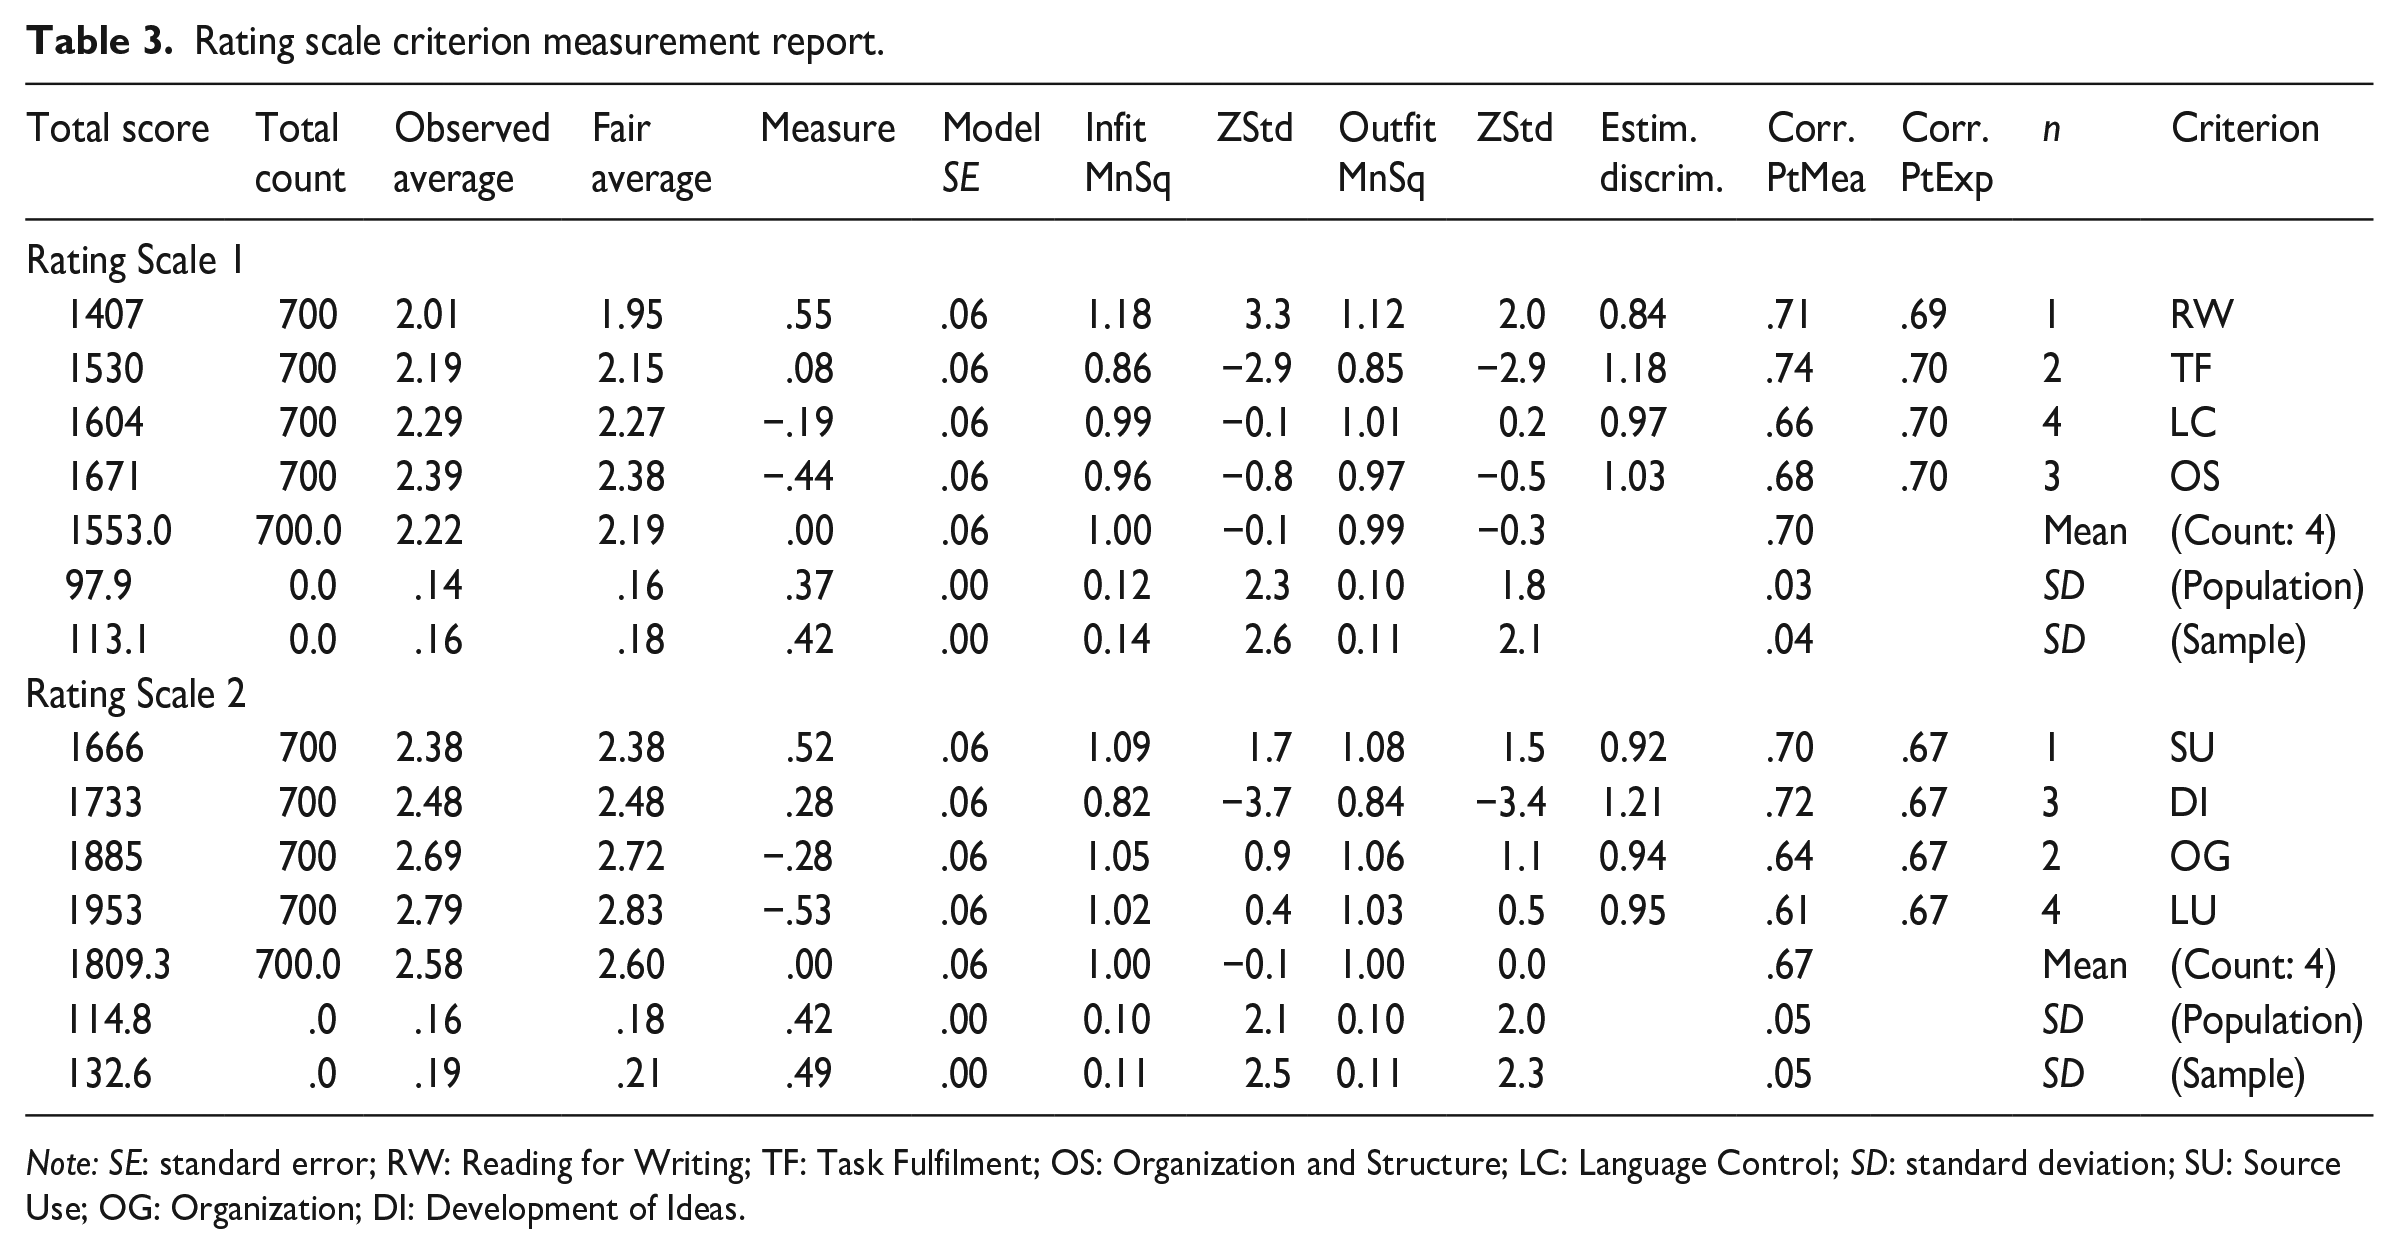
Note: SE: standard error; RW: Reading for Writing; TF: Task Fulfilment; OS: Organization and Structure; LC: Language Control; SD: standard deviation; SU: Source Use; OG: Organization; DI: Development of Ideas.
Rating scale category statistics.
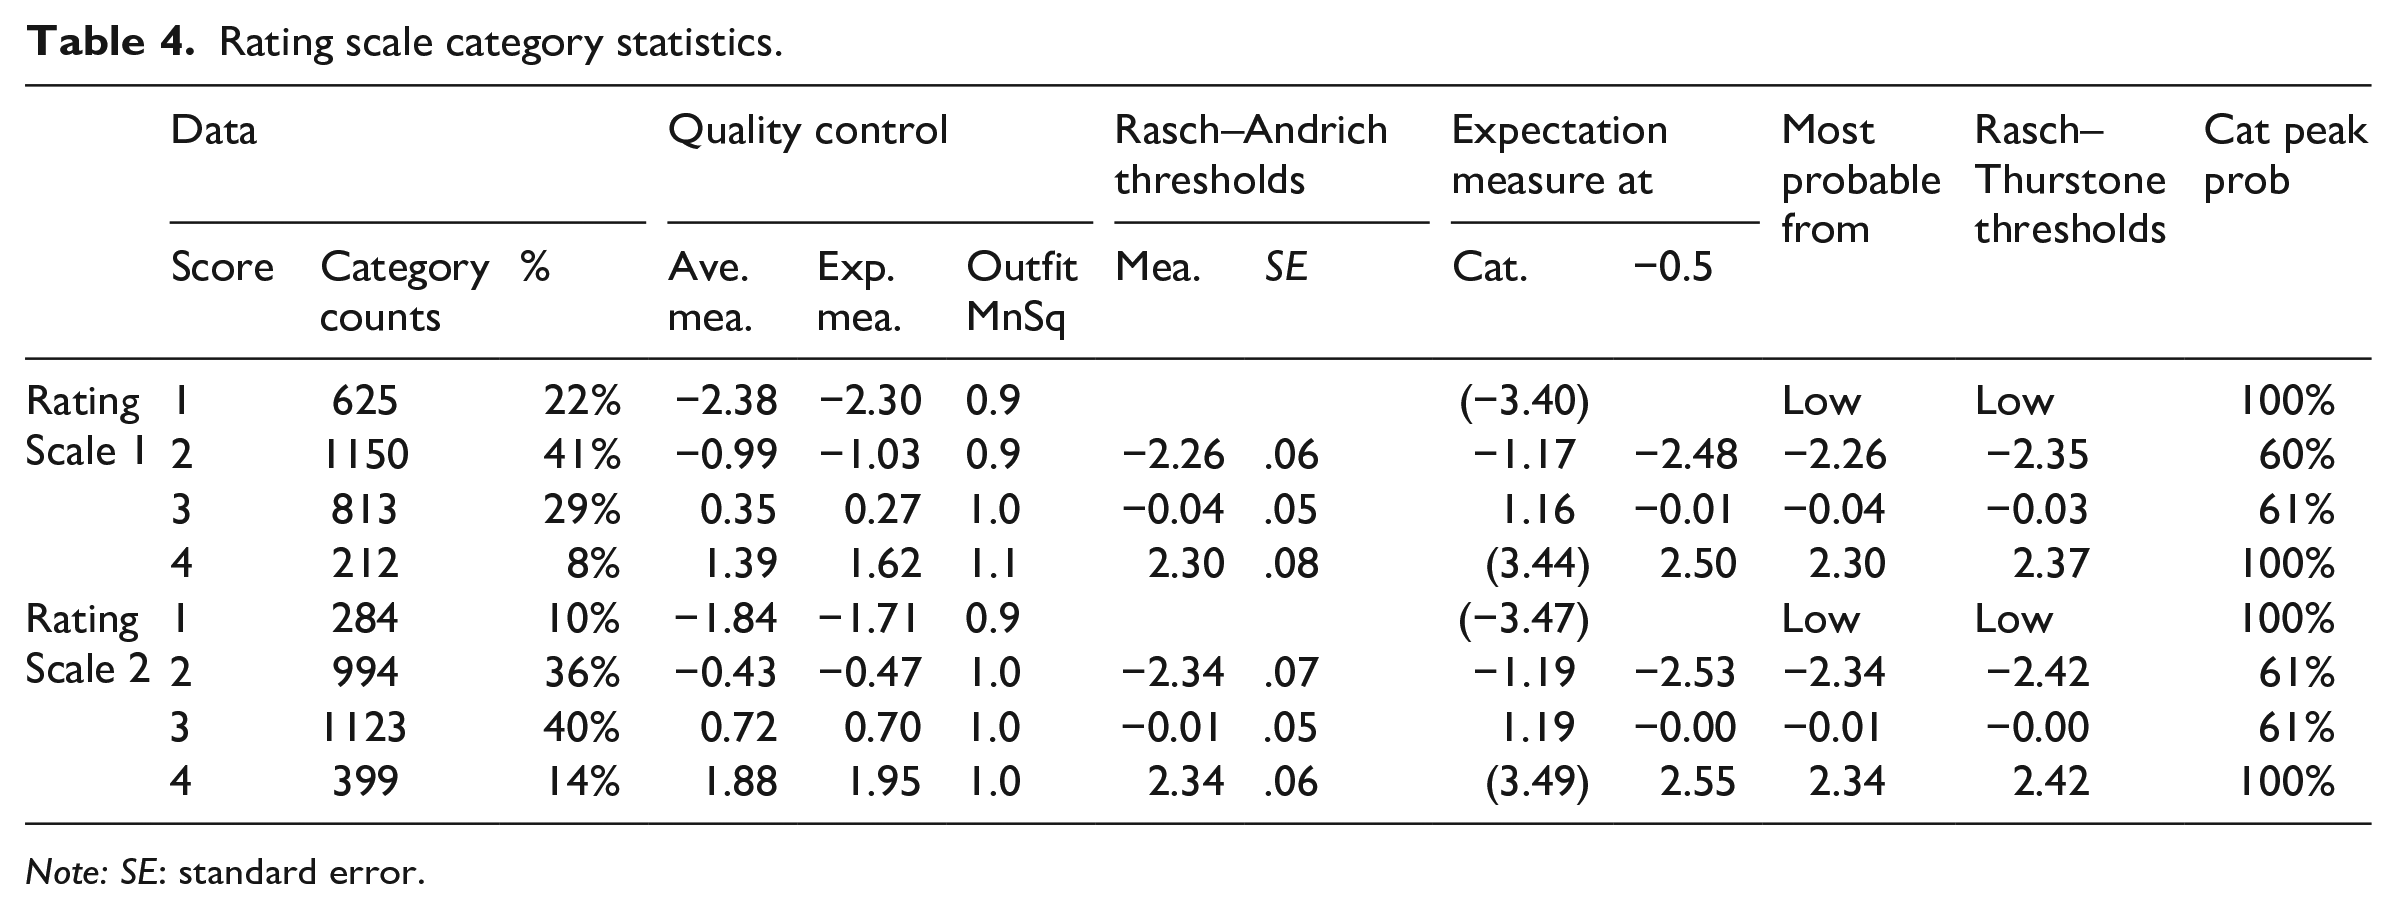
Note: SE: standard error.
Analyses of rater and rating scale criterion interactions/bias provide detailed information about individual raters’ severity/leniency measures against every criterion in the rating scale. Statistically significant interactions suggest that raters interpret the difficulty of certain criteria either significantly lower or higher than the group (Wind & Engelhard, 2013). Table 5 shows eight statistically significant interactions between raters and Rating Scale 1 criteria. Interactions with t values above 2.0 suggest that raters were rating more leniently than the model expectation; conversely, t values below −2.0 indicate that raters were rating more severely than expected by the model. There is no single criterion that caused persistent bias among raters, but the Language Control criterion appeared to have extreme interactions with Rater 15 (extremely severe) and Rater 18 (extremely lenient). In an operational rating condition, this information could be used to provide individualized feedback to the raters concerned (see Knoch, 2011).
Rating Scale 1 rater-rating criterion interaction/bias.
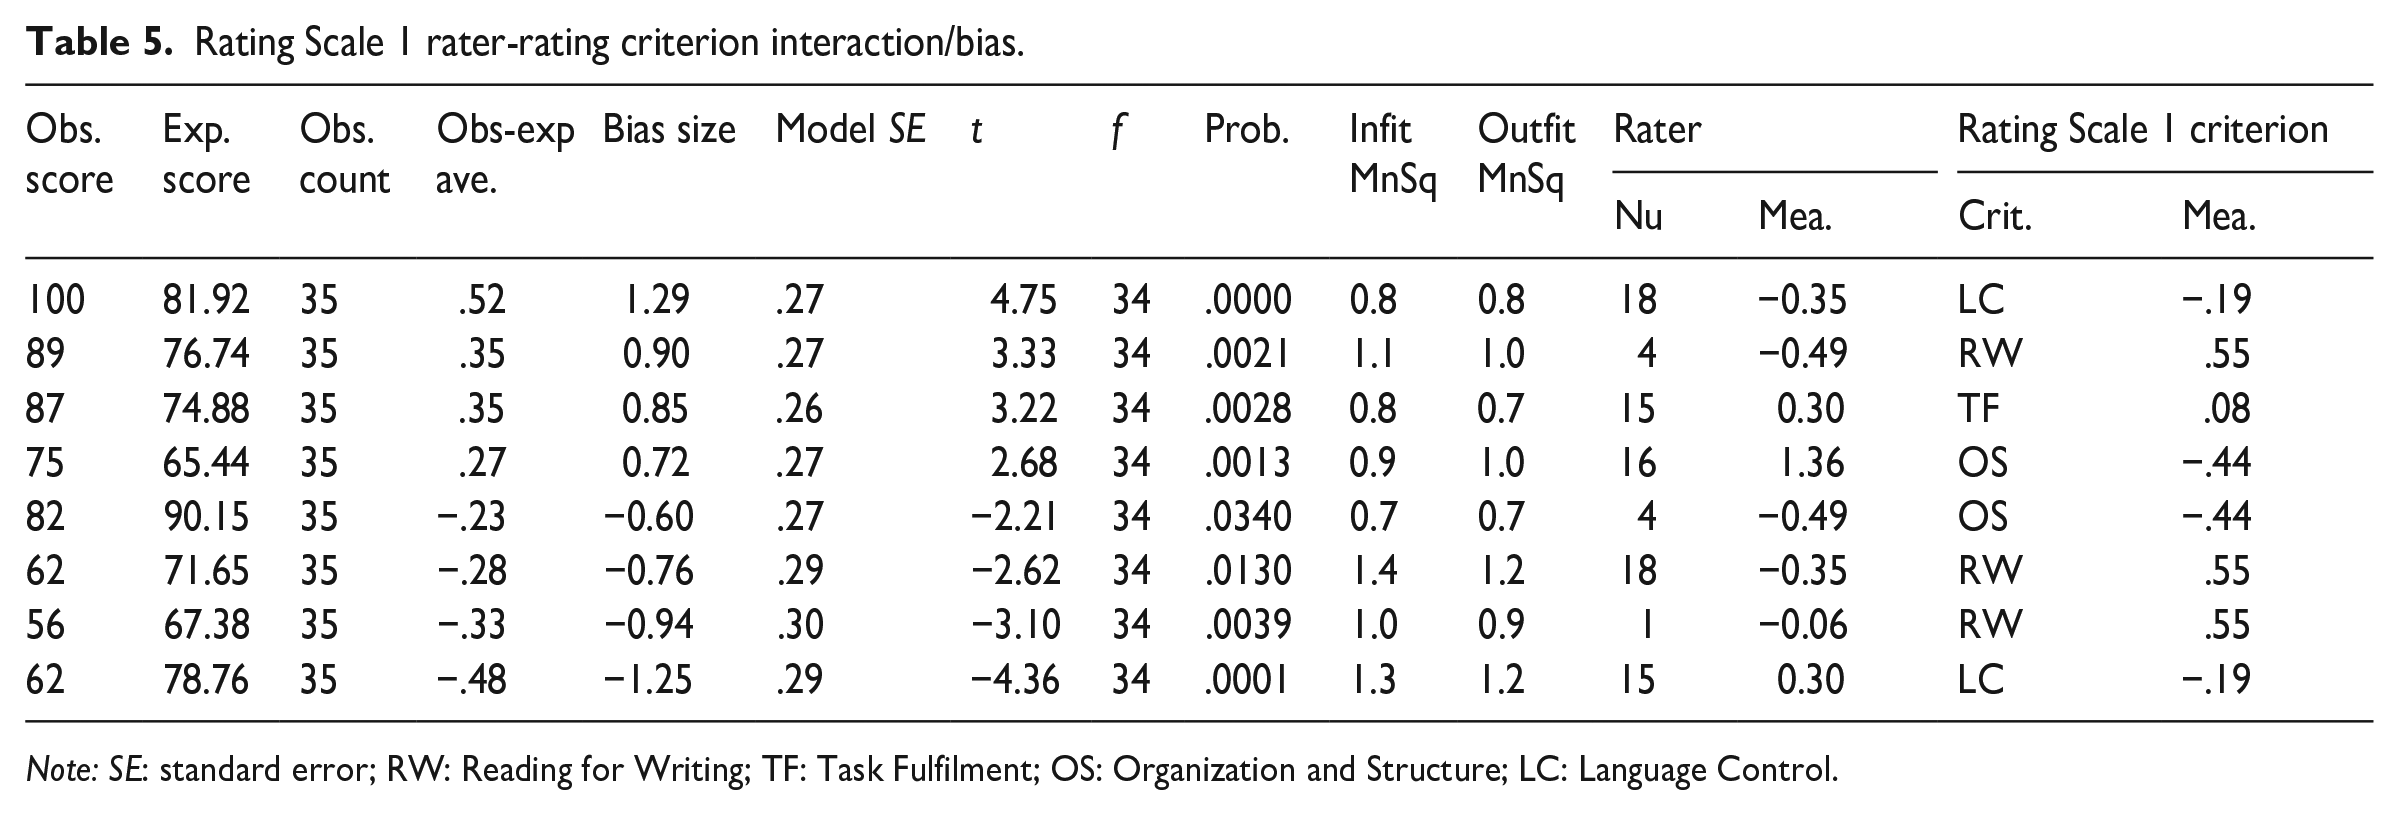
Note: SE: standard error; RW: Reading for Writing; TF: Task Fulfilment; OS: Organization and Structure; LC: Language Control.
As can be seen from Table 6, there were quite a few statistically significant interactions between raters and Rating Scale 2 criteria. One particularly important observation concerns the Language Use criterion, which appeared to cause the highest number of interactions (7) of all the criteria. Furthermore, some raters displayed differential severity and/or leniency against certain criteria. Myford and Wolfe (2004) noted that differential severity against an easy criterion and/or differential leniency against a difficult criterion might indicate an individual halo effect. For example, Rater 4 exhibited a statistically significant differential severity against the easiest criterion (Language Use) and a statistically significant differential leniency against the most difficult criterion (Source Use). Rater 4’s overall severity measure (−.09) was very close to the group average (.00), but this masks this rater’s differential leniency against the Source Use criterion and differential severity against the Language Use criterion in Rating Scale 2, as these two differential severity and leniency measures cancel each other out.
Rating Scale 2 rater-rating criterion interactions/bias.
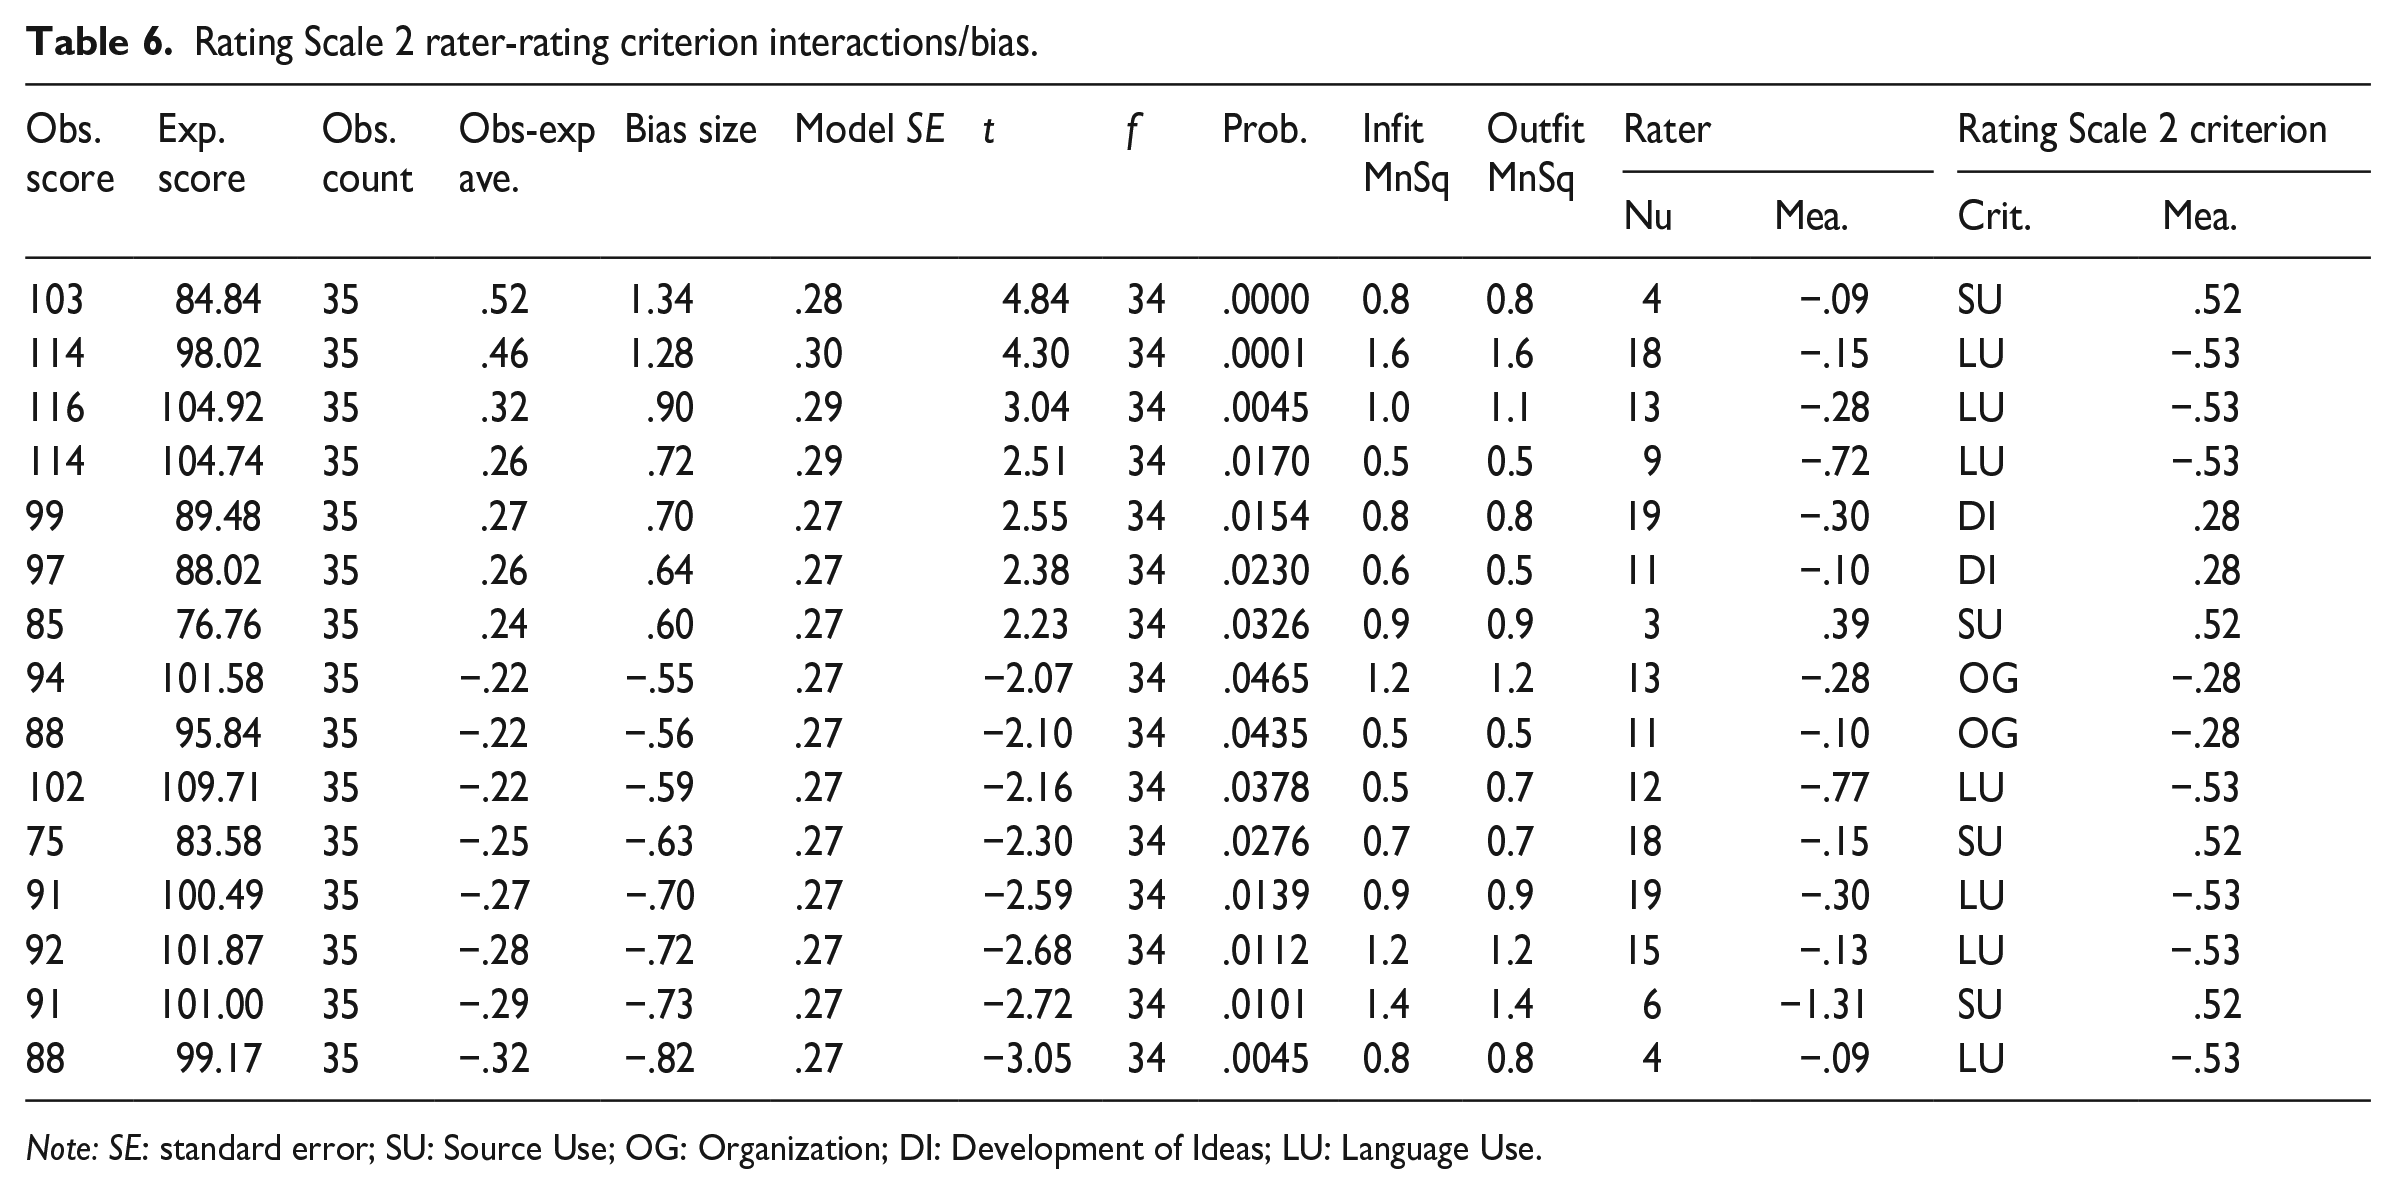
Note: SE: standard error; SU: Source Use; OG: Organization; DI: Development of Ideas; LU: Language Use.
RQ2. How do raters apply the two analytic rating scales across individual rating criteria?
To address RQ2, results from three different analyses are presented: (1) hybrid MFRM analysis allowing the inspection of each criterion within each rating scale to be modelled separately, (2) category statistics of individual criteria, and (3) individual criterion discrimination power.
The results of the hybrid MFRM analysis are illustrated in the Wright maps in Figures 6 and 7, which display the relationships between test-taker ability, rater severity/leniency, and rating scale criterion difficulty with the individual criteria modelled to have their own scale structure. It is evident that raters used the scale structures (Scores 1–4) for the individual rating criteria in each scale differently. In Rating Scale 1, the Reading for Writing criterion appeared to have a distinct scale structure from the other three criteria, indicated by the locations of the category thresholds marked by the horizontal dashes in Figure 6. Likewise, the Source Use criterion in Rating Scale 2 displayed a similar observation (see Figure 7); these two criteria exclusively representing the reading aspect of reading-into-writing seemed to have a narrower scale structure. Therefore, it appeared less likely for examinees at the lower end of the logit scale to achieve a score of 2 in Reading for Writing in Rating Scale 1 or Source Use in Rating Scale 2 than to achieve the same score in the other three criteria in the respective rating scales. Conversely, it was more likely for examinees at the higher end of the logit scale to achieve a score of 4 in Reading for Writing in Rating Scale 1 or Source Use in Rating Scale 2 than to achieve the same score in the other three criteria in the respective rating scales.
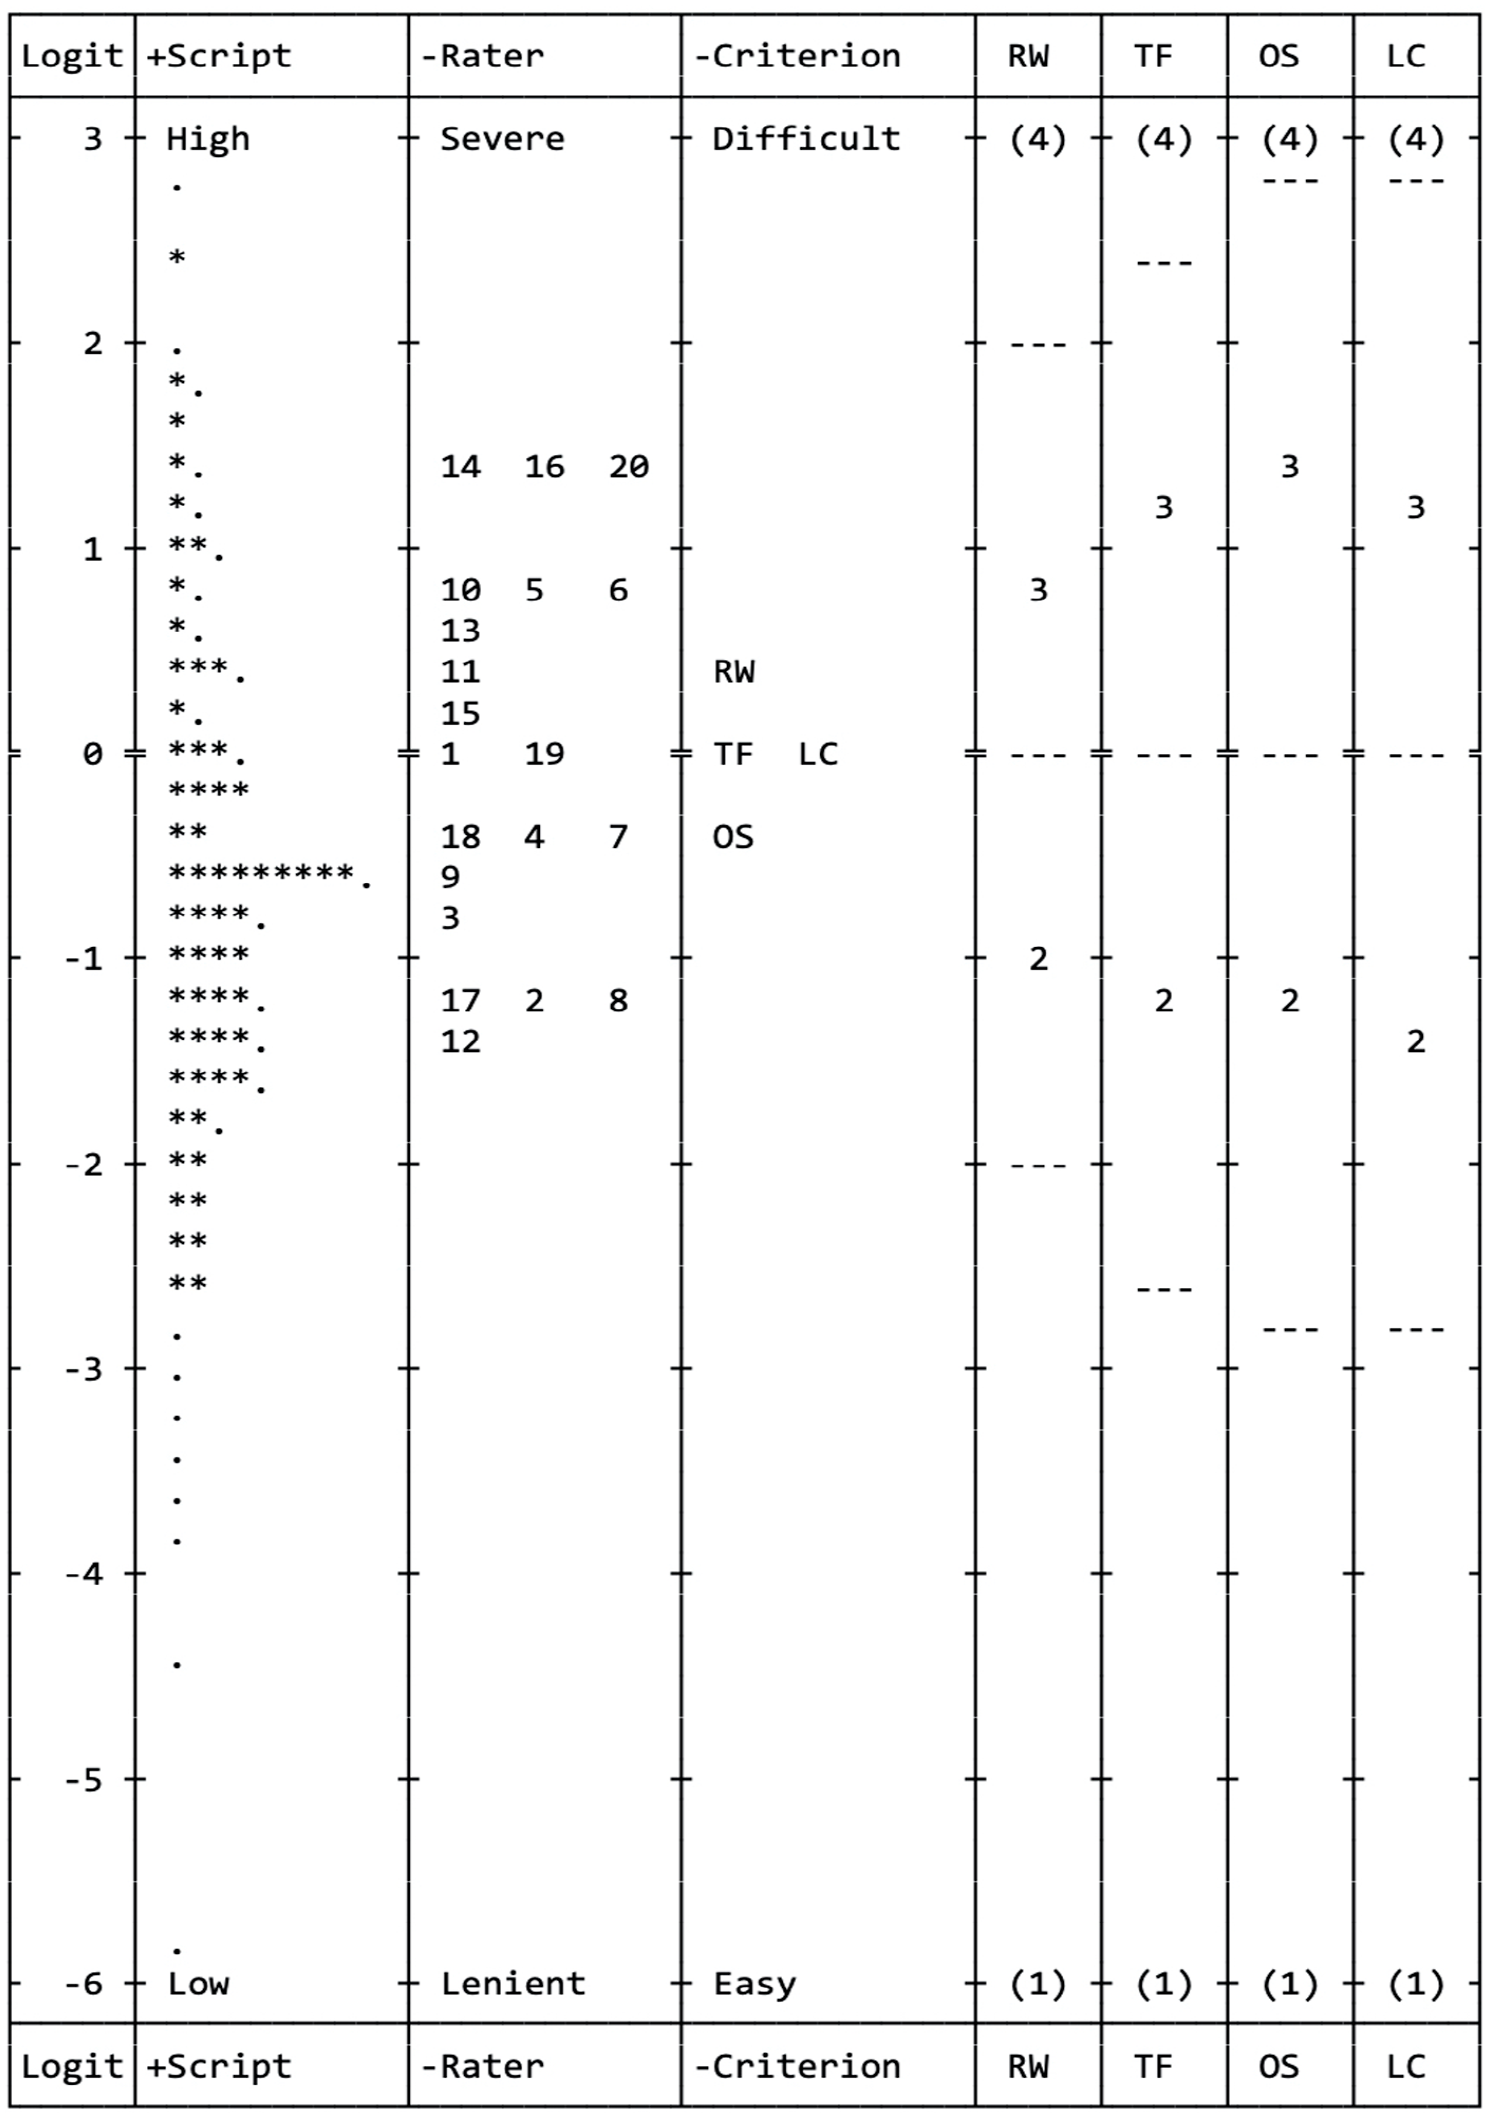
Rating Scale 1 Wright map from the many-facet partial credit analysis.
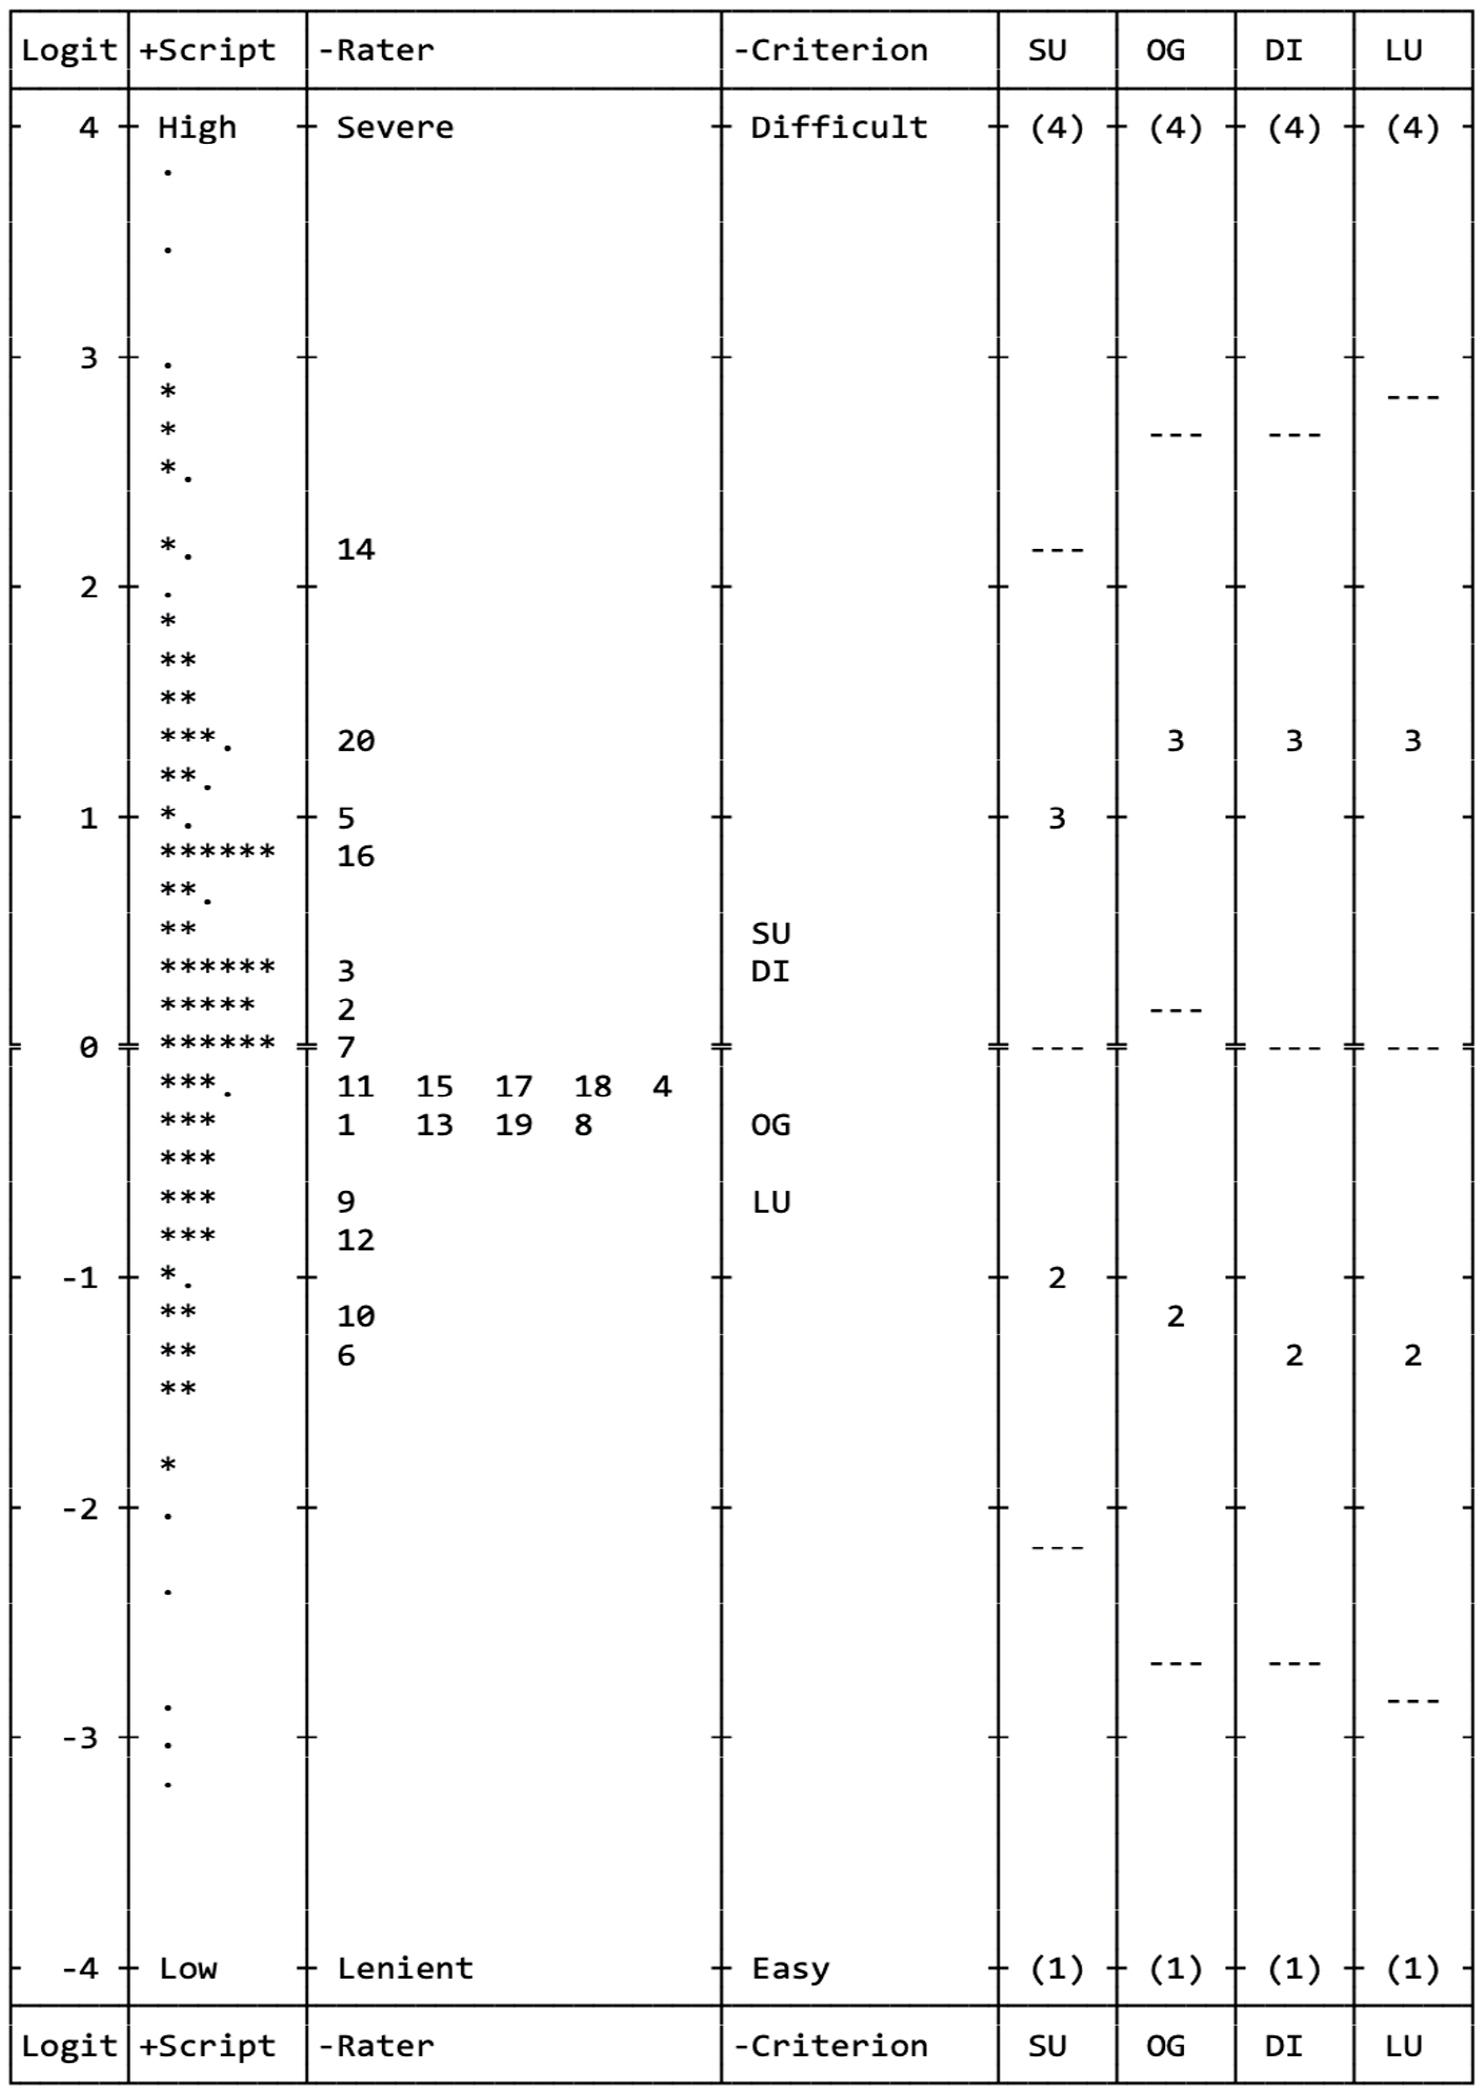
Rating Scale 2 Wright map from the many-facet partial credit analysis.
In terms of category statistics, the individual rating criteria in each rating scale satisfied almost all requirements for optimum functioning of rating scales (see Table 7). This provides more evidence that the criteria in both rating scales were well functioning.
Rating Scales 1 and 2 summary of category statistics.
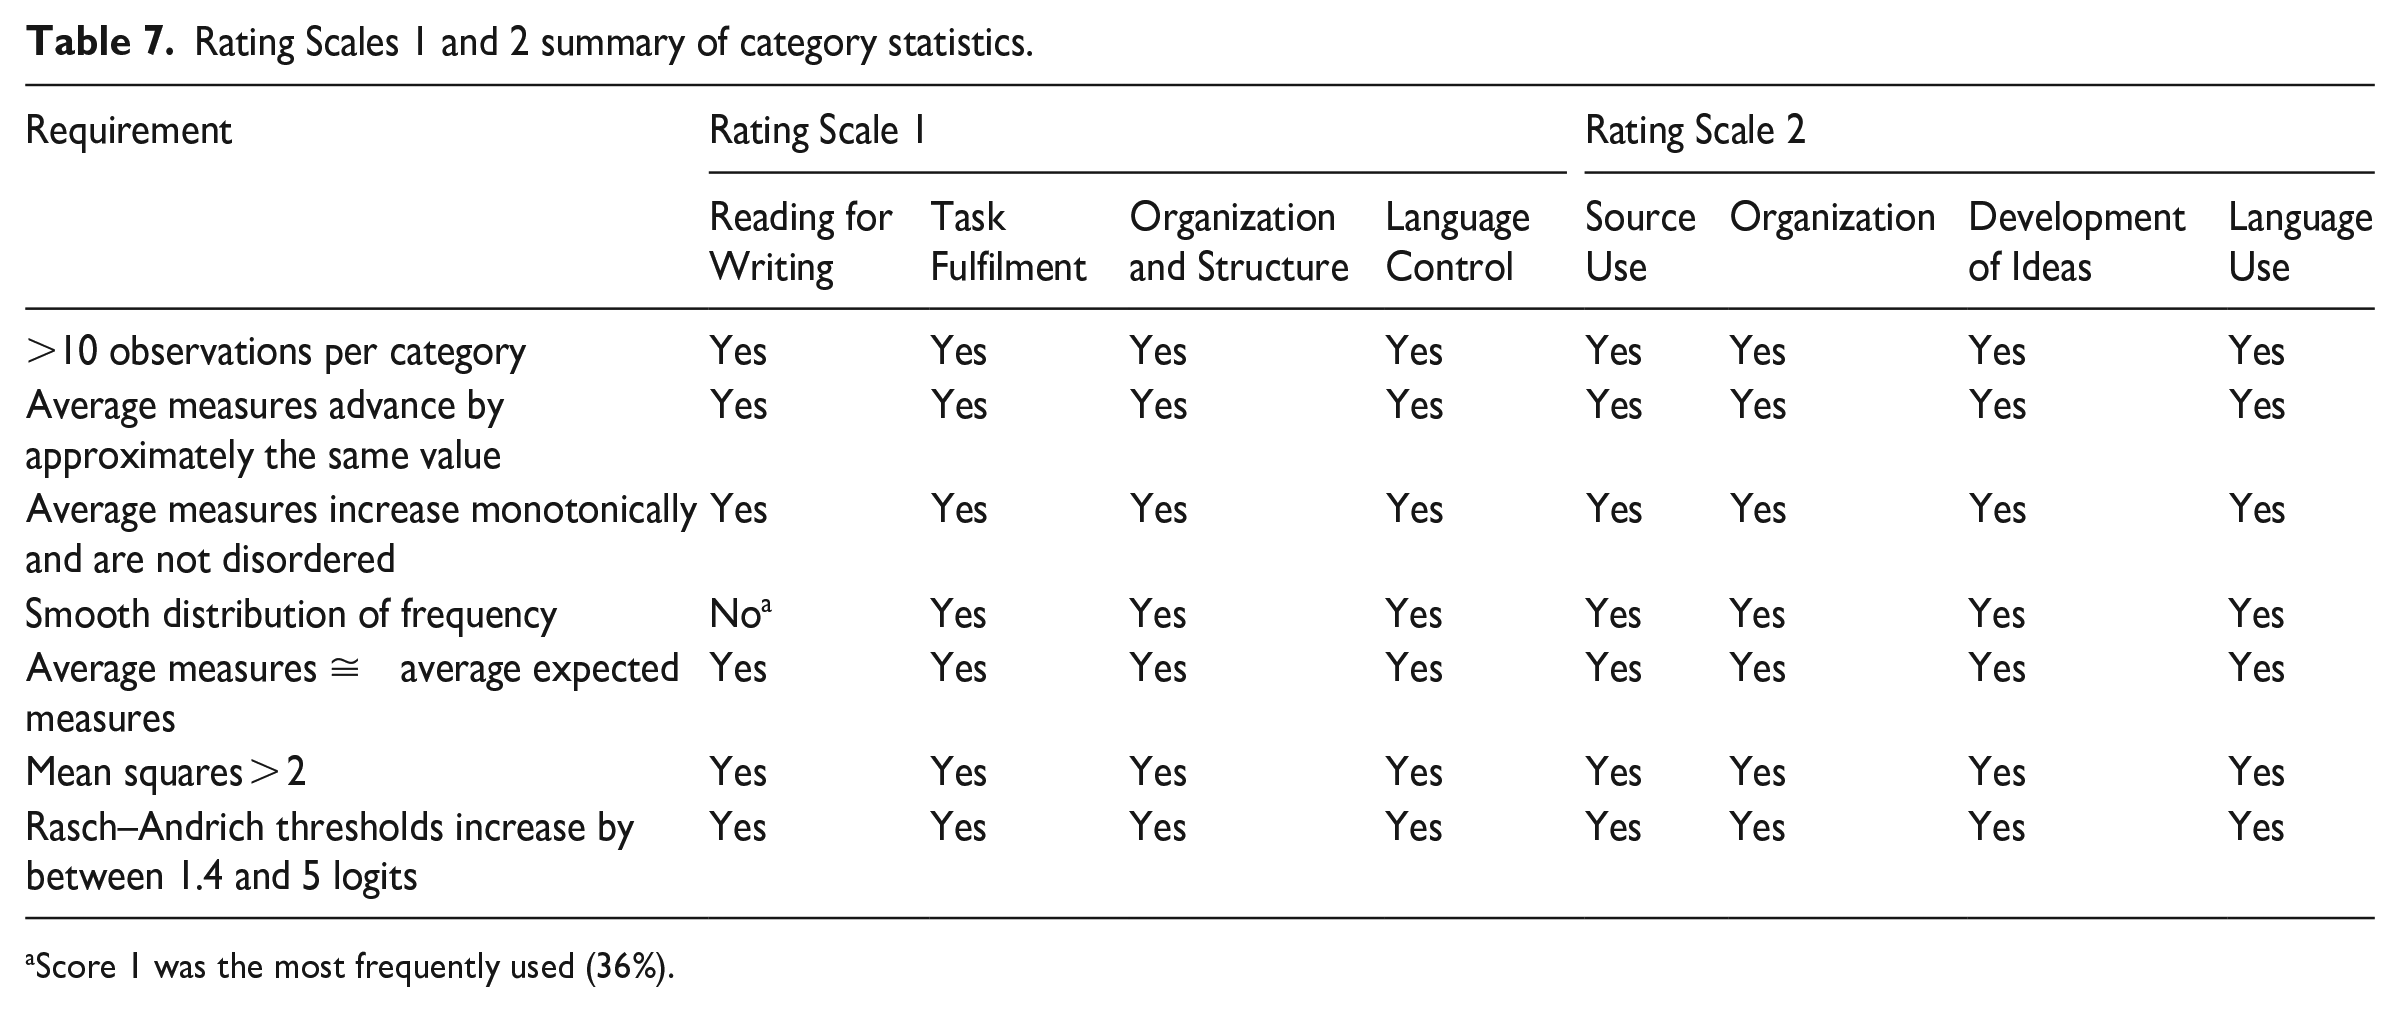
Score 1 was the most frequently used (36%).
Individual criterion discrimination, or the ability of each individual criterion within an analytic rating scale to discriminate examinees, was also examined. Less discriminating criteria may indicate raters’ difficulty in using the criteria (Knoch et al., 2020). As shown in Table 8, Reading for Writing was the least discriminating criterion in Rating Scale 1, while its counterpart, Source Use, was the most discriminating criterion in Rating Scale 2.
Sub-scale discrimination.
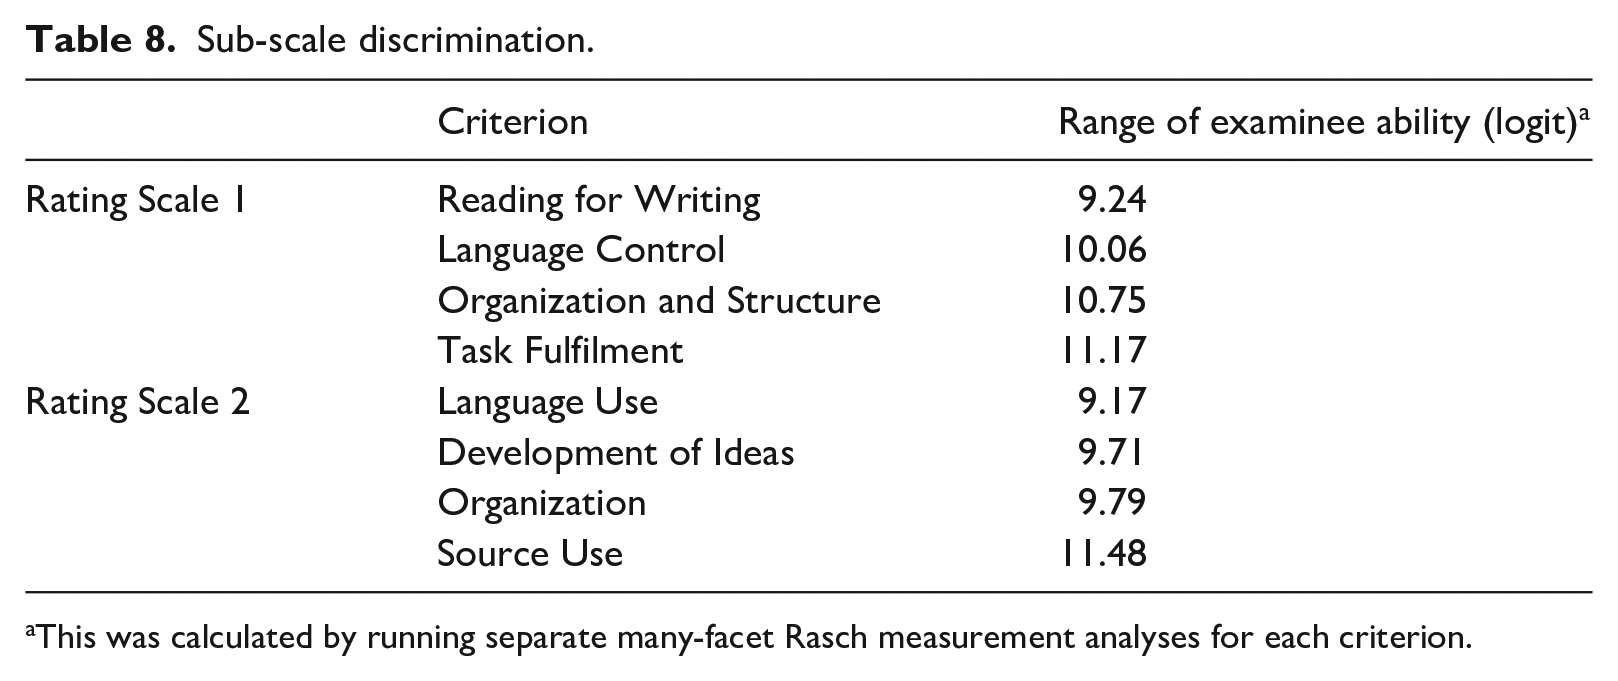
This was calculated by running separate many-facet Rasch measurement analyses for each criterion.
RQ3. To what extent do each analytic scale’s ratings provide unique but complementary information?
This question essentially investigates the extent to which the four criteria within each rating scale measure distinct aspects (multidimensionality) while working together to measure one underlying construct (unidimensionality). These features were examined using five indicators: (1) MFRM analysis of criterion fit statistics, (2) MFRM analysis of group-level halo effects (lack thereof), (3) principal components analysis of residuals, (4) correlation matrix, and (5) principal axis factoring.
The rating scale criterion fit statistics shown in Table 3 indicated that the criteria within each rating scale meet the expectations for unidimensional measurement required for MFRM, meaning that together they can be considered to form a single cohesive pattern of observations. This in turn can indicate that the four criteria measure one underlying construct of reading-into-writing.
Investigation of group-level halo effect, or more precisely the lack thereof, for the purpose of this research, could provide evidence that raters are able to distinguish the criteria within an analytic rating scale, and this can be done by examining the criterion difficulty measures and several indicators in the rating scale criterion summary statistics (Myford & Wolfe, 2004). Halo effect refers to “a rater’s tendency to assign ratees similar ratings in conceptually distinct traits” (Myford & Wolfe, 2004, p. 209). The criterion difficulty measures of Rating Scale 1 and Rating Scale 2 in Table 3 show that the four criteria in each rating scale had different difficulty levels. Furthermore, as shown in Table 1, the significant homogeneity index (fixed χ2) and its degrees of freedom reject the null hypothesis that the different criteria in both Rating Scale 1 and Rating Scale 2 are of the same difficulty levels. The high reliability coefficients (.97 for Rating Scale 1 and .98 for Rating Scale 2) provide further evidence that the four criteria were reliably separate.
Following Knoch et al. (2020), this study also used principal components analysis of residuals to examine the unidimensionality of the two analytic rating scales. The unexplained variances in the first contrast (i.e., the eigenvalue of the first principal component residuals) in both Rating Scale 1 and Rating Scale 2 were 1.8 and 1.9, respectively. A value below 2.0 indicates the absence of a secondary dimension (Linacre, 2020), which means that the four criteria within each rating scale worked in harmony to measure one unified construct. However, it is important to note that two “strands” were identified in both rating scales (Figures 8 and 9), and it can be inferred that Strand 1 is strongly related to content, while Strand 2 is more oriented towards organization and language aspects.
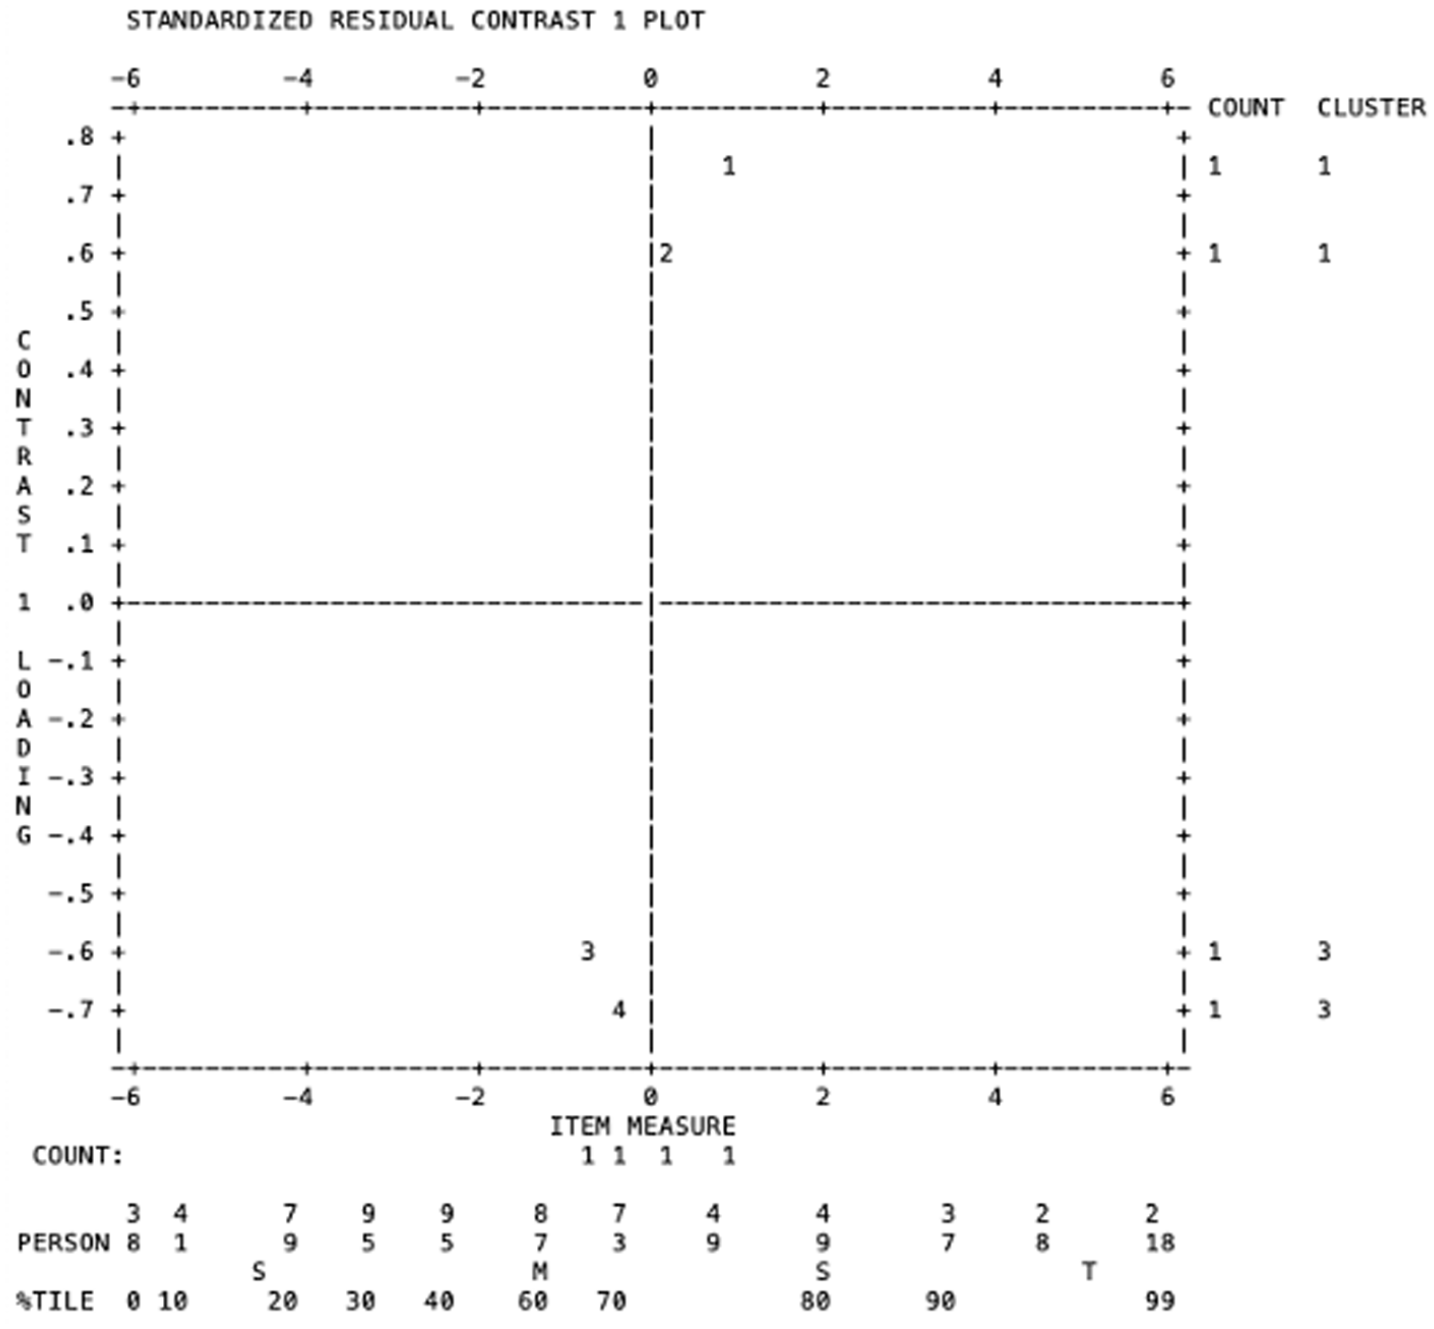
PCAR for Rating Scale 1.
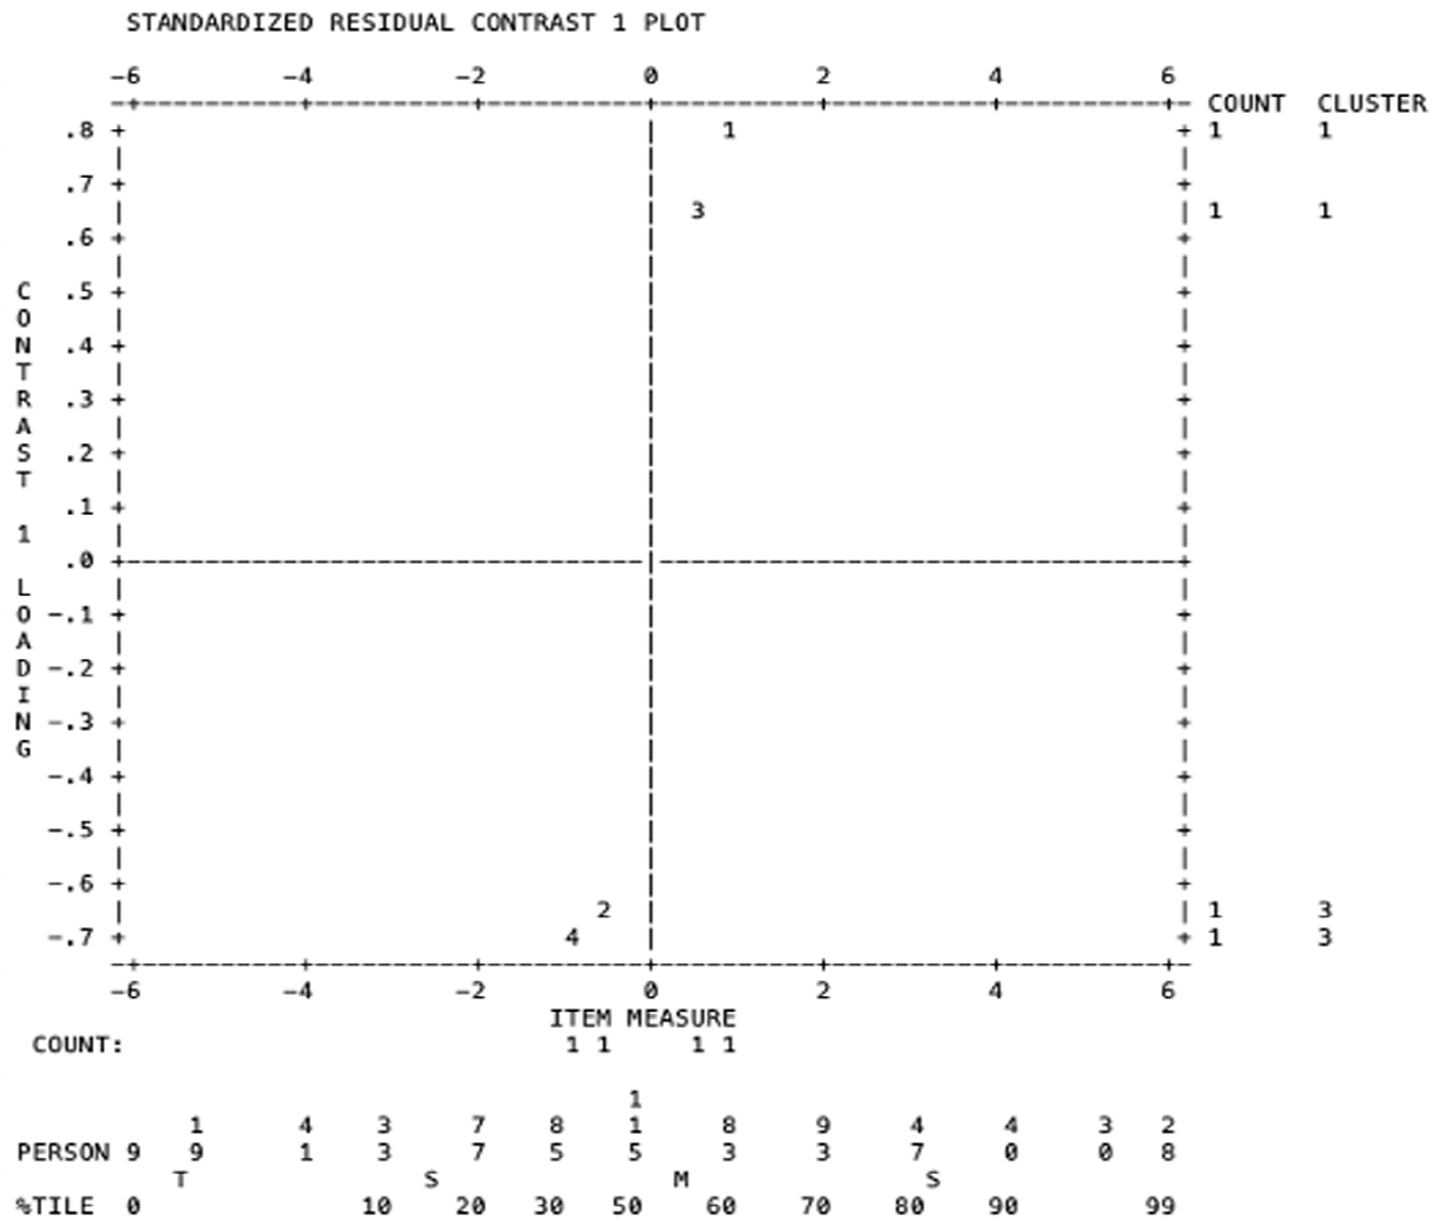
PCAR for Rating Scale 2.
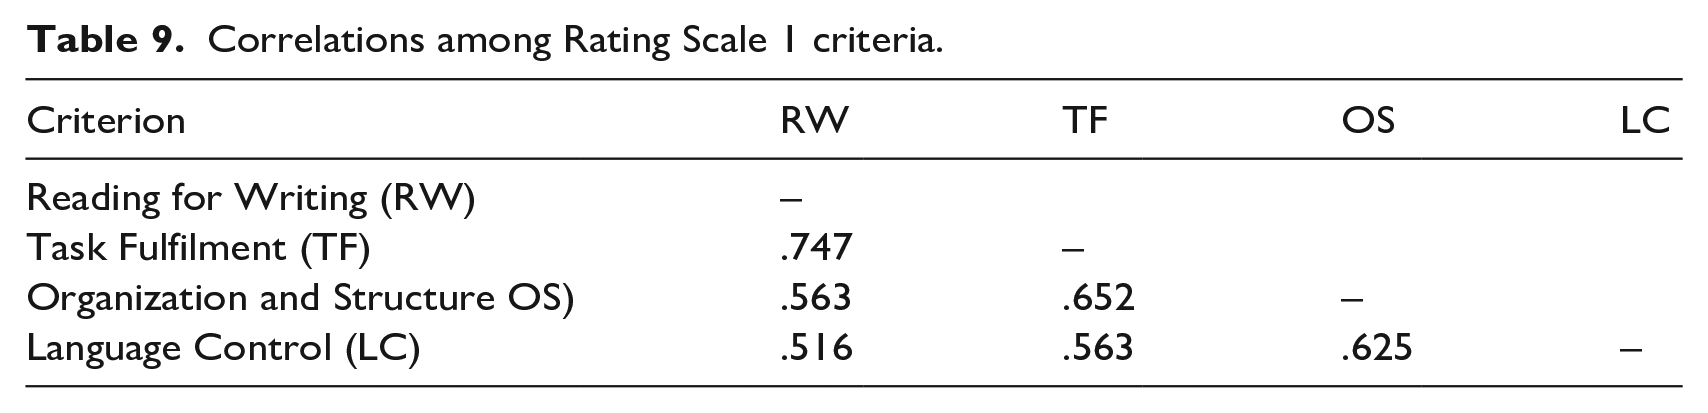
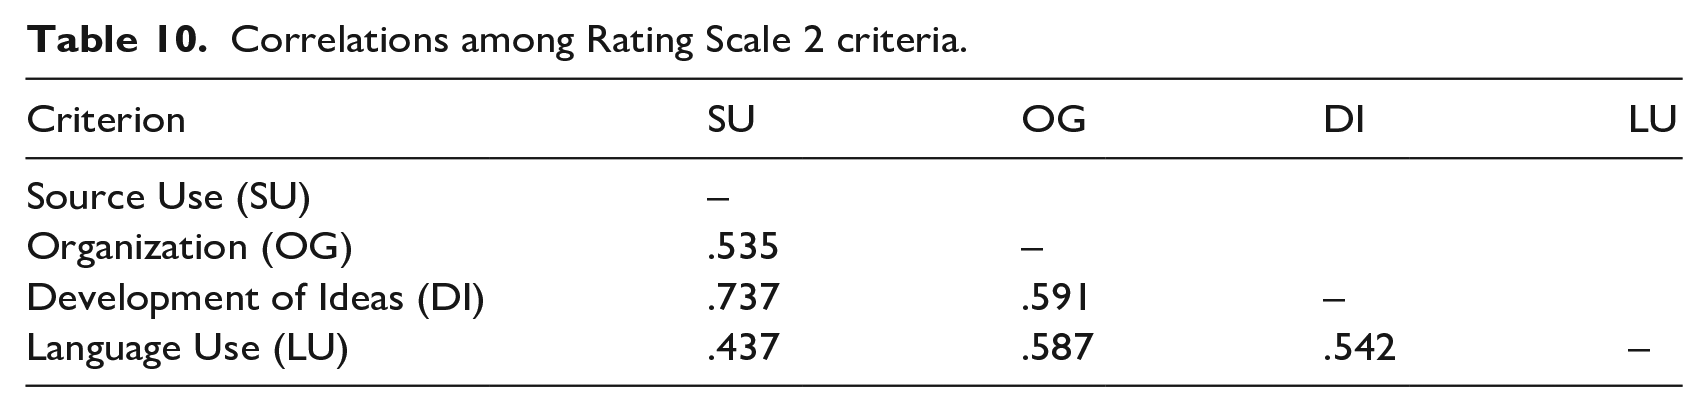
Correlation matrices are often used to examine the interrelationships among criteria within an analytic rating scale (e.g., Knoch et al., 2020; Xi & Mollaun, 2006). As shown in Tables 9 and 10, the four criteria within each rating scale are strongly intercorrelated, suggesting that they are related, but not overly strong to make any of the criteria redundant.
Correlations among Rating Scale 1 criteria.
Correlations among Rating Scale 2 criteria.
Principal axis factoring, a type of exploratory factor analysis, is also useful to examine the unidimensionality of analytic rating scales (Knoch et al., 2020). The correlation matrix determinant, Kaiser–Meyer–Olkin (KMO) measure of sample adequacy, and Bartlett’s test of sphericity result (.139, .780, and sig. at .000, respectively, for Rating Scale 1; .172, .757, and sig. at .000, respectively, for Rating Scale 2) indicate that the data were suitable for factor analysis. For both rating scales, only one factor was detected. For Rating Scale 1, the factor had an eigenvalue of 2.836, accounting for 70.991% of the total variance, and for Rating Scale 2, the factor had an eigen value of 2.720, accounting for 67.990% of the total variance. This provides further evidence that the four criteria within each rating scale investigated work harmoniously to measure one underlying construct, reading-into-writing.
The five different indicators addressing RQ3 are summarized in Table 11.
Summary of analysis for RQ3.
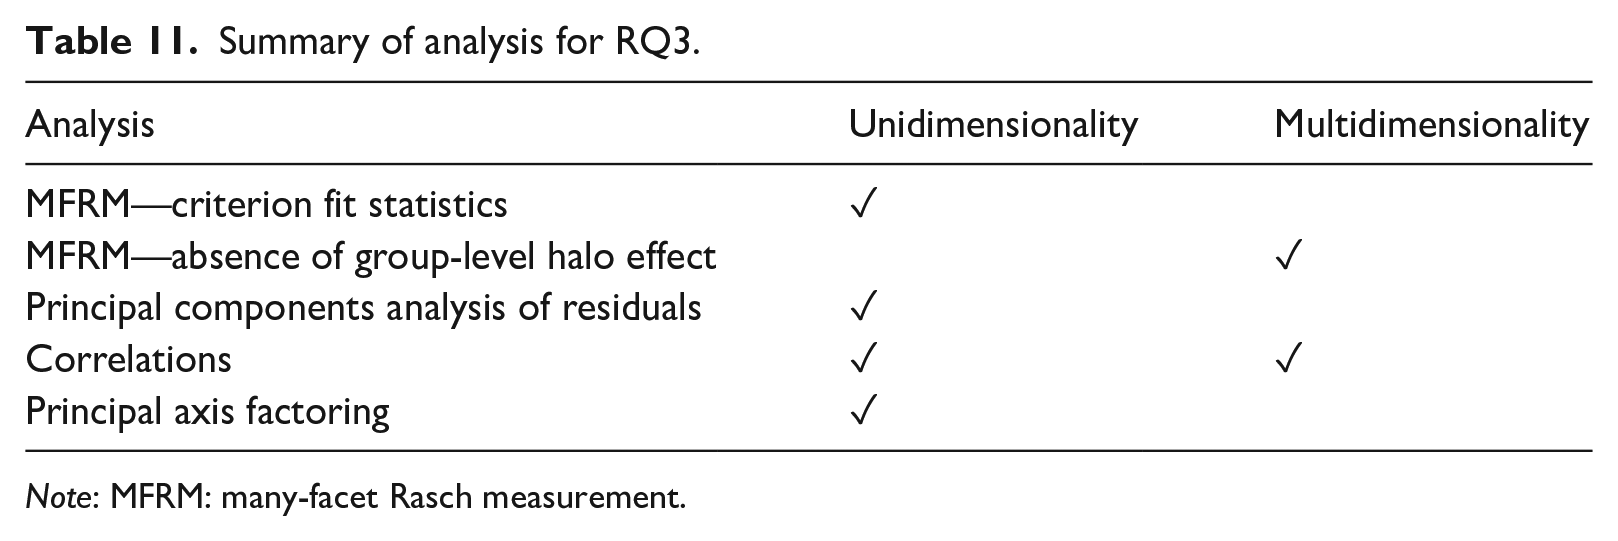
Note: MFRM: many-facet Rasch measurement.
RQ4. What are raters’ perceptions of the two analytic rating scales?
Descriptive statistics of raters’ responses on the 15 Likert-type post-rating questionnaire items are presented in Table 12. It is evident that both rating scales were generally well received by the raters, indicated by a grand mean of above 3.00 for both rating scales (M = 3.77 for Rating Scale 1; M = 3.59 for Rating Scale 2). For Rating Scale 1, the Language Control (M = 4.07) and Organization and Structure (M = 3.87) criteria received very positive responses, indicating that raters found these criteria to have clear descriptors, help them discriminate among examinee performance levels, and help them rate reliably and consistently. Although the Reading for Writing (M = 3.72) and Task Fulfilment (M = 3.52) criteria were deemed to have clear descriptors, they were perceived comparatively less helpful than the other two criteria in terms of facilitating raters to mark reliably and consistently. For Rating Scale 2, the Source Use (M = 3.82), Organization (M = 3.72), and Language Use (M = 3.85) criteria were perceived favourably by the raters. Development of Ideas, however, received a comparatively less favourable response (M = 3.18).
Raters’ responses to the perception Likert-style statements.
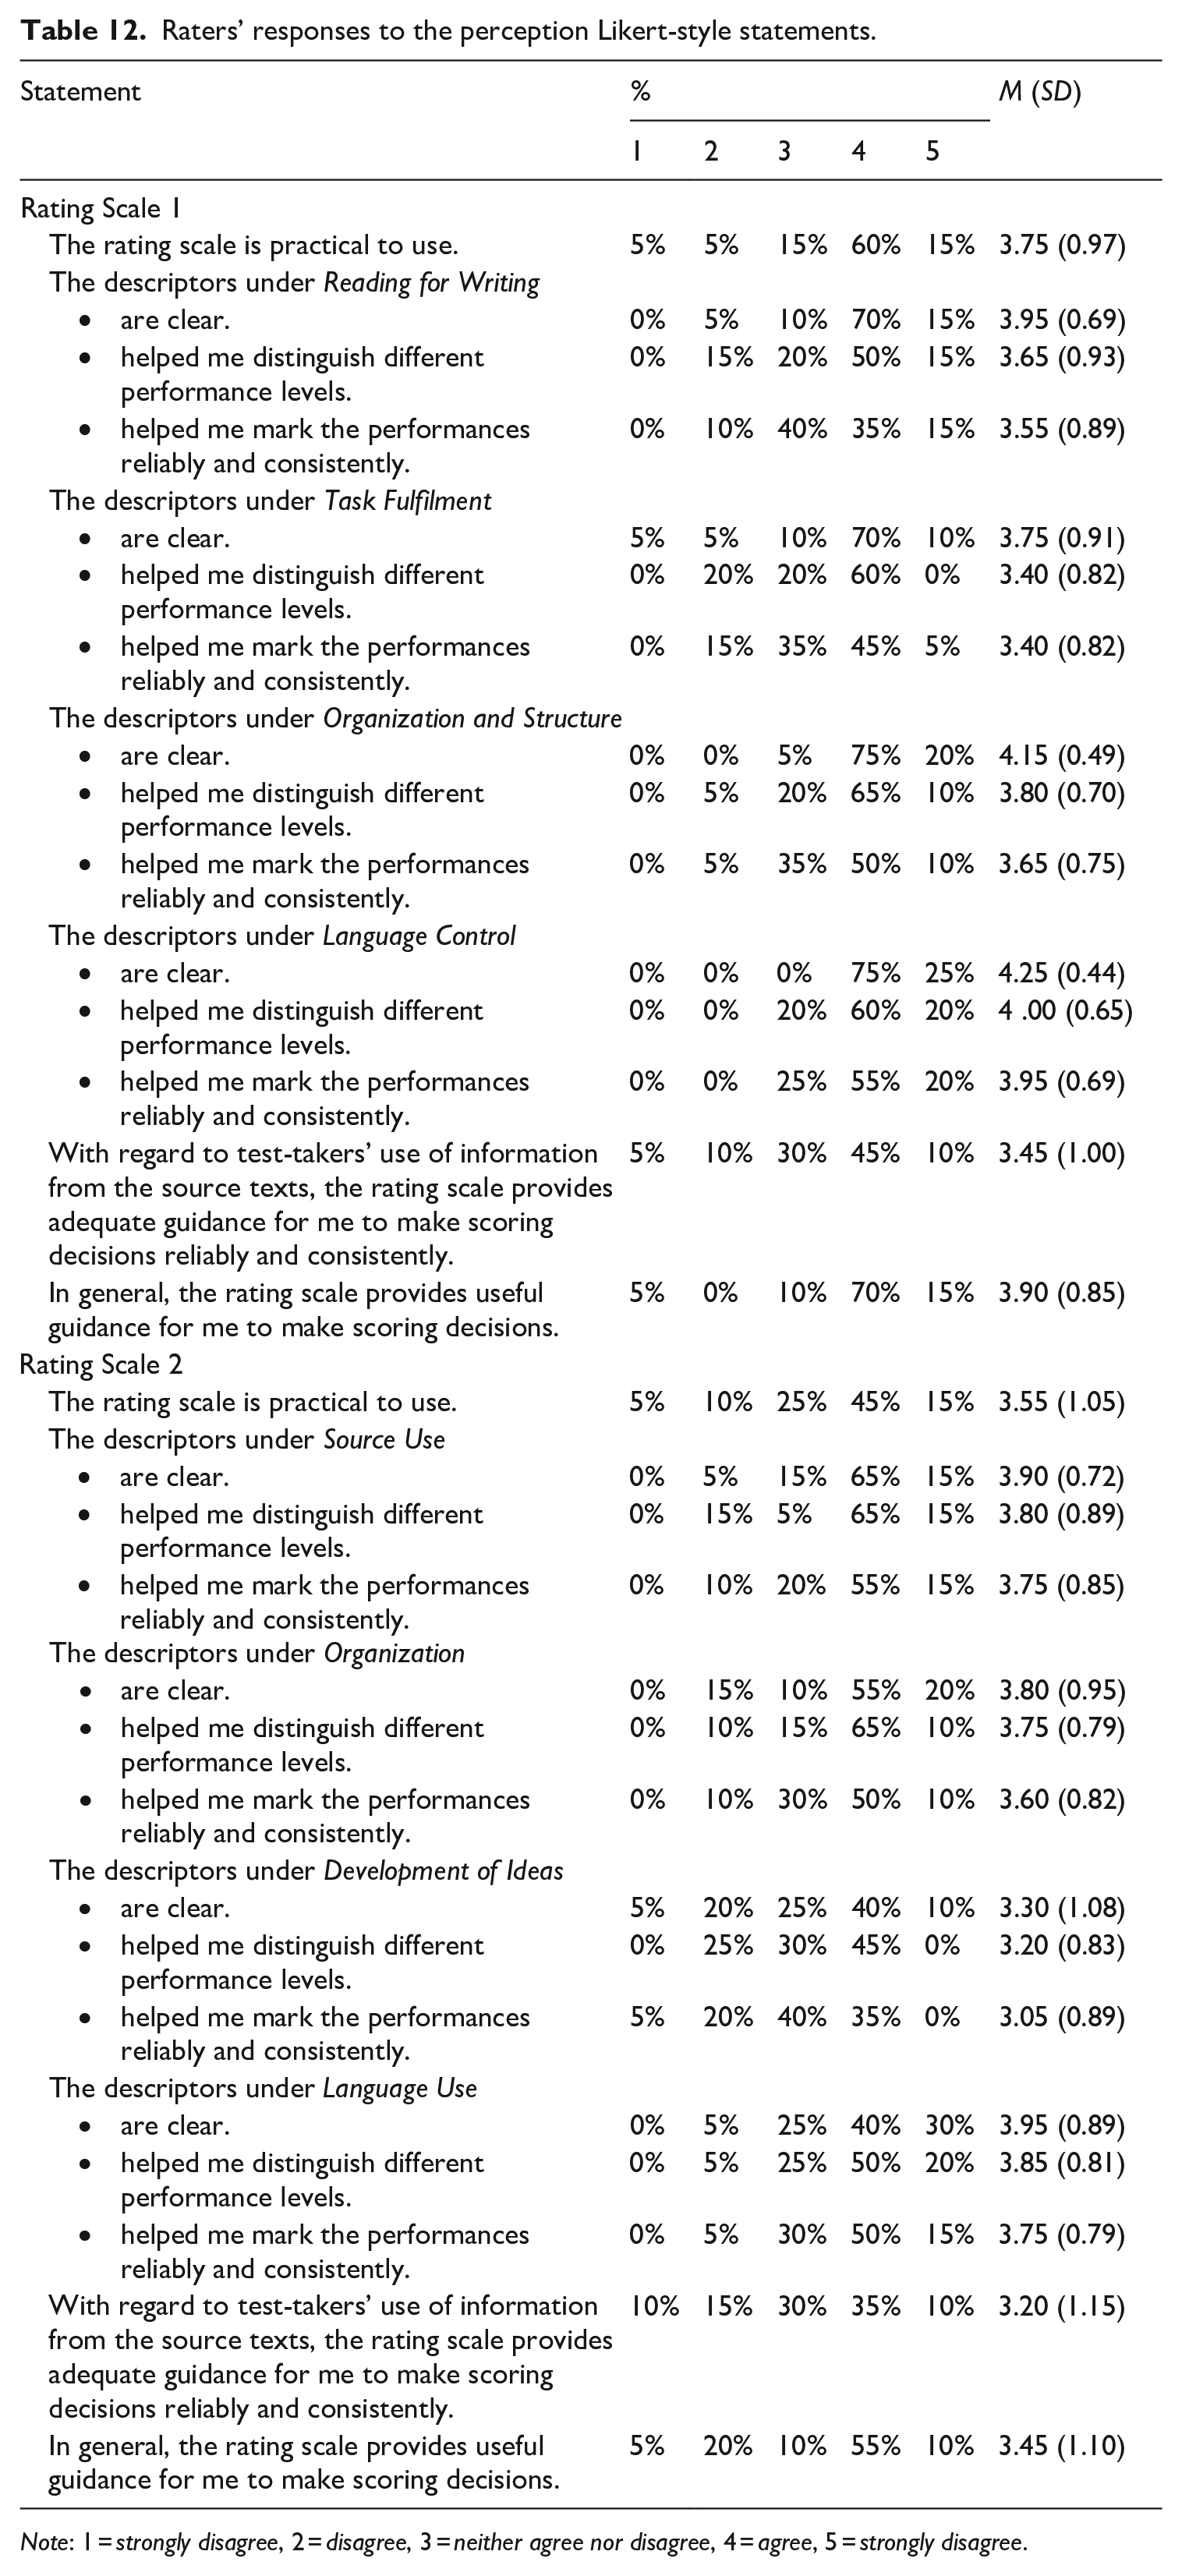
Note: 1 = strongly disagree, 2 = disagree, 3 = neither agree nor disagree, 4 = agree, 5 = strongly disagree.
In raters’ responses to the open-ended questions, two general themes were identified: (1) rating scale dimensionality and (2) facilitating and/or hindering features of the rating scale. Raters held mixed views on the dimensionality of both rating scales. While in general, raters reported that they were able to distinguish the individual criteria within each rating scale, they also reported perceiving overlaps between two or more criteria. On the distinguishability among the criteria in Rating Scale 1, one rater said, Yes, the criteria were adequately distinguishable. This was mainly due to the detailed descriptions/features provided under each criterion, which made the scale rather clear.
Similarly, commenting on the distinguishability of the criteria in Rating Scale 2, a rater remarked “Yes the criteria were clearly defined and each category was clear as to what area I was looking at when marking.”
However, for Rating Scale 1, 12 raters perceived overlaps between Reading for Writing and Task Fulfilment, and between Task Fulfilment and Organization and Structure. The former is illustrated in this comment: Mostly, though Reading for Writing and Task Fulfilment were a little more difficult to distinguish i.e. “adaptation of content to suit the purpose for writing” may also be related to achieving the overall communicative aim. I think separating these two is generally very challenging.
The impact of perceived overlaps on rating decisions appeared to vary. For instance, one rater felt that the perceived overlap between Reading for Writing and Task Fulfilment could result in score interdependence between the two: I thought that Reading for Writing and Task achievement were very closely linked, and a low score on one meant that the other must also have a low score.
However, that was not always the case, as illustrated by this quote: At times, “Task Fulfilment” and “Organisation and Structure” seemed to have a little overlap. I struggled to distinguish between them on a few occasions, but this didn’t cause me much hindrance.
Similarly, for Rating Scale 2, 14 raters reported perceiving overlaps mainly between Source Use and Development of Ideas, and sometimes also with Language Use, as these three criteria contain descriptors relating to use of source information. The quote below illustrates this perceived overlap and how the rater tried to define the distinction between the two criteria, while also acknowledging the challenge of this distinction.
There appears to be excessive overlap between the descriptors for source use and development of ideas. Perhaps the source use criteria could be interpreted as what points/how many points were mentioned from the source text and the development of ideas as how well these ideas supported the points made in the essay. However, this distinction would only work with high level candidates as candidates who hardly refer to the sources can not use ideas from the text which they have not mentioned to support points, making the criteria irrelevant.
Furthermore, two raters also stated that lack of source use could impact the evaluation of test-takers’ Language Use, as one rater commented: The language use was particularly difficult to mark if they had not really referred to the sources.
In terms of facilitating and/or hindering features, both rating scales received positive remarks on focusing raters to assess the reading and source use aspects, as illustrated in these quotes: As I said the reference to having points that show the reading for understanding has been completed [. . .] is “right on the money” as far as assessment is concerned. It serves as a tick list for the assessor. (Rating Scale 1) I found the constructs under “Source use” useful, particularly the requirement that source content should be integrated, accurately presented and effective (not just included). (Rating Scale 2)
The use of adjectives such as excellent, good, appropriate, and adequate in both rating scales’ descriptors drew mixed reviews. While these adjectives are open to interpretations and therefore make rating more subjective and less agreeable, as reported by the raters, they actually helped them remain consistent within themselves.
[The] grading within categories (excellent; good; acceptable; poor) helped me being consistent about rating. (Rating Scale 1) I think grading such as “adequate/ good/ some / few” in the criteria section help me to draw a clear line between performances. It was very helpful [. . .] (Rating Scale 2)
The length and density of descriptors were also valued differently by the raters. The rather lengthy descriptors in Rating Scale 1 were appreciated by 12 raters for providing clear guidance, yet viewed by six raters as at times overanalytical and impractical as increasing rating time. For example, one rater stated, It takes longer to familiarise [. . .] and internalize [. . .]. I repeatedly had to double-check descriptors during the rating process for accuracy and consistency [. . .]
Rating Scale 2 was praised by five raters for being brief, simple, and straightforward and therefore user-friendly and time-saving, while criticized by eight raters for lacking detail, which according to one rater, could potentially lead to “impression [marking].”
Discussion
The purpose of this study was to investigate the potential effects of two different ways of reading-into-writing construct operationalization in analytic rating scales on raters’ rating reliability and consistency. The results of both the statistical and qualitative analyses show that both ways of construct operationalization, as reflected in the two analytic rating scales used in this study, result in reliable and consistent ratings, including of reading-related and source use aspects. Participating raters also reported that both rating scales prompted them to mark reading and source use aspects. These findings echo earlier findings of studies on individual analytic rating scales (Chan et al., 2015; Ohta et al., 2018) and provide further support for the use of analytic rating scales to score reading-into-writing task performances.
The quantitative rating data analyses showed that both rating scales functioned optimally and that raters were generally consistent with themselves despite their varying severity levels. These findings were further supported by the questionnaire findings which indicated that raters were generally very positive towards either scale. The intra-rater consistency and variable severity/leniency levels could be partially explained by raters’ mixed views on the quantifiers and adjectives in each rating scale’s descriptors; while these features were useful to maintain intra-rater consistency, the raters felt that they could be interpreted differently, thereby potentially contributing to severity/leniency variability.
Closer examination of raters and rating criteria interactions/bias revealed that Rating Scale 2, particularly the Language Use criterion, prompted more interactions, with some raters exhibiting differential severity and leniency against this criterion. Compared to the Language Control criterion in Rating Scale 1, which only interacted statistically significantly with two raters, the Language Use criterion in Rating Scale 2 did so with eight raters. As noted by Wind and Engelhard (2013), statistically significant interactions between raters and rating scale criteria are indicative of raters having different interpretations of the difficulty level of certain criteria. A plausible explanation for this is the inclusion of source use aspects in the descriptors under the Language Use criterion in Rating Scale 2 (e.g., language errors may misrepresent the source ideas). Indeed, some raters indicated in the questionnaire that failure to integrate adequate source use information in test-takers’ writing could influence the evaluation of Language Use. While raters are clearly familiar with evaluating language aspects in written performances, they may not be accustomed to evaluating language aspects in relation to how they are used to represent ideas from source texts. Consequently, more raters were likely to have resorted to their own interpretation of part of the Language Use descriptors in Rating Scale 2, hence their differential leniency/severity against this criterion. Reference to source use might therefore best be avoided in descriptors of a criterion assessing language aspects in analytic rating scales for reading-into-writing.
Further examination of the individual criteria in each rating scale found that those criteria exclusively representing the reading-related and source use aspects (i.e., Reading for Writing in Rating Scale 1 and Source Use in Rating Scale 2) appeared to be the most difficult and to have a different scale structure compared to the other criteria in their respective scale. Possible reasons for the difficulty of reading-related aspects might be due to test-takers’ lack of or lower familiarity with the relatively new task type of integrated tasks (Chan et al., 2015) or their proficiency level being below the threshold for this task type (Cumming, 2014). However, these are less plausible in the case of ISE II test-takers, who have typically followed the associated curriculum and been entered for this specific test level. The different scale structure which the two reading-related criteria were found to have in this study suggest that raters interpreted the difficulty of these criteria differently from others in the rating scale. Potentially, raters lacked familiarity with rating scales containing a “novel” criterion on reading-related and source use aspects; however, no raters raised this issue in the questionnaire. While difficulty differences between analytic criteria are actually not uncommon (Wind, 2020), this warrants further investigation.
The Reading for Writing criterion was also found to be the least discriminating of all the criteria in Rating Scale 1, and the lowest score of 1 was the most frequently awarded score of all the four score categories for this criterion. One obvious reason seems test-takers’ low performance in this criterion. However, a closer look at the descriptors in score 2 might offer an alternative explanation. To score a 2 in Reading for Writing, a test-taker needs to demonstrate “full and accurate understanding of more than half of the source materials.” This requirement might have prompted raters to count the number of ideas that test-takers have fully and accurately included in their response, and failure to do so automatically resulted in a score of 1. Raters’ questionnaire responses also suggested that the descriptors under Reading for Writing, along with those under Task Fulfilment, were not as helpful as those under Organization and Structure and Language Control in terms of facilitating raters to distinguish between performance levels and to mark reliably and consistently. In Rating Scale 2, on the contrary, the Source Use criterion was found to be the most discriminating of all criteria, and this quantitative result was also in line with raters’ questionnaire responses that the Source Use descriptors were the clearest and most helpful.
Regarding rating scale dimensionality, two aspects were investigated in this study: (1) the extent to which the four criteria within each rating scale worked together to measure one underlying construct and (2) the extent to which the four criteria are distinct from one another to warrant their inclusion. It was evident that the first aspect of dimensionality was well supported by the results from MFRM criterion fit statistics, principal components analysis of residuals, correlations, and principal axis factoring. This further provides support for the common practice of reporting reading-into-writing scores generated from using analytic marking as a single composite score. The second aspect of dimensionality, the distinguishability of the criteria within an analytic rating scale, is also supported by the findings from the MFRM summary statistics and correlations. A few raters, however, perceived overlaps between criteria within a rating scale although these perceived overlaps did not necessarily translate into rating difficulty. Perceived overlaps, or fuzziness, are quite germane to analytic rating scales in general and have been previously investigated (e.g., Brown, 2006; Xi & Mollaun, 2006), and are not an issue specific to the two analytic rating scales in this study. Chan et al. (2015), in their study developing the rating scale used as Rating Scale 1 in this study, also found that some of their raters regarded Reading for Writing and Task Fulfilment as rather overlapping. This is understandable because the descriptor “achievement of the communicative aim” under the Task Fulfilment criterion can be argued to be an overarching goal that inherently takes into account all aspects of performance, including test-takers’ ability to use information from the reading texts in their writing, although the Task Fulfilment descriptors do not make direct reference to the use of reading material. As for Rating Scale 2, it was not very surprising that raters found the two criteria representing the reading-related construct (i.e., Source Use and Development of Ideas) often hard to distinguish, because the two make direct reference to how test-takers use information from the source texts.
Raters’ perceived overlaps should not invalidate the usability of analytic rating scales for reading-into-writing assessment; rather, this information is invaluable to inform rating scale development and/or revision, rater training, rater monitoring, and score reporting. Especially when test designers decide to operationalize the reading-related aspects into more than one criterion in an analytic rating scale, as in the case of Rating Scale 2, these criteria must be adequately distinguishable, and empirical evidence—both quantitative and qualitative—must be sought to support the decision. However, it is perhaps impossible to completely eliminate perceived overlaps among criteria within an analytic rating scale, as the different criteria are meant to work together to measure a unified construct (Knoch et al., 2020). What is important is to make raters aware that perceived overlaps should not lead to score interdependence and halo effects, and such issues should be clarified during rater training. Another relevant consideration is whether subscores will be reported individually or as a composite score. If individually, then separability is important; if summed, then they need to represent a single measurement dimension.
Conclusion
While analytic rating scales are frequently employed to evaluate integrated tasks, little is known about how specific operationalizations of the integrated language construct in such rating scales may affect rating quality, and by extension score inferences and uses. To the best of our knowledge, this study is the first to have empirically investigated the potential effect of two different ways of integrated-construct operationalization in analytic rating scales—in this case, in the context of testing reading-into-writing. The two approaches explored concerned scales in which reading and source use aspects of integrated task performances were exclusively captured in one or more distinct criteria versus scales where such aspects were (also) interwoven with other aspects of integrated task performance (e.g., linguistic resources, idea development) within criteria. By means of two scales exemplifying these two approaches and a group of raters’ ratings of reading-into-writing performances using each scale, it was found that either scale type generally functioned well and represented one underlying integrated construct. At the same time, it appeared that rating reading-related aspects of reading-into-writing performances remains more challenging for raters than judging writing-related aspects, regardless of the type of analytic rating scale. Also, while raters’ scoring data indicate that the individual criteria within either type of scale are distinguishable, raters do not always perceive this to be the case. The two types of scales differed, however, in the extent to which they led raters to uniform interpretations of performance difficulty levels. Specifically, the analytic scale which operationalized the reading and source use aspects in an exclusive manner (distinct from writing-related criteria; Rating Scale 1) resulted in more uniform difficulty level interpretations by raters. This type of scale might therefore be slightly more preferable than those combining multiple aspects within a criterion.
This study is not without limitations. Namely, performance ratings were conducted for one reading-into-writing task only; it remains to be explored how the two types of analytic rating scales function with other versions of the task and, importantly, with other types of reading-into-writing tasks (e.g., different input or output genres, different requirements to draw on the input). In addition, apart from differing in terms of the way the reading-related aspects of the task were operationalized, the two rating scales employed in this study contained some differences in the length of the descriptors in each scale; it is possible that this also contributed to raters’ use and perceptions of the two scales.
A meaningful avenue for follow-up research could specifically focus on the evaluation of the reading-related aspects of reading-into-writing performances, to shed more light on the differential difficulty and scale structure of this aspect, as identified in the present study. Such research might benefit from the use of verbal report methodology with raters (e.g., think-alouds or stimulated recalls) and/or eye-tracking technology to record raters’ eye movements on the scales and performances, in order to provide further insights into rater cognition and decision-making processes.
Footnotes
Acknowledgements
We would like to thank Trinity College London for giving us access to the reading-into-writing task and examinee scripts used in this study. We would also like to thank the participating raters.
Declaration of conflicting interests
The authors declared no potential conflicts of interest with respect to the research, authorship, and/or publication of this article.
Funding
The authors disclosed receipt of the following financial support for the research, authorship, and/ or publication of this article: The authors would like to acknowledge the funding assistance of the British Council and Duolingo, which enabled the first author to conduct part of the study under a British Council’s Assessment Research Award 2019 and a Duolingo English Test’s 2020 Doctoral Award. Any opinions, findings, conclusions, or recommendations expressed in this article are those of the authors and do not necessarily reflect the views of Trinity College London, the British Council or Duolingo.