
Abstract
The academic section of the Vocabulary Levels Test (VLT-Ac) and the Academic Vocabulary Test (AVT) both assess meaning-recognition knowledge of written receptive academic vocabulary, deemed central for engagement in academic activities. Depending on the purpose and context of the testing, either of the tests can be appropriate, but for research and pedagogical purposes, it is important to be able to compare scores achieved on the two tests between administrations and within similar contexts. Based on a sample of 385 upper secondary school students in university-preparatory programs (independent CEFR B2-level users of English), this study presents a comparison model by linking the VLT-Ac and the AVT using concurrent calibration procedures in Item Response Theory. The key outcome of the study is a score comparison table providing a means for approximate score comparisons. Additionally, the study showcases a viable and valid method of comparing vocabulary scores from an older test with those from a newer one.
Keywords
Introduction
The present study presents a means for comparing scores from two tests of academic vocabulary knowledge, the academic section of the Vocabulary Levels Test (Schmitt et al., 2001) and the recently published Academic Vocabulary Test (Pecorari et al., 2019). The study was originally prompted by research in Sweden with English-as-a-foreign-language (EFL) upper secondary school students enrolled in university-preparatory programs. Students in this context must develop a vocabulary that is appropriate for tertiary education, specifically to enable them to engage with a substantial amount of English reading at university (Malmström & Pecorari, 2022; Pecorari et al., 2011). To this end, we needed (i) to broadly measure students’ academic vocabulary knowledge and (ii) to make comparisons of academic vocabulary knowledge over time within and between similar pre-academic contexts.
There is wide agreement in the literature that student engagement in English language activities at university requires knowledge of frequent general vocabulary as well as words with a particular affinity to the academic and disciplinary context (e.g., Charles & Pecorari, 2015; Coxhead, 2016; Hyland & Tse, 2007; Vilkaitė-Lozdienė & Schmitt, 2019). Knowledge of academic vocabulary, that is, “vocabulary that occurs across a range of academic subject areas” (Coxhead, 2016, p. 177), has been identified as particularly important and an “indispensable component of academic reading abilities” (Gardner & Davies, 2014, p. 305). In certain academic or “pre-academic” contexts, and for various pedagogical purposes, it is important to be able to estimate students’ knowledge of academic words, using means of measurement that are appropriate to the context and to the purpose(s)).
In 2010, Lin and Morrison (2010, p. 257) asserted that “there is no one commonly accepted standard test of academic vocabulary.” While there is still no recognized “standard” test available, the Vocabulary Levels Test (VLT; Nation, 1983)—specifically the most recent version of it with its updated academic section (VLT-Ac; Schmitt et al., 2001)—has become widespread (despite some criticism brought against the test as a whole, e.g., Schmitt et al., 2020; Stoeckel et al., 2021; Webb et al., 2017). Using a matching format, the VLT-Ac tests knowledge at the meaning-recognition level of 30 words sampled from Coxhead’s Academic Word List (AWL; Coxhead, 2000) and is “designed to give an estimate of vocabulary size for second language (L2) learners of general or academic English [and] to inform decisions concerning whether an examinee is likely to have the lexical resources necessary to cope with certain language tasks, such as reading authentic materials” (Schmitt et al., 2001, pp. 55–56). On the face of it, therefore, the VLT-Ac is a suitable test to administer to upper-secondary students preparing for university. However, in our context of Nordic upper-secondary schooling, ceiling effects have recently been observed when the VLT-Ac was administered in testing (e.g., Edgarsson, 2018; Skjelde & Coxhead, 2020), calling into question the utility of the VLT-Ac for the purpose of capturing students’ academic vocabulary knowledge on its full scale and affecting its predictions about other related variables. Clearly, the VLT-Ac is problematic for measuring academic vocabulary knowledge in the context of independent EFL users with high exposure to English.
An alternative instrument to the VLT-Ac was recently published: the Academic Vocabulary Test (AVT; Pecorari et al., 2019). The AVT includes 57 items that measure knowledge of words sampled from the Academic Vocabulary List (AVL; Gardner & Davies, 2014), and can serve “as a tool for working pedagogically [with. . .and] highlight more things we need to learn and think about with respect to academic vocabulary” (Pecorari et al., 2019, p. 69). It uses the same meaning-recognition matching format as the VLT. No ceiling effects have been observed when the test has been administered to high-exposure-to-English Nordic EFL learners (e.g., Pecorari et al., 2019; Warnby, 2022), which suggests it could be a suitable test of receptive academic vocabulary knowledge in this context. However, no guidance for interpreting AVT scores or relating them to other variables was provided by the developers (Pecorari et al., 2019). It is, therefore, essential to place the AVT in the context of other more established tests, such as the VLT-Ac, to facilitate our understanding of the measurement property of the test.
Currently, however, no existing criteria support the comparison between AVT-scores and VLT-Ac scores on a group level. The main purpose of the present study is, therefore, to present a comparison model by linking the AVT and the VLT-Ac using concurrent calibration procedures in Item Response Theory (IRT) (Feuer et al., 1999; Kolen & Brennan, 2014).
The following research question guides the study:
This research opens up possibilities for scholars and teachers to use AVT scores or VLT-Ac scores—depending on the context and purpose—and make approximate comparisons, for example, within and between populations in similar contexts over time, in order to discern trends or patterns in written receptive academic vocabulary knowledge. Moreover, as new vocabulary tests are introduced and then used, the methods adopted in this study may be of value as an example of linking scores between old and new tests.
Background
This section starts by briefly setting the present study within the appropriate linguistic and educational context; this is done so that readers appreciate the need in this context to engage in the assessment of upper secondary school students’ academic vocabulary knowledge. Subsequently, academic vocabulary is operationalized and the two tests of academic vocabulary knowledge—the VLT-Ac and the AVT—are set against each other, and we problematize the kinds of knowledge claims that can be made when using such tests. Finally, a brief foundation is provided for the process used to compare scores on the AVT and the VLT-Ac, so-called “linking.”
Context of the study
Sweden, along with all the other Nordic countries, occupies a place among the top ten countries on EF’s global ranking of English proficiency (Education First, 2020). The ability to read and understand spoken English among the Swedish population is on average very high according to EF. Swedish adolescents, too, are recognized for their general English skills (Bonnet, 2004; European Commission, 2012). There are many possible explanations for this situation. The fact that Swedish and English are both Germanic languages is often referenced as is the prominent status of English in Swedish society and the increasingly vast amount of extramural English exposure that young Swedish people experience (National Agency for Education [NAE], 2012; Sundqvist, 2009; Swedish Media Council, 2019). Even if the Nordic countries are considered part of the expanding circle, where English is usually awarded a “foreign language” status, the omnipresence of English in Sweden, almost regardless of social setting, has led scholars to argue that English in Sweden holds an L2 (second language) position (e.g., Hyltenstam, 2004; Sundqvist, 2009).
English is also used to a high degree in Swedish higher education. Figures from a recent report (Malmström & Pecorari, 2022) indicated that, at an advanced level of study, 64% of all programs use English as the medium of instruction. While English is adopted as a teaching language to a lesser degree at the undergraduate level, as much as 50% to 80% of the obligatory reading that students do in Swedish-medium courses at the undergraduate level constitutes reading in English (interestingly, in 25% of the Swedish-medium university courses all the required reading is in English).
English has a formal presence also at lower levels of education in an evolving educational landscape (a new national curriculum and grading system was implemented in 2011, with direct implications for how English is taught in schools). When students in Sweden complete their upper secondary education, the majority of students have taken English courses for 10 years. According to the National Agency for Education (NAE, 2022), two thirds of the upper secondary school student population are enrolled in one of the university-preparatory study programs (Arts, Economy, Humanities, Natural sciences, Social sciences, or Technology). Most of these students complete their upper secondary education with a passing grade from the last compulsory English course considered equivalent to a B2-level in the Common European Framework of Reference (CEFR) (Council of Europe, 2022; NAE, 2021). With a B2 level, they can be seen as “independent” users of English who meet the English basic requirement for university education eligibility not only in Sweden but also in many other countries.
Despite such expectations regarding the independent use of English among upper secondary school graduates, concerns have been raised that Swedish students are ill-prepared for university study. Specifically in view of the significant amount of reading in English expected by Swedish students the moment they start university, their ability to engage with English reading has been called into question (Pecorari et al., 2011). The causes of the English reading difficulties experienced by Swedish students have not been subject to much research, but it is unlikely to be due to a lack of general English vocabulary; adolescents in Sweden do well when tested on their general English vocabulary knowledge at the high-frequency level (2000 frequency band) (e.g., Gyllstad, 2007; Lemmouh & Snoder, 2019; Sundqvist, 2009).
It is possible, therefore, that part of the English reading challenge can be explained by students having lexical gaps beyond high-frequency vocabulary, for example, in terms of their English academic or disciplinary vocabulary (e.g., Coxhead, 2016). For this reason, it is worthwhile testing such vocabulary knowledge among upper secondary school students, not least to enable possible preventive pedagogical measures to be taken by upper secondary schools before students enroll at the tertiary level. Students studying in one of the university-preparatory programs have typically not decided on an academic discipline (the programs offer broad eligibility to university education and students can choose whatever discipline they want, regardless of the upper secondary school program). Consequently, it makes sense to test their written receptive academic vocabulary knowledge rather than their disciplinary vocabulary knowledge.
Operationalizing academic vocabulary
The academic vocabulary of the kind we want to assess in the Swedish upper secondary education context is usually operationalized with reference to lists of words identified as “academic” (see Therova, 2020, for an overview of such lists and the identifying principles, and pitfalls, when creating the lists). To date, two such lists of academic words have received particularly widespread attention: Coxhead’s (2000) AWL and Gardner and Davies’ (2014) AVL. The criteria adopted for creating the more recent AVL—frequency, ratio; range; dispersion; discipline—recall the fundamental principles used in the design of the AWL, although there are differences in how the criteria were applied (see Gardner & Davies, 2014, for details).
The AVL differs from the AWL in three main respects. First, the words for the AVL were drawn from a significantly larger corpus. Second, as a result of the extraction criteria, the AVL has a larger frequency level range than the AWL. For example, Coxhead (2000) excluded all high-frequency words that also occurred among the 2000 most common words in the General Service List (GSL; West, 1953), whereas Gardner and Davies (2014) did not use such a stop criterion. Instead, they allowed high-frequency words to be included, provided they were significantly more frequent in an academic corpus than in a nonacademic corpus. The AWL and the AVL have a substantial and comparable share of words in the 3000- to 9000-frequency range; depending on where one sets the limit for high-frequency words, this category of words may be labeled “mid-frequency” (Nation, 2013; Schmitt & Schmitt, 2014). Moreover, the AVL, in relation to the AWL, contains more words that could be placed in the lower frequency bands (see Appendix 1). Thus, it can be argued that both the AWL and the AVL present academic core words that are also found in general English at high-, mid-, and low-frequency levels (this does not change the fact that they are more frequent in academic texts compared to non-academic texts). Third, while Coxhead used the more inclusive conception of a word family (base form of the word plus inflected and derived forms) as a basis for the AWL, Gardner and Davies designed the AVL based on word lemmas (base form of the word plus inflected forms of the same part of speech). In the context of vocabulary testing, several scholars question the appropriateness of word families as a word counting unit and, instead, advocate the use of /f/lemmas (e.g., Brown et al., 2020; McLean, 2018; Schmitt, 2010) since it gives a “clearer idea of what a correct answer on an item does and does not mean” (Kremmel, 2016, p. 979). The lemmatized AVL could be considered a list of flemmas, that is, identical forms of different parts of speech, for example, the AVL noun lemma project, also a verb lemma, could better be grouped as a flemma. Such arguments point toward a change of measurement instruments from word-family-based tests to lemma-based tests. However, these much-debated issues are beyond the scope of the current study which aims to calibrate scores on the AVT and the VLT-Ac. Despite these differences, it can be argued that both the AWL and the AVL largely represent a vocabulary common across academic disciplines (words from both lists occur frequently in academic texts, Coxhead, 2000; Gardner & Davies, 2014) and can, thus, be regarded as constituting one domain—written English academic vocabulary.
Testing written receptive meaning-recognition English academic vocabulary
The complexity involved in “knowing” a word (and therefore in delineating the domain “vocabulary knowledge”) is widely acknowledged. The present study makes use of two existing tests—the VLT-Ac and the AVT—targeting knowledge of one main domain, written receptive English academic lexis at the level of meaning-recognition. This means that the kind of academic word knowledge tested involves a connection of form and meaning (“What meaning does this word form signal?”) and associations of words (“What other words does this make us think of?”) (Nation, 2019, p. 16).
The VLT—first developed by Nation (1983)—may well be the most utilized measure of English second/foreign language learners’ written receptive meaning-recognition vocabulary knowledge (Read, 2000; Schmitt et al., 2020). The VLT contains four frequency-based general vocabulary sections and one academic section. In 2001, the original VLT was revised, updated, and validated by Schmitt et al. (2001; refer to their paper for details). The academic section of the revised VLT (VLT-Ac) made use of the, then, recently presented AWL (Coxhead, 2000). The VLT-Ac targets 30 words from the AWL grouped in 10 clusters. The test taker is asked to match a definition with a single-word unit from a list of six alternatives (each including three target words and three distractors). 1 While the VLT is “still a well-used standard vocabulary measurement, the authors have not revised it since it was launched over 17 years ago,” confirming that “most tests, once launched, are not revised in any systematic way” (Schmitt et al., 2020, p. 110, but see Webb et al., 2017 for an “updated” VLT, but notably a levels test without an academic section).
Two recent studies in our context of Nordic upper secondary education have used the VLT-Ac: Edgarsson (2018) and Skjelde and Coxhead (2020). Both studies observed ceiling effects in the VLT-Ac scores. In his Icelandic sample, Edgarsson (2018) correlated the VLT-Ac scores with scores on an academic reading task, and the ceiling effects meant that information was lost in the correlation at the higher level of VLT-Ac. Similar problems were experienced by Skjelde and Coxhead (2020) who used Norwegian upper secondary students’ English grades and their negatively skewed VLT-Ac scores in correlational and regression analyses. Testing relatively similar participants, Busby (2020) correlated Norwegian (undergraduate 1st year) students’ VLT-Ac scores with extramural English factors, but did not find any significant relationship and, due to ceiling effects in the VLT-Ac scores, concluded that the effect would possibly have been seen “with a test based on the Academic Vocabulary List (Gardner & Davies, 2014) which uses lemmas instead of word families, and provides greater coverage of academic texts” (Busby, 2020, p. 76). There is ample evidence, thus, that using the VLT-Ac in this Nordic context of later upper secondary/early university education is problematic.
The AVT (Pecorari et al., 2019) tests knowledge of academic words sampled from the AVL (Gardner & Davies, 2014) and the test design and validation recall the principles and procedures used by Schmitt et al. (2001) (see Pecorari et al., 2019 for details). The resulting matching test format is virtually the same as that used in the VLT-Ac. A test taker’s knowledge of 57 target words—at the level of meaning-recognition—is tested across 19 clusters. 2 In their validation of the AVT, Pecorari et al. (2019) did not provide any means of interpreting a test score or relating it to other measures. In that respect, the AVT suffers from the same shortcomings as many other tests with few indications of how to use the scores (Schmitt et al., 2020). In our Swedish context, AVT scores have been normally distributed among university students (Pecorari et al., 2019) and upper secondary school students (Warnby, 2022). Furthermore, as opposed to Busby (2020), the participants’ scores in Warnby (2022) correlated positively and significantly with, for example, extramural English factors. This suggests that the AVT may be a more appropriate instrument in this context.
Scores from written receptive meaning-recognition tests—such as the VLT-Ac and the AVT—are often considered to bear on reading ability and, therefore, often correlated with reading scores (e.g., Edgarsson, 2018; Laufer & Aviad–Levitzky, 2017; Shaw & McMillion, 2011). However, the meaning-recognition format suffers from two important factors affecting its similarity to reading. First, the matching format in meaning-recognition tests like the VLT-Ac and the AVT may suffer from local item dependence (e.g., Ha, 2021; Kamimoto, 2014) and is prone to guessing or construct-irrelevant test strategies that may lead to an overestimation of word knowledge for reading (e.g., Gyllstad et al., 2015; Kamimoto, 2008; Stewart & White, 2011). Second, despite the significant predictability meaning-recognition has for reading ability, its construct validity has been debated lately in comparison to meaning-recall formats (Laufer & Aviad–Levitzky, 2017; McLean, 2021) mainly for two reasons. First, empirical evidence from English L2 research indicates that meaning-recall is better at predicting reading comprehension than meaning-recognition (McLean et al., 2020; Stewart et al., 2021; Zhang & Zhang, 2020). Second, meaning-recall formats may be more similar to real-life reading demands since the meaning of words has to be evoked quickly in the mental lexicon of the test taker/reader during fluent reading, compared to meaning-recognition formats that demand a lower level of word knowledge indicating partial knowledge of the words tested (e.g., Aviad-Levitzky et al., 2019; Kremmel & Schmitt, 2016; McLean et al., 2020; Nation & Webb, 2011; Stoeckel et al., 2021). Since a test answer may be attributable to partial lexical knowledge of the tested words (Nagy et al., 1985), distractors in a meaning-recognition test should be written to provide possibilities for learners to gain credit for partial knowledge (Nation, 2012). In their revision of the VLT, Schmitt et al. (2001) adopted the principle of partial lexical knowledge, which means that the alternative words for each cluster were chosen so that their meaning differed clearly. The argument was that learners with even a minimal understanding of a word’s meaning should be able to choose the correct word. This partial knowledge argument is in line with principles in the development of the AVT: “Two words in a cluster having similar meaning could lead to ambiguity. It was therefore necessary to keep words with closely related meaning or similar definitions [. . .] from occurring in the same cluster” (Pecorari et al., 2019, p. 62).
Taken together, the two test designs (the VLT-Ac and the AVT) share several similarities: the matching format is the same, the target words constitute single-word units, the vocabulary knowledge tested is at the level of meaning-recognition (showing partial lexical knowledge), and the underlying domain is in both cases written receptive academic vocabulary. Out of the 57 target words in the AVT (Version 2), 24 words can be found in the AWL word families, and, conversely, 22 of the 30 VLT-Ac (Form 1) target words are also found among the AVL /f/lemmas. The two tests are designed to be representative of the vocabulary lists underlying each test and reflect the frequency distribution within the lists. Critically, this paper argues that the two tests have the same framework, that is, the domain assessed is in both cases written receptive English academic vocabulary at the level of meaning-recognition, even if this vocabulary domain is operationalized in slightly different ways due to the two different underlying lists of academic vocabulary. Hence, a linking procedure ought to be both meaningful and possible in order to compare the estimated scores based on each of the two tests. The current study proposes a comparison model and demonstrates how this can be done using responses on the VLT-Ac and the AVT.
Linking the tests with IRT
This study aims at comparing the estimated scores by linking the AVT and the VLT-Ac as two tests of written receptive meaning-recognition English academic vocabulary knowledge. Different tests can be used to measure the same underlying domain when the framework definition (a description of the skills/areas) is shared, and the test specifications (a description of item formats, number of items, scoring rules, etc.) are similar or different (Feuer et al., 1999). A linking procedure places the parameter estimates from different tests onto a common scale and “the most direct method for establishing and evaluating a linkage is the single-group design, in which two tests are administered to a common set of examinees” (Feuer et al., 1999, p. 45). When two tests measure the same individuals on the same content domain but are built on different test specifications, for example, different test lengths with unique test items, the common person test equating (e.g., Boone & Staver, 2020) or test calibration (e.g., Feuer et al., 1999; Kolen & Brennan, 2014) can be applied to link the test scores for comparability. To link the VLT-Ac and the AVT scores, the current study relies on a concurrent calibration procedure (e.g., Hanson & Béguin, 2002) within an IRT framework using a single-group design.
Method
Data collection
To link the VLT-Ac and the AVT, this study adopted a single-group counterbalance design (Kolen & Brennan, 2014). The participants (Mage = 18.09, SDage = .31) were 385 Swedish upper secondary EFL learners. They had just completed the final English subject course necessary for university admittance with a passing grade equivalent to CEFR-B2. The participants were enrolled in six nationally regulated study programs (Arts, Economy, Humanities, Natural sciences, Social sciences, and Technology) preparing them for university studies. All participants were administered a single booklet with the 57-item AVT (Form 2) and the 30-item VLT-Ac (Version 1). To control for possible test order effects, half the sample received Booklet A with the AVT items followed by the VLT-Ac items, and the other half received Booklet B where the order was reversed. 3
Scoring
Binary scoring was applied for each item in both tests. All examinees were encouraged to guess the answer provided they had the slightest intuition of the word meaning; blind guessing was discouraged. A lenient scoring approach giving credit for partial knowledge was adopted; two items on the AVT, identified as outliers in the initial exploratory IRT analyses, were examined lexically and were rescored using a lenient as opposed to a severe scoring approach (cf., Pecorari et al., 2019) since alternative words were judged to indicate partial knowledge. 4
Data analyses
A series of analyses were conducted to check the viability of linking the two tests. First, initial CTT results of the two tests (57-set and 30-set) including test reliability, total score, standard deviation, percentile classification, distribution, and correlation were estimated and compared using IBM SPSS 27. Second, IRT analyses of the 57-, the 30-, and a combined 87- set were performed in R studio (RStudio Team, 2020) using the mirt package (Chalmers, 2012).
There are many different IRT models. For example, a one-parameter logistic (1PL) model/Rasch model (see, for example, Aryadoust et al., 2021; Baker, 2001; Wilson, 2004, for treating Rasch as 1PL), where the item discrimination parameter (a) is constant, estimates the item difficulty (b) which is located on the latent person ability scale (theta). Adding the item discrimination as a second parameter, the two-parameter (2PL) model estimates both a and b. In a three-parameter model (3PL), a third added parameter attempts to account for guessing (Hambleton et al., 1991). IRT models with a varying number of parameters have different levels of complexity. In general, the more complex the model, the larger the sample is needed to ensure the precision of the parameter estimates. Different requirements for the number of test takers and test items have been suggested. The range of used sample sizes varies considerably for the 1PL model (Aryadoust et al., 2021), and a minimum sample size of at least 300 in 1PL has been recommended (e.g., Guyer & Thompson, 2011). For 2PL, recommendations differ, for example, 250 participants with 25 items (Harwell & Janosky, 1991) or with 30 items (Şahin, & Anıl, 2017), 300 with 75 items (Yoes, 1995). For a 3PL model, a sample of at least 1,000 participants would offer adequate estimates (Lord, 1968) also with respect to the number of items (e.g., Stoeckel et al., 2021). Two 1PL models (Rasch and a = 1.7), a 2PL model and a 3PL model, were tested with the current data in the exploratory phase. The exploratory analyses revealed that the 2PL model was the best-fitting model and was, therefore, chosen for the main analysis.
In the main analysis, the estimated item and person parameters in the three different item sets (VLT-Ac, AVT, and VLT-Ac & AVT combined) were compared to check for stability. The Test Characteristic Curves (TCC), the Test Information Functions (TIF), and the reliability curves were examined. Furthermore, two important assumptions about the data, that is, unidimensionality and local independence (LI), were assessed and verified (see, for example, Aryadoust et al., 2021; Hambleton et al., 1991).
One threat to test validity is that the items within a test battery measure several different abilities. It is, therefore, essential to test whether the assumption of unidimensionality holds, that is, if the data display one dominant factor influencing the test performance (Hambleton et al., 1991). This can be examined through, for example, exploratory factor analysis (EFA). If the first factor in EFA is distinctively larger in eigenvalue, then one can assume unidimensionality in the test (Wiberg, 2004). A principal component analysis (PCA) was used to extract the underlying factors of the test items (Aryadoust et al., 2021). Correlations, EFA, and reliability analysis were conducted in the current study to help to decide whether the data can be judged unidimensional.
Another threat to test validity is the interdependency of the responses among items in a test battery. The LI assumption of the test items can be examined with residual correlations among test items. A correlation (labeled Q3) above .3 warrants further consideration on whether the LI assumption holds (Aryadoust et al., 2021). Another way to assess LI is to examine whether the words in the booklets are lexically common. For example, if one item assesses knowledge of the word “procedure” and another item assesses the same root, for example, “proceed,” the LI assumption is not met. However, since the matching test format in the tests can be contested regarding item interdependence for reasons of, for example, item exclusion strategy, the LI assumption of conducting IRT is violated and should be considered a limitation (Ha, 2021; Kamimoto, 2014; Stewart, 2012).
The final part of the main analysis adopted a concurrent calibration procedure. From the combined 87 set of item estimates placed on the mutual ability scale, the 57 AVT items and the 30 VLT-Ac items were extracted, and their respective TCCs were plotted in the same graph. This provided a means to identify the latent ability level (Θ) estimated for a VLT-Ac score that corresponds to an expected AVT score at the same ability level, and vice versa. Additional TCCs of the two tests were plotted with the 95% confidence intervals from the bootstrapped parameter estimates to check the robustness of the results.
Thereafter, a score comparison table was made with VLT-Ac scores in the left column and linked AVT scores in the right column. Since the estimation of person thetas has a standard error and the expected true score estimated with IRT will provide intervals between and across integer scores, a decision was made to include ranges of scores at certain levels.
Results
CTT results
Descriptive statistics of the scores on both tests are presented in Table 1. The standardized mean score (percentage correct) differs largely between the two tests. The average percentage correct for the VLT-Ac is higher than for the AVT (MVLT-Ac = .83 and MAVT = .53), indicating that the VLT-Ac is generally easier in this test taker context. However, the standard deviation for the percentage correct is similar in both tests. The AVT-scores are normally distributed, whereas the VLT-Ac-sores are negatively skewed. No statistically significant differences were found between scores from the two booklets, VLT-Ac, t(383) = .61, p = .54; AVT, t(383) = .85, p = .40.
Descriptive statistics of test scores on the VLT-Ac and the AVT, N = 385.
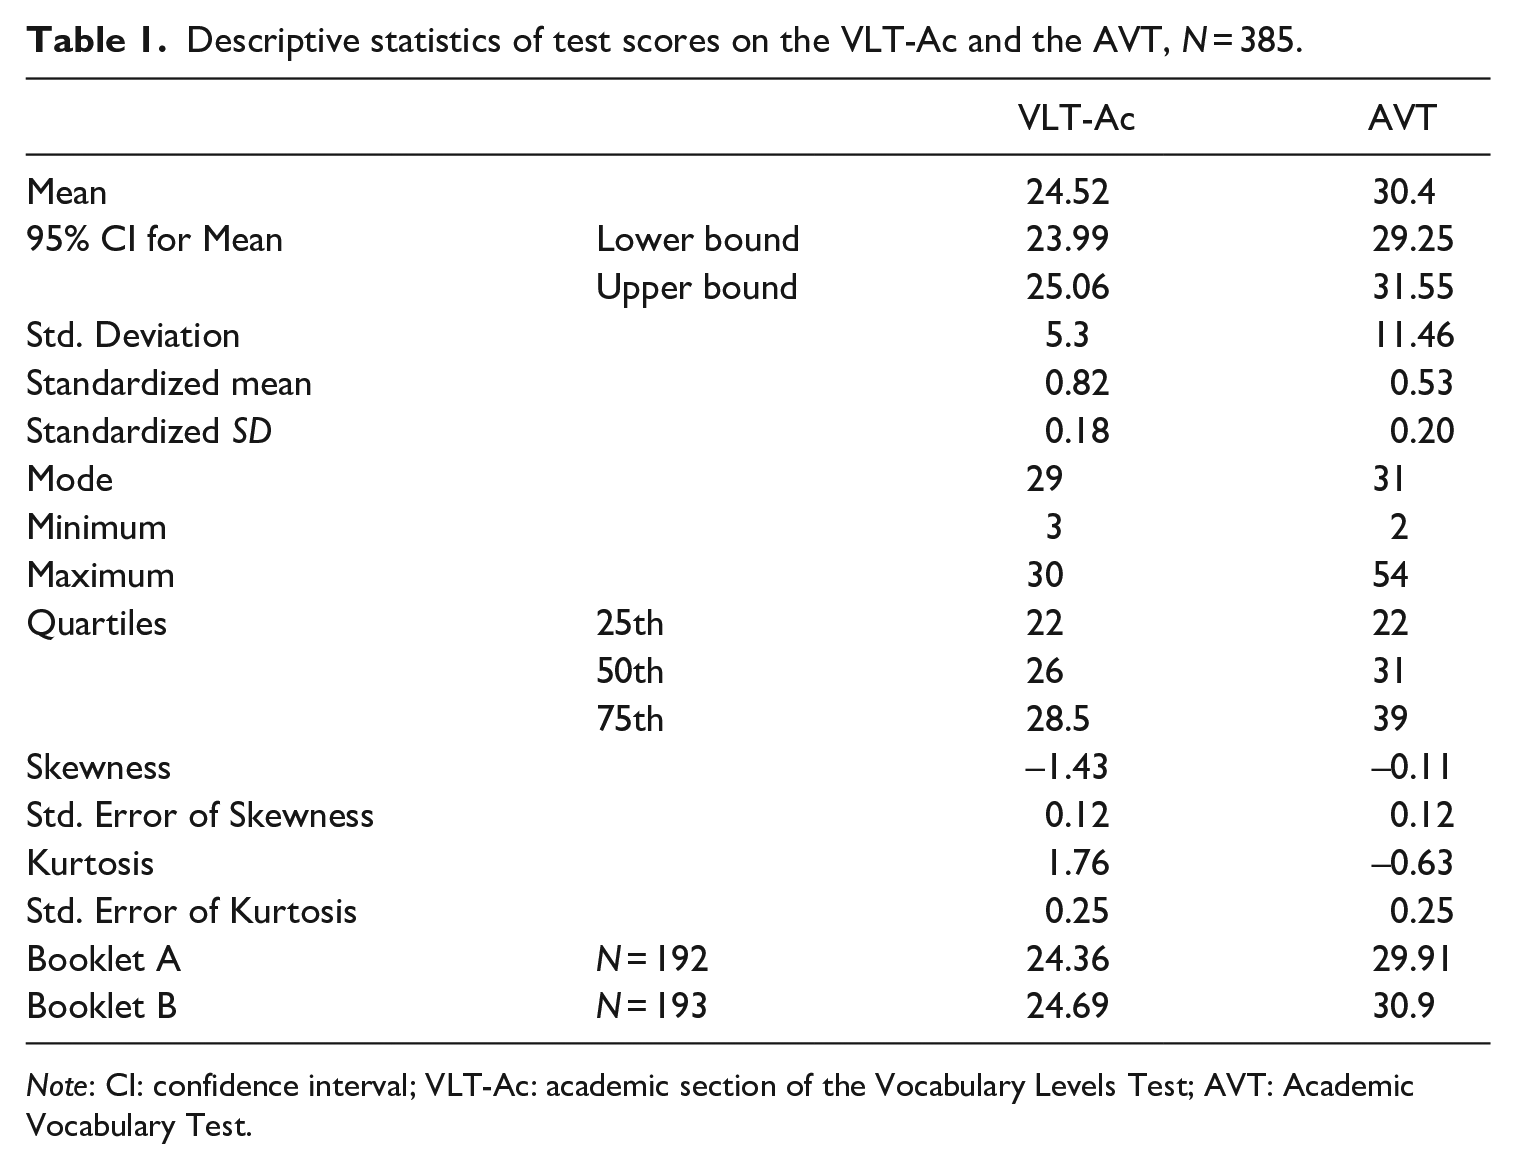
Note: CI: confidence interval; VLT-Ac: academic section of the Vocabulary Levels Test; AVT: Academic Vocabulary Test.
Reliability analyses for all three sets (87-set = the VLT-Ac plus the AVT; 57-set = the AVT; 30-set = the VLT-Ac) displayed high Cronbach’s alphas (87-set a = .95; 57-set a = .93; 30-set a = .89). Moreover, the correlation between observed AVT and VLT-Ac test scores was strong (r = .80, p < .001; ρ = .84, p < .001). It should be noted that measurement errors in the observed test scores may attenuate the correlation coefficient. Thus, the tested latent trait by the two tests may correlate even higher.
Checking unidimensionality
A PCA was conducted on the normally distributed data in the combined 87 set. As displayed in the scree plot (Figure 1) one major factor explains most of the variance. The eigenvalue of the main factor (F1 = 17.95) was five times larger than the eigenvalue of the second factor (F2 = 3.72). Bartlett’s test of sphericity was significant (p < .001), and the Kaiser–Meyer–Olkin measure (KMO; Kaiser & Rice, 1974) showed excellent sampling adequacy (KMO = .90). The average loading from each factor is .44 (SD = .12) (Appendix 3).
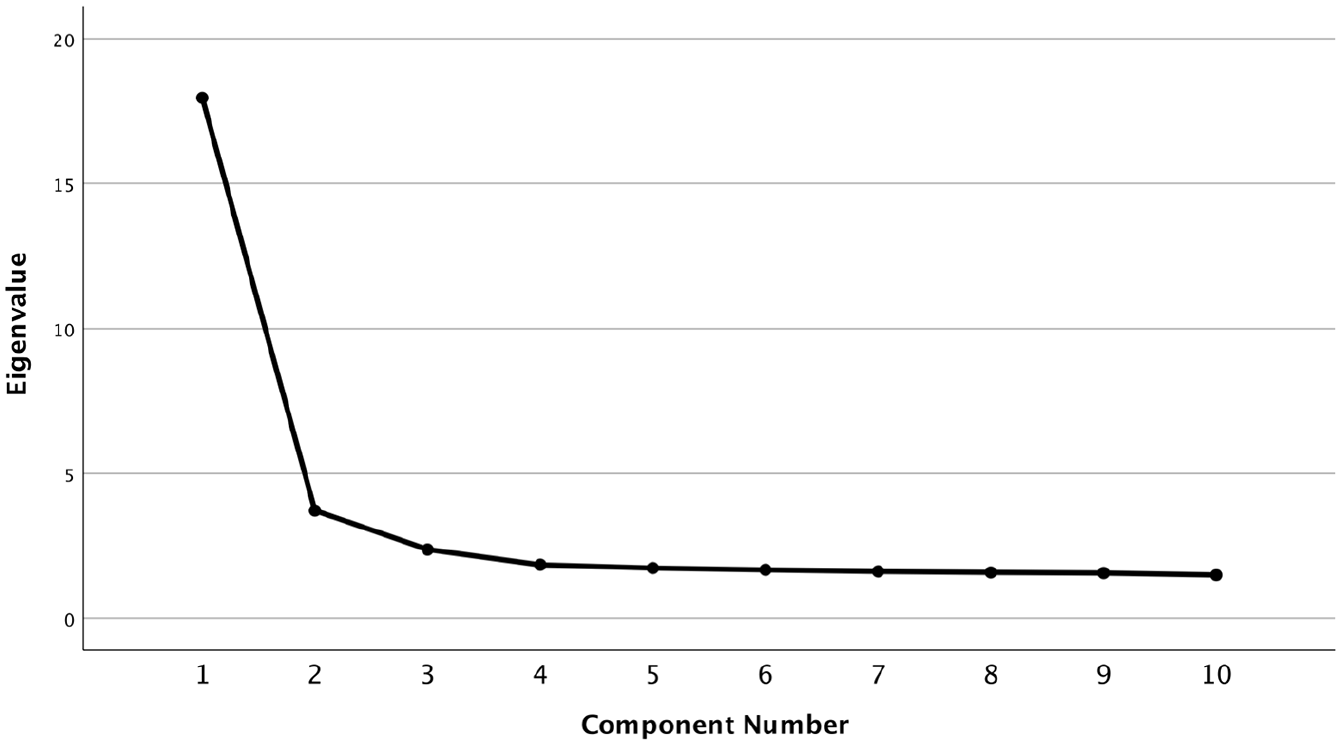
Scree plot showing one major factor.
The inferences made from the reliability analysis, the correlation of observed scores and the factor analyses support the unidimensionality argument, that is, that both tests measure one main domain, namely written receptive English academic vocabulary knowledge at the level of meaning-recognition. Therefore, the items from the two tests can be merged into one 87-item bank in further IRT analyses.
Checking local independence
The correlation of item residuals was performed to check LI in the 87 set. Out of a total of 3741 correlated pairs, only three Q3 coefficients yielded a value above .3. The three correlated item pairs (Q3 > .3) were investigated qualitatively in the booklet and no lexical affinity between the targeted words could be claimed, divergence—omission (Q3 = .48); exigence—proclivity (Q3 = .64); vexing—parsimonious (Q3 = .37). All target words taken together, no common items exist. Notwithstanding the limitation of the matching format, the assumption of local independence was deemed met.
Comparisons of 2PL estimates in the different item sets
To ensure the stability of estimates, three models were performed, one for each set of items. The item parameter estimation is fully stable when the parameters estimated in the two separate tests are compared with the corresponding estimates from the 87 set. However, the 57 set (AVT) has more harder items than the 30-set (VLT-Ac), indicated by more items in the AVT with bs located above theta = .5 for this population. The 30-set (VLT-Ac) offers, on the other hand, more items located below theta = –2.5., that is, easier items for this test taker population, which is in line with the lists’ word frequency distribution previously referenced in the background (Appendix 1).
When comparing the estimated person parameters in the three sets, a similar pattern occurs, namely that the person thetas estimated in the 30-set are not located at higher levels of the latent trait scale, whereas the AVT-estimated person thetas are located on the full scale. The correlation between the estimated person thetas in the 57-set and those in the 30-set is .84 (p < .001), indicating a large amount of shared variance between the two sets, and this supports the possibility to do a concurrent calibration. However, the imperfect correlation also revealed the lack of common information at the higher end of the scale in the two test sets.
Finally, the TIF and the reliability curves were examined for the two tests using the estimates from the combined set (Appendix 4). For the 30-set, the TIF (≈ 20) is above the threshold (> 10) (Wiberg, 2004), and the reliability is best in the range of approximately Θ = –3 to 0.5. For the 57-set, the TIF is good (≈ 25) and the reliability is best in the range of approximately Θ = –2.5 to 2.5.
Calibration and score comparison table
The results presented earlier indicated that a concurrent calibration of the AVT and the VLT-Ac was possible. Therefore, from the combined set of 87 items the 30-item VLT-Ac and the 57-item AVT were extracted. Their TCCs were then plotted in the same graph in Figure 2 with a shaded area illustrating the area where the TIF and the reliability are best shared.
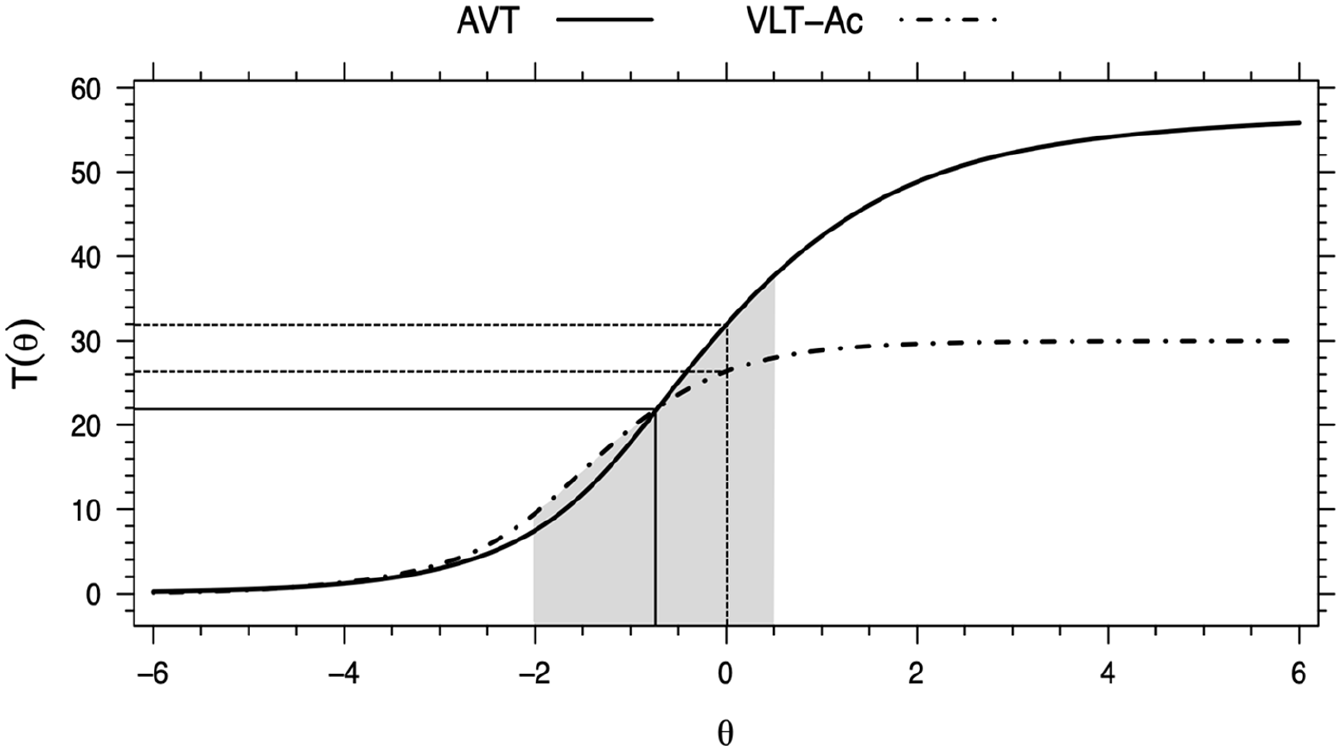
TCCs of the AVT and the VLT-Ac from the concurrent calibration.
The linking of scores between the tests was made by identifying an ability score on the VLT-Ac scale corresponding to the level of ability measured by AVT test. A first example, as is shown in Figure 2, is that the TCCs of the two tests intersect and this intersection is located on the ability scale of theta ≈ –.8 (on the x-axis) at which level a score of approximately 22-point (on the y-axis) is expected on either test. Another example is the dotted vertical line in the center of the ability scale, i.e., located at theta = 0. At this ability level, an AVT score of 32 is expected, which corresponds approximately to a VLT-Ac score just above 26.
However, when the estimated person thetas and their standard errors are placed together with the expected true scores, it is evident that the estimation includes scores between possible integer test scores. For example, a VLT-Ac score of 26, located at theta ≈ 0, may range from a rounded AVT score of 31 to 33 as shown in Table 2.
Example of variation of estimated thetas and standard error together with the expected test scores.
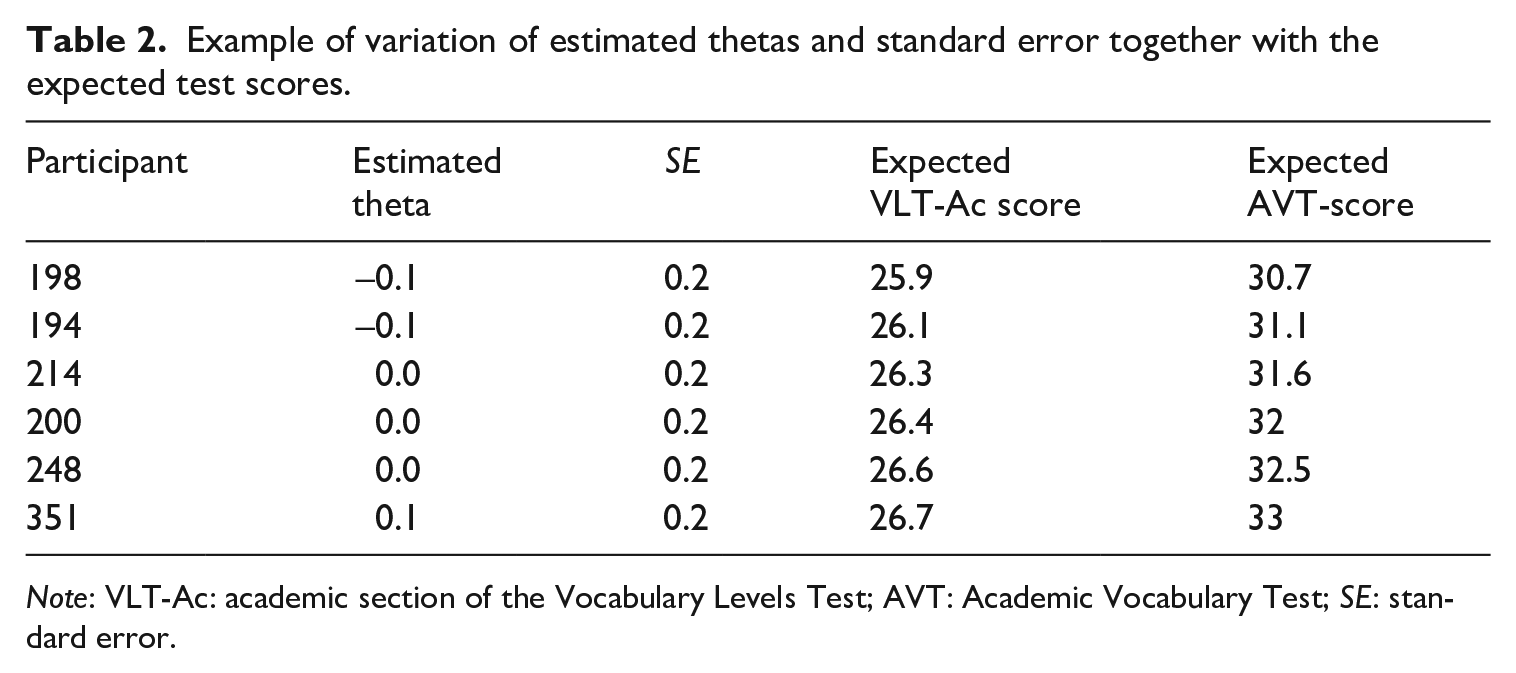
Note: VLT-Ac: academic section of the Vocabulary Levels Test; AVT: Academic Vocabulary Test; SE: standard error.
Furthermore, the confidence intervals of the TCCs using 500 bootstrapped estimations were plotted (Appendix 5). In general, the variation in the estimations is very small, and this is particularly true for the AVT test.
Table 3 presents a score comparison between integer VLT-Ac scores in the left-hand column and the corresponding integer AVT scores in the right-hand column. By looking at the extracted TCCs, the shaded area, the plotted confidence intervals, and the estimations (see Table 2), it was decided, at certain levels, to include score ranges, which sometimes overlap in the lower or upper bounds. The reliability is lower at the ends of the scale and, therefore, the ranges in these levels are larger. The table is, therefore, appropriate for approximate comparisons of scores.
Score comparison table.
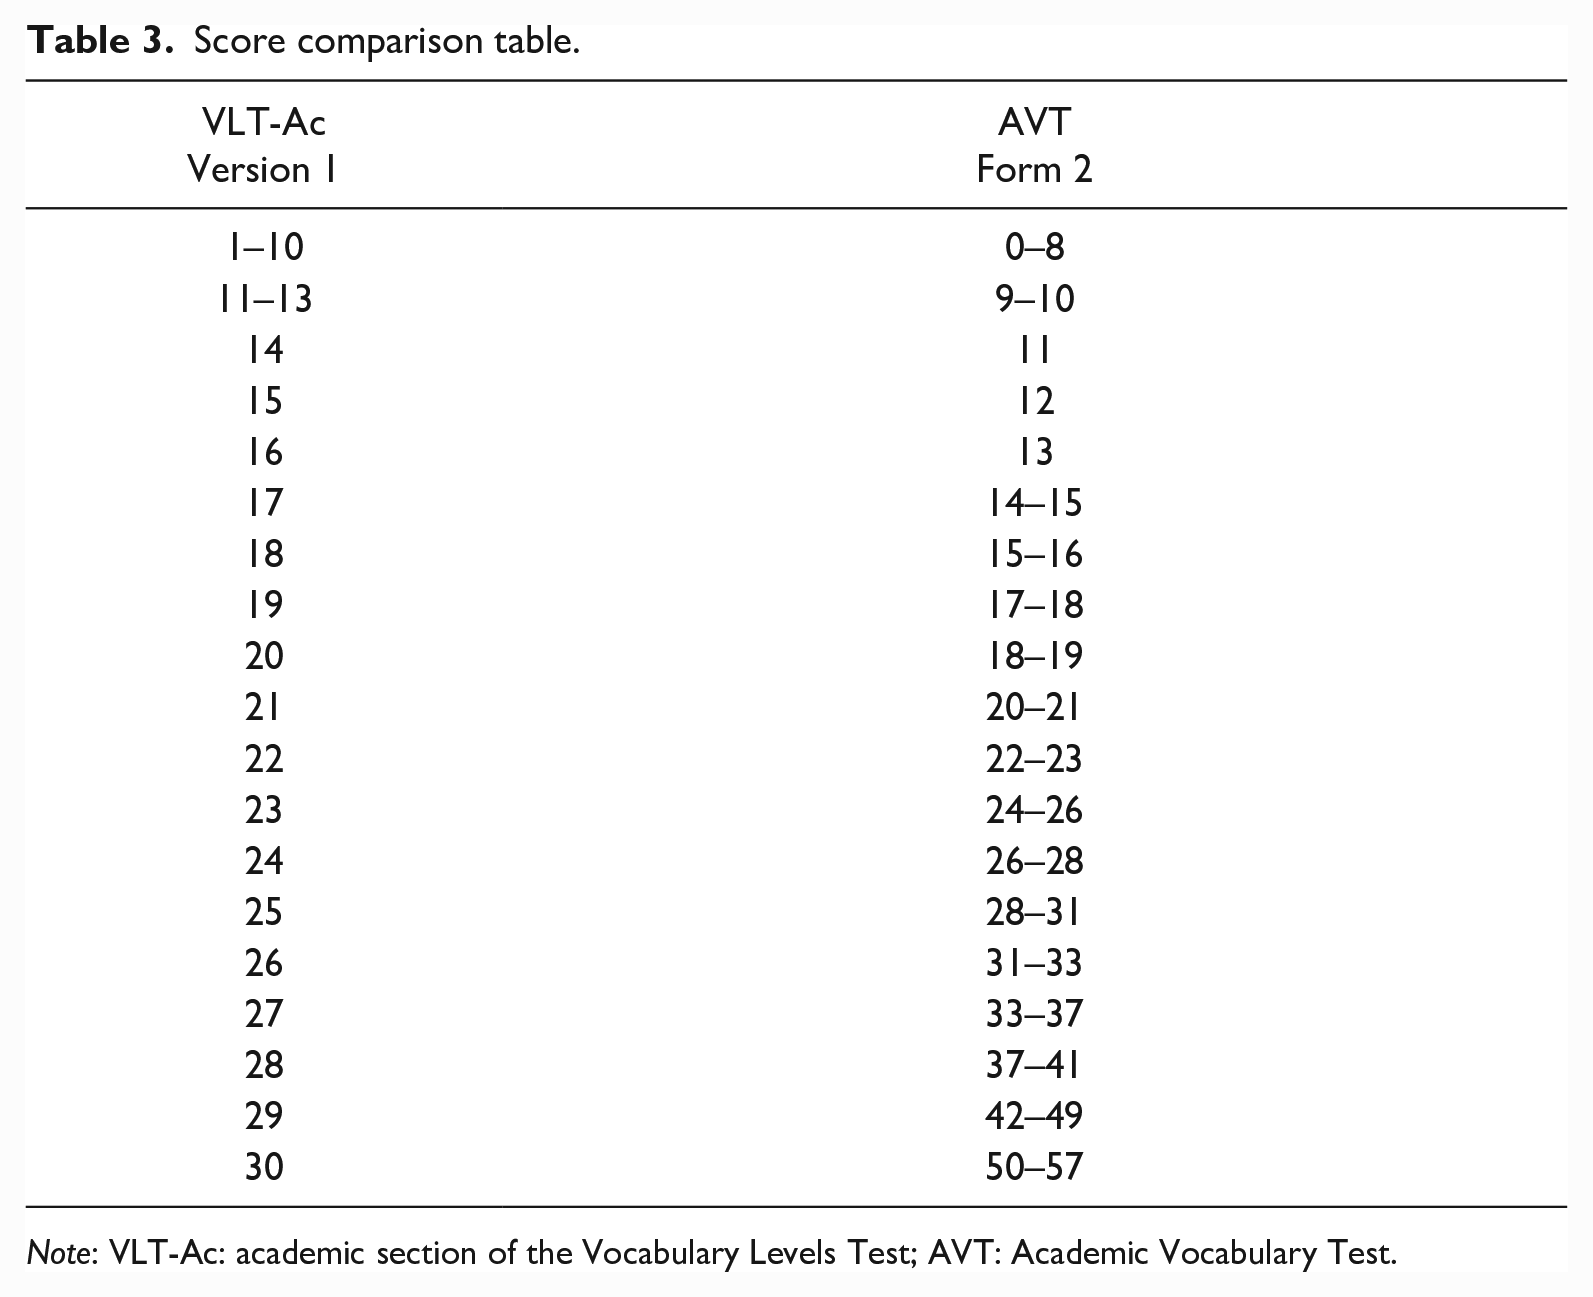
Note: VLT-Ac: academic section of the Vocabulary Levels Test; AVT: Academic Vocabulary Test.
Discussion
The current study set out to find a model for linking scores from the AVT (Form 2) with scores from the VLT-Ac (Version 1) using a single-group counterbalance design with an IRT-based concurrent calibration procedure. The underlying purpose was to enable comparisons of measurements of academic vocabulary knowledge among CEFR-B2 level English users (students) enrolled in study programs preparing for university study across a wide range of academic disciplines.
The score comparison table (Table 3) constitutes the key finding of the present study since it enables the comparison of scores achieved on the VLT-Ac and the AVT. For instance, at the latent ability level of theta ≈ –.8, a VLT-Ac score of 22 compares approximately to an expected AVT score of 22, which may be considered a weak result possibly indicating very limited knowledge for the purpose of reading academic texts (Edgarsson, 2018).
A relevant application of the score comparison table is that it offers a means for comparing scores in situations where either the VLT-Ac or the AVT was administered or for predicting a test taker’s score on the VLT-Ac based on his/her AVT score (or vice versa). A first example serves to illustrate the utility of score comparison between populations in a similar educational setting (upper secondary students in Norway and Sweden): For the Norwegian sample, Skjelde and Coxhead (2020) administered the VLT-Ac (M2 = 24.27), whereas Warnby (2022) used the AVT (M = 29.63) with Swedish students. Based on the score comparison table, the two group-level mean scores can be approximately compared: a VLT-Ac score of 24.27 is approximately equivalent to an AVT score in the 26- to 28-point range; similarly, an AVT score of 29.63 is approximately equivalent to a VLT-Ac score of 25. A second example illustrates a comparison within the same population (upper secondary students in Sweden) over time: Gyllstad (2007) gave his students the VLT-Ac (M2 = 18.20), whereas Warnby (2022) administered the AVT (M = 29.63). Based on the score comparison table, the group-level mean scores from the two studies can be approximately compared: Gyllstad’s observed VLT-Ac score of 18.20 corresponds more or less to an AVT score in the 15- to 16-point range; similarly (and as noted in the previous example), Warnby’s observed AVT score of 29.63 is approximately equivalent to a VLT-Ac score of 25.
Score linking of the kind we are proposing here, and use of the score comparison table, are not without detractors, however, and caution should be exercised when interpreting the results. The AVT measures broadly on the full latent ability scale, whereas the VLT-Ac does not provide any information at the higher end of the scale. This makes it hard to compare the maximum VLT-Ac score with an AVT score; a test taker’s VLT-Ac score of 30 may be predicted to range from approximately 50 to 57 points on the AVT. We can be more certain, however, that an AVT-score above 41 compares to a high score on the VLT-Ac (approximately in the 29- to 30-point range).
In contexts such as ours (involving CEFR-B2 EFL users with high exposure to English), the AVT is arguably a more appropriate test of written receptive meaning-recognition English academic vocabulary knowledge than is the VLT-Ac. This is because the AVT (i) gives test takers better opportunities to display a broader scope of their vocabulary knowledge and (ii) provides vocabulary researchers in this context with an instrument that is better at discriminating variation in the test takers’ academic vocabulary knowledge. We noted earlier ceiling-effect issues experienced by some scholars using the VLT-Ac in contexts similar to ours (Edgarsson, 2018; Skjelde & Coxhead, 2020), resulting in potential underestimation of the true variation and increasing the risk of introducing type I errors (Austin & Brunner, 2003). In other contexts, however, depending on the specific context and purpose of the testing, the VLT-Ac could be entirely appropriate and offer high reliability with, for example, less proficient test takers (e.g., younger learners of English, as in Sundqvist (2009), or in expanding circle (Kachru, 1985) education settings where the overall exposure to English is more limited than in our context, as in McLean (2021). The findings of this study thus lend support to the claim that the use of a test must always be related to the purpose of the testing and to the context (e.g., Read, 2000; Schmitt et al., 2020). In this regard, Lin and Morrison’s (2010) notion of a “standard” test of academic vocabulary knowledge becomes problematic (“standard” very much being a relative concept]. Instead, this study adopts a principle of “standardized” comparison, that is, a systematic way of comparing scores on two different vocabulary tests.
Vocabulary tests of the kind in this study, that is, measuring word knowledge at the meaning-recognition level using single-word units out of context, offer limited information on authentic language usage. First, the meaning-recognition format is not ideally suited to represent the lexical knowledge employable when reading; meaning-recall may be a better indicator (e.g., Kremmel & Schmitt, 2016; McLean et al., 2020; Nation & Webb, 2011). Second, in addition to vocabulary knowledge, reading proficiency depends on a variety of skills, for instance, reading strategies and content knowledge. However, the single-word meaning-recognition format in the two linked tests in this study offers a quick way of collecting low-stakes information for diagnostic purposes of learners’ academic vocabulary size. Relating such scores to other variables, for example, reading, it is evident that vocabulary knowledge, even at the low level of meaning-recognition, correlates significantly and positively with reading ability (e.g., Zhang & Zhang, 2020). This study was not designed to provide such additional variable comparison and cannot, therefore, say whether a VLT-Ac score of 26 (or a comparable AVT score of 32) may indicate “the extent to which learners and teachers need to focus on goals for academic vocabulary learning” (Skjelde & Coxhead, 2020, p. 6). However, the already identified relationships that academic vocabulary scores have with academic reading scores (e.g., Edgarsson, 2018; Shaw & McMillion, 2011) and with school grades (e.g., Skjelde & Coxhead, 2020) show how scores on tests such as the VLT-Ac and the AVT may explain variance in academic reading ability and academic achievement. This study adds a possibility to compare scores on such tests and may be used for comparisons in future correlational second language research.
Limitations and further work
We want to draw attention to some obvious limitations of this work and issue a caution concerning the utility of score comparison using the model presented in this paper.
First, readers are reminded that the comparison model arrived at is based on certain scoring principles adopted in relation to one form of the AVT and one version of the VLT-Ac; any comparison beyond these constraints may not be externally valid and may inflict upon, for example, the assumption of unidimensionality and/or the stability of IRT-estimations.
Second, this study offers a possibility to compare AVT-scores in relation to scores on the VLT-Ac and vice versa. However, errors of measurement should always be considered, and when aggregate scores are compared, the score distribution and sample sizes may vary. Therefore, we recommend that the score comparison table only be used for approximate comparisons in low-stake testing situations. Furthermore, this study is limited insofar as it cannot indicate what test scores mean in terms of, for example, mastery of the AVL/AWL or its relationship with reading or academic achievement.
Third, the matching format used in both the VLT-Ac and the AVT can be criticized for violating the assumption of local independence and introducing guessing possibilities (e.g., Gyllstad et al., 2015; Ha, 2021; Kamimoto, 2008, 2014; Stewart & White, 2011). The selection of IRT model is not really a concern in relation to this study since no substantial differences in linked scores were observed in the exploratory phase. However, with larger sample sizes, future studies may use the 3PL model to explore the intercepts for each item of a guessing parameter (McLean et al., 2015; Stewart, 2012; Stewart et al., 2017; Stewart & White, 2011).
Finally, this study uses a Swedish sample of CEFR B2 students preparing for university, and it is therefore impossible to speak to the generalizability of the estimations in populations with very different L1s (non-Germanic) or another English proficiency level.
Conclusion
The objective of the current study was to present a model for linking scores on two existing meaning-recognition tests of written receptive English academic vocabulary knowledge (the recently developed Academic Vocabulary Test, AVT, and the academic section of the Vocabulary Levels Test, VLT-Ac), in order to understand what a score on one test means in relation to the other.
The key contribution of this study is a score comparison table enabling approximate comparisons of scores achieved on the VLT-Ac and the AVT within the same context or between similar contexts to explore differences and trends over time. By using IRT modeling of the scores from both tests in a concurrent calibration, this study concludes that, in our context, (i) both tests measure test takers’ knowledge of one broad domain (i.e., written receptive English academic vocabulary at the meaning-recognition level), (ii) the AVT measures on the whole latent scale and, therefore, seemingly functions better than the VLT-Ac as a test of written receptive meaning-recognition English academic vocabulary knowledge for test takers in this proficiency range, and especially, (iii) AVT and VLT-Ac scores can now be directly, albeit approximately, compared. Such comparisons can be highly relevant when vocabulary researchers or other test users want to establish links between academic vocabulary knowledge over time and/or with other closely related variables.
Footnotes
Appendix 1
Appendix 2
Appendix 3
Appendix 4
Appendix 5
Acknowledgements
We thank the editors and the reviewers for their detailed and constructive comments during the revisions of the paper. Furthermore, we want to thank Dr. Eugenio Gonzalez at ETS Princeton for early advice on the linking methods and Senior Professor Gudrun Erickson at the University of Gothenburg for general comments regarding language assessment. Finally, we thank all participating schools and students.
Author contributions
Marcus Warnby (Conceptualization; Data curation; Formal analysis; Investigation; Project administration; Visualization; Writing—original draft; Writing—review & editing).
Hans Malmström (Conceptualization; Writing—review & editing).
Kajsa Yang Hansen (Conceptualization; Formal analysis; Methodology; Writing—review & editing).
Declaration of conflicting interests
The authors declared no potential conflicts of interest with respect to the research, authorship, and/or publication of this article.
Funding
The authors received no financial support for the research, authorship, and/or publication of this article.