
Abstract
The aim of this study was to investigate how test methods affect listening test takers’ performance and cognitive load. Test methods were defined and operationalized as while-listening performance (WLP) and post-listening performance (PLP) formats. To achieve the goal of the study, we examined test takers’ (N = 80) brain activity patterns (measured by functional near-infrared spectroscopy (fNIRS)), gaze behaviors (measured by eye-tracking), and listening performance (measured by test scores) across the two test methods. We found that the test takers displayed lower activity levels across brain regions supporting comprehension during the WLP tests relative to the PLP tests. Additionally, the gaze behavioral patterns exhibited during the WLP tests suggested that the test takers adopted keyword matching and “shallow listening.” Together, the neuroimaging and gaze behavioral data indicated that the WLP tests imposed a lower cognitive load on the test takers than the PLP tests. However, the test takers performed better with higher test scores for one of two WLP tests compared with the PLP tests. By incorporating eye-tracking and neuroimaging in this exploration, this study has advanced the current knowledge on cognitive load and the impact imposed by different listening test methods. To advance our knowledge of test validity, other researchers could adopt our research protocol and focus on extending the test method framework used in this study.
Keywords
Listening comprehension includes bottom-up and top-down cognitive processes. The former involves the decoding and accrual of incoming auditory information, whereby small units of language (e.g., phonemes and morphemes) are decoded and combined rapidly to create larger units (e.g., clauses and discourse) in the mind (Field, 1999; Ockey & Wagner, 2018; Vandergrift, 2007; Vandergrift & Goh, 2009). In contrast, the latter entails making inferences about the incoming auditory information and closing the gaps in the message, based on the listener’s contextual and world knowledge (Field, 1999; Vandergrift, 2007; Vandergrift & Goh, 2009). Importantly, these cognitive processes of constructing meaning from auditory information make listening comprehension a challenging language skill to assess, especially under test conditions.
For high-stakes, academic listening tests, some researchers have questioned whether the test methods used can elicit the cognitive processes that represent those used by listeners during real-life academic lectures (Aryadoust, 2013; Field, 2009; J. Field, 2013). Here, “test method” refers to the presentation format of the audio text and test items, and it encompasses while-listening performance (WLP) and post-listening performance (PLP) tests (Aryadoust, 2012). A WLP test, such as the listening sections of the International English Language Testing System (IELTS), requires test takers to read and answer the test items while the audio text is being presented (Aryadoust, 2012). In contrast, a PLP test (e.g., the listening sections of the Test of English as a Foreign Language internet-based test) allows test takers to read and answer the test items only after they have listened to the audio text and taken notes (Aryadoust, 2018).
Through retrospective verbal reports, Field (2009) suggested that the simultaneous need to listen to the audio text and read and answer test items during WLP tests requires test takers to split their attentional resources across visual (i.e., the test items) and auditory information (i.e., the audio text). To manage this information during WLP tests, test takers must use their working memory (WM), which is “a hypothetical cognitive system responsible for providing access to information required for ongoing cognitive processes” (Wilhelm et al., 2013, p. 1). As an individual’s WM capacity is limited (Wilhelm et al., 2013), Field (2009) assumed that the need to multi-task during the WLP tests may impose a “heavier” cognitive load on the test takers than notetaking-while-listening in simulated lectures (i.e., the PLP conditions). Field (2009) also reported that several high-scoring test takers in WLP tests adopted what he called “shallow listening”; that is, they could neither recall the main points of the lecture nor generate a coherent mental representation of the message conveyed. Field (2009) suggested that “shallow listening” occurred when the test takers extensively used visual cues in the test items, such as keywords and phrases, and matched them against the words that were presented in the audio text. This test-taking behavior is known as keyword or lexical matching (Field, 2009), and it appears to be a strategy that test takers used to mitigate the limitations of their WM. Importantly, this strategy can introduce sources of variance in test performance that are irrelevant to the listening construct, otherwise termed as construct-irrelevant variance (Messick, 1996).
These findings from Field (2009), together with the notion of “heavier” cognitive load in WLP tests, inspired Aryadoust’s (2019) recent eye-tracking study, which compared the differences in test takers’ gaze behaviors when reading test items in the presence and absence of auditory texts during a computer-mediated WLP test. Aryadoust (2020) suggested that gaze behaviors such as fixations (i.e., the temporal pauses in eye-movements (on the test items)), and visits (i.e., visits to regions of interest (on the test items) from entry to exit) (Holmqvist et al., 2011) may be measured to interpret cognitive load indirectly. Relatedly, studies in the field of human–computer interaction have reported that cognitive load is (i) inversely related to fixation rate, and (ii) positively related to fixation duration (Wang et al., 2018; Zagermann et al., 2016).
Although eye-tracking technology appears to be promising for investigating cognitive load, language testing researchers have not used test-takers’ gaze behavioral measures to examine the cognitive load imposed by different listening test methods (i.e., WLP vs. PLP). Nonetheless, the authors of a recent neuroimaging study using functional near-infrared spectroscopy (fNIRS) reported that the listening-while-answering questions during the WLP tests imposed a lower cognitive load upon the test takers compared with notetaking-while-listening during PLP tests (also known as PLP-Audio) (Aryadoust et al., 2020). Notably, this finding is in contrast with Field’s (2009) assumption that a higher cognitive load is imposed by WLP tests. Aryadoust et al.’s (2020) study was inspired by previous research that has suggested that brain activity directly measured through fNIRS is sensitive to cognitive load and studies have highlighted the positive linear relationship between brain activity levels and cognitive load (Fishburn et al., 2014; Li et al., 2005). Specifically, Aryadoust et al. (2020) showed that the test takers’ activity levels across the brain regions supporting top-down (i.e., left dorsomedial prefrontal cortex (dmPFC)) and bottom-up language processing (i.e., left inferior frontal gyrus (IFG) and left posterior medial temporal gyrus (pMTG)) were lower during the WLP tests than notetaking-while-listening during PLP tests (PLP-Audio). The study’s mapping of top-down and bottom-up processing on the above-mentioned brain regions was based on previous neuroimaging studies of language comprehension that associated top-down processing with the dmPFC (Buchweitz et al., 2014; Ferstl et al., 2008; Ferstl & von Cramon, 2002; Hickok & Poeppel, 2004; Saur et al., 2008), and bottom-up processing with the IFG and pMTG (Buchweitz et al., 2014; Buchweitz et al., 2009; Jobard et al., 2007; Michael et al., 2001; Whitney et al., 2010).
Together, the foregoing interpretations by Aryadoust et al. (2020) and Field (2009) on cognitive load warrant further investigation as these two studies used different research methods and reported contrasted findings. To address these interpretations, we will discuss a cognitive load theoretical framework that accounts for listeners’ cognitive architecture in the next section.
Cognitive load theory: Cognitive load in listening tests
A leading theory in the field of educational research and instructional design is Sweller’s (1988) cognitive load theory. This theory assumes that an individual’s WM capacity is limited, and suggests that task designers should reduce the sources of extraneous cognitive load so that individuals can direct their cognitive resources to complete effectively the primary task at hand (Chandler & Sweller, 1991; Sweller et al., 2011). Sweller et al. (2011) suggested that “extraneous cognitive load is generated by the manner in which information is presented to [listeners] and is under the control of [the task] designer.” Thus, the extraneous cognitive load imposed on the test takers’ WM during listening tests may arise from the test methods that determine the way information is presented (Sweller, 2011; Sweller et al., 2011).
Crucial to the cognitive load theory and in contrast with the views of Field (2009), all sensory information received is processed according to its modality. This means that the WM subsystem that processes visual information differs from the WM subsystem that processes auditory information (Baddeley, 2012; Baddeley & Hitch, 1974). Importantly, the information received is mentally integrated across time and space (Sweller, 2011; Sweller et al., 2011). Thus, if a test method requires test takers to integrate disparate sources of information that are temporally and/or spatially segregated, then this can introduce a heavy extraneous cognitive load (also known as the split-attention effect (Chandler & Sweller, 1992; Sweller et al., 2011)). Contrary to the findings of Field (2009), the split-attention effect—as described by Chandler and Sweller (1992) and Sweller et al. (2011)—suggests that WLP tests may not impose heavier extraneous cognitive load than notetaking-while-listening during PLP tests. It is possible that the need to temporally integrate visual (i.e., test items) and auditory (i.e., listening text) information across a single time interval and within the same space during WLP tests afforded 1 test takers to adopt keyword matching and “shallow listening” (Field, 2009). This strategy can, in turn, result in significantly lower cortical activity and lower cognitive load during WLP tests compared to PLP tests (Aryadoust et al., 2020)—as opposed to Field’s (2009) claim of higher cognitive load induced by the WLP format.
Sweller’s (1988) cognitive load theory also can be interpreted as contemporarily suggesting that answering test items during the computer-mediated PLP tests may impose a greater extraneous load, as test takers need to recall information about the listening text from their long-term memory (Kintsch, 1988) and split their visual attention spatially and temporally while gazing back and forth between their notes (written on paper) and the test items (on the monitor). Hence, the need to channel information from long-term memory into WM and integrate this information with the visual information that is segregated across time and space may lead to higher cortical activations when answering test items during PLP tests. When all else is kept equal, this theory suggests that test takers may perform better during WLP tests given the lighter cognitive load. Yet, Aryadoust et al. (2020) reported that WLP tests induced a heavier cognitive load compared to answering test items during PLP tests, with higher activity levels across the left dmPFC, IFG, and pMTG. Furthermore, these authors reported the absence of significant differences in listening test scores across test methods (Aryadoust et al., 2020). Importantly, these findings contrasted with the results of Field (2009), who reported that listeners scored lower when identifying the main points of lectures during WLP tests than in non-test PLP conditions.
The present study
At present, there is an inconsistency between the theoretical framework (i.e., Sweller’s (1988) cognitive load theory) and the experimental findings across small (n < 30) studies regarding cognitive load and performance for WLP and PLP test methods (Aryadoust et al., 2020; Field, 2009). In order to advance current knowledge on cognitive load and push forth research boundaries, the present study combined eye-tracking and fNIRS technologies to study the cognitive load imposed by different listening test methods by examining test takers’ gaze behavioral measures and brain activation patterns, respectively. In addition, test scores were tabulated to assess test takers’ measured listening performance across the computer-mediated WLP and PLP tests. To record event-related brain activation, we adopted the neuroimaging framework by Aryadoust et al. (2020) and presented the audio texts and test items in segments. For the WLP tests, the segmented audio texts and test items were concurrently presented to the test takers in a single phase. In contrast, the PLP tests were presented to the test takers in two phases, consisting of PLP-Audio and PLP-Question phases. During the PLP-Audio phase, test takers could take notes (on paper) while listening to the segmented audio texts. During the PLP-Question phase, test takers read their notes while answering the test items presented on a computer monitor. As the segments have varying durations, all measures of gaze behaviors are normalized or expressed as a function of segment duration (i.e., they are divided by segment duration). The hypotheses for this study are as follows:
First, in line with the eye-tracking literature on cognitive load (Wang et al., 2018; Zagermann et al., 2016), it is anticipated that test takers (i) fixate within the test items more frequently (i.e., a higher fixation rate), and (ii) therefore spend a lower proportion of their time fixating on the test items on average and in total (i.e., lower normalized average/total fixation durations) during WLP tests than in the PLP-Question phase. In other words, since test taskers fixate on the written test items rapidly during the WLP tests (higher fixation rate), each fixation will be shorter (lower fixation duration). This is because, consistent with Hypothesis One, test takers are expected to adopt the keyword matching strategy and “shallow listening” during the WLP tests (Field, 2009). By contrast, during the PLP-Question test phase, test takers are expected to (i) split their attention across the computer monitor and notes and (ii) integrate their mental representations of the audio text (oral stimuli) with the information from their notes and test items. This temporal and spatial segregation of information in the PLP-Question phase is expected to result in a higher cognitive load.
Second, during the WLP tests, test takers are expected to (i) visit the test items less frequently (i.e., lower visit rates), but (ii) spend a larger proportion of their time visiting the test items on average and in total than in the PLP-Question test phase (i.e., higher normalized average/total visit duration). Lower visit rates during the WLP tests are predicted because test takers do not need to alternate their gaze between the computer screen and notes since they do not have any written notes during this test; by contrast, during the PLP-Question phase, test takers will have to alternate their visits from the computer screen presenting the test items to their notes on paper, resulting in higher visit rates. Since test takers spend time visiting the computer screen in the WLP test, the duration of each visit will be longer. This result is treated as an indication of lower cognitive load in the WLP tests, as this visit pattern indicates a minimal temporal and spatial segregation of information (Sweller, 1988).
Finally, the test takers’ brain activity levels across the left dmPFC, IFG, and pMTG regions are expected to be lower during the WLP tests than when answering test items in the PLP-Question test phase, indicating lower cognitive load in the WLP test compared with the PLP-Question test phase.
Methods
Participants
A total of 109 neurotypical participants (M = 24.0, standard deviation (SD) = 3.7 years; 60 females and 49 males) volunteered for this research. They were students from a local university and were recruited via posters and an online chat group dedicated to participant recruitment. Of these, 69 participants conversed in English as their first language and 99 were right-handers. There were two parts to this research: (i) a listening test validation (i.e., the IELTS-test specimen (IELTS-TS), see the “Instruments” section for details), and (ii) an eye-tracking and fNIRS experiment. All 109 participants partook in the part of the research that concerned validating aspects of the listening-test score uses. They were then invited to participate in the eye-tracking and fNIRS experiment until the target of 80 participants was reached (M = 24.1, SD = 4.0 years; 45 females and 35 males). Of these 80 participants, 48 conversed in English as their first language and 71 were right-handed. This research was approved by the university’s Institutional Review Board. All participants provided informed consent and were compensated with $30 at the end of the study.
Instruments
Edinburgh Handedness Inventory
Research that investigated the associations between handedness and hemispheric language dominance showed that the incidence of right-hemispheric language dominance was higher in left-handed individuals than right-handed individuals (Knecht et al., 2000; Szaflarski et al., 2012). Thus, we established the participants’ handedness by using an online version of the Edinburgh Handedness Inventory (EHI) to evaluate the differences in brain activation levels between left-handed (M = −61.7, SD = 31.6) and right-handed participants (M = 77.7, SD = 18.8). Using IBM SPSS Version 25 (IBM Corporation, 2017), the Mann-Whitney U tests indicated no significant differences between the two groups across the dmPFC, IFG, and pMTG at α = 0.0056 (i.e., following post-hoc Bonferroni corrections for nine pairs of comparisons). In view of this result and the small number of left-handed participants (n = 9), left-handed and right-handed participants were treated as one group in subsequent analyses.
Computer-mediated listening tests
Three sets of listening tests were used for this research. First, a psychometrically validated IELTS-TS was used to establish participants’ baseline listening comprehension abilities (Aryadoust, 2012). The test was conducted on a computer via Google Sheets and involved listening to (i) a dialogue about an everyday situation, (ii) a monologue radio broadcast, (iii) an academic dialogue, and (iv) an academic lecture (see Table 1 for test item descriptions). Based on the alpha (α) coefficients calculated using JASP Version 0.11.1 (JASP Team, 2019), the IELTS-TS possessed a high internal consistency reliability with Cronbach’s α coefficients of 0.88 and 0.87 with and without partial credit, respectively (McDonald, 1999; Revelle & Zinbarg, 2008).
Description of the listening tests.
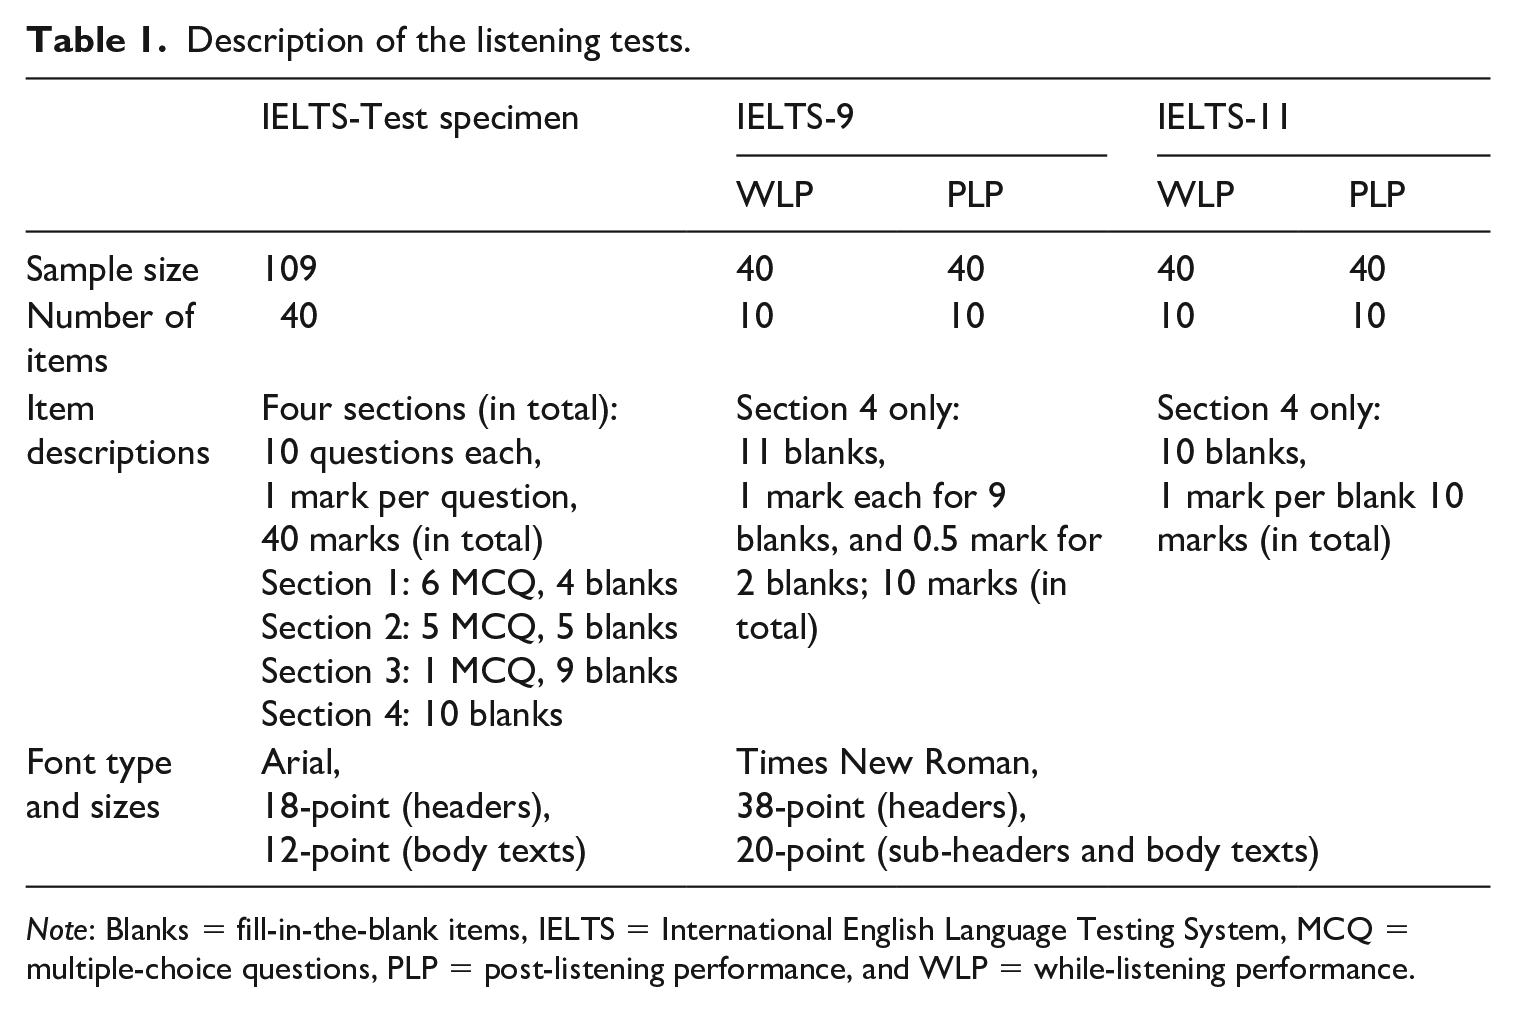
Note: Blanks = fill-in-the-blank items, IELTS = International English Language Testing System, MCQ = multiple-choice questions, PLP = post-listening performance, and WLP = while-listening performance.
Second, two lectures (i.e., IELTS-9 (Cambridge ESOL, 2013), and IELTS-11 (Cambridge ESOL, 2016)) with very similar linguistic features, speech rate (M = 141, SD = 3 words per minute), and topics (i.e., Whales and Dolphins, and Ocean Biodiversity) were selected from a corpus of 56 commercially available IELTS practice tests (Cambridge University Press, 2021) for the eye-tracking and fNIRS experiment (see Table 1 for test item descriptions). Following the methods of Green et al. (2010), the linguistic features across all 56 transcribed lectures, such as coherence, narrativity, cohesion, syntactic simplicity, and lexical diversity, were determined using Coh-Metrix (McNamara et al., 2014). Using Latent GOLD Version 5.1 (Statistical Innovations, 2016), the linguistic features were then submitted to a latent class cluster (LCC) analysis to identify similar cases (i.e., the lecture texts) and classify them into homogenous groups called latent classes or clusters (Magidson & Vermunt, 2004). The LCC is a robust classification method that is well suited for identifying homogeneous groups of texts based on their linguistic features. By using LCC, we were able to avoid using arbitrary selection criteria set by experts, which is widely used in content analysis but has recently been critiqued (see Alderson & Kremmel, 2013).
We generated two- and three-cluster models and then selected the more parsimonious two-cluster solution following comparisons with the three-cluster solution. The two-cluster solution divided the text corpus into two clusters (see Appendix 1 for further information). Compared with Cluster one, the lectures from Cluster two had higher mean scores on the five above-mentioned Coh-Metrix variables. Thus, we chose two lectures from Cluster two for this study. Importantly, the choice of lecture texts from the same cluster allowed us to control for the potential effects of text-related variables.
The WLP and PLP versions for each lecture were subsequently created (i.e., IELTS-9WLP, IELTS-9PLP, IELTS-11WLP, and IELTS-11PLP). These tests possessed medium to high internal consistency reliability with Cronbach’s α coefficients ranging from 0.52 to 0.75. To measure event-related brain activation, the two lectures and their test items were divided into segments (i.e., eight for IELTS-9, and six for IELTS-11; see Appendix 2 for segment details). The average lecture durations per segment was 31.7s (i.e., 13s to 48s) for the IELTS-9 lecture and 57.2s (i.e., 31s to 72s) for the IELTS-11 lecture, and thus each segment in the WLP tests and the PLP-Audio phase was set accordingly to these durations. As for the PLP-Question phase, each segment duration was set at 40s.
Research design and data collection procedures
This study was conducted in a laboratory over 189 sessions, where each session involved one participant. Each session lasted between 45 and 75 minutes. The first part of the study involved (i) collecting demographic information (including details on handedness) and (ii) completing the IELTS-TS (Figure 1A). The aforementioned tasks were computerized and presented on a secondary 23-inch monitor (Hewlett Packard, CA, USA), which was connected to a primary laptop (HP Pavilion 15, Hewlett Packard). The participants sat through the IELTS-TS, with the audio texts presented through two computer speakers (see Appendix 3 for test protocol details).
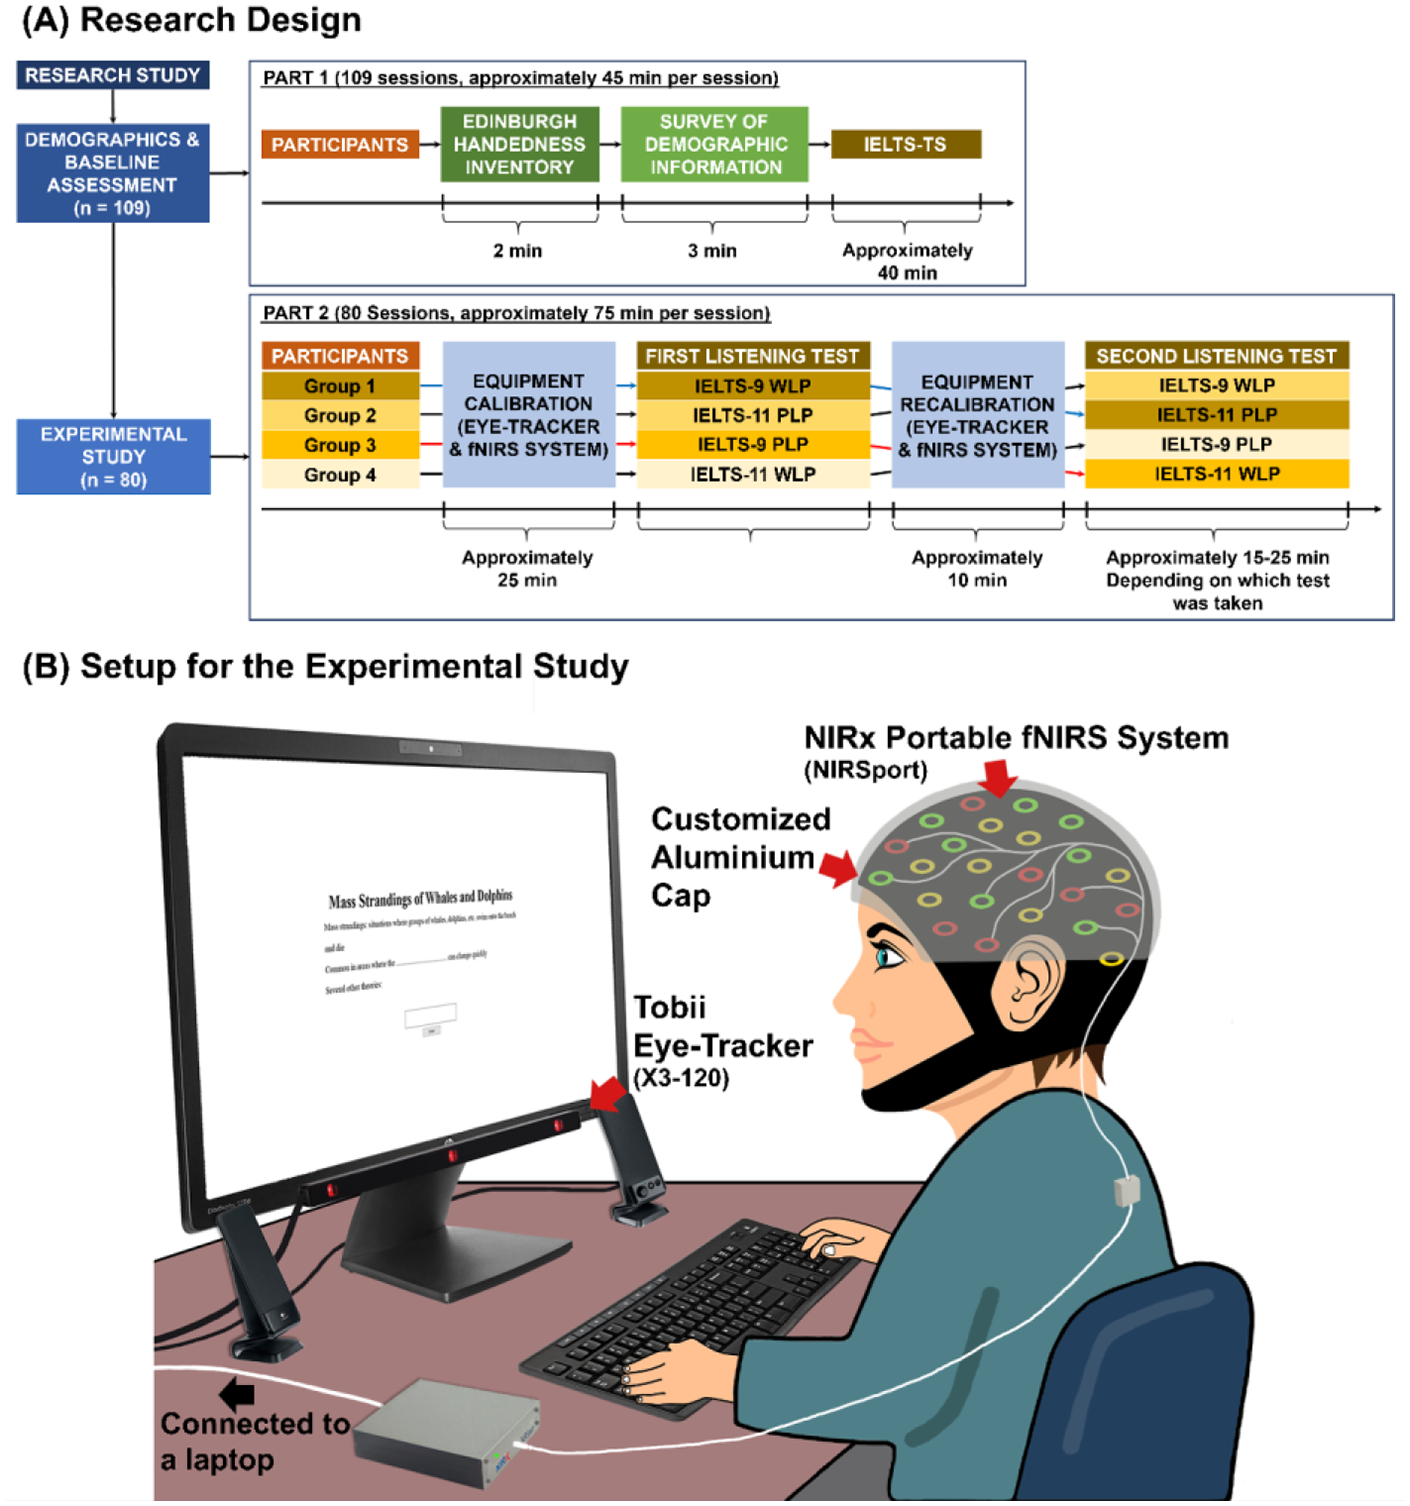
Setup for the experimental study and the research design.
The second part of the study involved the administration of the WLP and PLP tests. All participants sat approximately 65cm in front of the same 23-inch monitor, which was connected to the primary laptop (HP Pavilion 15, Hewlett Packard) (Figure 1B). An infrared eye-tracker (Tobii X3-120, Tobii AB, Stockholm, Sweden), which was affixed to the monitor, recorded the participants’ gaze behaviors at 120Hz. The participants wore an fNIRS headcap (NIRx Medical Technologies LLC, NY, USA) that was affixed with eight pairs of light-emitting sources and detector probes covering the left dmPFC, IFG, and pMTG. Each pair of sources and detectors was placed approximately 1.5cm apart and made contact with the participant’s scalp to attain optimal signals. The non-invasive near-infrared light from the sources penetrates the scalp to reach the brain tissue in the cortex. During the penetration, some wavelengths that are specific to brain tissues are absorbed. Wavelengths that are not absorbed follow a “banana-shape” trajectory called “photon banana” within the brain tissue and reach the surface. These unabsorbed wavelengths are then detected by the detectors. The intensity of the detected light is then measured and used to differentiate the brain regions with high concentrations of the oxygenated blood (representing significant brain activation), and the deoxygenated blood (representing less activation) (Rupawala et al., 2018). The sources and detectors on the headcap were connected to a portable fNIRS system (NIRSport, NIRx Medical Technologies LLC) that recorded data at 7.81Hz.
As both the eye-tracker (Tobii AB) and fNIRS systems (NIRx Medical Technologies LLC) operated via near-infrared light, the participants also wore a customized aluminum cap to minimize infrared light interference (i.e., from the eye-tracker) on the fNIRS signals (Figure 1B). To synchronize the stimuli presented with the fNIRS signals, a c-pod (Cedrus Corporation) was used to facilitate event marker delivery from SuperLab Version 5.0.5 (Cedrus Corporation, 2015) to NIRStar Version 15-0 (NiRx Medical Technologies LLC, 2016b) (Figure 2). Event markers were set at the start of all segments for the WLP tests, the PLP-Audio, and the PLP-Question phases to synchronize the fNIRS and eye-tracking data as screen recordings were captured in Tobii Pro Studio Version 3.4.8 (Tobii AB, 2017) during the listening tests.
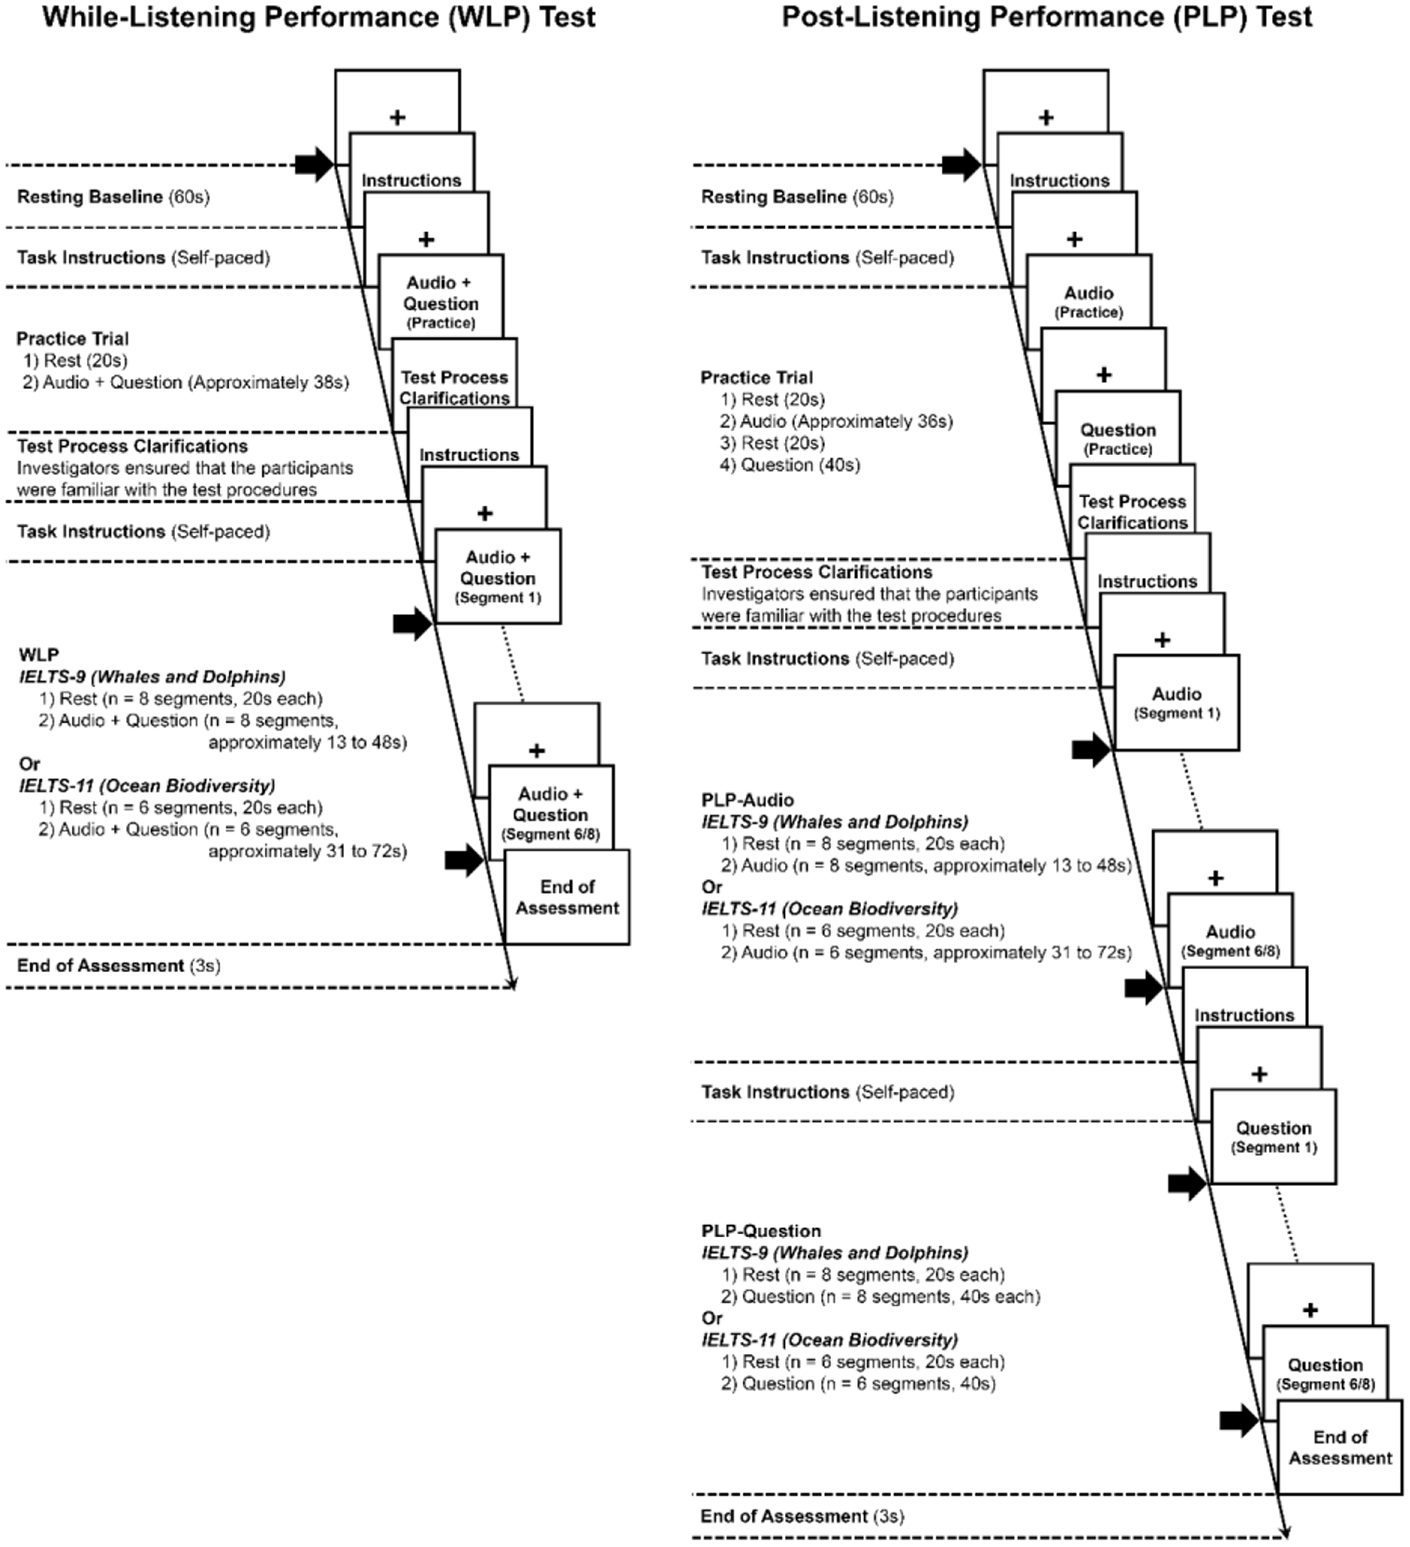
The protocols for the while-listening performance and post-listening performance tests.
At the start of each session, participant calibration was first performed for the fNIRS system (NIRx Medical Technologies LLC) using an automated calibration process in NIRStar Version 15-0 (NiRx Medical Technologies LLC, 2016b) to establish the optimal amplification factors for all data channels. Subsequently, a five-point calibration process was performed in Tobii Pro Studio Version 3.4.8 (Tobii AB, 2017) to establish each participant’s gaze in relation to the screen. Following calibration, the listening tests began. All participants were instructed to minimize large head movements during the tests to reduce noise in the fNIRS signals and drifts in gaze data (i.e., the systematic errors between the participants’ actual and recorded gaze positions). Specifically, their eye positions were also monitored in Tobii Pro Studio Version 3.4.8 via the primary laptop to ensure consistency in head-to-screen position.
To carry out the experiments, a single-blinded, pseudo-randomized crossover design was adopted where all participants listened to two lectures (i.e., IELTS-9 and IELTS-11) that were presented in different test methods (i.e., WLP and PLP) (Figure 1A). The order of the “lectures” and “test methods” were counterbalanced as shown in Figure 1A. In between the listening tests, both the fNIRS and eye-tracking system were recalibrated to ensure that the quality of the data was maintained.
Data processing
Listening test scores
For IELTS-TS, together with the answers provided by IELTS, answers that were closely paraphrased or demonstrated an understanding of the concept(s) and/or meaning of the word(s) in the answer key were given full credit (Field, 2009). Partial credit was used for scoring the answers to give a better reflection of the participants’ understanding of the test items. Answers with multiple concepts (e.g., “information desk”) were given partial credit for each concept presented (e.g., two total marks for “information desk,” one mark for “information,” and one mark for “desk”). Answers without any concepts were given zero.
For IELTS-9 and IELTS-11, close paraphrased answers were also accepted, together with the answers provided by IELTS. Only one test item within IELTS-9 was given partial credit, as there were two blanks (i.e., a half mark per blank). All other test items were scored zero or one.
Gaze behavioral data
Upon initial inspection of the eye-tracking data, 12 datasets (out of 160; 8%) were removed from further analyses owing to off-calibrations and/or poor tracking quality (see Appendix 2 for further details). In total, 74 sets of eye-tracking data were included for each of the WLP and PLP tests.
The sequences and durations for all 14 segments were first annotated in Tobii Pro Studio Version 3.4.8 (Tobii AB, 2017) to crop the eye-tracking data for analysis. Each segment comprised one area of interest (AOI), that is, the area in which the test item(s) was(were) presented on screen. Thus, a total of 14 customized polygons were drawn over the AOIs. As Tobii Pro Studio Version 3.4.8 (Tobii AB, 2017) does not offer post-hoc drift corrections, all polygons comprised wider buffers beyond the text-based AOIs to accommodate potential drifts from slight changes in the participants’ head positions during the tests and eye-tracker inaccuracy (see Appendix 2 for further details). Subsequently, the raw eye-tracking data were interpolated with a maximum gap length of 75ms to replace missing data that arose from tracking issues (Komogortsev et al., 2010; Olsen, 2012), and smoothed by using a moving median filter with a window size of three samples to reduce noise (Juhola, 1991; Olsen, 2012). Fixation eye movements were then parsed from saccades using a velocity threshold-identification filter (Stuart et al., 2019), with a velocity threshold at 30°/s (Olsen, 2012) and a minimum fixation duration at 100ms (Rayner, 1991).
Six variables were extracted for every AOI including (i) fixation counts, (ii) average fixation duration, (iii) total fixation duration, (iv) visit counts, (v) average visit duration, and (vi) total visit duration (see Tobii AB (2016) for variable definitions). For each AOI, the durational variables were then expressed as a proportion of the segment duration (i.e., in percentage), whereas the count data were expressed as a function of segment duration (i.e., fixations or visits per second). To compare these data across the listening tests, all six variables of interests (i.e., normalized average fixation and visit durations, normalized total fixation and visit durations, and fixation and visit rates) were averaged according to the number of AOIs in each test.
Neuroimaging data
Pre-processing was performed in NIRSlab Version 2016.06 (NIRx Medical Technologies LLC, 2016a) to reduce noise, improve data quality, and prepare the data for analysis (see Appendix 4 for further details). Overall, there was good data quality with approximately 75% of the channels passing the data quality check (i.e., M = 16, SD = 3 channels out of 20). Participants with fewer than 10 channels (i.e., 50%) passing through the quality check were removed from further analysis, as the data could be biased by the few remaining channels (i.e., nine datasets in total). Subsequently, an oxygenated hemoglobin (HbO) beta (β) value was computed for each channel and condition. The HbO were summed and averaged based on the channel location within the left dmPFC, IFG, and pMTG respectively to produce one HbO for each brain area.
Only HbO values were analyzed, as these data best represent an individual’s brain activity levels relative to the deoxygenated and total hemoglobin levels (Strangman et al., 2002). Three sets of HbO values were extracted for each participant based on activity levels during the WLP, PLP-Audio, and PLP-Question tests. Thus, nine HbO values per participant are included in the analyses (i.e., three conditions by three brain regions).
Statistical analysis
Normality across all test scores, gaze behaviors, and brain activity data was first assessed using the Shapiro-Wilk statistics. All data violated the assumption of normality, and they were unsuitable for data transformation and parametric analysis (i.e., analysis of covariance (ANCOVA) and linear mixed model). Thus, non-parametric analyses were performed using IBM SPSS Statistics (IBM Corporation, 2017).
Listening test scores
The overall test scores across test methods (i.e., WLP and PLP) and lectures (i.e., IELTS-9 and IELTS-11) were analyzed using a two-way rank analysis of covariance (RANCOVA) (Quade, 1967), according to the procedures described on the IBM SPSS support page (IBM Support, 2018). Although both lectures were similar in terms of their linguistic features, they were different in duration. Thus, “lectures” was included as a main factor in addition to “test methods.” In addition, the participants’ overall IELTS-TS scores were included in the analysis as a covariate to account for individual differences in measured listening ability.
Gaze behavioral data
All normalized gaze behavioral data across each IELTS lecture were analyzed independently by using Mann-Whitney U tests to assess the overall differences between WLP and the PLP-Question phase. The effect sizes (r) for non-parametric statistics were calculated using the formula
Neuroimaging data
The HbO β values for each brain area were compared using Wilcoxon signed rank tests to assess differences between the (i) WLP and PLP-Audio and (ii) WLP and PLP-Question tests. The effect sizes were calculated based on A. P. Field’s (2013) recommendations.
Results
In this section, tests scores are presented as the mean and 95% confidence intervals (CI), whereas gaze behavioral and fNIRS data are reported as the mean and SD.
Test scores
Controlling for participants’ baseline listening performance, the two-way RANCOVA procedure indicated that the main effect of “test methods” was significant, F(1,156) = 24.63, p < .0001, whereas the main effect of “lectures” was not significant, F(1,156) = 1.95, p = .16. The interaction between “test methods” and “lectures” was also significant, F(1,156) = 12.76, p < .001, Figure 3A. Post-hoc analyses with Bonferroni correction indicated that participants scored significantly lower for IELTS-11PLP (M = 7.33, 95% CI [6.76, 7.89]) than IELTS-11WLP (M = 8.93, 95% CI [8.36, 9.49]), p < .0001. No difference in test scores was, however, observed between IELTS-9PLP (M = 7.66, 95% CI [7.10, 8.23]) and IELTS-9WLP (M = 8.13, 95% CI [7.56, 8.69]), p = .33. Additionally, the differences in test scores between IELTS-9 and IELTS-11 were significant for WLP (p < .001), but not for PLP (p = .13).
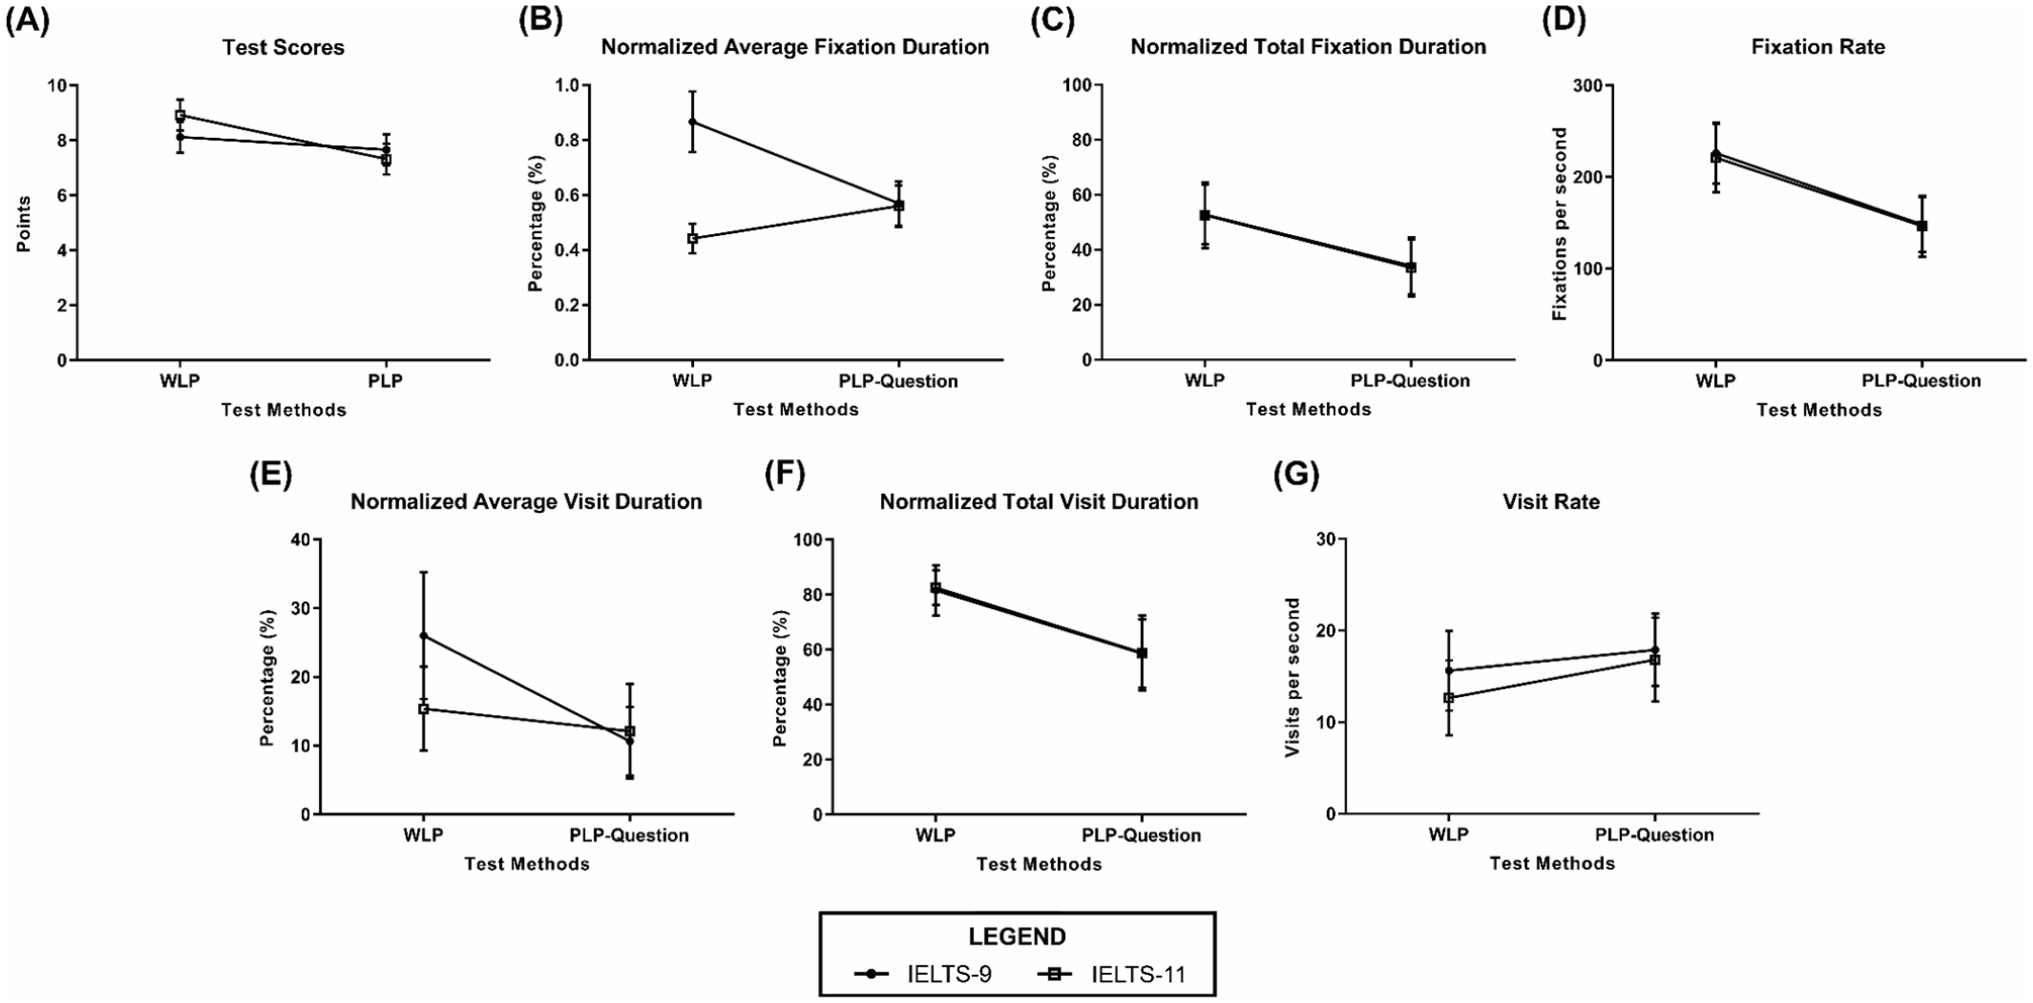
Test scores and gaze behavioral data.
Gaze behavioral data
In terms of the normalized average fixation duration, the Mann-Whitney U tests showed that the participants fixated on the test items for a longer period on average during WLP (M = 0.87, SD = 0.11%) than the PLP-Question phase (M = 0.57, SD = 0.08%) for IELTS-9, U = 21561, p < .0001, r = −0.42 (Figure 3B). In contrast with IELTS-9, the participants’ normalized average fixation duration was shorter during WLP (M = 0.44, SD = 0.05%) than the PLP-Question phase (M = 0.56, SD = 0.08%) for IELTS-11, U = 10339.5, p < .0001, r = −0.49 (Figure 3B).
For (i) the normalized total fixation duration and (ii) fixation rate, the Mann-Whitney U tests indicated that the participants not only spent more time fixating on the test items in total, they also made more fixations per unit time during WLP than the PLP-Question phase for IELTS-9 (i: WLP M = 53, SD = 11%, the PLP-Question phase M = 34, SD = 10%, U = 13637, p < .0001, r = −0.58, Figure 3C; ii: WLP M = 226, SD = 33 fixations/s, the PLP-Question phase M = 148, SD = 30 fixation/s, U = 10940, p < .0001, r = −0.64, Figure 3D). Similarly to IELTS-9, the normalized total fixation duration for IELTS-11 was also longer during WLP (M = 53, SD = 12%) compared with the PLP-Question phase (M = 33, SD = 10%), U = 7358.5, p < .0001, r = −0.60 (Figure 3C). In terms of the fixation rate, participants also had more fixations on the test items per unit time during WLP (M = 221, SD = 37 fixations/s) than the PLP-Question phase (M = 146, SD = 33 fixations/s), U = 7358.5, p < .0001, r = −0.65 (Figure 3D).
Moreover, the differences between WLP and the PLP-Question phase for (i) normalized average visit duration and (ii) normalized total visit durations were also statistically significant for IELTS-9 (i: WLP M = 26, SD = 9%, the PLP-Question phase M = 11, SD = 5%, U = 15397, p < .0001, r = −0.55, Figure 3E; ii: WLP M = 82, SD = 9%, the PLP-Question phase M = 59, SD = 12%, U = 2901, p < .0001, r = −0.60, Figure 3F). Similarly, the Mann-Whitney U tests also indicated that participants spent more time visiting the test items (i) on average and (ii) in total during WLP than the PLP-Question phase for IELTS-11 (i: WLP M = 15, SD = 6%, the PLP-Question phase M = 12, SD = 7%, U = 16326.5, p < .0001, r = −0.28, Figure 3E; ii: WLP M = 83, SD = 6%, the PLP-Question phase M = 59, SD = 14%, U = 7993.5, p < .0001, r = −0.58, Figure 3F).
In terms of the visit rate, the Mann-Whitney U test showed that participants visited the test items more frequently during PLP (M = 18, SD = 4 visit/s) than WLP (M = 16, SD = 4 visit/s) for IELTS-9, U = 32448, p < .0001, r = −0.20 (Figure 3G). Likewise, the participants also visited the test items more frequently during the PLP-Question phase (M = 17, SD = 5 visit/s) than WLP (M = 13, SD = 4 visit/s) for IELTS-11, U = 15063, p < .0001, r = −0.33 (Figure 3G).
Neuroimaging data
In terms of the brain activity levels, the Wilcoxon signed rank tests revealed significantly more activation during the PLP-Audio phase than in WLP across the left (i) dmPFC (the PLP-Audio phase β M = 4.19 × 10⁻⁵, SD = 9.75 × 10⁻⁵, WLP β M = −9.46 × 10⁻⁵, SD = 11.47 × 10⁻⁵, Z = −6.47, p < .0001, r = −0.77), (ii) IFG (the PLP-Audio phase β M = 5.84 × 10⁻⁵, SD = 10.50 × 10⁻⁵, WLP β M = −1.40 × 10⁻⁵, SD =16.64 × 10⁻⁵, Z = −3.16, p =.002, r = −0.38), and (iii) pMTG (the PLP-Audio phase β M = −1.12 × 10⁻⁵, SD = 12.73 × 10⁻⁵, WLP β M = −6.30 × 10⁻⁵, SD = 14.08 × 10⁻⁵, Z = −2.11, p = .035, r = −0.25). As for the comparisons between the PLP-Question phase and WLP, there was significantly more activation in the former only in the left dmPFC (the PLP-Question phase β M = −3.57 × 10⁻⁵, SD = 18.19 × 10⁻⁵, WLP β M = −9.46 × 10⁻⁵, SD = 11.47 × 10⁻⁵, Z = −2.97, p =.004, r = −0.34). No differences were, however, observed for the left IFG and pMTG (p > .05, Table 2).
Comparisons of beta values by conditions.
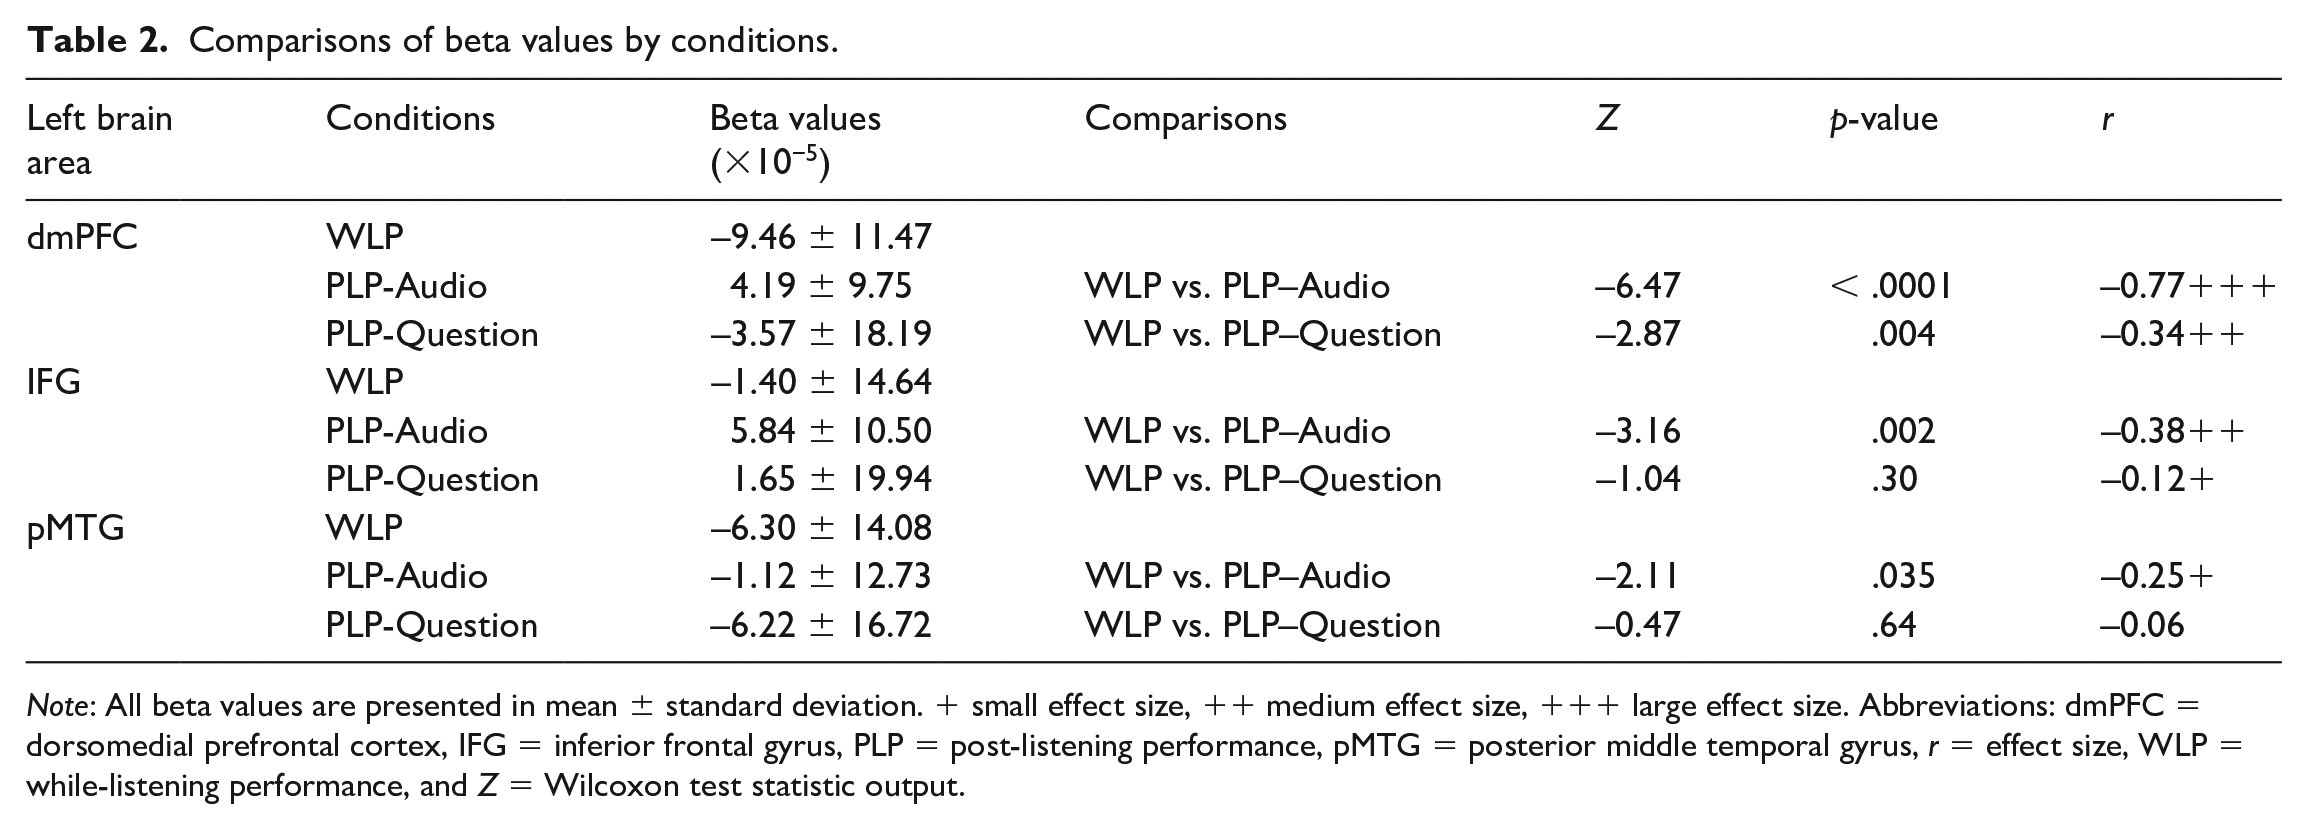
Note: All beta values are presented in mean ± standard deviation. + small effect size, ++ medium effect size, +++ large effect size. Abbreviations: dmPFC = dorsomedial prefrontal cortex, IFG = inferior frontal gyrus, PLP = post-listening performance, pMTG = posterior middle temporal gyrus, r = effect size, WLP = while-listening performance, and Z = Wilcoxon test statistic output.
Summary of findings
The results of the study showed that the cognitive load for the WLP tests was lighter compared with both notetaking-while-listening in the PLP-Audio phase and answering of test items during the PLP-Question phase. During the WLP tests, the test takers displayed significantly lower brain activity levels across (i) the left dmPFC (supporting top-down processing) and left IFG and pMTG (supporting bottom-up processing) than in the PLP-Audio phase, and (ii) the left dmPFC and IFG than in the PLP-Question phase. Across both IELTS lectures, the test takers fixated more frequently within the test items during WLP tests than in the PLP-Question phase. However, they only spent larger proportions of their time fixating on the test items on average and in total during WLP test than in the PLP-Question phase for the IELTS-9 lecture. During both WLP tests, the test takers also visited the test items less frequently and spent larger proportions of their time visiting (i.e., on average and in total) than in the PLP-Question phase. Lastly, the test takers only performed better with higher test scores for IELTS-11WLP than IELTS-11PLP. There was, however, no significant difference in test scores between IELTS-9WLP and IELTS-9PLP.
Discussion
The aim of this study was to investigate the effects of different test methods on (i) cognitive load by examining test takers’ gaze behaviors and brain activity patterns, and (ii) measured listening performance via their test scores. The three hypotheses of the study are discussed below.
In order to examine this hypothesis, the test takers’ brain activation patterns across regions supporting top-down and bottom-up language processing were measured. We found that test takers had lower brain activity levels across the left dmPFC, IFG, and pMTG during the WLP tests than in the PLP-Audio phase. These results are not only consistent with the findings of Aryadoust et al. (2020), but they also indicated that the test takers may have used “shallow listening” during the WLP tests (Field, 2009). Although the above-mentioned brain regions all facilitate auditory and visual comprehension, previous research showed the left IFG and pMTG (supporting bottom-up processing) are least activated especially in the presence of lower linguistic complexity (i.e., word as opposed to discourse comprehension), and when listening comprehension is facilitated by reading (Buchweitz et al., 2014; Buchweitz et al., 2009; Jobard et al., 2007; Michael et al., 2001). Compared with notetaking-while-listening during the PLP-Audio phase, the reduced activity level of the left dmPFC alongside the greater deactivation of the left pMTG during the WLP tests suggest that top-down processing (i.e., inference-making and global coherence-building) was negligible during the WLP tests and that test takers were most likely predominantly involved in bottom-up comprehension (i.e., comprehension of literal meaning) (Buchweitz et al., 2014; Ferstl et al., 2008; Ferstl & von Cramon, 2002; Jobard et al., 2007).
It is important to note that these results indicate that the WLP tests impose a lighter cognitive load upon the test takers than notetaking-while-listening in the PLP-Audio phase, which is in line with both the cognitive load theory (Sweller, 2011; Sweller et al., 2011) and the study by Aryadoust et al. (2020). However, our results contrasted with the findings of Field (2009), who suggested that the WLP tests induced a “heavier” cognitive load. Aside from differences in research methods, this difference in findings may stem from the researchers’ conceptualization of WM. It is possible that Field (2009) could have regarded WM as a unitary entity (Figure 4A), with a single system being responsible for processing a range of inputs regardless of the modality (i.e., visual or auditory). In contrast, the cognitive load theory is based on the concept that a person’s WM comprises multiple processes or subsystems that process information according to the information’s modality (Figure 4B; see Sweller et al. (2011)). The former view, however, only considered the “number” of tasks performed without accounting for the way in which the information was presented. From this perspective, it appeared that the test takers were managing three tasks concurrently during the WLP tests (i.e., reading of test items, listening to the texts, and answering of test items), whereas there were only two tasks being performed during the PLP-Audio phase (i.e., listening to the texts and notetaking).
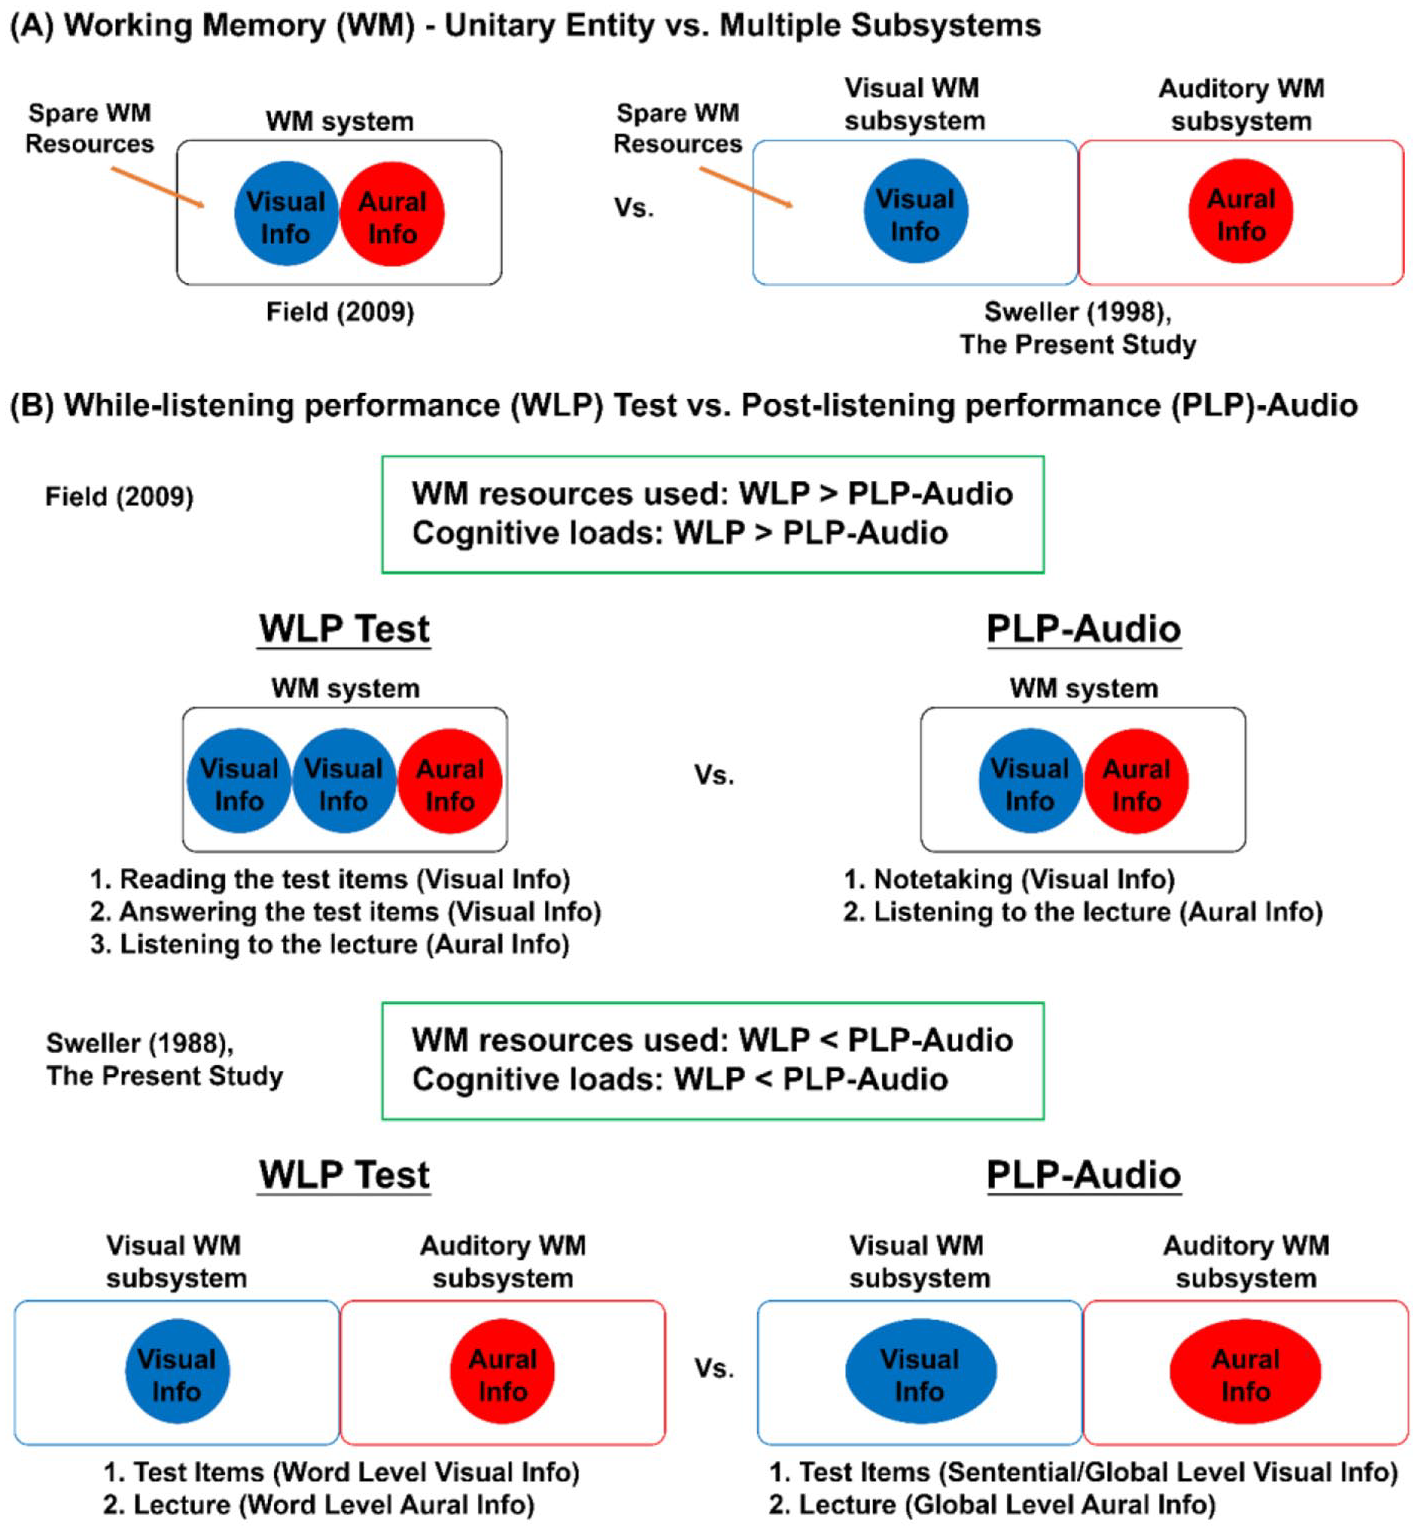
Disparate interpretations of cognitive load.
Overall, the results of Hypothesis One highlight the importance of building a theoretical framework that accounts for listeners’ cognitive architecture when investigating cognitive load and processes during listening test conditions. Ideally, this framework should incorporate the concept of a multi-component WM system that processes information based on its modality, rather than a single, unified construct that does not account for the mode of information received (Baddeley, 2012; Baddeley & Hitch, 1974).
In order to investigate the second hypothesis, we examined the test takers’ gaze behaviors and brain activity patterns while they answered the test items during both WLP tests and the PLP-Question phase. First, we found that the test takers’ fixation rate on the test items was approximately 1.5 times higher during the WLP tests (p < .0001) than in the PLP-Question phase. This finding suggests that test takers were moving their eyes quickly, likely searching for keywords or phrases in the test items to match against those presented in the audio texts. Notably, this is consistent with (i) Field’s (2009) findings that test takers used a keyword matching strategy and “shallow listening” during WLP tests, and (ii) the eye-tracking literature on cognitive load (Wang et al., 2018; Zagermann et al., 2016). However, this finding contrasts with Field’s (2009) conclusion that WLP poses higher cognitive load; as previously discussed, the temporal and spatial segregation of the input during the PLP-Question phase causes higher cognitive load, which is evident from the lower fixation rate.
Second, and in partial conformity with our hypothesis, the average proportion of time that the test takers spent fixating on the test items was lower for IELTS-11WLP than IELTS-11PLP (i.e., lower fixation durations during the WLP test than the PLP-Question test for IELTS-11, as expected). On the other hand, the test takers spent larger proportions of time fixating (fixation duration) on the test items (on average and in total) during the WLP tests than the PLP-Question test for one of the lectures, namely IELTS-9. This disparity between the lectures is likely owing to differences in the segment durations when the average fixation duration is expressed as a percentage. The average segment duration of IELTS-11WLP was approximately 17.2s longer than that of IELTS-11 PLP-Question, whereas the average segment duration of IELTS-9WLP was approximately 8.3s shorter than that of IELTS-9 PLP-Question. Notably, the average fixation durations on the test items were similar for WLP and the PLP-Question phase across IELTS-9 (i.e., WLP M = 233, SD = 35ms; PLP M = 228, SD = 43ms) and IELTS-11 (i.e., WLP M = 236, SD = 34ms; PLP M = 227, SD = 38ms). Thus, when the average fixation durations on the test items across the WLP and PLP-Question phase for IELTS-11 were divided by their respective segment durations, the average proportion of time spent on the test items was lower for the former than the latter. It is important to note that the above-mentioned average fixation duration data across all four tests were well within the normative ranges reported for silent reading (i.e., 225–250ms; see Rayner (1991)). Together, the gaze behavior data indicate that the test takers had no difficulty sourcing cues in the test items across both the WLP and PLP-Question tests.
Third, in terms of the eye-tracking data, we also found that the test takers’ frequency of visits (i.e., visit rate) to the test items was 1.2 times higher during the PLP-Question phase than in the WLP tests (p < .0001). The higher visit rate during the PLP-Question phase suggests that test takers sourced for answers by alternating their gazes back and forth between their handwritten notes and the test items shown on the monitor. As a result, they spent lower proportions of their time dwelling on the test items in each visit (i.e., lower normalized average visit duration) and across all visits (i.e., lower normalized total visit duration) when answering them during the PLP-Question phase compared with both WLP tests. This result is indicative that the test takers’ visual attention was spatially and temporally split when answering the test items during the PLP-Question phase as they could attend to either their notes on the paper or the test items on the computer screen at any given time. Under such circumstances, the test takers will need to temporarily maintain the spatially and temporally segregated visual information within their WM, and then integrate it with their mental representation of the audio text during the PLP-Question phase.
Taken together, these findings and interpretations conform with our neuroimaging data, which showed that the test takers had lower brain activity across the left IFG and dmPFC during the WLP tests than in the PLP-Question phase. Additionally, this also indicates that listening-while-answering test items during the WLP tests require less bottom-up and top-down processing than answering test items in the PLP-Question phase. Despite the significant differences in activation patterns in the left IFG, there was no significant difference in the activity level of the left pMTG. In line with Jobard et al. (2007), the overall activity patterns of the left IFG (i.e., positive β values) and pMTG (i.e., negative β values) during the PLP-Question phase suggest that the test takers processed the test items at word level or in a bottom-up fashion. Apart from lexico-semantic processing (Buchweitz et al., 2014; Buchweitz et al., 2009; Jobard et al., 2007; Michael et al., 2001), the involvement of the IFG during the PLP-Question phase may reflect its role in recollecting episodic details owing to its functional connectivity with an area responsible for long-term memory, that is, the left hippocampus (Wais et al., 2010). Based on these findings, it is postulated that the test takers may have regenerated a mental representation of the audio texts during the PLP-Question phase and searched for keywords or phrases on their notes to match against the test items while answering. Evidently, this differs from the answering process during the WLP tests as test takers predominantly rely on the latter keyword matching strategy. Lastly, the higher activity in the dmPFC during the PLP-Question phase than in the WLP tests indicates that the test takers may have used top-down processing by applying their world knowledge when answering the test items. Overall, the results from testing Hypothesis Two are consistent with the findings of Hypothesis One, as both sets of results indicate that the WLP tests impose lower cognitive load upon the test takers than the PLP tests.
It is interesting to note that our neuroimaging data for the WLP tests and the PLP-Question phase contrasted Aryadoust et al. (2020), as they reported that their WLP tests induced a heavier cognitive load compared with the PLP-Question phase (but lower cognitive load compared with the PLP-Audio test). This disparity between our study and Aryadoust et al.’s (2020) findings may be a result of the differences in the types of test items used across the studies given that multi-choice questions (MCQs) formed the majority in the listening tests of Aryadoust et al. (2020), whereas fill-in-the-blanks items were used in this study. The MCQs used in Aryadoust et al.’s (2020) study would require test takers to evaluate the statuses of several propositional information in the options, and this might have promoted the reading of test items at the sentential and global levels during answering. In contrast, the fill-in-the-blank items in the WLP tests may draw the test takers’ visual attention at word level (i.e., bottom-up processing), leading to the adoption of keyword matching strategy. This could explain why the left dmPFC, IFG, and pMTG were significantly more activated when answering MCQs during the WLP tests in Aryadoust et al.’s (2020) study, but significantly less activated when answering fill-in-the-blank items in the present study. Furthermore, the left dmPFC was activated while answering MCQs during the PLP-Question test in Aryadoust et al.’s (2020) study, but it was not significantly activated while answering the fill-in-the-blank items during the PLP-Question test in the present study. This finding suggests that the type of test items used, as well as the test method, may influence test takers’ cognitive load and cognitive processes while answering test items. This possibility is in line with the findings of In’nami and Koizumi’s (2009) meta-analysis, as MCQs were reportedly easier to answer than their open-ended counterparts (including fill-in-the-blank items), indicating that MCQs imposed lower cognitive load as they do not require answer production.
Overall, our study showed that the WLP tests imposed lighter cognitive load than PLP tests. In regard to the test scores, we found that the test takers performed better with higher test scores only for IELTS-11WLP than in IELTS-11PLP. Similarly to the results of Aryadoust et al.’s (2020) study, there was no difference in test scores between IELTS-9WLP and IELTS9-PLP. This inconsistency in measured listening performance across the WLP tests in the present study may be attributed to the test takers’ limited visual and auditory WM processing capacities. The absence of differences in test scores between IELTS-9WLP and IELTS-9PLP suggests that the test takers were not only capable of maintaining the audio text and test item information within their WM while answering during IELTS-9WLP, but also the audio text information while notetaking in IELTS-9PLP. As there was also no difference in test scores between IELTS-11PLP and IELTS-9PLP, we posit that the test takers were equally capable of handling the audio text information while notetaking across both PLP tests. In contrast, it is probable that the amount of visual and auditory information would have exceeded the test takers’ visual and auditory WM capacities while answering during the IELTS-9WLP test than in the IELTS-11WLP test. Notably, the average duration of the audio segments for the IELTS-9WLP test (i.e., 31.7s) was shorter than that for the IELTS-11WLP test (i.e., 57.2s). With shorter durations, the density of information presented in each segment is likely higher in the IELTS-9WLP test than in the IELTS-11WLP test. When encountering higher density of information, test takers may have had fewer cognitive resources available to maintain both existing and incoming information within their WM during the IELTS-9WLP. Importantly, our results were similar to Mayer et al. (1999), who reported that undergraduates showed no difference in recalling and transferring knowledge acquired from a multimedia presentation regardless of whether the narrations and animations were concurrently or successively presented in small chunks. With larger chunks, however, the recall and transfer of knowledge performance were better when the narrations and animations were simultaneously presented (Mayer et al., 1999).
The inflated test scores in IELTS-11WLP, together with the test takers’ use of keyword matching strategy and their lower cortical activity during comprehension, suggest that the test is probably confounded by sources of construct-irrelevant variance (Messick, 1996). Such sources of variance involve the test takers in cognitive processes that are not entailed in the focal construct definition and this in turn allows test takers to use test-specific strategies that differ from those demanded by real-world tasks in the target language use domain (Messick, 1996). In line with Mayer et al. (1999), the construct-irrelevant phenomenon (WLP vs. PLP format) is more apparent when the tests are presented in longer segments (i.e., IELTS-11WLP). Although this study did not specifically compare the differences in gaze behaviors and brain activity patterns between IELTS-11WLP and IELTS-9WLP, the patterns observed from the test takers’ frequency of visits to the test items (Figure 3G), and their average proportion of time spent on fixating and visiting the test items (Figures 3B and 3E) suggest that the durations of the audio texts can affect the cognitive load and processes involved. Extending from Aryadoust et al. (2020), who also presented their audio texts in shorter segments (i.e., approximately 28.5s), these findings reinforce the notion that shorter audio texts are less likely to demand test-specific processes that induce construct-irrelevant variance in test scores. Although the lengths of the segmented audio texts presented in Field’s (2009) study are unknown, the author’s results (i.e., WLP test scores < non-test PLP scores) may be attributed to the fact that the listeners’ performance was only scored by being based on their ability to identify the main points of the lectures. Nonetheless, the present study suggests that lengthier listening segments can disadvantage test takers who take the tests in PLP rather than in WLP formats, owing to influences over their cognitive load.
Limitations and future directions
To measure event-related brain activity responses, this study was limited by the need to segment the listening tests. Nevertheless, our data suggest that the methods used in this study allowed us to gauge the potential impact of test methods on test takers’ cognitive load and to assess listening performance in full-fledged high-stakes tests. To improve our understanding of the effects of different test methods, we recommend that test developers and researchers adopt our methods, namely eye-tracking and fNIRS technology (as opposed to self-reports or verbal elicitations), to examine the neurocognitive mechanisms involved in listening tests while also identifying and minimizing potential sources of construct-irrelevant variance.
It should be noted that one of the reviewers of this paper pointed out that our usage of LCC is “not a standard methodology for selecting similar texts” and may be “a complex way to do a simple job.” The reviewer also suggested that “how to best match texts based on multivariable data is one that needs a good answer and standardized methodology” in language assessment work. Furthermore, this reviewer observed that authors contributing to the natural language processing literature on text similarity go beyond Coh-Metrix, and that this information needs to be surveyed and communicated to language testers. Here, we would like to echo this suggestion and call.
Conclusion
To our knowledge, this is the first study that integrates eye-tracking, neuroimaging, and test scores to examine test method effects and cognitive load in listening assessment. By incorporating Sweller’s (1988) cognitive load theory into our theoretical framework, we were able to explain the observed test method effects on gaze behavioral measures and brain activity patterns. Furthermore, we were able to resolve most of the outstanding inconsistency in the literature on cognitive load and test performance across listening test methods. Importantly, our study suggests that the length of the listening stimuli used may, in part, contribute to inconsistency in participants’ test performance and biometric data (i.e., gaze behavioral measures and brain activity patterns), despite similarity in listening texts’ linguistic features. In addition, different types of test items (e.g., fill-in-the-blank items vs. MCQs) can affect cognitive load and the processes involved in answering the items during listening tests.
Footnotes
Appendix 1
Appendix 2
Appendix 3
Appendix 4
Acknowledgements
We thank the anonymous reviewers for their careful reading of our manuscript and insightful comments.
Funding
The authors disclosed receipt of the following financial support for the research, authorship, and/or publication of this article. This project was supported by the National Institute of Education of Nanyang Technological University, Singapore, under its Academic Research Fund (Project ID: RI 1/18 VSA). Any opinions, findings, and conclusions or recommendations expressed in this material are those of the authors and do not reflect the views of the National Institute of Education.