
Abstract
The last three decades have seen an increase of tests aimed at measuring an individual’s vocabulary level or size. The target words used in these tests are typically sampled from word frequency lists, which are in turn based on language corpora. Conventionally, test developers sample items from frequency bands of 1000 words; different tests employ different sampling ratios. Some have as few as 5 or 10 items representing the underlying population of words, whereas other tests feature a larger number of items, such as 24, 30, or 40. However, very rarely are the sampling size choices supported by clear empirical evidence. Here, using a bootstrapping approach, we illustrate the effect that a sample-size increase has on confidence intervals of individual learner vocabulary knowledge estimates, and on the inferences that can safely be made from test scores. We draw on a unique dataset consisting of adult L1 Japanese test takers’ performance on two English vocabulary test formats, each featuring 1000 words. Our analysis shows that there are few purposes and settings where as few as 5 to 10 sampled items from a 1000-word frequency band (1K) are sufficient. The use of 30 or more items per 1000-word frequency band and tests consisting of fewer bands is recommended.
Over the last three decades, a large number of tests aimed at measuring an individual’s vocabulary level or overall vocabulary size have been created and promoted. Levels tests are designed to measure, for example, how many of the 2000 or the 3000 most frequent words a person knows, while size tests are designed to obtain a measure of all the words a person knows. An example of the former is the Vocabulary Levels Test (VLT), a matching-format test originally created by Paul Nation in 1983, which has undergone a number of updates and revisions (Beglar & Hunt, 1999; McLean & Kramer, 2015; Nation, 1990, 2001; Schmitt et al., 2001; Webb et al., 2017). A productive version of the test has also been created, namely the Productive Vocabulary Levels Test (PVLT) (Laufer & Nation, 1999), as has a format that targets vocabulary levels in the aural mode, the Listening Vocabulary Levels Test (LVLT) (McLean et al., 2015). Paul Meara and colleagues have designed at least four tests employing a yes/no format: the Eurocentres Vocabulary Size Test (EVST) (Meara & Jones, 1990); the X_Lex Test (Meara & Milton, 2003), with a listening version called AuralLex (Milton & Hopkins, 2005); the Y_Lex Test (Meara & Miralpeix, 2006); and the V_YesNo v1.0 (Meara & Miralpeix, 2016). One of the more recent and widespread tests of monolingual overall vocabulary size is the Vocabulary Size Test (VST) (Nation & Beglar, 2007), which exists in two versions in terms of length (1–14K, 1–20K), and in nine bilingual versions (see, e.g., Elgort, 2013, for Russian-English; Karami, 2012, for Persian-English; Nguyen & Nation, 2011, for Vietnamese-English; and Zhao & Ji, 2018, for Mandarin-English). There is also a test called LexTALE (Lemhöfer & Broersma, 2012), designed to be a quick and practically feasible test of vocabulary knowledge for advanced second language (L2) speakers of English. The proliferation of level and size tests is concomitant with evidence of high correlations between scores on these tests and either global English proficiency or a subskill (see, e.g., Alderson, 2005; Gyllstad, 2007; Laufer, 1997; Meara & Jones, 1988; Stæhr, 2008, 2009). In addition, research has emerged indicating that mastery of 98% of words of various 1000-word bands is necessary for conducting various communicative functions (Hu & Nation, 2000; Schmitt et al., 2011; Schmitt & Schmitt, 2014): According to recent estimates, language users need to possess mastery of the first 8000 to 9000-word families for reading unsimplified English texts such as novels and newspapers, and the first 6000 to 7000-word families to take part in spoken conversation (Nation, 2006; Schmitt, 2008).
From this follows a need for tests of vocabulary knowledge that can accurately gauge language users’ vocabulary levels and sizes, and that can provide reliable and valid score inferences. This is true for research and teaching purposes alike. What all the tests listed previously have in common is an approach by which the items (words) appearing in the tests are sampled from various frequency lists. These lists are based on large corpora and rank words in order of descending frequency, often organized into bands of 1000 words (Nation, 2013, 2016). Thus, English vocabulary can be divided into such bands, for example, the first 1000 most frequent words (1K), the second 1000 most frequent words (2K), and so on. Since it is not possible to test all the words from the underlying population of words, as such tests would simply become too long and impractical, sampling of words is necessary. This is conventionally done with a certain ratio from frequency bands of 1000 words. For example, a sampling ratio of 10:1000 means that 10 out of 1000 words are selected for inclusion in the test. The assumption is that if a sample of words taken from a frequency band is put in a test, and a language user can be shown to know a certain proportion of those sampled words, then by extrapolation the language user is expected to know the same word proportions in the whole frequency band.
Although size tests can be more reliable in estimating the average vocabulary size of a group of learners, frequently educators are interested in learning the vocabulary size of individual learners. In such cases, vocabulary tests with a small number of items per section may yield wildly inaccurate estimates of learner vocabulary size. The question, therefore, is how many items are necessary to be representative of the 1000-word frequency band from which the target words are sampled. A look at existing tests shows that the number of target words sampled to represent all the words in a 1000-word band ranges from five items in the 20K VST (Coxhead et al., 2015), 10 items in the 14K VST (Nation & Beglar, 2007), 30 items in the 10K VLT (Schmitt et al., 2001) and the 10K PVLT (Laufer & Nation, 1999), to 40 items in the Yes/No checklist test (Meara, 1992). Clearly, in order to make any test usable from a practical perspective, a trade-off needs to be reached between the validity and the representativeness of the test, and its practicality. However, it is arguable that in very few cases are the sampling size choices made supported by clear empirical evidence. According to Kremmel (2016), the development of vocabulary tests often appears to be based on the design principles of already existing tests and without test constructors taking a critical approach towards such principles. The number of sampled words from an underlying population of words is clearly one of those design principles that is, in fact, arbitrary.
The question of what constitutes a representative sample in vocabulary size and levels tests has to date received surprisingly little evidence-based attention in the literature. Neither Gyllstad (2012) nor Zhang (2013) specifically mentioned sample size in their validation of the 14K version of the VST. However, Beglar (2010), in a Rasch-based validation study of the same VST version, argued that a sampling ratio of 10:1000 “is more than sufficient to estimate the test takers’ lexical knowledge with a high degree of precision” (p. 107). As pointed out by Kremmel (2018), however, Beglar later in his article gave evidence of the vulnerability of such low sampling ratios when discussing one particular 10-word test section. Beglar (2010) wrote that it was easier than expected “in part due to one extremely easy item” (p. 109). Furthermore, Beglar (2010) argued that as few as five items per test section or frequency band are capable of yielding adequate reliability and item separation indices for the test as a whole. This is a correct observation, but it should be noted that reliability coefficients such as Cronbach’s alpha or Rasch person measurements are not values of representativeness. In addition, basic sampling methodology dictates that it is not the ratio of the population that is sampled that is important, but rather the size of the sample itself (De Veaux et al., 2008, p. 290).
A question related to adequate item sample size concerns the reliability of estimates of vocabulary size measures. With some tests having very low item sample sizes, it becomes all the more crucial that extrapolation from test scores to the assumed number of words known can be trusted. In the literature, few studies exist in which test takers’ scores on a vocabulary size or levels test are de facto compared with an independent criterion score. This type of study investigates to what extent a test taker’s score on, for example, a 10-item, multiple-choice, vocabulary-size-test section relates to the test taker’s actual measured knowledge of the underlying population of words. In one of the few studies to date, a validation study of the Vocabulary Levels Test (VLT), Schmitt et al. (2001) found that there was a mismatch in approximately 10% of the observed test takers’ scores. In a more recent attempt to investigate how item sample size may affect estimates of overall vocabulary size, Gyllstad et al. (2015) used an external criterion in the form of follow-up interviews on 100 items from a 1000-word band, and found that only 10 test items were not a sufficient sampling size for representing any frequency level. The tested frequency bands were 3K, 6K, and 9K, and the authors found that mismatches existed in 2–8% of the cases for underestimation, and in 11–26% for overestimation. Better correspondence between test item scores and demonstrated knowledge was found when gradually increasing the sample size to 15, 20, 25, and 30 items, respectively, per 1000-word family frequency level.
If the goal of a vocabulary test is to estimate learner vocabulary size or percentages of words known within various word bands, then it is essential that tests sample adequate numbers of vocabulary items. Adequate sampling not only affects the quality of the test instruments themselves, but it’s also important for pedagogy, because it is common to use the test scores for matching learners with suitable learning materials. If learners are believed to have mastery of word bands that, in fact, they do not, then assigning reading material for which that larger vocabulary is needed may lead to too many words being unknown. Schmitt et al. (2011) investigated how vocabulary knowledge affected reading comprehension based on data from 611 learners. The authors showed how a text coverage of 90% (with 10 words out of 100 unknown) yielded a text reading comprehension of 50%, a 95% coverage (with five words out of 100 unknown) 60% comprehension, and a 100% coverage (all words known) 75% comprehension. Thus, if educators think that a learner will have a 95% coverage for a text they want the learner to comprehend, but in which the learner’s true knowledge corresponds to 90%, then the reading comprehension will be less, as there are more unknown words than what is necessary for reading comprehension (see, e.g., Beglar et al., 2012, and Kramer & McLean, 2019, for studies where the reading materials used were assigned based on the participants’ vocabulary scores and pertinent text coverage levels). Thus, as research models and theories are based on measurements, if researchers’ measurement of vocabulary knowledge is incorrect, then this may, in severe cases, lead to inappropriate support or rebuttal of such models.
In this article, we will use empirical data to illustrate the necessity of adequate vocabulary word sample sizes, and demonstrate the effect that increasing vocabulary word sample sizes has on confidence intervals of individual learner vocabulary knowledge estimates and the inferences that can safely be made from test scores. We will draw on a unique dataset consisting of 103 adult L1 Japanese test takers’ performance on two English vocabulary test formats, each consisting of 1000 items. The following research question will be addressed: How well do estimates of individual learners’ knowledge of 1000-word vocabulary levels drawn from various word sample sizes correspond to their measured knowledge of that vocabulary level when all 1000 words are tested individually?
Essentially, this can be addressed by determining confidence intervals for size estimates of vocabulary size and levels tests. Before illustrating this with empirical data, we will first discuss what the statistical literature reports about the number of items required to poll vocabulary size accurately.
Sampling words from an underlying population
Although rarely stated explicitly in the L2 vocabulary literature, the practice of estimating how many words a learner knows on a large wordlist by examining how many correct answers a learner attains on a shorter test of those words is analogous to the common statistical practice of inferring a population proportion by examining a random sample proportion. Suppose a pollster wishes to determine how many voters will vote “Yes” in an upcoming referendum. Rather than polling the entire population of voters one by one, they will typically poll a random or stratified sample of voters. The sample’s proportion of “Yes” votes is then inferred as a plausible, predicted proportion that may lie within the real population. The more voters that are polled, the smaller the poll’s margin of error is.
Much in the same way a pollster cannot poll every voter, when researchers wish to know how many words a learner knows within a given vocabulary level, practical considerations typically prevent researchers from testing the learner on every word in a vocabulary list or level of pedagogical interest, as this could result in a test of 1000 or more items. Instead, researchers test the learner on a smaller sample of these words, and determine the proportion of words that the learner knows within the sample through extrapolation. If 10 words are tested and the learner knows five, the sample proportion of known words is 0.5. Working on the assumption that the sample proportion of tested words and the population proportion of total words known within the vocabulary level are the same, researchers assume that the learner therefore knows 500 of the 1000 words within the vocabulary level.
However, the sample proportion will more closely approximate the total population proportion when researchers test larger numbers of words. For this reason, margins of error on polls become smaller with larger sample sizes. Following De Veaux et al. (2008, p. 461), the formula for determining the distribution of a sample proportion is shown in Figure 1.
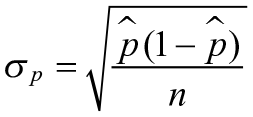
A formula for determining the distribution of a sample proportion.
In this formula, n is the sample size of the words on which the learner was tested, and
When using the formula, it becomes very clear that inferring how many words a learner knows within a 1000-word vocabulary level with a test of just five items will result in a large margin of error. For example, a learner who answers three of five items (60%) correctly on such a test will be expected to know approximately 600 of these words. However, by using a 95% confidence interval (p ± 1.96 SE), the actual number of words that such a learner knows may be anywhere between 171 and 1000. The corresponding 95% confidence interval for a test of 10 items (with the same assumption that the learner knows 60%) yields a range from 296 to 904. Although an improvement on a five-item poll, it remains an unacceptably large margin of error. If the number of sampled items is increased to 20, 30, or 40, the 95% confidence interval diminishes as expected, as can be seen in Table 1 (where the values for five, 10, 20, 30, and 40 items are shown).
95% confidence intervals for test item sample sizes of five, 10, 20, 30, and 40, and with an assumed score of 60%, for 1000 word frequency bands.
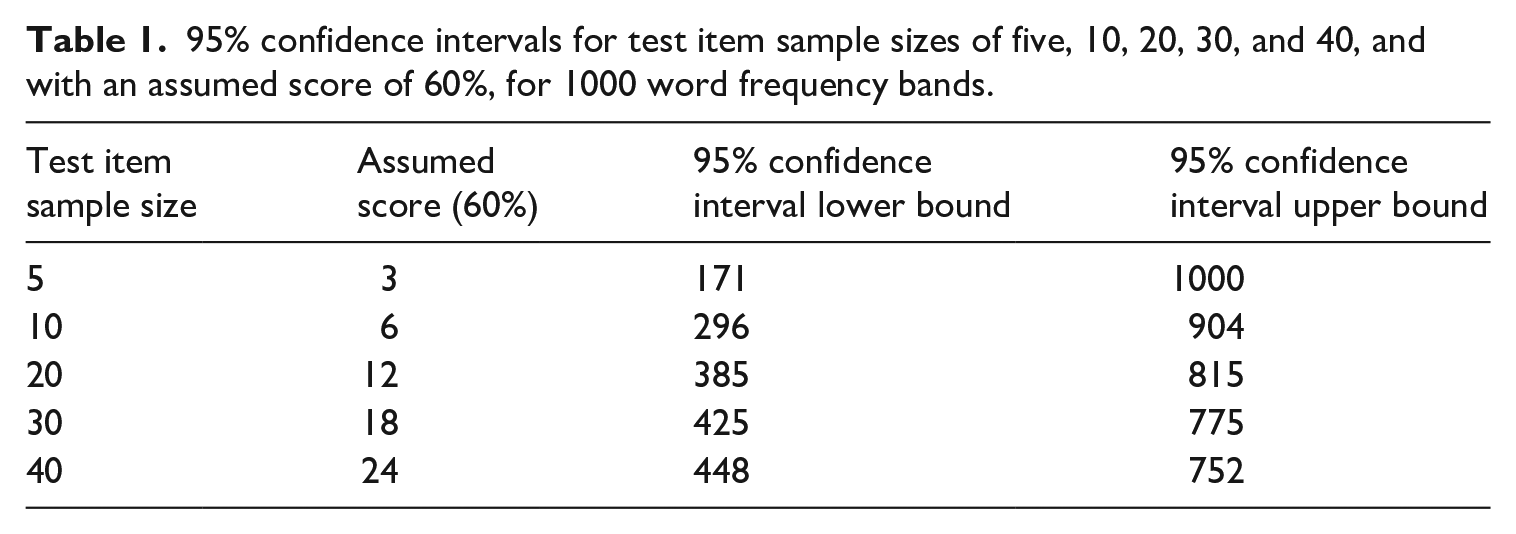
It is clear that tests of only five or 10 items do not fare well in this context. Although such small item samples may be of some use in determining the average number of words known by a larger group of learners, they provide very limited use as a diagnostic tool for individual learners.
In the remainder of this article, we will rely on a case study and a real data set to demonstrate how well the previously presented formula replicates real-world data, and make recommendations for how many items should be used in vocabulary tests employed for various purposes.
Using empirical data to illustrate the necessity of adequate item sample sizes
Methods
Participants
Although simulated data is occasionally used in demonstrations of statistical properties of vocabulary size tests (e.g., Stewart, 2014; Stewart & White, 2011; Stoeckel et al., 2016) (see also Meara, 2004, for applications to the investigation of attrition rates of words in mental lexicons), numerous vocabulary testing specialists have raised doubts about the validity of such practices (Laufer, 2005; Schmitt, 2010). Even though we are not, in principle, against the use of simulations, in order to mitigate such concerns, this demonstration will be conducted using data collected from real learners.
A total of 103 adult Japanese university students participated in the study. Their age range was 18–32 years. In terms of English proficiency, their mean (M) TOEIC score for listening and reading was 531.75 (SD = 194.4 points; see Figure 2). In relation to the CEFR (Council of Europe, 2001), this corresponds to a high A2 to a low B1 level. Their mean score on the reading section was 226.5 (SD = 101.9). The majority of the participants (n = 96) were undergraduate students of International English, whereas four participants were non-English majors in their third year, and three participants were master students of Applied Linguistics. All participants participated as volunteers, and were paid ¥980 per hour each for taking part in the study. Prior to agreeing to participate, they were informed about the research purpose, and they were asked to sign consent forms before the commencement of the research.
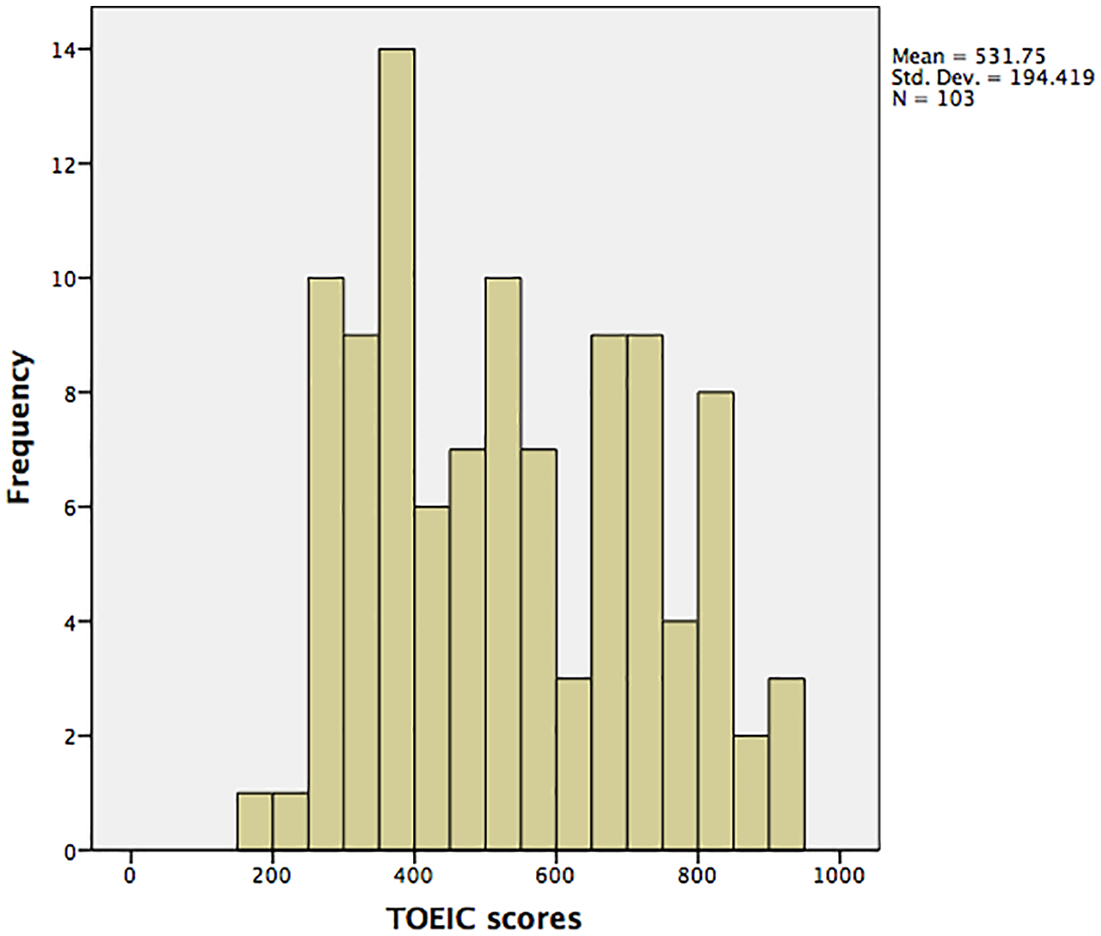
A histogram of TOEIC scores for the participants in the study.
Test instruments
There are many test formats available for testing learners’ vocabulary knowledge. Laufer and Goldstein (2004) have proposed that the most important word knowledge component is the establishment of form–meaning links. Based on their work, but avoiding the terms “active” and “passive,” Schmitt (2010) proposed four terms capturing what type of form-meaning knowledge is targeted in various test formats. These are form recognition, meaning recognition, form recall, and meaning recall. In terms of difficulty, Laufer and Goldstein reported the following difficulty continuum (from most difficult to least difficult) based on testing 435 high school and university-level L2 learners of English (using Schmitt’s terminology): form recall < meaning recall < form recognition < meaning recognition. Of these, meaning recall is seen as the type needed for reading, that is, the ability through retrieval to recall a word meaning when processing its orthographic form in a text (Gyllstad et al., 2015). In the meaning-recognition format, test takers are given a target L2 word and asked to choose among four options where only one of these matches the meaning of the target word (see the “Test formats” section). This format is frequently used in some of the more influential tests of vocabulary size and vocabulary levels tests: the VST and the VLT. These two formats have also been subject to recent debate, in particular with regard to the question of which format is the better predictor of reading comprehension (see Gyllstad et al., 2015; Laufer & Aviad-Levitzky, 2017). For these reasons, we decided to use these two formats in the present study. The participants thus completed two different vocabulary tests assessing their knowledge of the same 1000 words, but where each of the two tests employed a different item format. Both tests were administered through a survey website (https://www.surveymonkey.com), and no time limit was imposed.
Target word selection
As was reported earlier, previous research on the two types of vocabulary knowledge investigated here (meaning recognition and meaning recall), and the pertinent item formats used, has shown that they are different in terms of difficulty; when the same words are tested, rather different mean scores are typically observed for the two formats (Laufer & Goldstein, 2004; Schmitt, 2010). As a certain amount of variance is required to arrive at meaningful data for our purposes, it was necessary to use a frequency band that would yield such variance. As a consequence, we wanted to use a 1000-word frequency band that would not result in any floor or ceiling effects in any of the two item formats. Based on pilots conducted with learners of very similar levels of proficiency in English to those aimed for in the main study, trials with the 2K and 3K bands indicated that the more advanced learners of the targeted population would likely master the 2K band, but not the 3K band. For this reason, it was decided to use the 3K band in the present study.
The English target words used were the third-1000 most frequent flemmas (3K) from the New General Service List corpus (Browne et al., n.d.) based on the Standard Frequency Index (SFI) of the flemma within the corpus. Following Pinchbeck (2014) and McLean (2018), a flemma is based on the more commonly known concept of lemma, in that it consists of a headword and its inflected, irregular, and reduced forms (n’t), which are of the same part of speech. However, unlike the lemma, it groups identical forms of different parts of speech. Consequently, the verb “dance” and the noun “dance” are different lemmas, but members of the same flemma. SFI adjusts for the relative size of different sub corpora within a corpus from which a word list is created.
In the following, we describe the design of each item format, and we account for the scoring procedures and justifications for the order in which the test formats were administered.
Test formats
Meaning recall
The 1000 meaning-recall items were presented in a decontextualized sentence. A contextualized sentence would provide clues as to the word class of the target word, and would shows how the word appears in use. It also gives associational assistance to the test taker so that the meaning of the target word can be accessed (Henning, 1987). An example of a decontextualized item is shown in Example 1, with the instructions for how to respond. The target word in Example 1 is underlined and put in bold.
Example 1. The
Please read each sentence carefully. Please translate the underlined word into Japanese. Please be sure to answer with the correct part of speech. For example, if the underlined word is a verb please make sure to answer with a verb. The answer can be a single word or an explanation of the word in Japanese. There are several different ways to answer.
The items were marked dichotomously by two Japanese native speakers. Using a Cohen’s Kappa analysis, an interrater reliability value of .935 was established. Not surprisingly, in the light of the large number of items, the total test yielded a very high Cronbach’s Alpha reliability value of .996.
Meaning recognition
The 1000 meaning-recognition items presented participants with the same context sentence that was used in the test of meaning-recall knowledge, as using different contexts would in effect make it into a different item, and consequently, it would not be possible to rule out any influence of the context on item answers. The target word was underlined and put in bold. Participants were asked to select the most appropriate answer out of four possible choices. These answer choices were written in the participants’ L1. In accordance with Nation (2012), distractors with definitions closely related to the correct answer were not chosen as they can mislead learners. Example 2 is a meaning-recognition item (but without the English words in parentheses in the actual test): Example 2. The 聖歌隊 (choir) 広告 (advertisement) 映画館 (cinema) 広場 (an open space)
Please read each sentence carefully. Please select the answer with the closest meaning to the underlined word. Please answer each question.
In keeping with Nation’s instructions for use of the VST (2012), learners were required to attempt all items. The 1000 items were marked dichotomously with only one possible correct answer, and yielded a Cronbach’s alpha reliability estimate of .994.
The TOEIC
Participants’ TOEIC data were collected directly from their institution or the participant submitted a copy of their TOEIC certificate. The most recent versions of the TOEIC reading and listening tests released in 2016 in Japan were used.
Procedures
Participants took the meaning-recall test before the meaning-recognition test (Laufer & Goldstein, 2004; Nation, 2013; Nation & Webb, 2011; Schmitt, 2010). This is because of an assumed hierarchy of difficulty within vocabulary format modalities, which means that all participants who possess meaning-recall knowledge also possess meaning-recognition knowledge of the same word (Laufer & Goldstein, 2004). Conversely, however, if a participant possesses meaning-recognition knowledge, it cannot be assumed that the same participant possesses meaning-recall knowledge. Prior to completing the meaning-recognition items it is assumed participants have not been exposed to any items presenting both the form and meaning of the target word, and so will not have developed any mapping of form and meaning. Since the meaning-recognition items do link form and meaning, they were responded to last by the participants. Consequently, a conventional counterbalancing procedure to control for order effects was not possible, as questions in the meaning-recognition modality would reveal answers to questions targeting the same words in the meaning-recall modality. Therefore, the meaning-recall test was administered before the meaning-recognition test for all participants.
In theory, even though completing test questions measuring knowledge of the same word twice might have resulted in priming, which could have made it easier to answer later versions of the tests, it is unlikely in this study that a test order effect was present, and any priming effect was minimal owing to a number of factors. First, the learners saw the form and meaning together for the first time in the meaning-recognition test (the second test). Second, the participants completed a large number of items. Third, the order in which the items in each test appeared was randomized. Fourth, the participants did not complete the tests consecutively in one sitting. Fifth, the participants were not informed that they were completing questions measuring knowledge of the same 1000 words two times. Finally, the order of the 1000 items within each test was randomized to prevent common items at the end of test versions from becoming susceptible to a fatigue effect. All this made it unlikely that one version of the test would tangibly affect a subsequent version.
The participants completed the two tests online in a small computer room in their academic department, accompanied by a proctor. There were at most eight participants taking the tests at any one, time with ample space between them. At the outset of the test administration, the participants were told that the two tests had to be completed within two weeks, and also that one test, but not two, had to be completed in one single sitting. In the end, all participants did the two tests within one week. The participants were also told not to use dictionaries and similar resources, and were monitored accordingly to ensure that this restriction was followed. Furthermore, the software through which the tests formats were administered did not indicate whether words were correctly or incorrectly spelled, and there was no predictive text function available. Importantly, the participants were also told not, in any way, to look up the meaning of any of the words that they had experienced in a previous test. As the tests were very long, the participants were encouraged to take short breaks, so as not to suffer from test fatigue and lapses of attention. During these short breaks, the participants were asked to stay in the room where they were completing the tests, but they were obviously allowed to visit a rest room if needed. Thus, the participants were, on the whole, closely monitored. These measures ensured that the participants did the tests independently and without any help. It took the participants on average 118 minutes (SD = 72) to do the meaning-recall test and 84 minutes (SD = 22) to do the meaning-recognition test.
Data analysis
In order to illustrate the effect of insufficient item sample numbers on individual learners’ vocabulary knowledge estimates, we used bootstrapping. As explained by LaFlair et al. (2015), bootstrapping works by “drawing, with replacement, the values from the observed sample to obtain thousands of bootstrapped samples to improve the accuracy of confidence interval estimation for one or more statistics” (p. 46). Larson-Hall and Herrington (2010) provided a good account of its viability in L2 research. Two commonly suggested reasons for using bootstrapping are small sample sizes and violations of normality in data distributions; bootstrapping can increase statistical power and Type II errors. Although our study had a decent sample size of participants (N = 103), the bootstrapping allowed us to investigate our data in a more robust way. More specifically, bootstrapping was used because, although knowledge estimates can and will vary from test to test, if enough tests are examined, then eventually a distribution of knowledge estimates will emerge, which can illustrate not only average knowledge estimates, but also the distributions of these estimates, and the extent of variance that can be found across different estimates (with the less variance seen, the better). Our focus is on variations within vocabulary knowledge estimates of individual learners.
Using code in Microsoft Excel (Version 16.42) to apply a bootstrapping methodology (see, e.g., Teknomo, 2017, for a principled approach), we repeatedly sampled with replacement responses for the 1000 items for each test version. This created thousands of simulated tests. To illustrate the representativeness and accuracy of samples of different numbers, tests of the following lengths were created: five, 10, 20, 30, 40, 50, 60, 100, and 200 items. Items were randomly selected and the procedure also prevented the same item being selected twice within a single test. The inclusion of the specified test lengths was motivated as commonly used tests have these sample ratios, for example, the 20K VST: 5:1000 (Coxhead et al., 2015); the 14K VST: 10:1000 (Nation & Beglar, 2007); the VLT, the PVLT and the LVLT: 30:1000; and the Yes/No checklist test: 40:1000 (Meara, 1992). In addition, we wanted to see how some higher sampling ratios would fare, justifying the inclusion also of test lengths such as 50, 60, 100, and 200. As it has been found that using 1000 iterations is appropriate in order to obtain accurate confidence intervals (Wasserman & Bockenholt, 1989), we ran 1000 bootstrap samples for each of the two test conditions, for the nine test lengths, and for each of the 103 participants.
Results
In terms of results, we first consider descriptive statistics for the scores on the two vocabulary test formats. As shown in Table 2, as expected, the mean score for the meaning-recall test format was lower than that for the meaning-recognition test format. For both test formats, the range is considerable. The difference between the score distributions for the two test formats is something that will be important for some of the subsequent analyses reported later in the article, and consequently, this is a topic to which we will return.
Descriptive statistics for data collected from the two 1000-item test formats.
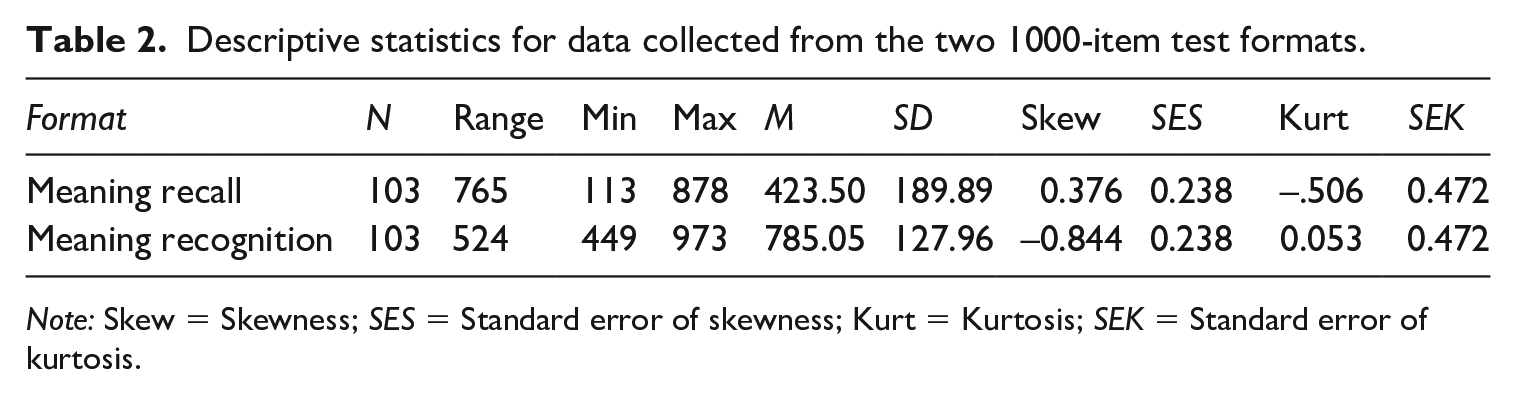
Note: Skew = Skewness; SES = Standard error of skewness; Kurt = Kurtosis; SEK = Standard error of kurtosis.
As a next step, consider Figure 3, in which data from one of the 103 participants (“Learner 10”), are visualized, based on the bootstrapping approach. The actual score on the 1000-word meaning-recognition test for this learner was 750. The figure shows knowledge estimates for this test format’s test lengths of five, 10, and 100 items. It is evident that with a test of five items (the mid-grey bars), only six different vocabulary knowledge estimates are possible: 0, 200, 400, 600, 800, or 1000 words. Although the most common estimate was 800 words, just 50 words above the true number of words known, estimates of 600 and 1000 words known are also very common, and in some cases estimates are as low as 0–200 words. Clearly, at the very low sample ratios, the “resolution” of vocabulary knowledge estimates is quite poor.
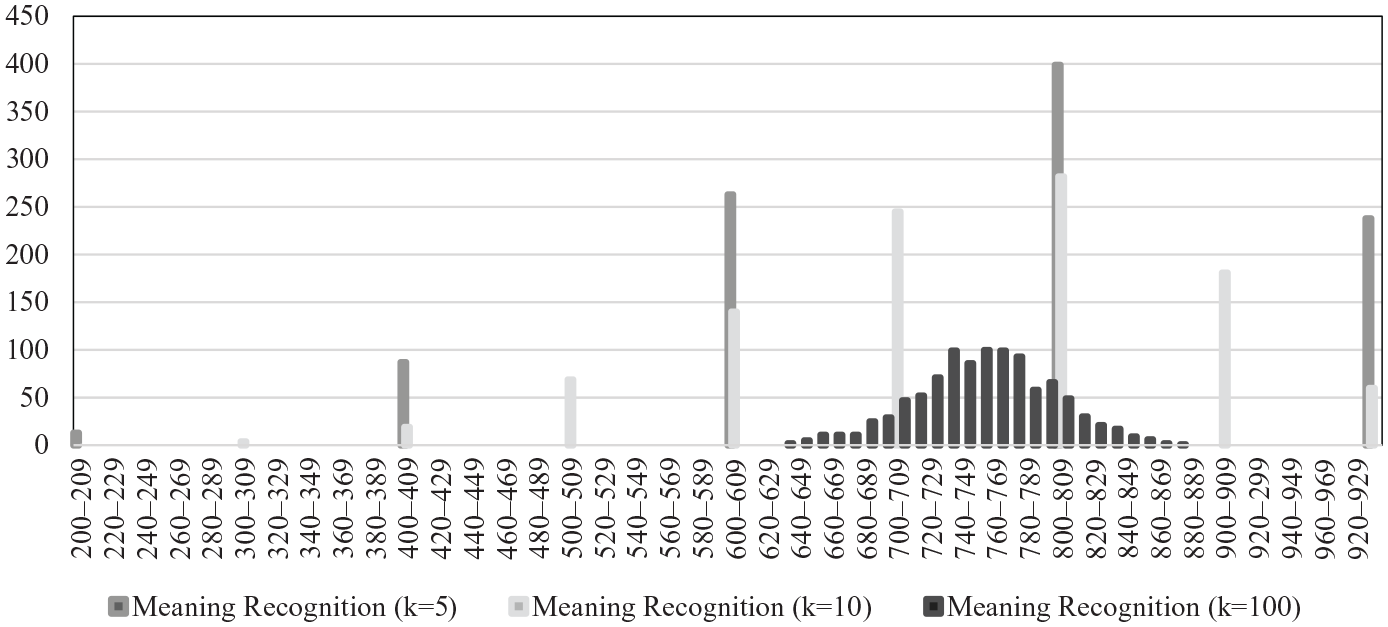
Vocabulary knowledge estimates using meaning-recognition tests with five, 10, and 100 items.
With a test of 10 items (the light grey bars), 10 different vocabulary knowledge estimates are possible: 0, 100, 200, 300, 400, 500, 600, 700, 800, 900, or 1000 words. Here, the most common estimate was also 800 words, but estimates of 700 and 900 words known are also very common, and some cases estimates are as low as 400 words. If using a considerably larger number of items, 100, (dark grey bars), there is a distinct improvement, with the span of estimates narrowing down. A large number of estimates are between 700 and 800.
Another visualization of data from Learner 10 is shown in Figure 4 (with scores shown in Table 3). This time, the test lengths are 20, 50, and 100 items. As can be seen, the vocabulary knowledge estimates become increasingly narrow with the use of more items. It is interesting to note that the average mean estimates are almost identical for 50 and 100 items. This suggests that an increase of the number of sampled items beyond 50 does not yield a different average mean estimate. However, it is clear that the confidence intervals decrease with the 100-item test length.
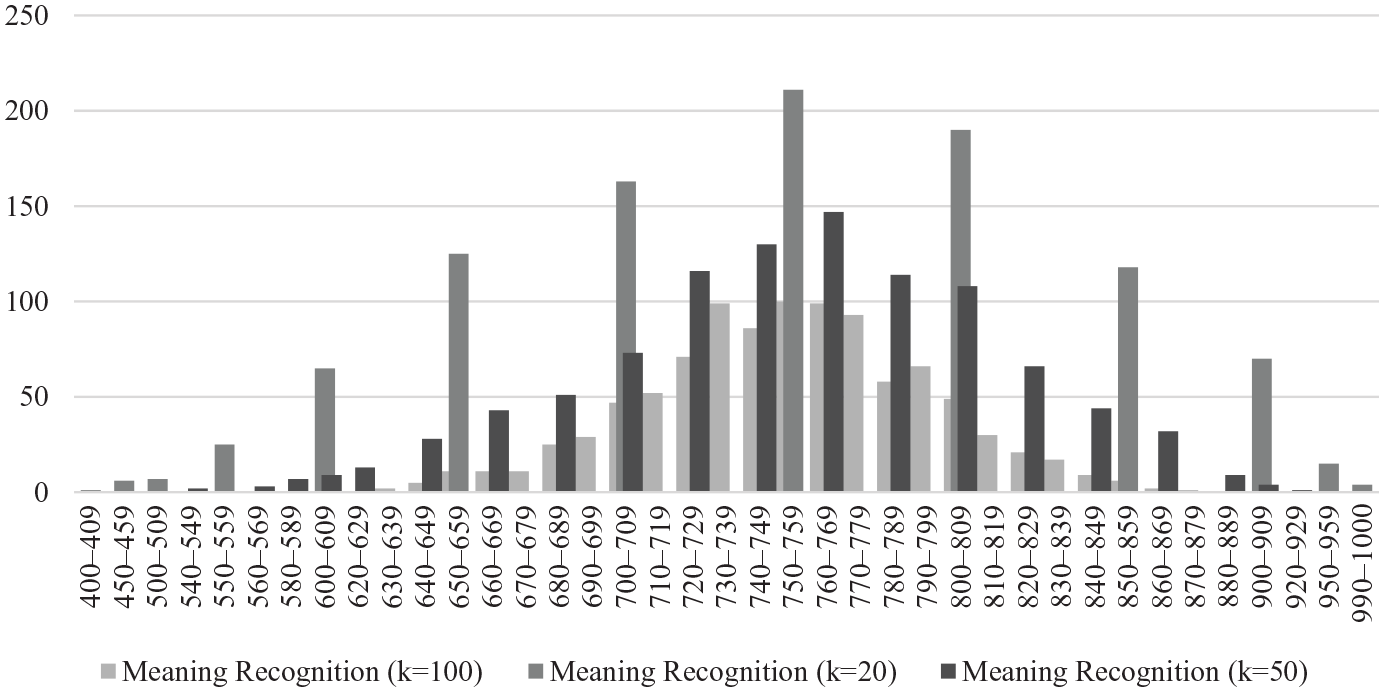
Vocabulary knowledge estimates using meaning-recognition tests with 20, 50, and 100 Items.
Average vocabulary knowledge estimates with confidence intervals for Learner 10, for test lengths of 20, 50, and 100 Items.
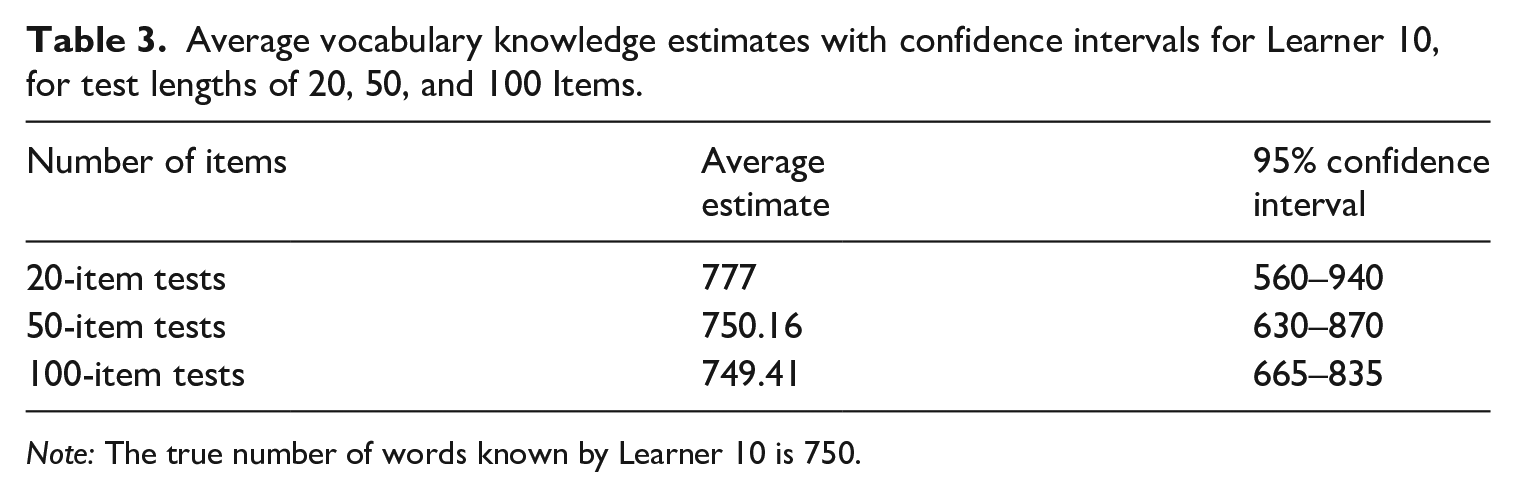
Note: The true number of words known by Learner 10 is 750.
This type of information allowed us to calculate average differences in vocabulary knowledge estimates and true numbers of words known for the whole participant group of 103 learners. The results from the bootstrapping analysis for the whole participant group are shown in Figure 5.
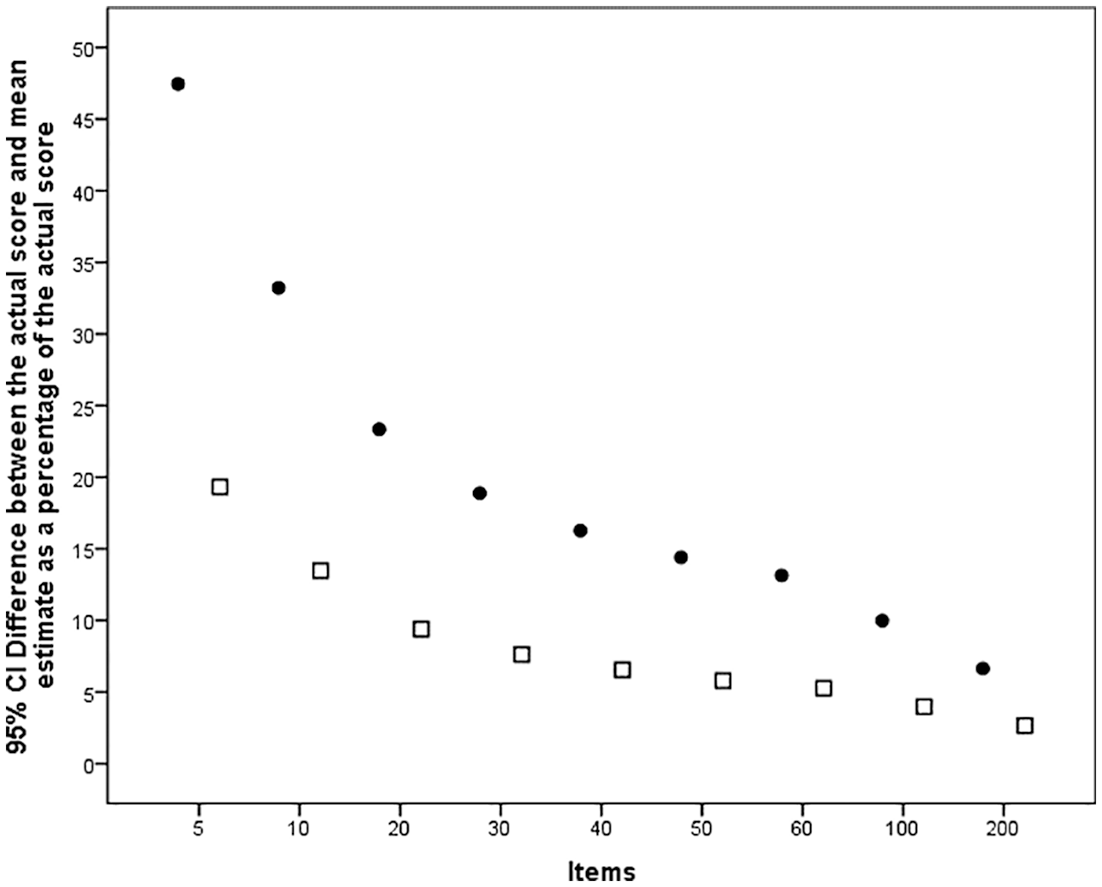
Average difference between the actual score and mean estimate for two item formats as a percentage of the actual scores, for a range of different test lengths.
Figure 5 shows the average percentage difference between test takers’ actual scores and their estimated mean score, for the two item formats tested (meaning recall (dots) and meaning recognition (squares)). As the plots in the graph show, with a test of only five items representing 1000 words using the meaning-recall format, the average difference is close to 50%, implying that a test taker’s estimated score for a 1000-word frequency band with such low number of items yields very wide estimates. For example, with a criterion score of 600 out of 1000, an estimate may vary from 300 to 900 words.
For the same number of items for the meaning-recognition format, the average difference is smaller, at around 20%. For the next text length of 10 items, representing a sample ratio of 10:1000, the mean difference for the meaning-recall format is observed at around 35%, whereas the corresponding value for the meaning-recognition format is observed at 15%.
As expected, for the remaining test lengths, following an increase in item number in a test, the average difference between the participants’ criterion scores and the mean estimates decreases. The curves in Figure 5 assume different slopes, with the meaning-recall values having a somewhat steeper slope than those for the meaning-recognition values. It is interesting to note that the slope for the latter seems almost to level out between test lengths of 30 and 60 items. There are decreases in the values for 100 and 200 item lengths, but not dramatic ones. Comparing the two formats, the improvements are bigger for the meaning-recall format values.
Discussion
The aim of this article was to demonstrate the effect of using various sample sizes for items in vocabulary size and levels tests. Based on a unique data set, it was possible to compare the scores of 103 Japanese learners of English on a 1000-item test for two test formats: meaning recall and meaning recognition. This was done by using a total of 1000 bootstrap samples for each test format condition and test length, for five, 10, 20, 30, 40, 50, 60, 100, and 200 items, respectively. This provided data from which average differences could be computed between the participants’ criterion score and their estimated mean score extrapolated from the scores on the various test lengths. As we argued in the introduction section, we found that incorrect estimates of vocabulary levels or size may actually lead to unfounded support of models that are based on or comprise estimations of various language abilities, such as reading proficiency.
In terms of the results, as expected, we found that the higher the number of items used, reflecting the sample ratio in a test, the smaller the average differences were. This means that a higher number of items will make the inferences made more representative and provide more accurate and reliable data. Conversely, with very few items in a test, for example five or 10 representing the underlying population of 1000 words, differences as large as 35–48% were observed for the meaning-recall format, and 15–20% for the meaning-recognition format in our study. The sample sizes of five and 10 items per 1000-word frequency band are what is used in influential tests like the VST (for the 20K and 14K versions, respectively). Arguably, there are few purposes and settings where 5 to 10 items per 1K word band is enough. It is evident that this yields very large uncertainties. At the same time, researchers and test developers need to remember that all test-score users need to make inferences carefully, as it is inferences that have validity or not; not tests, and not data.
It could be argued that many studies investigating the behavior of influential tests of vocabulary knowledge like the VLT or the VST are overly concerned with total test reliability, be it approaches based on Classical Test Theory or Item Response Theory (Brown, 2012; Ockey, 2012). Thus, reliability coefficients like Cronbach’s alpha (the most commonly used coefficient) may indicate that there is consistency of measurement (Bachman & Palmer, 1996). At the same time, our study shows that tests commonly used in the field may yield inaccurate and invalid data for the levels or sections that make up the test.
All vocabulary test construction implies striking a balance between representativeness (validity) and accuracy. In a recent publication, Nation (2016) argued that for vocabulary levels tests, in which the interest is placed on how well a tested level is known, each level needs to contain around 30 items. He furthermore argued that for vocabulary size tests, where the interest lies in finding out what the total score is, the whole test needs to contain at least 30 items. In relation to the finding in the present study, even though it is difficult to establish a very firm cutoff point in terms of the number of items, our data seemingly indicate that a sample size around 30 or more items per 1000-word frequency band provides a decent accuracy, and at the same time constitutes an item number that is practically conceivable. This matches Nation’s suggestions for levels tests. However, for size tests, Nation’s suggestion strikes us as far too low. If the aim is to use an extensive test of 1–10K, this would imply the use of only 30 items to represent 10,000 words, which in turn means that each item represents around 330 words. At the same time, using 30 items for each 1000-word frequency band would imply the use of 300 items, and if the aim is to use an extensive test of 1–14K, this would mean the use of 420 items (an even bigger number that is not tenable in most assessment situations). But what are the solutions to this issue?
One approach would be to focus on vocabulary knowledge levels, and not overall size, and to give more items per 1K band coupled with the use of fewer bands. Another solution would be to use a computer-adaptive test (CAT) approach. Kremmel (2018) accounted for two alternatives in this regard. In the “floor first” (FF) alternative, in Kremmel’s account, a test taker first receives five high-frequency items from the 1K band, and then continues with subsequent frequency bands up to a point at which their success rate falls below a certain percentage. Then the CAT program adapts to this, and the program generates another set of five items from the relevant frequency band. Should a test taker receive the same score on these, then the scores from the two rounds are summed up as a percentage for that band. The test takers then continue to the next frequency band, and an algorithm applies the same rules again. When scores fall below 20% correct for a band, the test is terminated. Even though this type of CAT approach is interesting in itself, if only five items are used to represent 1000 words, researchers will find themselves to be none the wiser.
In another alternative, Kremmel (2018) drew on work by Luecht et al. (2006), Luecht and Nungester (1998), and Zenisky et al. (2010): Kremmel accounted for a “multi-stage multi-level” (MSML) design. With this approach, a test taker is, at the first stage, provided with vocabulary items from a range of frequency bands. Then, more stages are provided in which the range of items gets narrower in the process (see Kremmel, 2018, pp. 146–151 for details). Kremmel carefully evaluated the two types of CAT operationalization and concluded that the FF alternative is preferred for a vocabulary test, as it beat the MSML algorithm when it came to test–retest reliability. Again, this CAT approach may be promising in theory, but if the test taker is tested on too few items initially, we cannot see how this approach could remedy the situation.
One aspect that needs commenting is the observed difference in percentage between the actual scores and mean estimates for the meaning-recall format compared to the meaning-recognition format (Figure 5). It is somewhat counter-intuitive that the difference is bigger for the meaning-recall format, given the higher reliability of meaning-recall tests (McLean et al., 2020). The difference appears to be owing to a ceiling effect on the meaning-recognition scores, which is related to the considerably higher mean scores for tests of this format. In reference to Table 2, the meaning-recognition mean score of 785 is closer to a possible score from a sample than is the meaning-recall mean score of 423. It is also the case that the meaning-recall mean score is closer to 500 (50%). For both formats, a ceiling is the maximum score of 1000, whereas a “floor” is the minimum score of 0. For the meaning-recall test, the mean of 423 indicates that both the floor and the ceiling levels are far from this score. For this reason, the tails have a lot of room to spread out, creating a wider range of estimates. For the meaning-recognition format, on the other hand, the mean of 785 is much closer to the ceiling, with a narrower range as a consequence. The characteristics of the distributions discussed are visualized in Figure 6.
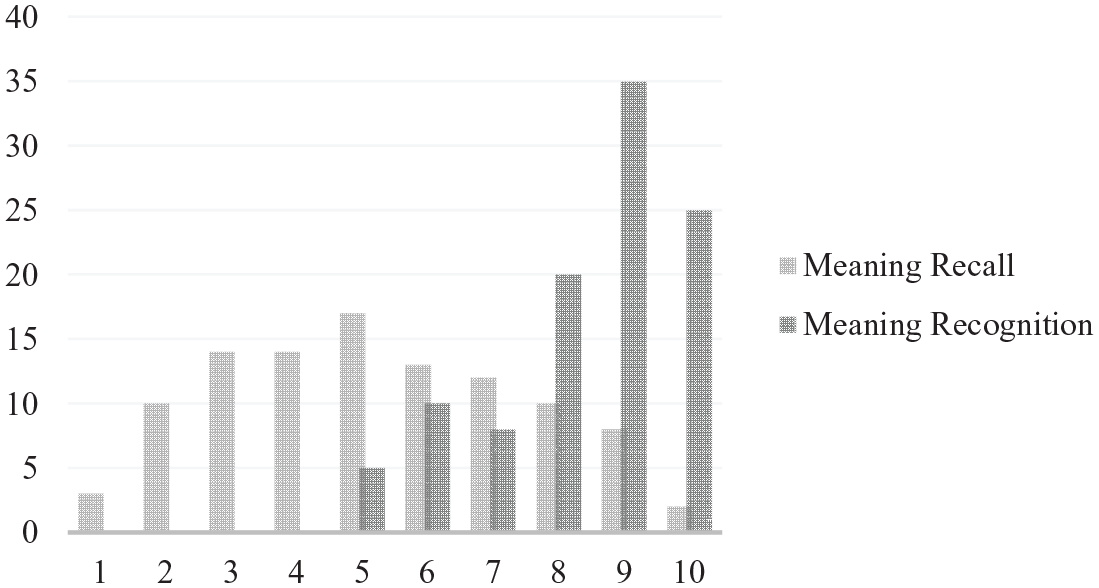
Score distribution histograms for two 10-item tests based on data from all 103 participants.
Figure 6 shows two separate 10-item tests based on the data from all 103 learners. The mean meaning-recall score for these 10 items was about 5.2, whereas the mean meaning-recognition score was around 8.4. The ceiling effect for the meaning-recognition scores is clearly visible. As a high proportion of learners attained scores of nine and 10 out of 10, this restricts the possible range of scores.
As our participant sample was used for illustrative purposes, and our main thrust concerns principles of statistical polling methods, the question of generalizability of the findings based on the particular group of L1 Japanese learners of English to other learner groups is not focused on. It is, of course, true that vocabulary knowledge profiles may vary by the L1 of the group of learners tested. For example, another group of learners may have slightly different distributions and mean scores for the two modalities investigated. However, from a statistical standpoint, confidence intervals will ultimately remain dependent on the number of items sampled and used in the test, irrespective of any unique characteristic of a given population.
Turning to our final point in this discussion section, some of the issues covered in the present article loom large in recent pleas for increased attention to the validation of vocabulary tests (Schmitt et al., 2021; Stoeckel et al., 2020). The authors called for more precise specifications of the purposes of the tests. They noted that the intended group of test takers must be clearly identified. And not least, test designers must indicate how scores should be interpreted. Specifically, the authors called for the application of validation frameworks for future test construction and validation, such as those by Bachman and Palmer (2010), Chapelle et al. (2008), and Kane (2006) (see also a similar call in Gyllstad, 2020; Gyllstad & Schmitt, 2019; Gyllstad et al., 2015). We are clearly sympathetic to this, especially as one important step in such frameworks has to do with the sample of items from a certain target domain, and the representativeness of such a sample. We hope that our study has shed some light on one part of the puzzle in this regard.
Conclusion
The conclusions to be drawn from the present article are as follows. Anyone using tests and assessments needs to be very careful when making inferences from the observed behaviors, performances, or scores of test takers. Specifically, researchers need to remind themselves constantly that inferences can be valid or not, but not tests nor data themselves. When it comes to the focus in the present article, tests of vocabulary size or levels, the illustrations used show that there are arguably not many purposes and settings in which as few as 5 to 10 sampled items from a 1000-word frequency band (1K) are sufficient. In these tests, a balance must be struck between using large enough item samples and, at the same time, ending up with test lengths that are practical for all intents and purposes. One approach discussed in the article is to focus on vocabulary levels, not overall size, and use 30 or more items per 1000-word frequency band over fewer bands. In the article we also discuss the benefits of computer-adaptive test (CAT) approaches, where a rough initial level of word knowledge is found, by using fewer items, and subsequently where a more detailed level is established, by using a larger number of items in order to achieve this. However, this approach is only tenable, we argue, if a larger number of items is used for the rough initial level testlet. In addition, a CAT approach is not feasible in traditional pencil-and-paper tests, and so a best practice for these test formats, without relying on CAT, is still needed. In general, we hope that with the present article we contribute to an intensified discussion amongst developers and users of vocabulary size and levels tests in terms of how various sample sizes come with different levels of psychometric accuracy, and how this in turn has consequences for inferences that are made based on test scores.
Footnotes
Acknowledgements
We would like to thank the audience at the Vocab@Leuven conference in Leuven, Belgium, 1–3 July 2019, for valuable feedback on our presentation of the study. We would also like to thank three anonymous reviewers and the editors of the journal for constructive and helpful comments on previous versions of this paper.
Funding
The author(s) disclosed receipt of the following financial support for the research, authorship, and/or publication of this article: The work was supported by Japan Society for the Promotion of Science KAKENHI (grant number JP 18K12479).