
Abstract
Behavioral observation offers a powerful approach for relationship science but is constrained by coder bias and resource demands. Using a widely employed couple conflict discussion paradigm, we illustrate how these challenges can be addressed. First, we show that thin-slice coding, a method commonly used in zero-acquaintance research, can effectively substitute for full-length observations in already formed relationships. Thin-slice ratings of partner responsiveness mirrored full-length ratings, correlated with partners’ self-perceptions, and predicted changes in relationship satisfaction over time. Next, combining theory on interpersonal perception and an optimization approach in computer science, we estimated the optimal coding team size. Small teams (e.g., two coders) introduced bias and attenuated associations, but these issues were largely mitigated with five full-slice or eight thin-slice coders. Together, these findings establish thin-slice coding as a valid approach for studying close relationships and offer practical benchmarks for balancing coder bias and team size in observational relationship science.
Behavioral observation has long been a cornerstone for capturing the nuances of social behavior (Thorson & West, 2024). Yet, beneath its rigor lie two persistent challenges. The first is coder bias: Although outside observers are assumed to provide objective data, their judgments are shaped by subjective interpretation (Hoyt & Kerns, 1999). Left unaddressed, such bias can attenuate observed effect sizes (Hoyt, 2000), compromising replicability and theoretical progress (Baucom et al., 2017). Increasing the number of coders can reduce bias but introduces a second challenge. Behavioral coding is time-intensive and quickly strains resources. How large, then, should a coding team be to mitigate bias and effect size attenuation without exhausting limited resources? Integrating theory on interpersonal perception with an optimization approach from computer science, we estimate optimal coder team size to balance bias and resource demands in a widely-used couple interaction paradigm. To offer feasible alternatives, we tested the performance of various team sizes for both full-length and thin-slice observations. Although thin slices are widely used in zero-acquaintanceship research (Murphy et al., 2019; Murphy & Hall, 2021), their validity in ongoing relationships remains untested. We provide the first evaluation of thin-slice coding in romantic couples, assessing whether it yields representative, accurate, and predictively valid judgments. While our analyses draw on a couple interaction paradigm for illustration, the findings and insights generalize to behavioral observation of other types of interpersonal relationships as well.
Sources of and Solutions to Coder Bias
In a typical observational study, variance in observed scores can be decomposed into three components: target, coder, and target × coder interaction (Hoyt & Kerns, 1999). According to the PERSON model of interpersonal perception (Kenny, 2004), coders’ shared interpretations of targets’ behaviors contribute to target variance. Because this component is assumed to reflect traits or behavioral patterns that are relatively stable across time and context and therefore accessible to multiple perceivers, it is typically interpreted as capturing the “true variance” in the observed construct. In contrast, coders’ unique, nonshared interpretations of targets’ behaviors contribute to coder bias. These interpretations may arise from targets’ appearance as well as from coders’ traits or transient states such as mood. Mean-level differences in these nonshared interpretations across targets, that is, coders’ general evaluative tendencies, contribute to the coder main effect. Coders’ idiosyncratic evaluations of specific targets that are not correlated with their evaluations of other targets contribute to the coder × target interaction.
The relative contributions of the coder main effect and the coder × target interaction to total coder bias depend on the study design. When all targets are rated by the same coding team, the coder main effect can be assumed to be constant across targets and therefore does not affect their rank ordering. Even in such designs, however, coder × target interaction still contributes to bias. In relationship research, it is not uncommon for different subsets of targets to be coded by different teams, for example when independent teams rate each partner’s behaviors within a dyad (e.g., Rholes et al., 2021) or when data from separate samples are combined for integrative analyses (e.g., Algoe et al., 2016). In these cases, both the coder main effect and the coder × target interaction contribute to bias (Hoyt, 2000).
A critical consequence of coder bias, regardless of its source, is attenuation of effect sizes (Baucom et al., 2017; Hoyt & Kerns, 1999). A common misperception is that this problem is limited to studies in which all focal constructs are observer rated. In fact, coder bias can attenuate effects even when observed variables are used to predict constructs measured via other methods (Hoyt, 2000), for example when testing associations of an observed construct with its self- or partner-reported version or with theoretically related outcomes. Importantly, because effect sizes in the interpersonal relations literature are typically small to medium (Lovakov & Agadullina, 2021), even modest attenuation can lead to missed discoveries. This risk is particularly pronounced when outcomes are temporally separated from the behavioral observation and effect sizes are therefore expected to be smaller, as is often the case in longitudinal relationship research.
A straightforward solution to coder bias and the resulting effect size attenuation problem is increasing the number of coders. While larger coding teams are known to improve interrater reliability (Baucom et al., 2017; Thorson & West, 2024), extant studies vary widely in team size. Recent observational couple studies used from as few as two or three coders (e.g., Jakubiak et al., 2023; Sasaki et al., 2023) to as many as twelve (Bayraktaroglu et al., 2023). This variation may reflect reliance on each research group’s past norms in the absence of empirical guidelines (Baucom et al., 2017). Aligned with calls to refine conceptual and methodological guidelines in observational research (Baucom et al., 2017), revitalize behavioral observation in the study of social behavior (Doliński, 2018), and promote methodological rigor in relationship science (Joel et al., 2025), the field would benefit from obtaining empirical estimates of minimum coding team sizes needed to alleviate coder bias.
Feasibility of Increasing the Number of Coders
Two lines of research support the feasibility of increasing coding team size. First, coding interpersonal behavior may not require extensive training when the observed phenomenon is intuitive to coders (Baucom et al., 2017). For instance, untrained coders’ ratings of spousal behaviors (e.g., distress, affection) during a 10-min conflict discussion correlated moderately to strongly (.45-.95) with expert ratings and predicted both concurrent marital adjustment and long-term marital stability (Waldinger et al., 2004). In fact, naive coders’ ratings of spousal behavior during 10-min conflict and support discussions explained as much or more variance in marital outcomes than those of trained experts (Baucom et al., 2012).
Second, coders may not need to view entire interactions to make valid judgments. Research has shown thin-slice judgments can yield predictions comparable to full-slice judgments (e.g., Ambady et al., 2000; Murphy et al., 2019; Murphy & Hall, 2021). Broadly, thin slicing refers to the use of a brief segment of a longer behavioral stream to make behavioral or trait judgments. Although thin slices can be drawn from various channels, such as snapshots of facial expressions, audio recordings of interactions, textual transcripts, or video recordings, in the context of behavioral observation they typically involve selecting one or a few short segments from a previously video-recorded full interaction.
Researchers using thin-slice methodology in behavioral observation typically draw on at least two theoretical perspectives suggesting that brief exposures to social behavior can yield accurate judgments (Murphy & Hall, 2021). First, the ability to form relatively accurate judgments from minimal behavioral information is thought to confer an evolutionary advantage. Humans are expected to be sensitive to indicators of others’ traits even in brief expressions of social behavior because cues provide actionable information, for example when deciding whether to approach or avoid a target (Zebrowitz & Collins, 1997). Second, given the relative consistency of psychological traits across contexts and time (Shoda, 1999), judgments based on brief segments of behavior should be representative of the target’s behavior in other situations.
Numerous studies on zero-acquaintance interactions have documented that observing thin slices of behavior can yield judgments comparable to those based on the full behavioral stream. For example, ratings of nonverbal behaviors such as gaze, nodding, and smiling derived from 30-s to 1-min slices show strong correlations with ratings based on full-length interactions (Murphy, 2005; Murphy et al., 2015). Subsequent analyses further demonstrated that thin-slice ratings of these nonverbal behaviors predict a range of psychological outcomes, including observer-rated conflict management as well as target- and partner-reported interaction satisfaction (Murphy et al., 2019).
Other work has extended this validity evidence to more complex interpersonal behaviors. For instance, thin-slice ratings of medical students’ rapport with patients, based on three 1-min excerpts sampled from the beginning, middle, and end of an interaction, predicted independent third-party ratings of medical students’ attunement and sensitivity to patients as well as observed patient behaviors, such as asking questions and expressing emotions (Hall et al., 2009). Similarly, coders’ thin-slice ratings of warmth based on 30-s excerpts from the beginning, middle, and end of a 10-min interaction predicted interaction partners’ self-reported liking of the target at the end of the interaction (Gunaydin et al., 2017). Finally, thin-slice ratings of rapport based on 1-min excerpts sampled from the beginning, middle, and end of an interaction predicted interaction partners’ self-reported satisfaction with a negotiation discussion (Anger Elfenbein et al., 2022).
The location and length of thin slices have also been the subject of empirical investigation, primarily in zero-acquaintance interactions. Although the optimal slice length varies depending on the type of behavior being coded (Murphy & Hall, 2021), easily detectable nonverbal behaviors, such as smiles and nods, as well as traits that are relatively intuitive to coders, such as positive affect, warmth, and Big Five personality traits, can be judged reliably from 30-s to 1-min slices (e.g., Carney et al., 2007; Gunaydin et al., 2017; Murphy, 2005). Studies comparing slice locations further suggest that single slices, particularly those drawn from the beginning of an interaction, may sometimes be associated with greater information loss, whereas later slices or combinations of slices tend to improve predictive power (e.g., Hall et al., 2009; Murphy et al., 2019; Place et al., 2009; Wang et al., 2020).
Although thin-slice coding has been used extensively in zero-acquaintance research, it has been applied far less frequently in observational couple research, particularly in studies of relationship maintenance behaviors. Given that people value relationship maintenance behaviors in romantic partners (Eastwick et al., 2025), the ability to detect such behaviors from brief behavioral displays could plausibly confer adaptive advantages. Consistent with this idea, third-party observers have been shown to accurately judge speed daters’ romantic interest in one another from interaction clips as short as 10 or 30 seconds (Place et al., 2009). Notably, however, these interactions involved zero-acquaintance encounters, as prospective partners were meeting for the first time.
Another thin-slice study focused on divorce, where perceivers’ judgments based on 30-s audio recordings of individuals’ separation experiences predicted psychological adjustment three months later (Mason et al., 2010). This work, however, focused on individuals’ narratives rather than on couples’ interactive behavior. Finally, another study (Lambert et al., 2014) showed that coders could predict infidelity from 3–5-min couple interactions. Although the interaction length in that study was shorter than what is typically used in couple research (but see, for instance, Algoe & Zhaoyang, 2016 for full interactions of 5 minutes), coders evaluated entire interactions rather than brief excerpts, deviating from the standard thin-slice paradigm. Taken together, this literature suggests promise for the usefulness of brief observations in romantic contexts but leaves open the question of whether ratings based on very short excerpts from couple interactions can meaningfully predict key relational outcomes, such as relationship satisfaction.
The Present Study
To tackle these questions, we asked two independent samples of coders (thin-slice coders and full-slice coders) to watch romantic couples engage in a conflict discussion and rate each person’s responsiveness (i.e., how understanding, validating, and caring they were of their partner) using a global coding system previously validated for full-slice observations (Maisel et al., 2008). We chose conflict discussion because of its widespread use in observational relationship research (Campbell et al., 2010; Sasaki et al., 2023; Waldinger et al., 2004), and responsiveness because of its organizing role in numerous key relationship processes (Reis, 2007) and its common use as a focal construct in dyadic observational studies (Beck et al., 2014; Maisel et al., 2008).
We first evaluated the validity of thin-slice judgments using three criteria established in past work (Murphy & Hall, 2021; Thorson & West, 2024): (1) representativeness–whether thin-slice judgments correlated with full-slice judgments, (2) accuracy–whether thin-slice judgments correlated with partner-reported responsiveness, a construct known to predict relationship development and personal well-being over time in theoretically expected ways (Gunaydin et al., 2021; Slatcher et al., 2015; Stanton et al., 2019) and (3) predictive validity–whether thin-slice judgments of target responsiveness predicted changes in partner’s report of relationship satisfaction over time (Joel et al., 2020). This also served as the first test of whether thin-slice ratings of couple behavior predict relationship satisfaction.
To estimate optimal coding team size, we developed an approach combining insights from the PERSON model (Kenny, 2004) with a conceptual tool from computer science for solving optimization problems. The PERSON model recognizes that observed behavior scores, though often treated as objective reflections of the target, are actually constructions of a perceiving community (in our case, coders). So, if one recruits a relatively large coding team, their consensual judgment can be taken as a ground truth against which coder bias and effect size attenuation in smaller coding teams can be compared. We used pooled ratings from 50 thin-slice and 18 full-slice coders (both unusually large teams compared to previous observational studies) as indices of ground truth. We then evaluated smaller teams’ performance on two metrics: bias (deviation from ground truth) and effect size attenuation (decrease in the association of target’s observed responsiveness with their partner’s report of responsiveness and relationship satisfaction).
To guide coding team size estimation, we drew on methods from computer science, where machine learning algorithms are validated against human coders (known as annotators) in tasks like image or text classification. These tasks require assembling annotator teams that minimize bias and maximize accuracy (Nowak & Rüger, 2010; Raykar & Yu, 2012). One method for estimating the minimum attainable bias for a given annotator team is the oracle approach. In machine learning, an oracle is assumed to have access to the best hypothetical solution to a given problem. Applied to annotation tasks, once a large pool of annotators completes the same categorization, the oracle can be used to estimate the minimum bias that smaller subsamples of annotators could achieve. To illustrate this idea in the context of global behavior coding, suppose that 50 coders rate each target. After all ratings are completed, the oracle selects the optimal combinations of 2, 3, 4, and so forth coders that yield the smallest deviation from the ground truth, as approximated by the full set of 50 coders. Thus, the defining feature of an oracle-assembled team is that its ratings are the least biased among all possible teams of the same size.
Oracle-style benchmarks are common in machine learning when researchers want to quantify how close a practical, real-world procedure comes to an ideal best-case standard. This logic appears in work on decision-making under uncertainty and on choosing optimal strategies, where oracle performance is used as a reference for what would be achievable under ideal conditions (Chakraborty, 2020; Yu et al., 2018). In classification tasks, such as identifying duplicate entries (e.g., the same restaurant listed with address elements formatted differently) in very large databases, oracle benchmarks are often used as a reference for how closely feasible procedures can approximate ideal performance under realistic constraints. For example, this includes deciding when to obtain an additional label from a high-quality annotator versus relying on noisier annotators (Zhang & Chaudhuri, 2015), or identifying and correcting noisy annotations so that aggregate judgments more closely approximate oracle-level performance (Dolatshah, et al., 2018).
The oracle approach is post-hoc, relying on coders’ actual performance after all ratings are complete. This information is not available when assembling coding teams in advance. This is precisely what makes the oracle comparison useful. It defines a best-case benchmark against which real-world strategies can be evaluated. If, for instance, randomly assembled teams of a given size can approach the oracle team’s performance in reducing bias and improving predictive power, then researchers can be reasonably confident in using that team size prospectively. We compared the average performance of 100 randomly drawn teams at each size to that of the oracle. This allowed us to identify the minimum team size at which random teams closely approximated the oracle performance. We conducted this analysis for both thin-slice and full-slice coders and then examined how the empirically derived team sizes addressed effect size attenuation. By benchmarking against the oracle, we offer a novel, evidence-based framework for determining optimal coding team sizes, providing guidance for relationship scientists designing new studies or analyzing coder bias in existing data.
Methods
Transparency and Openness
Data, code, and materials are available on the Open Science Framework at https://osf.io/gtac5/overview?view_only=a57c0d0d0758440a915ebab4d98ec1ef. The conflict discussion and relationship satisfaction data come from a study of fledgling couples in Turkey (Bayraktaroglu et al., 2023), which included three monthly surveys and a lab visit between Months 1 and 2. During the lab visit, couples engaged in two video-recorded interactions: one focused on a conflict topic and the other on a shared positive event. Only the positive event discussion has been used in a published study to date (Bayraktaroglu et al., 2023); the conflict discussion is examined here for the first time. The analyses were conducted using Python 3.11. The study was not preregistered because two of the co-authors were already familiar with portions of the larger project’s dataset and, by their nature, the optimal team-size analyses, which quantify the deviation of smaller coding teams from the aggregate ratings of the full team, were exploratory.
Conflict Discussion
As part of the prior study, 167 fledgling different-sex couples (M age = 21.22, SD = 2.25; M relationship length = 3.33 months, SD = 1.61) residing in Ankara, Turkey discussed a recent unresolved conflict. Following an established conflict-discussion protocol (Campbell et al., 2010), we asked partners to choose a topic of disagreement beforehand. Each discussion lasted for 10 minutes. Partners were recorded with separate cameras, enabling coders to rate each partner’s behavior independently. To assess coder main effect, coder × target interaction, and within-coder consistency, thin-slice coders rated each interaction twice.
To reduce coding burden, we selected 120 interactions based on pooled ratings from 10 full-slice coders who had previously evaluated all 167 interactions (see Coding Procedures). In the full sample, mean observed responsiveness was 5.27 (SD = 1.10) on a 7-point scale; the selected subset had a similar distribution (M = 5.12, SD = 1.09) to ensure thin-slice coders viewed interactions with comparable variability.
The selected set of 120 interactions were rated by both full-slice and thin-slice coders and also served as the sample size for examining whether observed responsiveness predicted partner’s perception of responsiveness during the conflict discussion and change in partner’s relationship satisfaction from Month 1 to Month 2. Following recent dyadic work (e.g., Selcuk et al., 2024; Visserman et al., 2022), we adjusted for nonindependence in the data by calculating the effective sample size. The effective sample size represents the number of independent observations to which the total number of dependent observations (in this case, 240 participants) is equivalent. In the present design, the effective sample size is determined by the number of couples and the intraclass correlation coefficient (ICC), which reflects the proportion of variance attributable to the dyad relative to the total variance (Kenny et al., 2006). The ICCs were .47 for partner-reported responsiveness and .32 for relationship satisfaction, yielding effective sample sizes of 163 and 181, respectively. We then conducted sensitivity power analyses to estimate the smallest detectable standardized associations with 80% power, given the effective sample sizes and the analytic models. The minimum detectable standardized association was .20 for the model predicting month-long change in partner-reported relationship satisfaction and .22 for the model predicting partners’ perceptions of target responsiveness during the conflict discussion.
Given the increased likelihood of information loss when using single slices (Hall et al., 2009; Murphy et al., 2019; Wang et al., 2020), we combined slices drawn from the beginning, middle, and end of the interaction, following prior work (Anger Elfenbein, Curhan, & Eisenkraft, 2022; Gunaydin et al., 2017). Slice lengths were chosen to balance feasibility and accuracy, that is, short enough to allow for larger coding teams yet long enough to support reliable judgments. Based on evidence that global trait or behavior ratings can be made with reasonable accuracy from 30-s to 1-min slices (e.g., Carney et al., 2007; Gunaydin et al., 2017; Murphy, 2005), and that a total exposure of approximately 1.5 minutes is typically sufficient for reliable thin-slice coding (Murphy et al., 2015), we extracted three 30-s slices, for a total of 1.5 minutes. The fourth and fifth authors extracted the slices from each video, starting at approximately 30 seconds, 4.5 minutes, and 8.5 minutes into the conversation (see Gunaydin et al., 2017, for a similar method). This yielded 240 1.5-min videos (120 male, 120 female targets).
Coding Procedures
As part of the original project, 10 undergraduate research assistants at our laboratory rated each target’s responsiveness from the full-length videos. For the current project, eight additional research assistants (the maximum we could recruit in one semester) were added, resulting in 18 full-slice coders in total (17 female, 1 male).
We recruited an independent sample of 100 thin-slice coders (50 female, 50 male; M age = 20.43, SD = 1.92; 67 not currently in a romantic relationship, 33 currently dating), who rated the videos in exchange for monetary compensation. To facilitate comparability as much as possible, thin-slice coders were also university students. All thin-slice coders resided in Istanbul, Turkey. The thin-slice coder sample size was determined based on budgetary constraints. Because rating the total set of 240 videos twice would take too long, we asked every thin-slice coder to rate 120 videos. Following prior studies (e.g., Jakubiak et al., 2023; Rholes et al., 2021), half of the coders rated one partner, and the other half rated the other partner in each dyad. Because female partners rated male partners’ responsiveness (and vice versa) in the actual interaction, female (male) thin-slice coders rated male (female) targets. To minimize carryover effects from the first round of ratings, the second viewing of the 120 videos was scheduled one week later. (see Figure 1(a) for coding procedures). Thin-slice and full-slice coding procedures and variance in thin-slice judgments. Panel (a) shows coder-target configurations for thin-slice (upper part) and full-slice ratings (lower part). Coder characteristics, target characteristics, or coders’ idiosyncratic evaluations of specific targets may all contribute to variation in observed scores. Panel (b) shows relative contributions of each source (coder main effect, target main effect, and target × coder interaction) to total variability in thin-slice ratings of responsiveness estimated via variance components analysis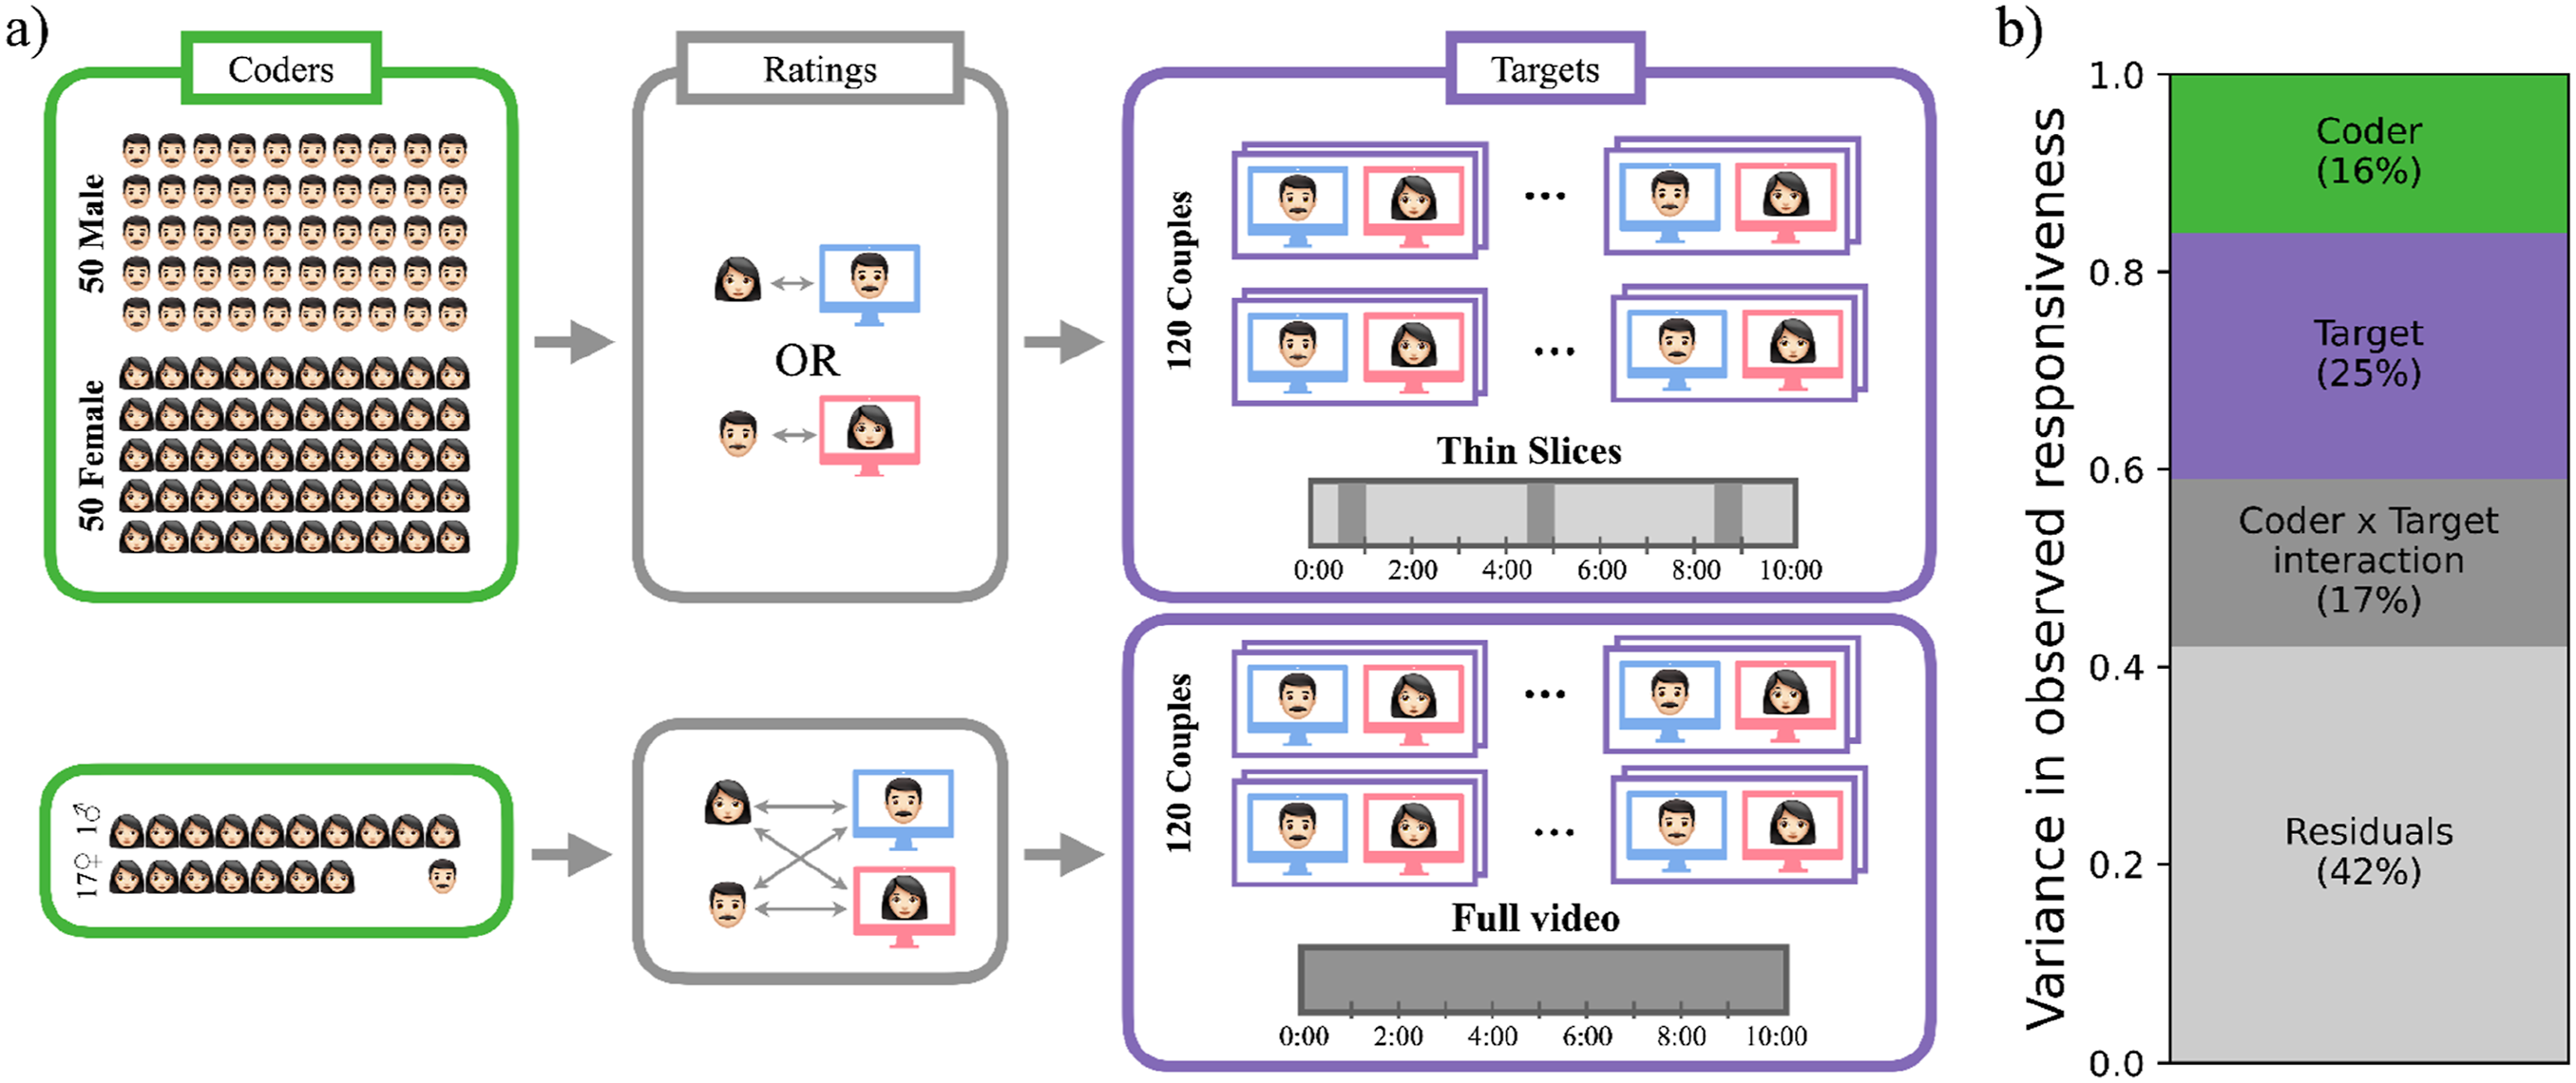
Measures
Observed Responsiveness
Full- and thin-slice coders rated each target’s responsiveness using the same three items (“The person in the video understood/valued/really cared for their partner”; 1 = Strongly disagree, 7 = Strongly agree). The full-slice global responsiveness coding approach has previously been validated against a micro coding system in which trained observers identified approximately 20 behavioral indicators as they unfolded during a dyadic interaction (Maisel et al., 2008). The present study closely followed that global coding protocol, providing both thin- and full-slice coders with sample behaviors for each dimension of responsiveness (understanding, validation, and care; the list of sample behaviors for each dimension is available in the project OSF page).
Mean responsiveness scores were 5.01 (SD = .97) for full-slice and 4.56 (SD = .71) for thin-slice coders (aggregated over 18 and 50 coders, respectively). Because thin-slice coders rated each target twice, we could separately estimate components of coder bias. Thirty-three percent of the variance in observed responsiveness was due to coder bias, with 16% coming from coder main effect and 17% from coder × target interaction (Figure 1(b)).
Partner-Reported Responsiveness
Immediately after the conflict discussion, participants rated how responsive their partner had been during the interaction on the same three items (Cronbach’s ɑ = .84, M = 5.51; SD = 1.35).
Relationship Satisfaction
As part of the monthly battery, partners reported whether their relationship made them happy over the past month (1 = Strongly disagree, 7 = Strongly agree; M = 6.20, SD = 1.08 at Month 1, M = 6.07, SD = 1.01 at Month 2, M = 6.00, SD = 1.19 at Month 3). 1
Results
Test-Retest Reliability of Thin-Slice Judgments
Thin-slice ratings across two sessions were correlated (r = .58; Figure 2(a)). Approximately 90% of the rating pairs had a difference of no more than two points on the 7-point rating scale (Figure 2(c)). A cross-classified model predicting second-view from first-view ratings with the effect of first-view ratings allowed to randomly vary across both targets and coders also revealed a significant association (B = .325, 95% CI [.288, .361], p < .001). Test-retest reliability of thin slice judgments. Panel (a) plots responsiveness ratings from the second view against those from the first. The density along the diagonal highlights the correspondence between the two views. Panel (b) presents the histogram of responsiveness ratings across the two views. Panel (c) shows the cumulative distribution of the difference in ratings across the views. Almost 90% of the rating pairs had a difference of less than two points on the 7-point scale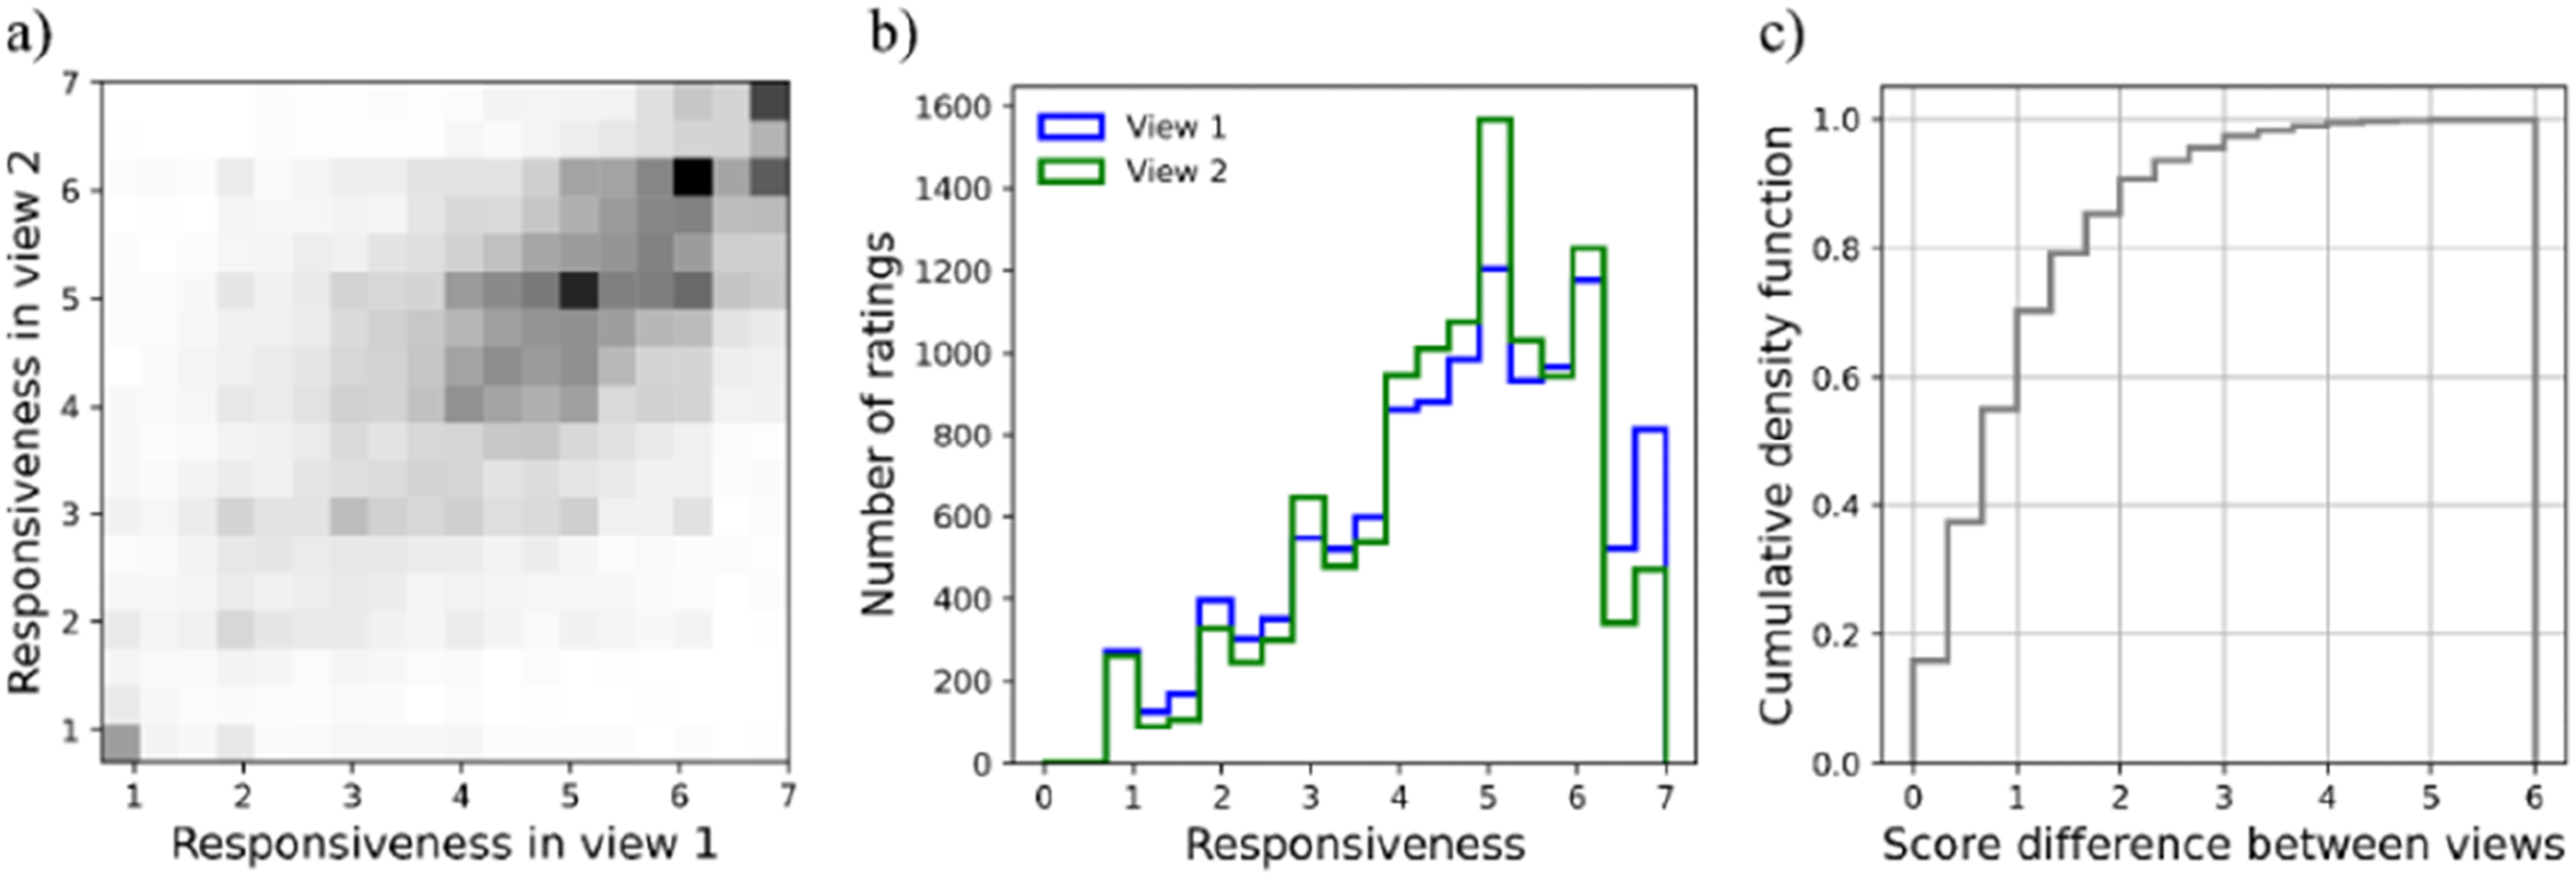
Comparing Thin-With Full-Slice Coding
Given full-slice coders rated the interactions only once, we used thin-slice coders’ first-view ratings in all remaining analyses to facilitate comparisons.
Interrater Reliability and Variability
Similar to previous work using global ratings of responsiveness (e.g., Maisel et al., 2008), interrater reliabilities were high, with intraclass correlations in two-way random effects models of .96 for both full- and thin-slice ratings. Despite high interrater reliability, interrater variability differed across levels of responsiveness. Variability increased among both thin- and full-slice coders as mean responsiveness (obtained by averaging across coders) decreased (Figure 3). From a PERSON model perspective (Kenny, 2004), these findings suggest that while coders had a shared interpretation of what highly responsive behaviors look like, they likely resorted to their unique interpretations to judge low responsiveness. Interrater variability in responsiveness. Panels (a) and (b) plot targets ranked by mean responsiveness against the distribution of scores across coders as a heatmap for thin- and full-slice coders, respectively. The red dots represent the mean rating across all coders while the surrounding grey lines represent the distribution across coders. Panels (c) and (d) plot standard deviation in target responsiveness against mean responsiveness for thin- and full-slice coders, respectively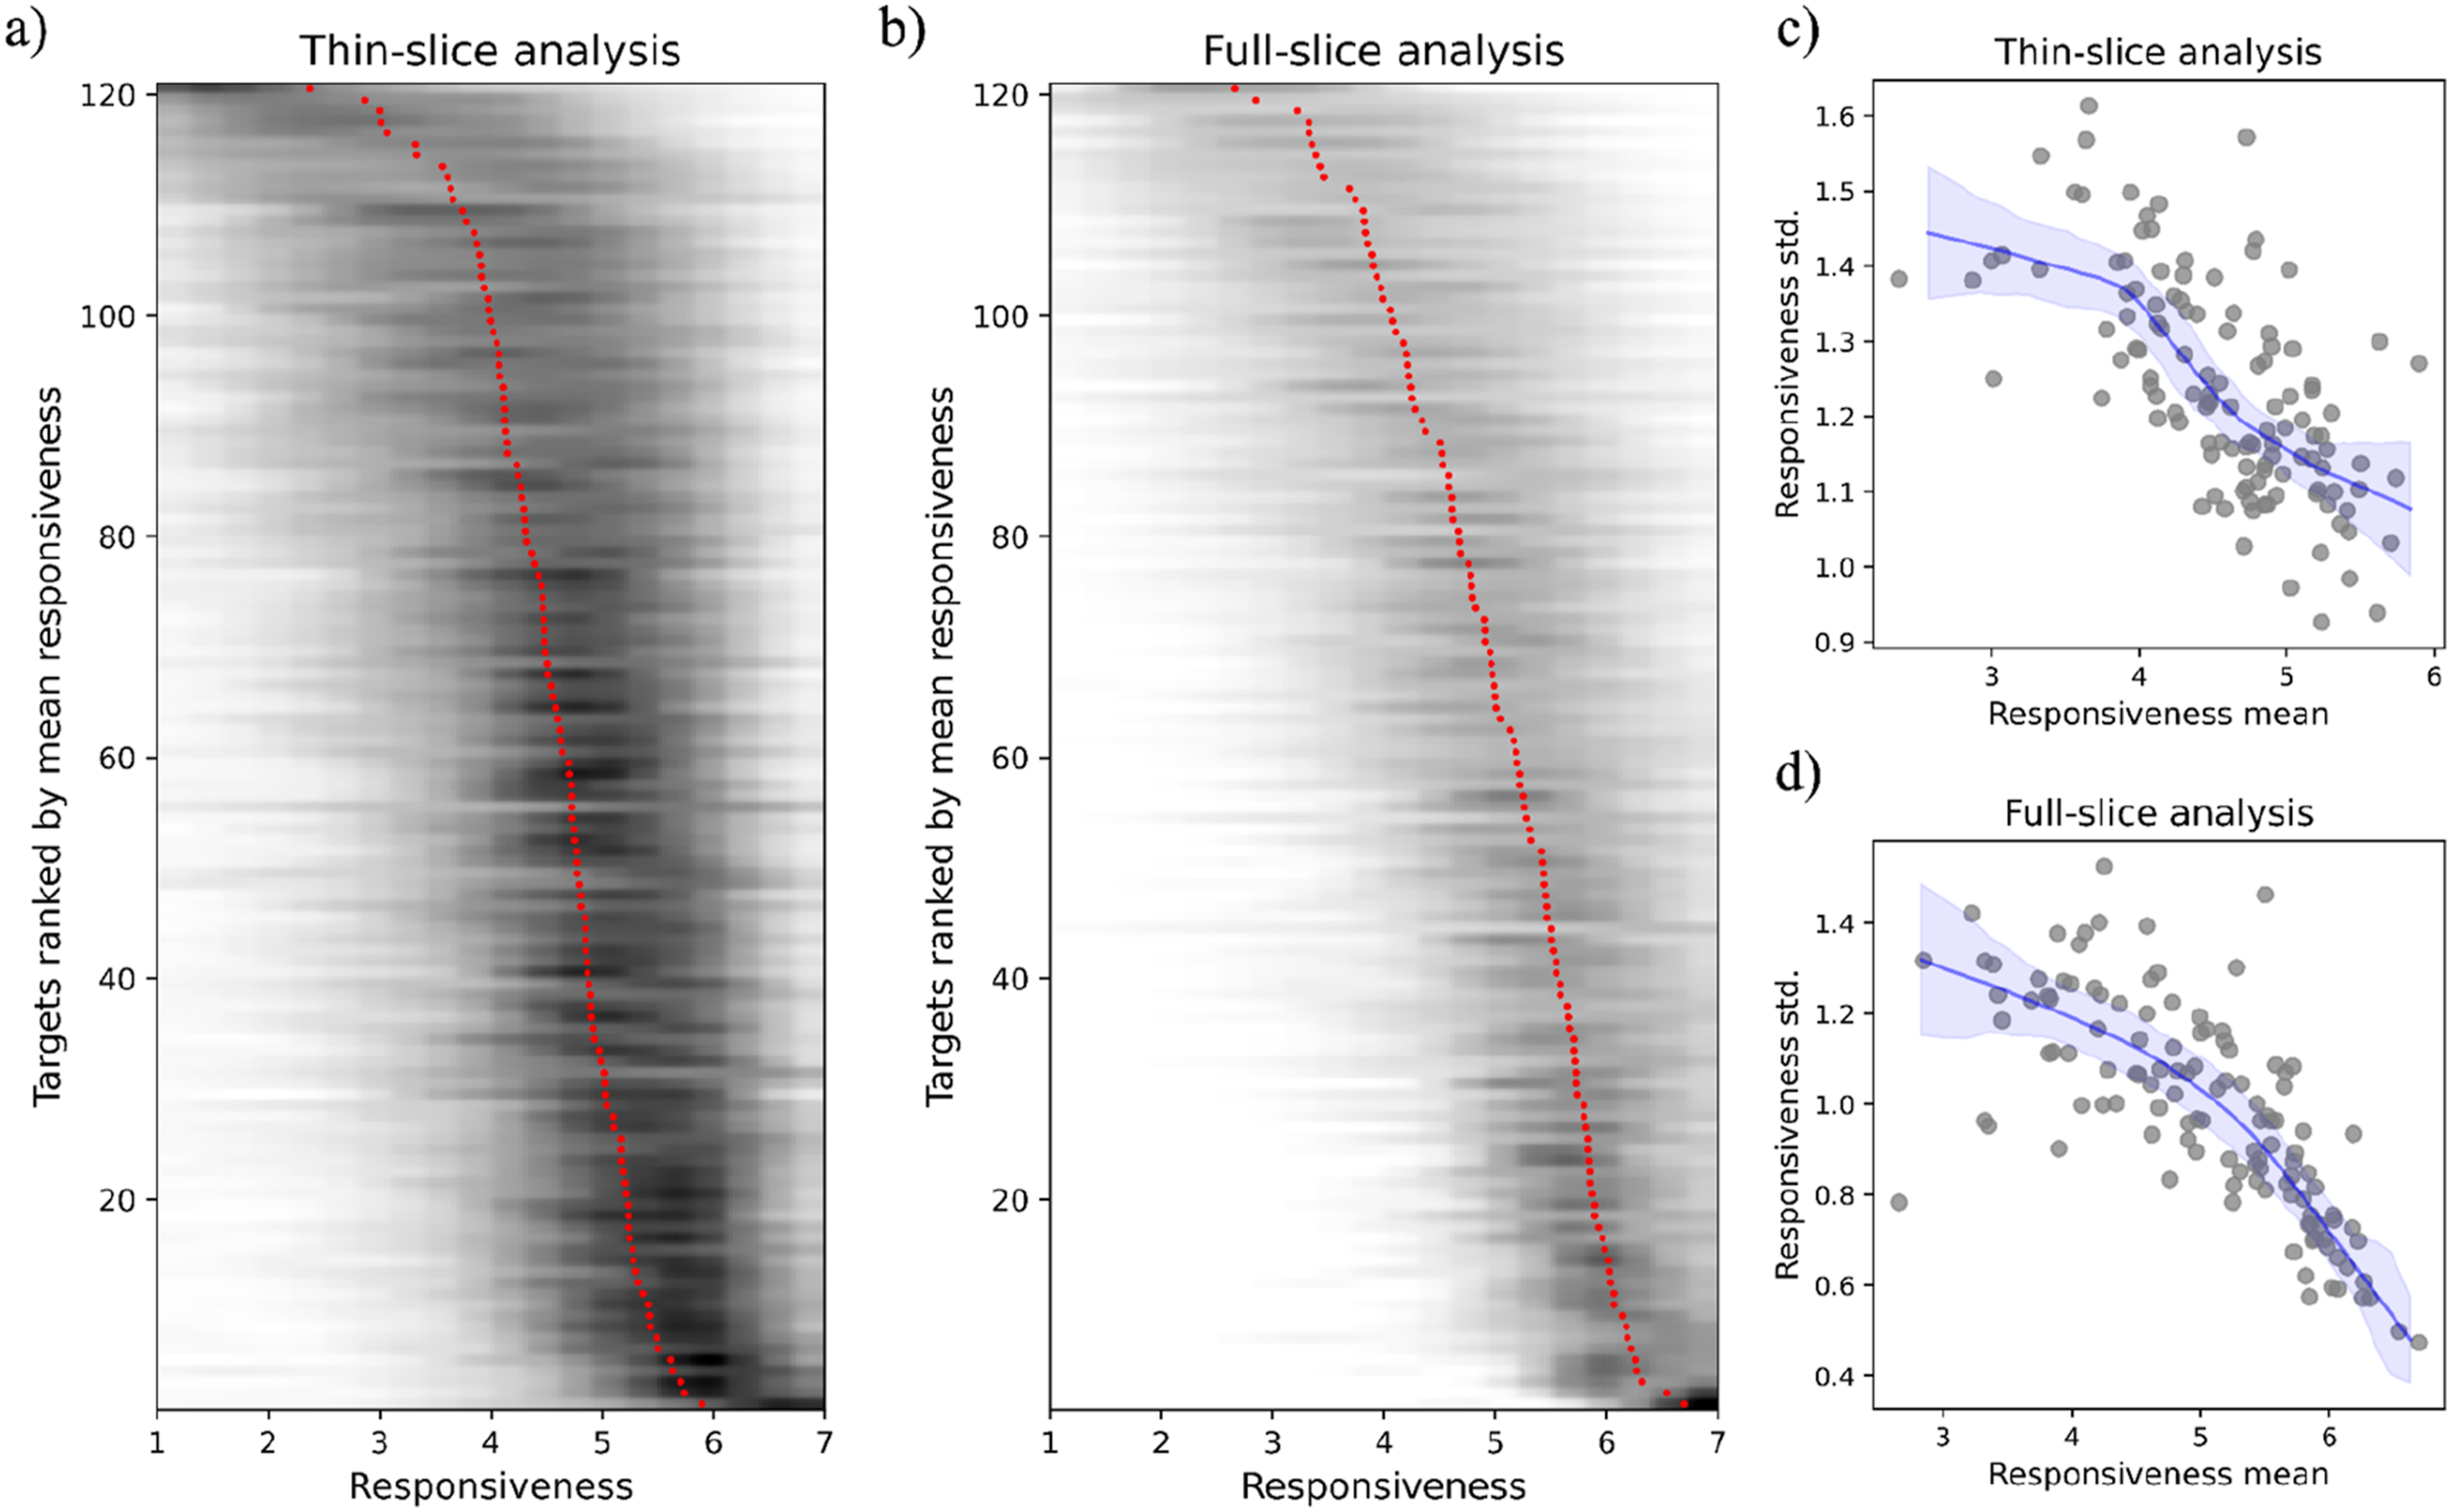
Representativeness
Thin-slice ratings showed a strong correlation with full-slice ratings (r = .89), indicating that thin slices were representative of the whole interaction (Figure 4). Comparison of thin- and full-slice ratings. The blue line shows the association between thin- and full-slice ratings. Standard errors are plotted for each target to show interrater variability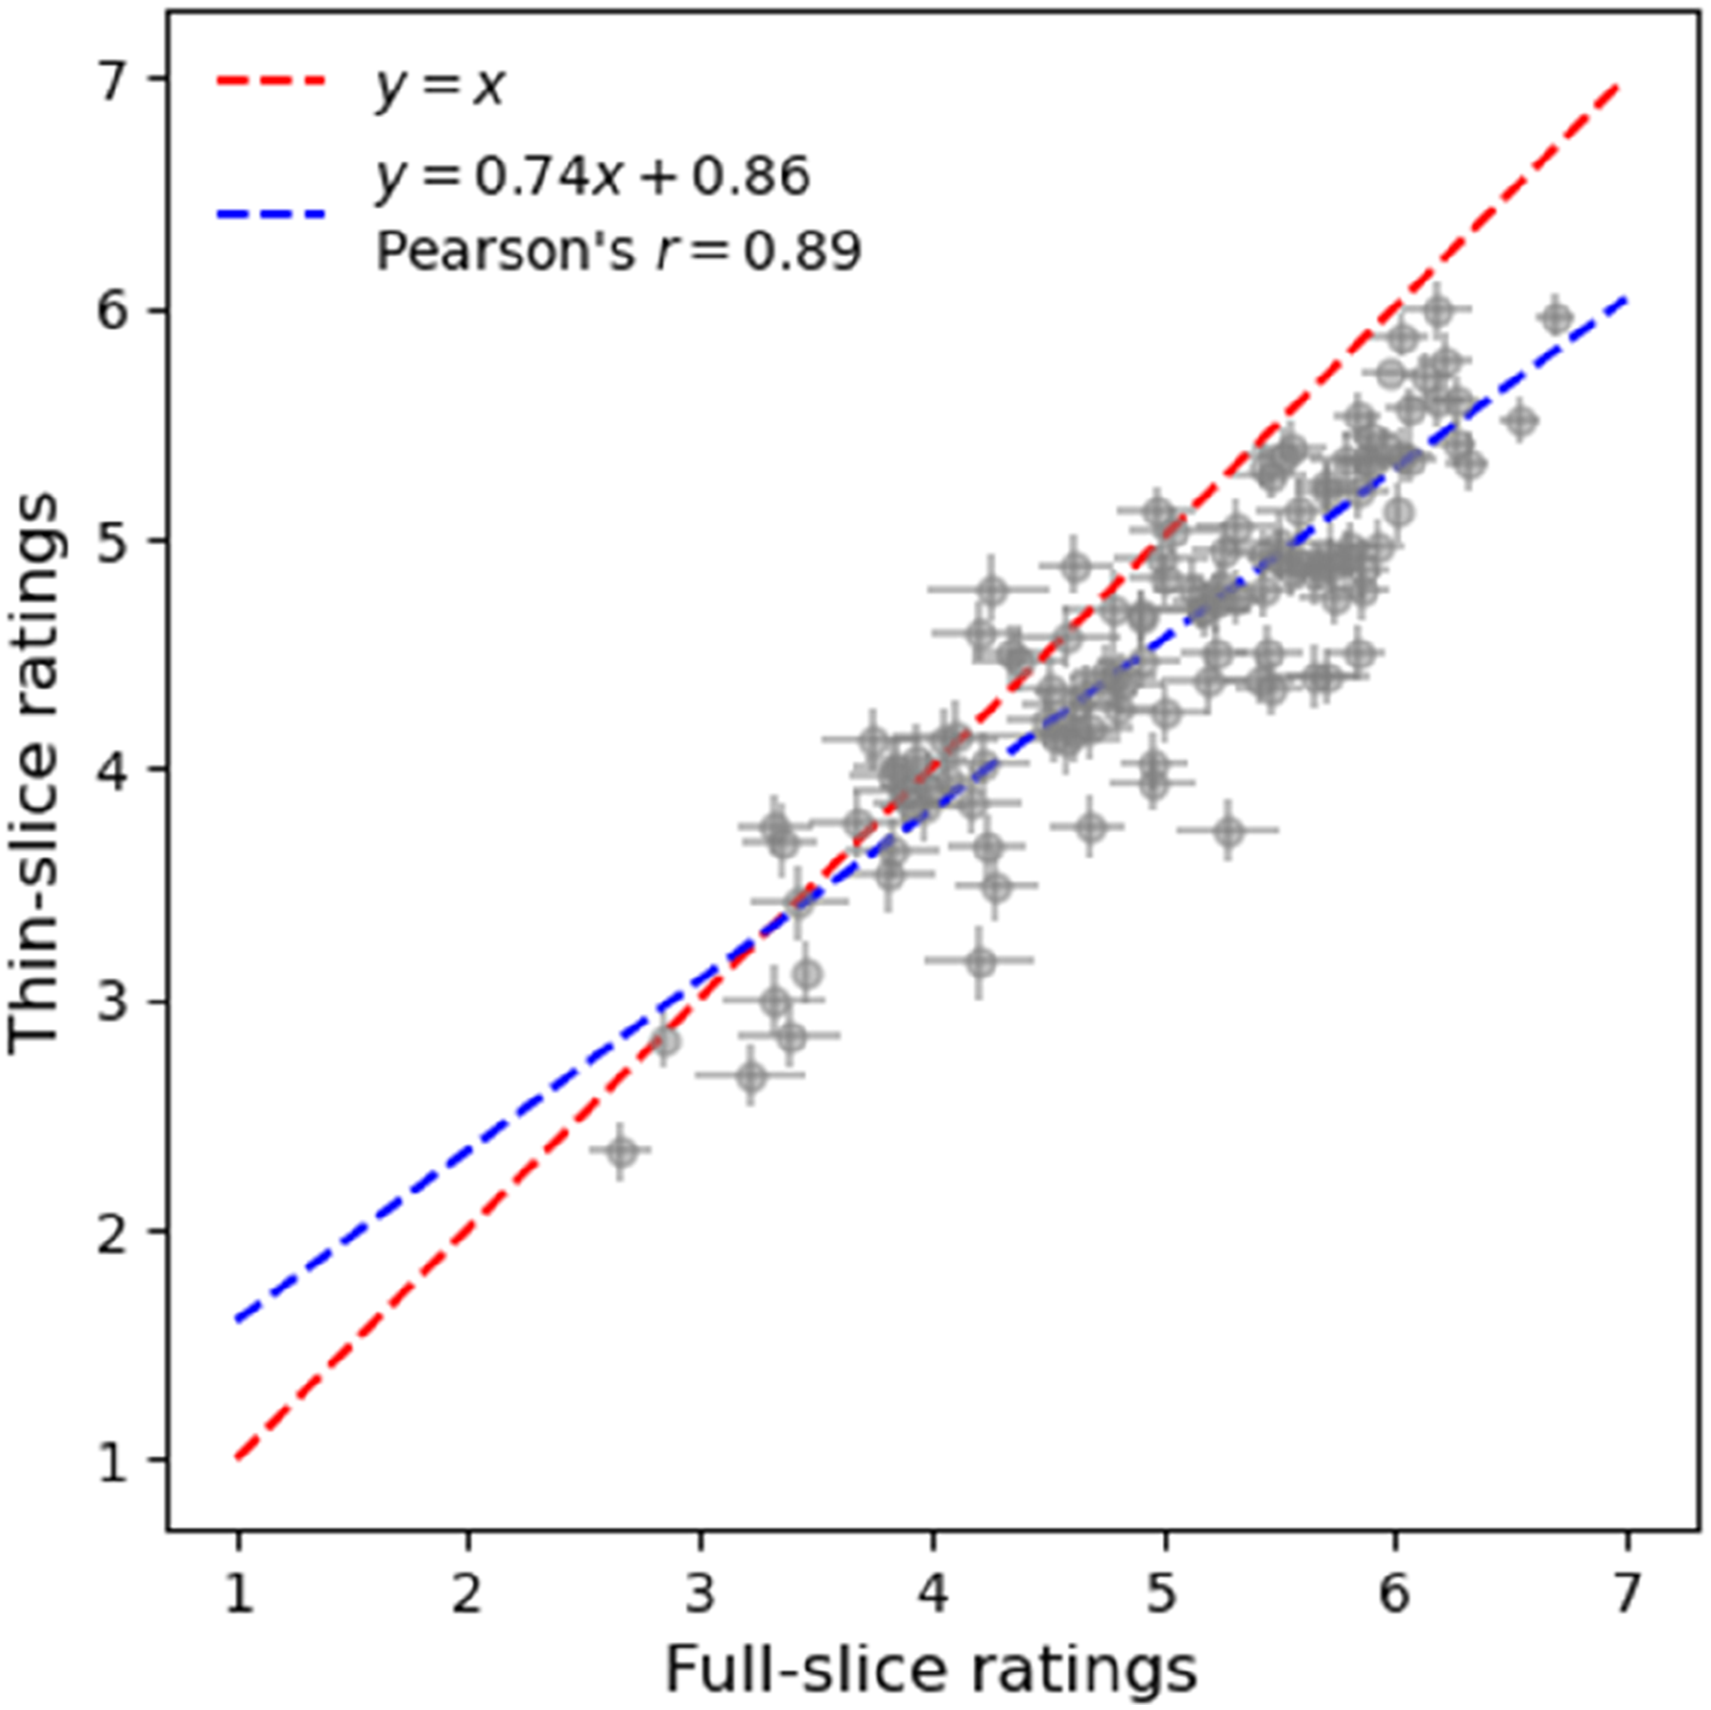
Accuracy
Dyadic Models Predicting Partner’s Perception of Target Responsiveness During Conflict Discussion and Partner’s Relationship Satisfaction at Month 2 From Observed Target Responsiveness During Conflict
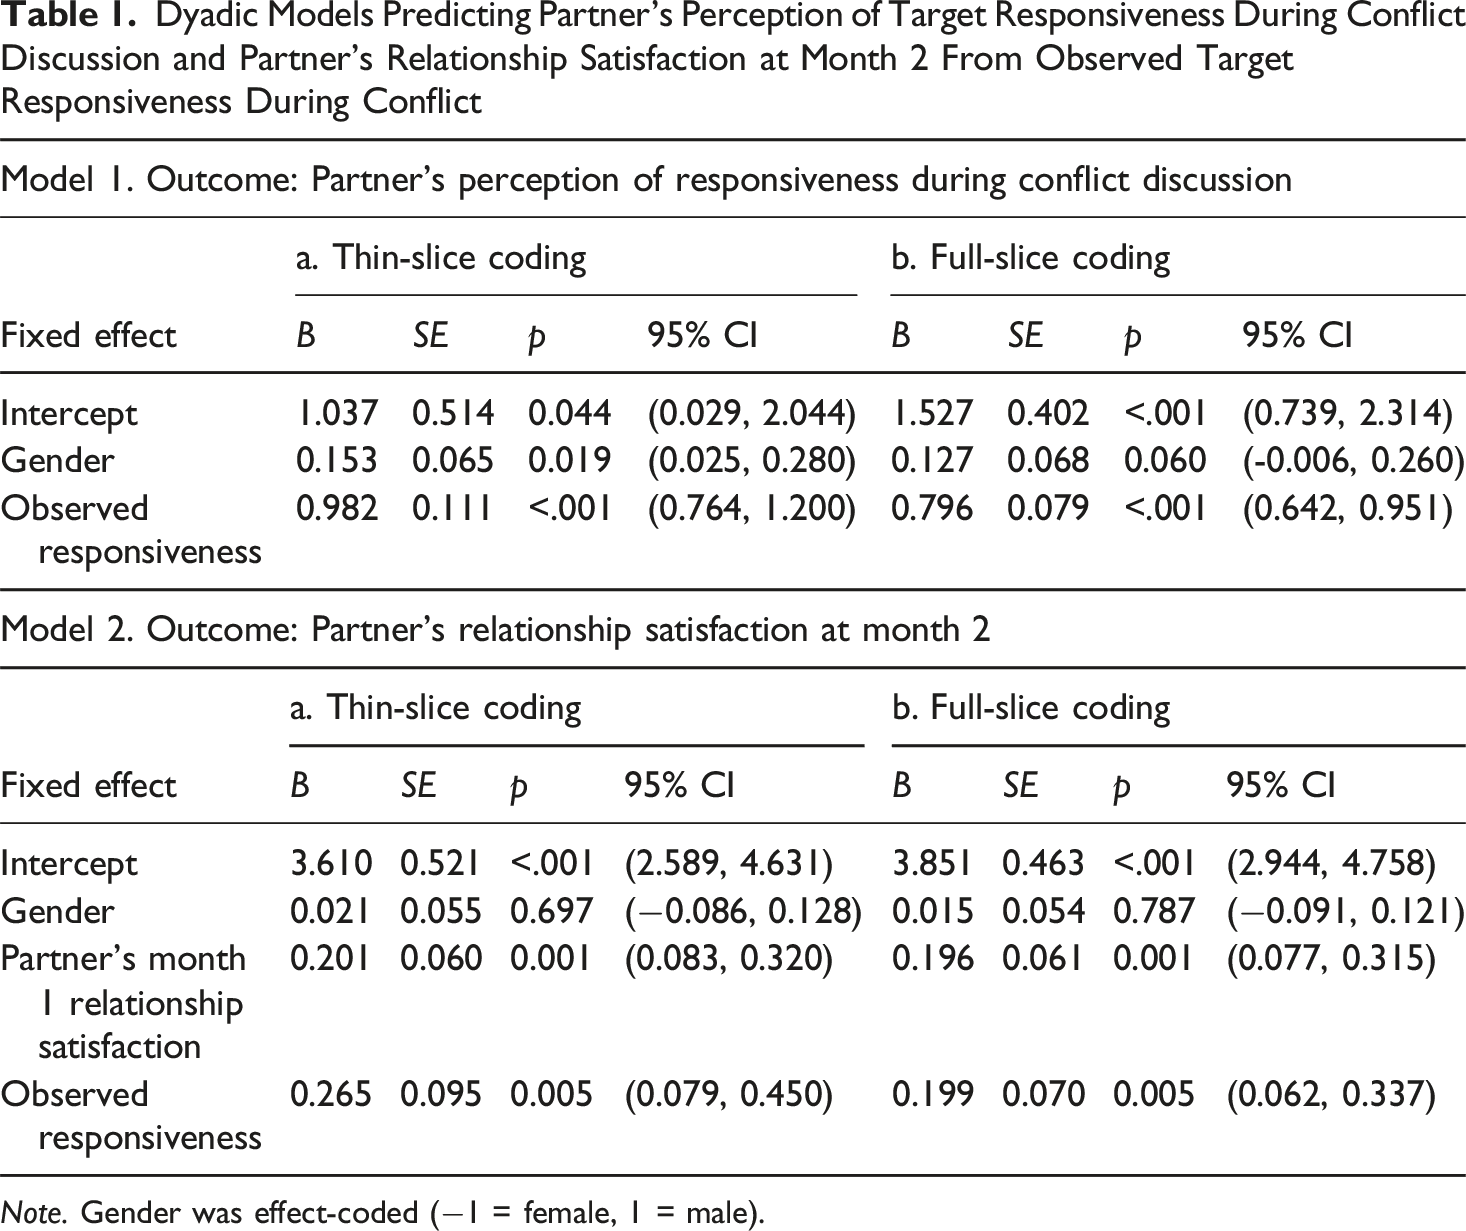
Note. Gender was effect-coded (−1 = female, 1 = male).
Predictive Validity
A dyadic multilevel model with partner’s Month 2 relationship satisfaction as the outcome, effect-coded gender, partner’s Month 1 relationship satisfaction, and thin-slice ratings as fixed effects, and dyad members as repeated measures with correlated errors (Kenny & Kashy, 2011) revealed that thin slice judgments of target responsiveness positively predicted changes in partner’s relationship satisfaction over a month (B = 0.27, 95% CI [0.08, 0.45]; see Model 2a of Table 1). The unstandardized effect corresponded to a standardized association of .19, which was equal to that obtained when thin slice ratings were replaced by full-slice ratings (Model 2b of Table 1), supporting the predictive validity of thin-slice ratings. 2
Estimating the Optimal Coding Team Size
Coder Bias
Thin-Slice Coders
Figure 5(a) illustrates the deviation of thin-slice coding teams from ground truth operationalized as the pooled rating of 50 thin-slice coders. We formed 100 random teams of size n so that we could estimate average bias as well as its variability. With two coders, average bias per target was .70, which was almost equal to one standard deviation (.71) in pooled ratings of 50 thin-slice coders. That is, the average bias of two-coder teams may result in judging a low-responsive target as average, or an average-responsive target as high. From two to eight coders, average bias declined to less than half a standard deviation (.31) and, importantly, approximated the oracle (i.e., least biased combination of eight coders). After eight coders, decline in random teams’ bias slowed down and remained close to the oracle, with a difference of .05 or less. Finally, the average bias of 100 random teams of eight thin-slice coders was less than .10 points worse than the bias of 50 thin-slice coders when the ground truth was operationalized as the pooled rating of 18 full-slice coders (Figure 5(b)). These results suggest that for the thin-slice coding approach, a realistic balance in the team size versus coder bias trade-off can be achieved around eight coders. Average coder bias as a function of coding team size. We formed 100 teams of size n at random to estimate average coder bias and its variability. The variability is visualized by shaded regions, with the darkest shade referring to one standard deviation and the lightest to three standard deviations of mean bias. The oracle (red line) indicates the least biased combination of n coders. The average bias of thin-slice (panels (a) and (b)) and full-slice coders (panel (c)) are compared against a ground truth operationalized as the aggregate rating of all thin-slice (panel (a)) or full-slice coders (panels (b) and (c)). See Tables S2-S3 in Online Supplemental Material for all bias estimates and their confidence intervals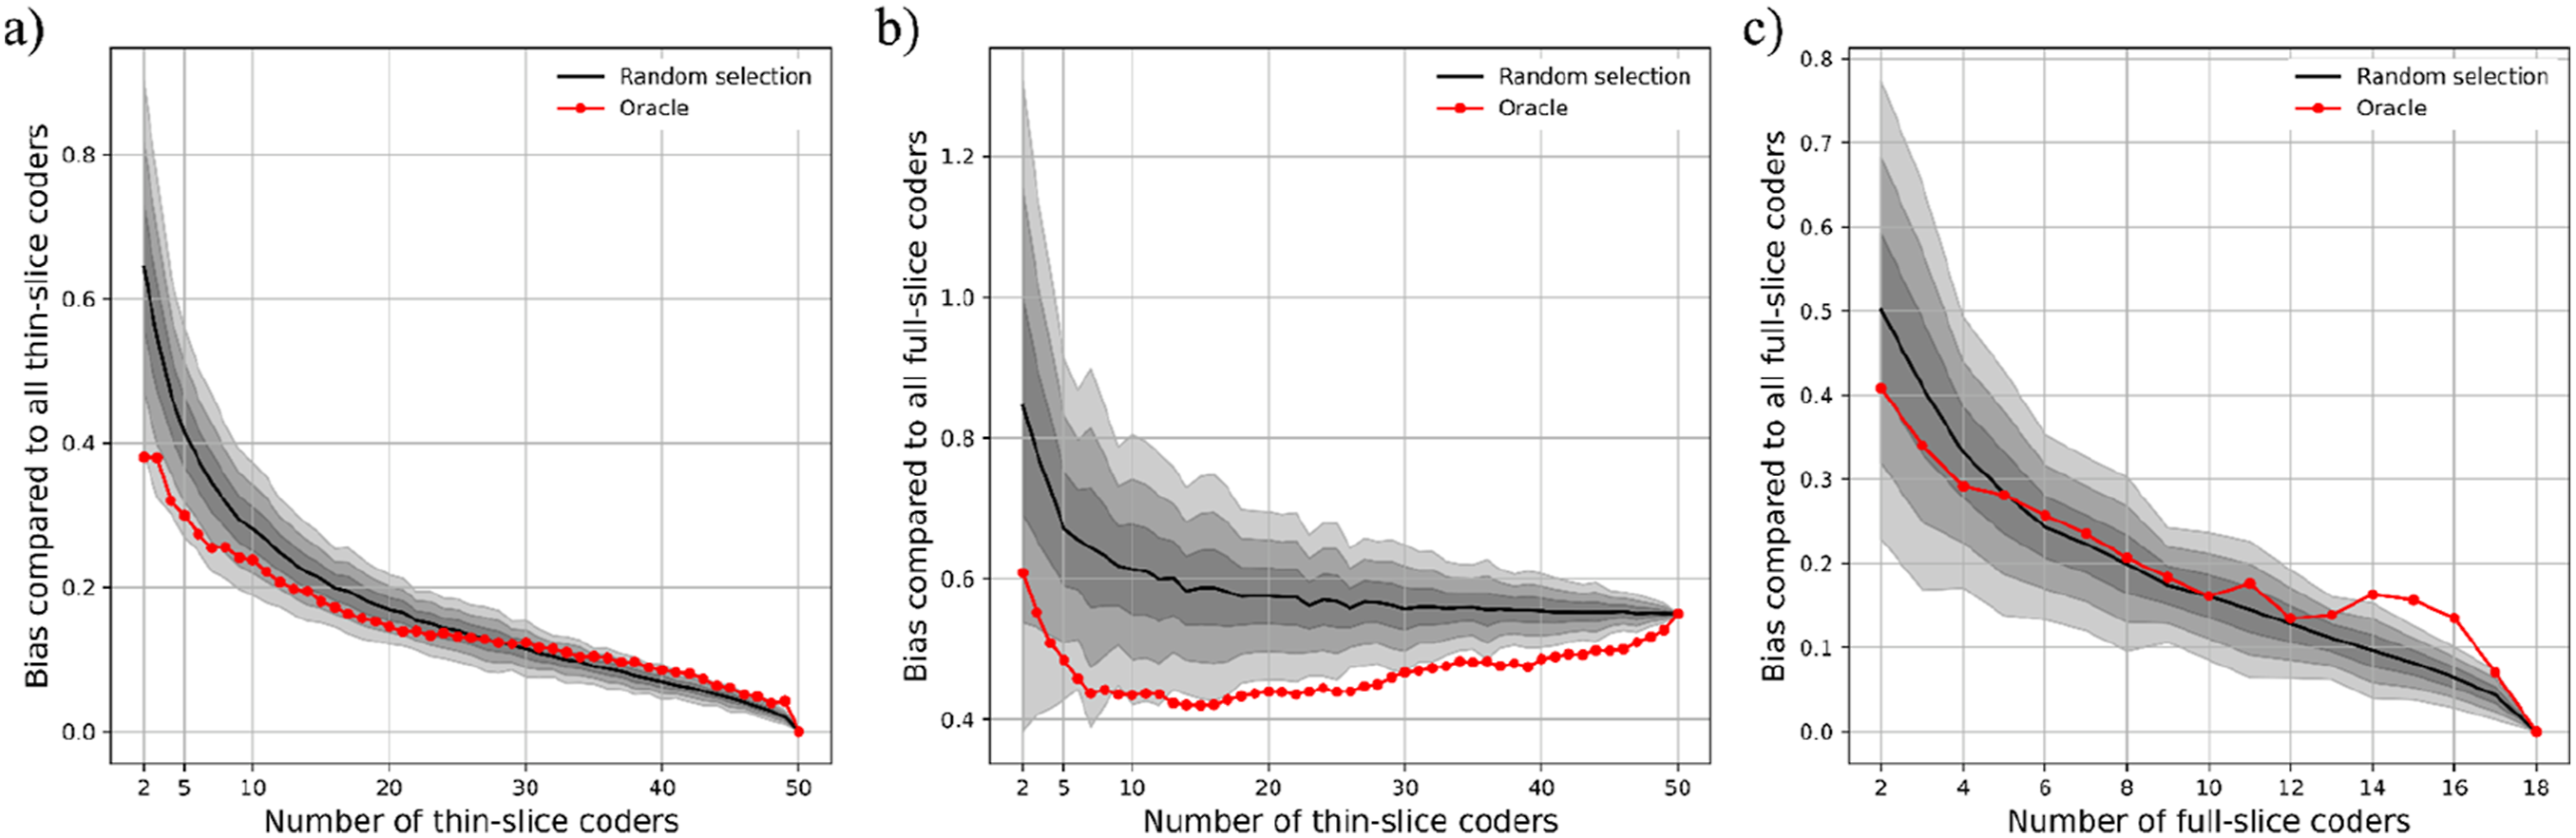
Full-Slice Coders
We repeated the analyses by forming teams of full-slice coders (Figure 5(c)). The average bias of 100 random two-coder teams was 0.5 points, which was roughly half a standard deviation in pooled rating of all full-slice coders. By five coders, average bias declined to less than .3 standard deviations and random teams started performing as well as the oracle. These findings suggest that when full-slice ratings are used, bias reduction gains can be achieved with smaller teams (of around 5 coders) as compared to when thin-slice ratings are used.
Effect Size Attenuation
To evaluate the extent to which increasing coding team size reduced effect size attenuation, we re-estimated the dyadic multilevel models predicting partners’ perceptions of target responsiveness and change in partners’ relationship satisfaction while systematically varying coding team size using a bootstrapping approach. The model specifications were identical to those used in the accuracy and predictive validity analyses; the only difference was the number of coders contributing to the pooled observed responsiveness rating. As in the coder bias analyses, coding team size was varied systematically, starting with two coders and increasing one coder at a time. For each team size, we generated 100 random coding teams via sampling with replacement and reperformed the models. This procedure allowed us to estimate the average fixed effect of observed responsiveness across the 100 random teams at each team size, along with its corresponding confidence interval.
Thin-Slice Coders
With two-coder teams, the average unstandardized associations were roughly halved to 0.14 points (from 0.27) for change in partner’s relationship satisfaction and to 0.51 (from 0.98) for partner’s perception of responsiveness. However, in line with the bias analysis, the attenuation was mostly reversed at eight coders, to 0.23 for partner’s relationship satisfaction and 0.83 for partner’s perception of responsiveness. The marginal increase in effect size was at a relatively steady slow rate after that point (Figures 6(a)–(b)). In sum, teams of eight thin-slice coders limited the attenuation in observed associations on average to around 15% for both partner’s perception of responsiveness and change in partner’s relationship satisfaction.
3
Bootstrapped dyadic multilevel models predicting change in partner’s relationship satisfaction (panels (a) and (c)) and partner’s perception of target responsiveness (panel (b) and (d)) from observed target responsiveness. Effect sizes and their standard errors are plotted as a function of coding team size. See Tables S4-S5 in Online Supplemental Material for all effect size estimates and their confidence intervals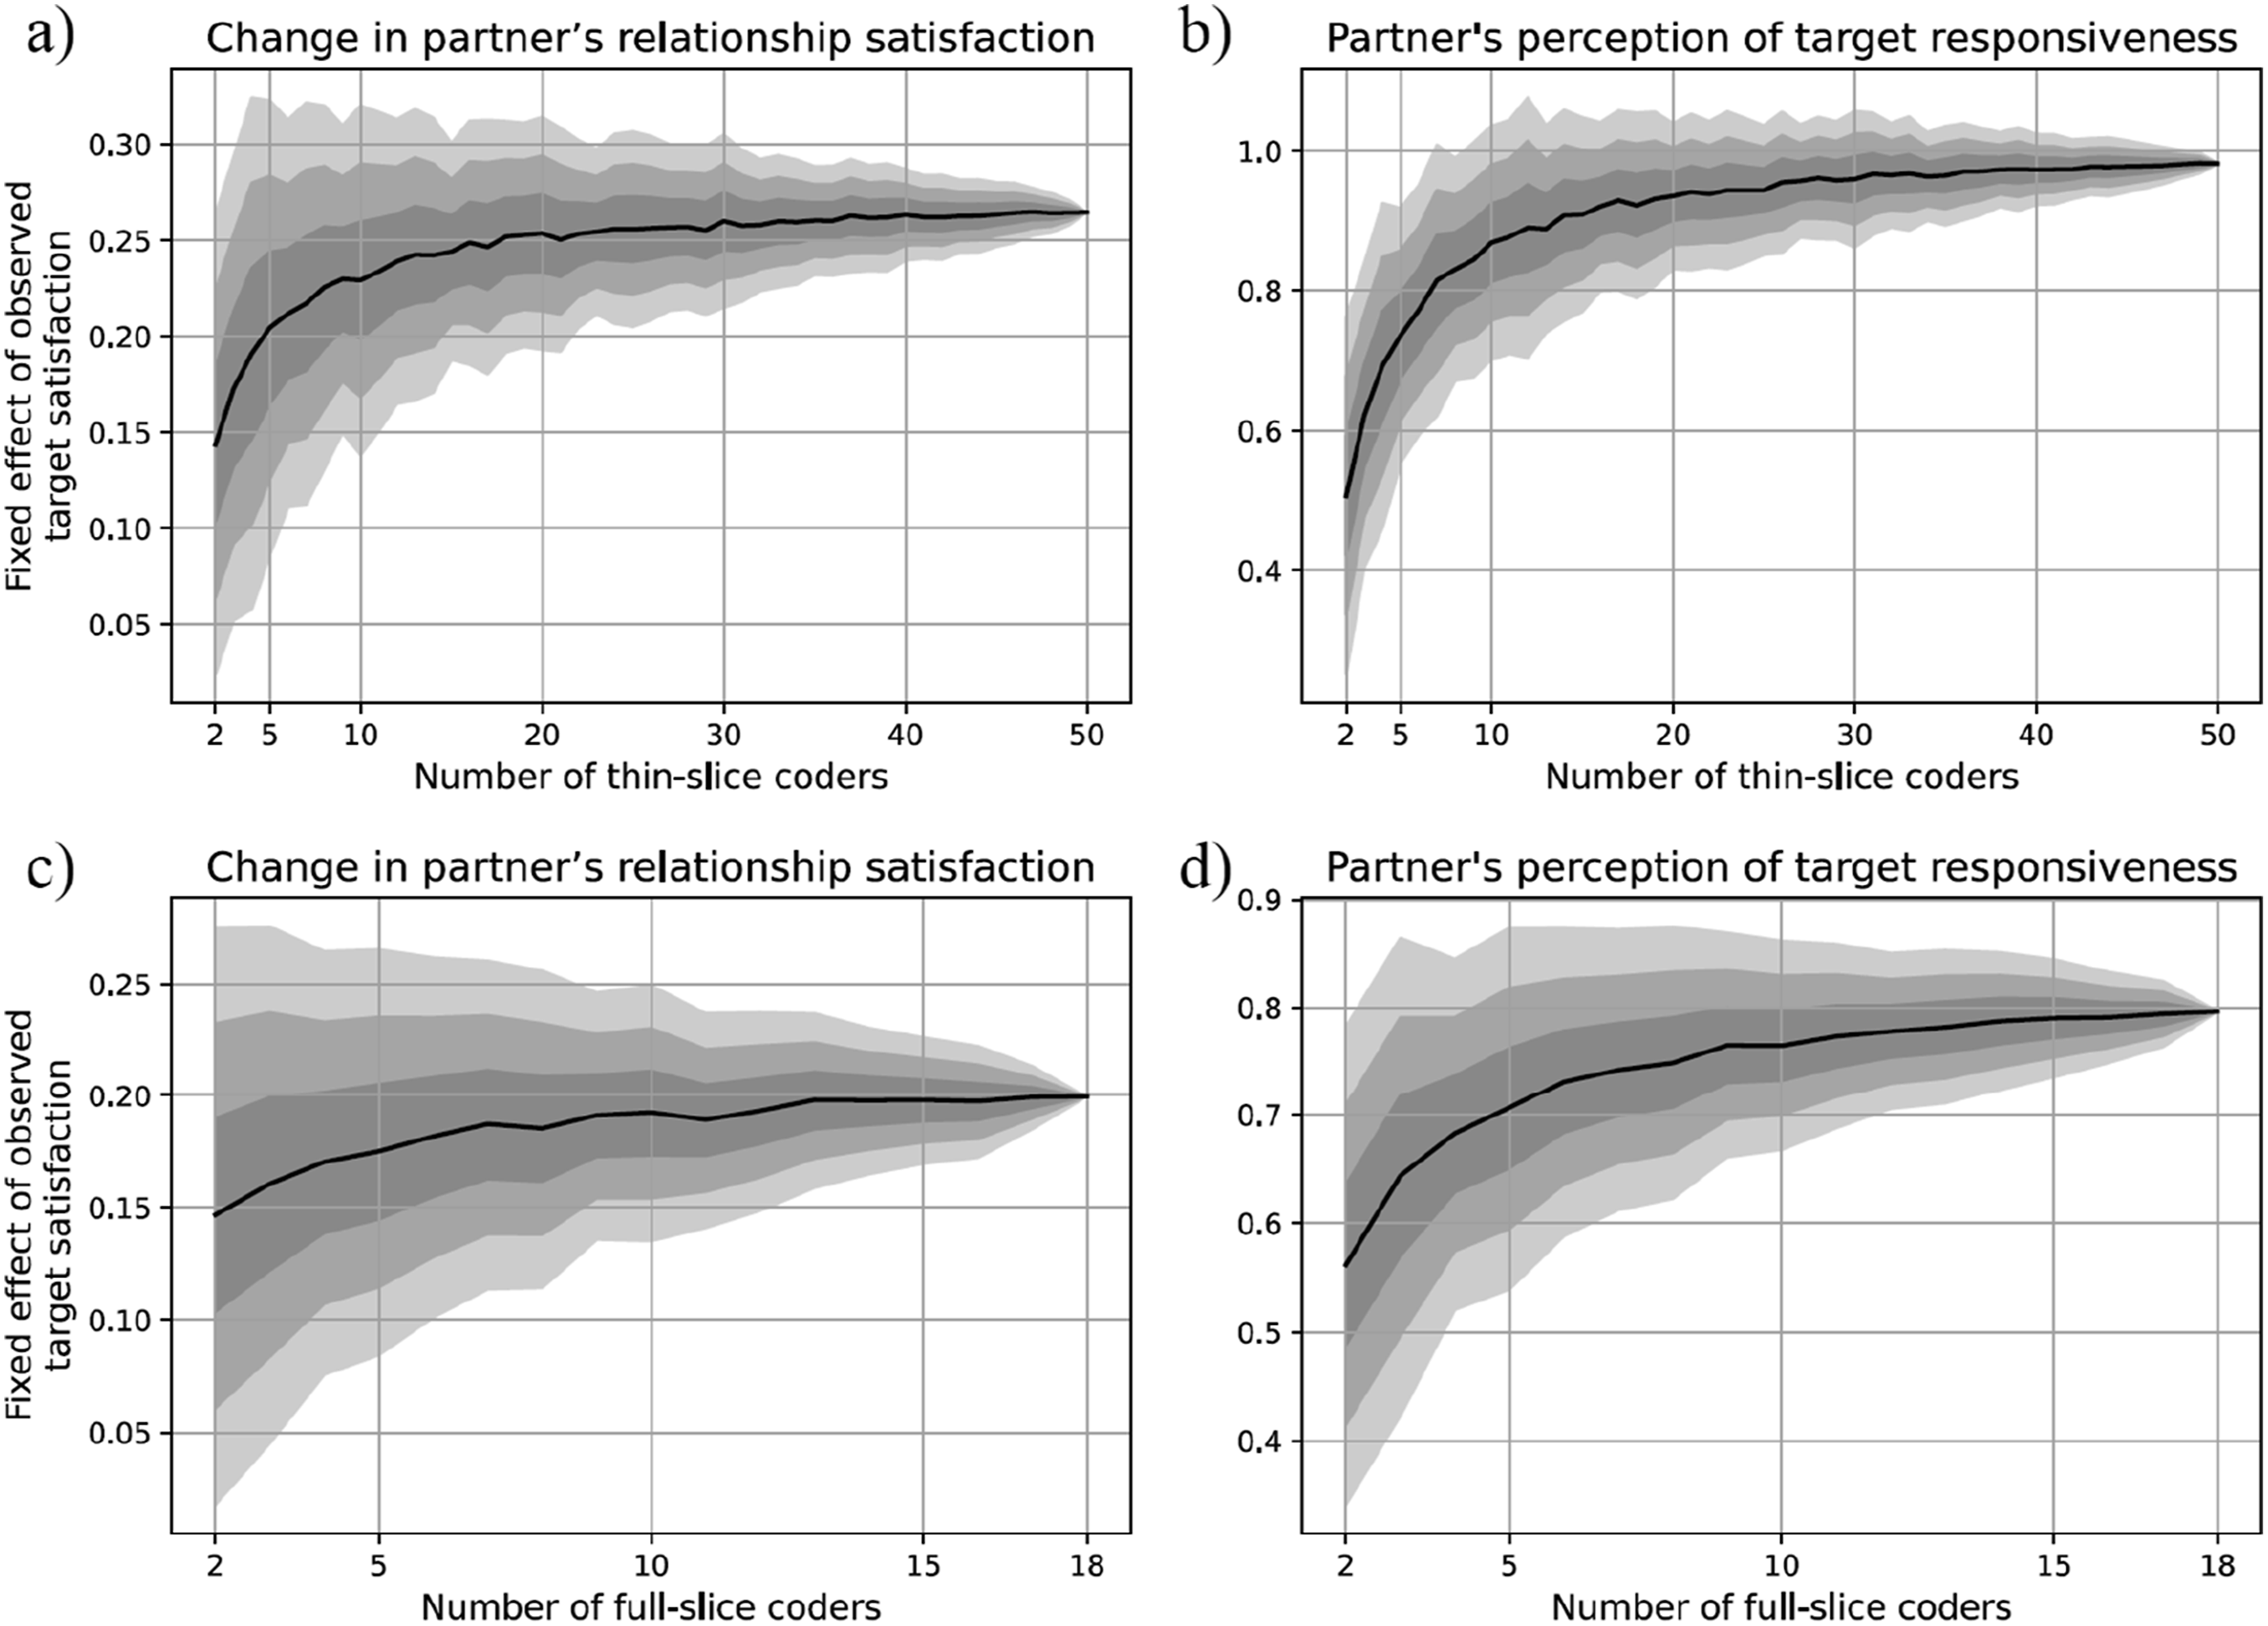
Full-Slice Coders
With two-coder teams, the average attenuated associations were .15 (compared to .20) for change in partner’s relationship satisfaction and .56 (compared to .80) for partner’s perception of responsiveness. The attenuation was mostly reversed at five full-slice coders (Figures 6(c)–(d)), yielding average estimates of .18 for change in partner’s relationship satisfaction and .71 for partner’s perception of responsiveness. Overall, the attenuations with five coders relative to 18 coders were 13% and 10%, respectively. 4
Discussion
Implications for Observational Research
Further gains in bias reduction were still possible until around 20 thin-slice and 10 full-slice coders. Although such large full-slice coding teams were used in recent studies (e.g., Bayraktaroglu et al., 2023), this decision ultimately rests on availability of resources, particularly given the diminishing marginal returns.
The oracle approach we adapted to estimate coder bias assumes that the aggregate judgment of the full coding team approximates a ground truth or, alternatively, provides a practically meaningful estimate of minimum bias. This assumption requires that the full team be sufficiently large such that the marginal change in the aggregate judgment with each additional coder is practically negligible. Although the full-slice coder team (n = 18) and the thin-slice coder team (n = 50) used in the present study were large relative to prior observational work, did they constitute a practically meaningful ground truth? The shape of the coder-bias function helps answer this question. If bias had declined in an approximately linear fashion up to the full team size, this would suggest that the full teams were insufficient for oracle analyses. Instead, for both full- and thin-slice coders, the bias functions showed a clear tapering of bias reduction beyond a certain point, indicating that the full team sizes were adequate for the oracle approach. These patterns also have implications for replication and future study design. Specifically, gains in bias reduction slowed markedly after approximately 20 thin-slice coders and 10 full-slice coders, suggesting that these team sizes may represent efficient choices for studies applying the oracle approach to bias estimation in observational research.
In analyses examining the association between observed target responsiveness and partner-reported target responsiveness during the conflict discussion, increases in effect size as a function of coding team size were substantial both in relative and absolute terms. In contrast, although percentage increases were still large in models predicting partner relationship satisfaction, the absolute changes were relatively small. It is important to note, however, that the latter analyses constituted particularly conservative tests: The outcome was measured one month later and the models controlled for baseline levels. Under such conditions, effect sizes are necessarily small, and even modest gains in predictive power achieved through larger coding teams may be consequential, as these effects are inherently more difficult to detect. More broadly, given that effects in observational relationship science are typically small regardless of interaction type (e.g., shared positive events [Bayraktaroglu et al., 2023], conflict [Beck et al., 2014)], support [Feeney, 2007]), particularly when outcomes are assessed using different methods and/or at later time points, incremental increases in predictive power afforded by slightly larger coding teams may meaningfully reduce the risk of false negatives.
Constraints on Generality
The present findings are most relevant to global rating studies, in which coders assign one or a few summary ratings after viewing an interaction. They are not readily generalizable to molecular (or micro) coding systems, which involve many fine-grained ratings as behaviors unfold. Because molecular systems tend to be noisier (Thorson & West, 2024), we expect the magnitude of coder bias in such systems to be higher than what we observed.
While the present study provides the first evidence for the viability of thin-slice coding as a resource-efficient alternative in observational studies of relationship maintenance, important questions remain regarding the performance of even thinner slices of information. For example, would shorter slices yield comparable information, or would combining two slices rather than three be sufficient? Would slices restricted to a single modality, such as auditory-only or nonverbal visual information, support accurate judgments? Addressing these questions would help guide relationship scientists in evaluating the feasibility of alternative, resource-efficient approaches to behavioral observation.
Asking female thin-slice coders to rate male targets and male coders to rate female targets allowed us to hold coder and partner gender constant when examining associations between thin-slice responsiveness ratings and partner-reported outcomes. However, this design choice precluded comparisons between same-gender and different-gender coder–target pairs. Whether coder gender, and more broadly other coder demographic characteristics, influence thin-slice ratings in observational relationship research remains an open question for future work.
A further limitation is that the observed conflict discussions were drawn from fledgling, different-sex couples. Whether these findings generalize to same-sex couples or to couples at later stages of their relationships remains to be tested empirically.
To maximize the generalizability of our findings, we selected a widely used observational paradigm in couple research—conflict discussions—and a global interpersonal behavior—responsiveness—that plays a central role in several important relationship processes. We therefore expect our results to generalize reasonably to other observed behaviors (e.g., partner enthusiasm) and interpersonal contexts (e.g., positive event disclosures). Two past studies provide suggestive support for our intuition. The first one found that the proportion of variance attributable to coders was similar across different behaviors and situations when observing spousal stress and support (e.g., Lavigueur et al., 1993). The second one showed that coding teams of five or more full-slice coders achieved interrater reliability of .70 or higher for six out of seven different relationship dimensions (Baucom et al., 2017), mirroring our findings.
Nevertheless, only future research will tell whether the empirical benchmarks produced by our analyses are replicated using different relationships, relationship stages, interaction contexts, and coded traits. To support such efforts, we have made our analysis code publicly available on the project’s OSF page. This code allows researchers to apply the same bias analyses to their own behavioral observation datasets. We hope that the reuse of this analytic tool will prove useful as the field collectively accumulates replication and generalizability evidence across a wider range of observational paradigms.
Conclusion
Despite the value of observational research, work on its “nuts and bolts” has been rare. In this study, we addressed two critical questions: whether observing thin slices offers comparable validity to observing full interactions in couples, and how coding team size is associated with bias and effect size attenuation. We hope that our findings and the resulting empirical benchmarks and practical recommendations prove useful to relationship scientists designing new observational studies, evaluating coder bias in existing data, and making informed decisions about coding strategies.
Supplemental material
Supplemental Material - From Bias to Brevity: Balancing Coder Bias and Team Size in Thin-Slice and Full-Length Observations of Couple Interactions
Supplemental Material for From Bias to Brevity: Balancing Coder Bias and Team Size in Thin-Slice and Full-Length Observations of Couple Interactions by Emre Selcuk, Onur Varol, Gul Gunaydin, Zeynep Deniz Ozden, Turan Deniz Ergun in Journal of Social and Personal Relationships
Footnotes
Funding
The authors disclosed receipt of the following financial support for the research, authorship, and/or publication of this article: The study was funded by the Sabanci University Integration Grant No: B.A.CG-20-02169 given to Emre Selcuk. Existing dyadic interaction records originally came from a project funded by the Scientific and Technological Research Council of Turkey (Grant No: 118K162) given to Gul Gunaydin.
Declaration of Conflicting Interests
The authors declared no potential conflicts of interest with respect to the research, authorship, and/or publication of this article.
Data Availability Statement
Open Science Statement
As part of IARR's encouragement of open research practices, the author(s) have provided the following information: This research was not pre-registered. The data used in the research are available. The data can be obtained at ![]() . The materials used in the research are available. The materials can be obtained at https://osf.io/gtac5/overview?view_only=a57c0d0d0758440a915ebab4d98ec1ef.
. The materials used in the research are available. The materials can be obtained at https://osf.io/gtac5/overview?view_only=a57c0d0d0758440a915ebab4d98ec1ef.
Supplemental material
Supplemental material for this article is available online.