
Abstract
Navigating indoor spaces is especially challenging for individuals with blindness and visual impairments. Although many solutions currently exist, the acceptance of most of them is extremely poor due to their technical limitations and the complete lack of taking into consideration factors, such as usability and the perceived experience among others, which influence adoption rates. To alleviate this problem, we created BlindMuseumTourer, a state-of-the-art indoor navigation smartphone application that tracks and navigates the user inside the spaces of a museum. At the same time, it provides services for narration and description of the exhibits. The proposed system consists of an Android application that leverages the sensors found on smartphones and utilizes a novel pedestrian dead reckoning (PDR) mechanism that optionally takes input from the Bluetooth low energy (BLE) beacons specially mounted on the exhibits. This article presents the extended Usability and User Experience evaluation of BlindMuseumTourer and the findings carried out with 30 participants having varying degrees of blindness. Throughout this process, we received feedback for improving both the available functionality and the specialized user-centred training sessions in which blind users are first exposed to our application’s functionality. The methodology of this evaluation employs standardized questionnaires and semi-structured interviews, and the results indicate an overall positive attitude from the users. In the future, we intend to extend the number and type of indoor spaces supported by our application.
Keywords
Introduction
Loss of eyesight ranks third among disabilities globally. Steinmetz et al. (2021) report that the number of blind people will increase to 38.5 million by 2020 and 115 million by 2050. For the next three decades, it is projected that individuals with moderate and severe visual impairments (MSVI) will rise to more than 550 million, a significant increase from the approximately 200 million individuals in 2020 (Bourne et al., 2017). Furthermore, the World Health Organization (WHO; 2021) reports that most of these individuals live in low-income areas, which raises the challenges of daily life even more due to the serious social and economic issues these regions face.
Despite technological progress, individuals with blindness and visual impairments are still excluded from social events hosted in indoor spaces. These are usually related to entertainment venues and educational institutions among others. The most prominent limiting factor for this target group is the lack of spatial awareness, thus restricting their independent mobility. While cutting-edge solutions exist for the indoor navigation of individuals with blindness and visual impairments, they are not being utilized in real scenarios and thus, have no impact at all. In this article, we present a blind navigation system developed as part of the MANTO project (MANTO, 2022; Meliones & Filios, 2016; Meliones & Sampson, 2018), called BlindMuseumTourer, which enables users to safely navigate in indoor spaces, along with the system’s usability and user experience (UX) evaluation. Specifically, in section ‘Background’, we present a survey of the available indoor navigation solutions found in the literature highlighting the progress throughout the past decade as well as the different approaches and their limitations. In section ‘System design’, we present the system design, a high-level overview of the main components comprising the application along with the software design pattern of choice for the implementation. Section ‘Usability and UX evaluation’ presents the methodology followed to assess the usability and UX of the application after the users had completed special training sessions, along with the findings of the analysis that could be used as guidelines by other researchers and developers in the field. In section ‘Discussion – Limitations – Future actions’, we present a thorough discussion including the lessons learned, limitations, and future work addressing the existing challenges. Finally, section ‘Conclusion’ concludes the article by summarizing the main points of this work.
Background
A first step in implementing effective solutions for indoor blind navigation is the recognition of the basic requirements of this specific target group (Theodorou & Meliones, 2020, 2022; Theodorou, Meliones, & Filios, 2022). The available literature includes several papers focused on blind user’s requirements analysis for indoor navigation and independent mobility in central public buildings. Specifically, the authors in Dias, Teves, et al. (2015), after a thorough analysis of interviews held with experts and blind participants, describe the needs and challenges of the target group when navigating in indoor spaces. Furthermore, Gallagher et al. (2014) recommend a set of technical criteria for setting a baseline for navigation devices. These include location accuracy, robustness, flexibility, adaptability to indoor environments, and the quality of the issued instructions. This framework has been widely used to assess compliance with a minimum set of features in a non-quantifiable way concerning navigation applications for individuals with blindness and visual impairments identifying, simultaneously, unresolved issues and areas of potential improvement. Finally, these efforts made it clear that many of the unresolved issues could be solved by incorporating into the design process the blind users themselves as well as their challenges considered in the broader social context.
Miao et al. (2011) proceed with a thorough analysis of user requirements for multimodal mobile applications, conducted with blind users, while Fallah et al. (2013) identify several research issues that could facilitate the extensive development of indoor navigation systems. In Giudice and Legge (2008), the authors describe some of the navigation technologies supporting independent travel available to blind people. The primary focus here is on large-scale blind navigation in both unfamiliar and familiar environments. Dakopoulos and Bourbakis (2010) present a comparative survey between handheld/wearable obstacle detection/avoidance systems regarding the provided functionality of these systems and how these solutions advance the state of the art of assistive technologies for visually impaired people.
Guidelines for future research related to indoor navigation and destination-finding tools for assisting people with blindness and visual impairments are discussed in Dias, Steinfeld and Dias (2015). These include localization techniques that utilize a variety of sensors and crowdsourcing, customized user interfaces, point of interest lists, accessibility instructions, floor plan representations, and path planning. As key enablers of the broader vision of effective navigation solutions, they recognize the enhancement of the existing urban infrastructure, including the construction of smart cities and the introduction of ubiquitous assistive robotics technology solutions, among others. Finally, smartphones and other mobile devices will be the main way to provide navigation capabilities to people that are blind and visually impaired.
Surveys
A lot of surveys exist in the literature with each one reviewing different aspects of the proposed systems and reporting the new advances in the area. Islam et al. (2019) review recent innovative assistive technologies and present the advantages and disadvantages of existing solutions in the fields of computer vision, embedded systems, and mobile devices. In particular, the recognized challenges for systems based on ultrasonic sensors are mostly their limited detection range (200–400 cm) and their vulnerability to environmental factors. Systems based on infrared (IR) technologies can demonstrate degraded performance due to ultraviolet sensitivity, especially during the daytime. Next, for the case of computer vision-based systems, the authors highlight their reduced performance due to factors such as hard-to-identify objects, perspective, low obstacles visibility, and bad lighting conditions, among others. Last but not least, smartphone-based solutions can have poor audio feedback that can be lost in a noisy environment, and many people with blindness and visual impairment experience difficulty when utilizing smartphones. Therefore, based on these observations, the authors recognize areas requiring further improvements and lay out a plan for future work. Finally, they conclude with a set of rules that every assistive solution should satisfy to be effective. This set includes (1) simplicity in design so that no extra external devices are required, (2) low cost, (3) low weight, (4) reliability and dependability, and (5) coverage of both indoor and outdoor scenarios.
The authors of Alam et al. (2018) provide an overview of the methods used by navigation systems to locate staircases using computer vision. Most systems achieve a very high accuracy rate in recognizing static and horizontal stairs, but not spiral stairs. Although several systems have been developed, there is room for further improvement. Similar to Islam et al. (2019), by doing this comparative review, the authors provide a comprehensive list of available systems that will help future researchers in their efforts to advance the field.
Subedi and Pyun (2020) make a comparative review of indoor localization solutions based on smartphone devices leveraging radio frequency technologies. Fingerprinting localization is very often used for this kind of application as it demonstrates good localization accuracy; however, its requirement for offline training significantly reduces its practicality. Specifically, the review focuses on practical indoor positioning systems that consist of a smartphone and Wi-Fi/Bluetooth low energy (BLE) beacons. Furthermore, the authors provide details about the challenges of practical indoor positioning systems, the available solutions, and a comprehensive performance comparison. Finally, the paper presents some future trends in indoor positioning systems development. This includes the design of hybrid systems that combine many methods and alternative technologies, an effective mechanism for learning radio signals, and deep learning algorithms, as well as solutions that make it easier to acquire data.
Last but not least, Real and Araujo (2019) present a holistic review of indoor and outdoor navigation solutions for people with blindness and visual impairments aiming at bringing up to date developers about the state of the art. Specifically, they present solutions from early research on sensory substitution and indoor/outdoor positioning to recent systems based on computer vision. They address issues related to the design approaches of previous efforts as well as highlight the technological achievements of state-of-the-art solutions. Finally, based on their findings, they propose future directions.
Radio-frequency identification/near-field communication systems/multimodal RFID systems/BLE
The ‘Ways4all’ (Kiers et al., 2011) project uses passive radio-frequency identification (RFID) tags as the main driver of their tactile guidance system for indoor route navigation and detection of obstacles. At all strategic points of a building (the entrance, platforms, and intersections) passive RFID tags are placed and their location along with other relevant information are stored as pairs in a database. These tags transmit a unique code received by the user’s smartphone with the help of an RFID reader. The system calculates the optimal route based on their proposed algorithm (Gerwei-Method) that takes as input the location, the moving direction, and the user profile. Finally, the routing information is issued in real-time to the user via the smartphone’s acoustic channels. The paper provides a cost estimation of the system demonstrating its relatively high cost. Among the limitations of the system are the utilization of short-range RFID tags as well as the fact that not all RFID tag readers work equally the same.
The PERCEPT system (Ganz et al., 2012) enhances indoor environment perception at public health facilities such as clinics, hospitals, and wellness centres, using carefully placed passive RFID tags, a customized handheld unit, a smartphone held by the user, and a server that generates and stores information about the building and the available RFID tags. The PERCEPT system directs the user to the destination combining information found at predefined kiosk locations, accessible via a custom-made glove, and points of interest ([POIs] e.g., rooms and elevators). The extension of the above tracking system (PERCEPT-II; Ganz et al., 2014) allows the user to carry only a smartphone and exploit near-field communication (NFC) tags on existing signage and POIs in the environment (e.g., doors, stairs, and elevators). Users receive audio navigation instructions when they touch the NFC tags using their phones. Yang and Ganz (2019) propose yet another system extension (Percept V) that provides to people with blindness and visually impairments real-time spatial perception during navigation in large public spaces. It also enhances the accuracy and functionality of the PERCEPT indoor navigation system by incorporating a sensing framework that utilizes low-power Bluetooth technology. In particular, the latter is leveraged from the smartphone application to find the user’s location, estimate the direction of their movement, and their proximity to existing POIs. Real-life test scenarios of the system show that it can provide sufficient information for the navigation, although its accuracy is not very high. Furthermore, some aspects of the sensing framework are not ready for real-life scenarios.
Jimenez Ruiz et al. (2012) present a sophisticated system that accurately tracks the indoor location of an individual through a combination of inertial navigation (INS) techniques with active RFID technology. The integrated INS and RFID methodology results in a typical localization error along the walking path (regardless of its length) of approximately 1.5 m. The main limitations of the system concern the low accuracy of the user’s actual location as well as the accumulation of location error that remains uncorrected when the user is moving upstairs or downstairs, on a ramp, opening a door, is in an elevator, on a moving escalator or conveyor belt.
Nair et al. (2019) propose a system comprised of a mobile application with a server that utilizes BLE beacons and a framework based on augmented reality (AR) to provide wayfinding instructions in a storytelling format emulating the behaviour of a sighted person escorting them. Besides having highly precise positioning and navigational capabilities enabling traverse of cluttered indoor environments, it also enables the user to find door handles, Braille signs, or elevator buttons. Furthermore, the proposed solution utilizes environmental annotations that greatly help the user to have a better grasp of the current environment’s static characteristics. The user interfaces with the application via either touch or voice input. It also provides a customized experience by varying the level of impact. One limitation of the system is that it remains an experimental attempt and is not yet a fully functional product.
IR, visible light, and ultra-wideband systems
Idrees et al. (2015) propose a novel indoor navigation application for blind people using QR codes. It is designed for Android smartphones and does not require any additional hardware. It provides automatic navigation assistance on predefined routes. QR codes are placed on sections of the floor at specific locations to detect current user position and assist navigation. Each time a QR code is scanned the user is given current location information and is prompted to select a destination. It then offers the shortest route using route finding algorithms. Whenever a deviation from the suggested route is detected during navigation, it prompts and guides the user back to the correct route by comparing the current route with the derived one. All instructions from the application are provided to the user in audio format. The user interacts with the application through a set of user-friendly gestures for information input. The main system’s limitation is that it has no object recognition module.
Kubanek and Bobulski (2018) present a prototype of a head-worn electronic device that supports the orientation of blind people through sound signals. The sounds are used to provide the blind person with a simplified map of the depth of the area in front of the device. An innovative element of this work is the use of the Kinect optical sensor that scans the space in front of the user and a set of custom-made algorithms that take into account the head tilt. The results of the experiments demonstrate that the modelled acoustic signals were correctly interpreted while the trials with the help of visually impaired people demonstrate the high effectiveness of the solution. Despite the promising results, the proposed solution has a high learning curve while the Kinect sensor is not suitable for scenarios with sunlight, thus minimizing the effectiveness of the system in real conditions.
Guerrero et al. (2012) present a system that determines the user’s trajectory, identifies possible obstacles on the given path, and provides navigation information to the user. The main features of the system are a walking stick equipped with several built-in IR sensors, two IR cameras (integrated into a Wiimotes module), a computer, and a smartphone. The computer runs a software application that utilizes Bluetooth-enabled Wiimotes to detect the user’s position and movement, and processes the information about obstacles in the proximity. Finally, the smartphone provides navigation information to the user via voice messages. The experimentation demonstrates satisfactory results. The main weakness of the system concerns the requirement of having a predefined map representation of the space beforehand, and the inability of the system to adapt to any changes made in the configuration of the objects in the space.
Jain (2014) presents the design of an active indoor pathfinding system for individuals with blindness and visual impairments based on a smartphone device, which includes a small wearable IR device and IR transmitters placed at specific locations in the building. These sensors transmit unique codes corresponding to locations perpendicular to the direction of the user’s movement. Using floor plans, the system provides accurate directions to any destination from any starting point. Despite its demonstrated effectiveness, the system has the following limitations: the user and wall module require a line of sight that can be affected either by the user’s clothes or the presence of crowds in places, and the requirement to install numerous wall modules for the system to be effective.
Magnetic systems
Riehle et al. (2012) describe the development and evaluation of a navigation system leveraging magnetic fields information. It consists of a wireless magnetometer mounted on the users’ hip and a smartphone that algorithmically processes the received stream of magnetic readings. Human trials were conducted to evaluate the effectiveness of the system by studying the performance of providing real-time guidance to blind and visually impaired people while executing several route scenarios. However, it is well established that environments with steel frame structures are the cause of significant magnetic distortions. Many of these distortions have sufficient intensity and spatial characteristics and are persistent, thus limiting the possibility of adopting this type of technology as the basis for positioning technology.
Gozick et al. (2011) collected an extensive dataset of 2000 data points using a mobile phone device with an embedded magnetometer. Leveraging these magnetic fields, they can signify POIs and provide guidelines, distinguish rooms and corridors, and be used as a reference for generating magnetic maps of floors. Despite the successful demonstration of the solution’s effectiveness, the proposed system has poor results in tracking turns when the compass heading is fluctuating, its measurement process needs to better address human error, and finally, the robustness and performance of the selected classification techniques need to be improved for the cases of rooms and corridors.
Three-dimensional sensor and AR systems
Bourbakis (2008) presents a system that detects changes in a three-dimensional (3D) space based on a combination of range data and image data obtained from cameras, creating a 3D representation of the surrounding space. The latter and the detection of dynamic changes in the space are mapped onto a two-dimensional (2D) vibration array mounted on the chest of the blind user. The degree of vibration aids the user’s perception of the 3D space and its changes.
Joseph et al. (2013) introduce a new approach to using building floor plans to create semantic maps. Room numbers, doors, and the like serve as points of reference to infer the waypoints in each room. This article demonstrates the potential of AR as an interface for blind users to perceive the physical constraints of the real world. The proposed solution uses haptic and vocal feedback to emit critical information. The haptic belt vibrates as the user moves towards the travel destination based on positioning metrics. In addition, voice guidance instructions about the travel route are issued to the user by accurately estimating the user’s location and confirming it by extracting POIs. The results show that it is feasible to safely and independently navigate a blind user by informing about the environmental constraints through AR. The system’s main limitation, however, is that it fails to provide increased safety in real-world situations.
Lee and Medioni (2015) present a novel RGBD (Red, Green, Blue, and Depth) camera-based wearable navigation system. It consists of a smartphone, a glass-mounted RGBD camera device, a real-time navigation algorithm, and a haptic feedback system. To extract the orientation information, the navigation algorithm performs in real-time six-degree-of-freedom (6-DOF) feature-based optical odometry from the input of the RGBD camera. The navigation algorithm also generates a 3D voxel map of the environment and analyses its traversability, while the path planner generates a safe and efficient path to a reference point. The haptic feedback system, consisting of four micro-vibration motors, is designed to guide the visually impaired user along the computed path and minimize the cognitive load. The main limitations of the proposed system include occasional inaccurate visual odometry results caused by rapid head rotations as well as accumulated errors upon revisiting the same place repeatedly. Finally, the system has not been tested with real blind users.
He et al. (2015) propose an ego-motion tracking method that uses visual–inertial Google Glass sensors for wearable blind navigation. The authors introduce a visual sanity check that compares the visually estimated rotation with the rotation measurement from a gyroscope. The motion trajectory is generated by adaptively fusing the visual estimations and inertial measurements. The use of a multiple extended Kalman filter as the method of fusion solves the problem of the frame rate difference between visual and inertial sensors. The proposed solution was tested in different indoor environments according to the authors, demonstrating its effectiveness and accuracy. Nonetheless, the proposed system still needs to address robustness issues as well as its real-time performance.
Simoes and de Lucena (2016) present an embedded navigation system that is used as an audio aid for individuals who are blind or visually impaired based on visual marker recognition and ultrasonic obstacle perception. The visual markers correspond to POIs in the user’s environment. These points are depicted on a map that indicates the distance and direction between the various points of approach, thus creating a virtual path. The proposed system is based on wearable glasses equipped with sensors including an RGB camera, magnetometer, ultrasound, gyroscope, and accelerometer sensors to greatly improve the amount and quality of the information. The user can freely navigate the environment via the identification of location markers. The calculation of the path to the next marker uses either the origin point or the location point information along with the value returned by the gyroscope sensor. The users interact with the system via audio utilizing simple known instructions to indicate with accuracy the desired route and obstacles in it. The experimental results demonstrate rates of about 94.92% successful marker recognition using only 26 frames/s and 98.33% of ultrasonic obstacles perception at a distance between 0.50 and 4.0 m. The system’s main weaknesses concern quality limitations in indoor navigation as well as reduced confidence in the presence of low-light conditions.
The Horizon 2020 Sound of Vision (2017) project is implementing a non-invasive hardware and software system that creates and conveys to a blind person an acoustic representation of the environment (indoor/outdoor), continuously, and in real-time, without requiring tags/sensors located in the environment. The main objective of the project is to design and implement optimal algorithms for creating 3D environment models and for rendering these using spatial audio signals. In Botezatu et al. (2017), the 3D acquisition module is enhanced to support both indoor and outdoor spaces in various illuminating conditions by employing data fusion from multiple sensors. Specifically, it fuses data from a stereo RGB camera, a structured light sensor, and an inertial measurement unit (IMU) device to deliver consistent data to image processing algorithms in non-typical conditions to normal CMOS sensors. The system is implemented as a wearable device mounted on the user’s head. Preliminary experimentation, carried out in modelled indoor environments, demonstrated its feasibility as blind and visually impaired volunteers were able to perform simple navigation tasks and avoid cardboard box obstacles. Among the weaknesses of the system are the lack of thorough experimentation and the weight aspect of the wearable device as after prolonged use the headgear can cause a feeling of discomfort and fatigue.
Travi-Navi (Zheng et al., 2017) is another sophisticated navigation system with displays that allow a user to easily launch and deploy indoor navigation services on a smartphone, without requiring either a full indoor tracking system or available floor maps. Travi-Navi captures high-quality images during a guider’s walk on navigation routes, collects a rich set of sensor readings, and groups them into a navigation trace. The followers track the navigation trace and receive instant visual instructions and image tips as well as alerts when they deviate from the correct route. Travi-Navi also finds shortcuts whenever possible. The evaluation results demonstrate the capabilities of the system to track and navigate users with timely instructions, typically detecting deviation events. The authors provide the battery consumption of the application on three different devices averaging a capacity of 2150 mA that achieve on average a runtime of 3.6 hr in Guider Mode and 4.29 hr in Follower Mode. Among the weaknesses of the system are the increased number of steps required to detect deviation events as well as the rather high power consumption.
Zhang et al. (2019) present an indoor navigation system that utilizes a smartphone device, mounted on the user’s body, and exploits the capabilities of Google ARCore to acquire robust computer vision-based localization without requiring Global Positioning System (GPS) and wireless beacons. It also utilizes an adaptive artificial potential field-based path planning component to help guide users away from obstacles. The system, besides the smartphone device, consists of headphones and gloves with haptic sensors that provide a two-channel human–machine interaction mechanism for continuous guidance. Specifically, the haptic interface creates situational awareness while the audio interface helps to avoid obstacles. Compared with conventional visual odometry systems, the system achieves better mapping and positioning. Among the limitations of the system is the fact that it requires users to wear custom-made equipment covering a large portion of their bodies.
Map matching
Ivanov (2017) uses another approach to develop indoor navigation systems for people that are blind and visually impaired by modelling building information. It provides rich semantic information about all building elements, objects, and users located in the building and allows information about the topology of a specific part of the building to be extracted. This information is subsequently used by an algorithm to improve route finding accuracy. The proposed system can help to solve the existing problems in the field of indoor navigation for people that are blind and visually impaired.
Wi-Fi multimodal systems
Dao et al. (2016) present an indoor navigation assistance system that combines visual information and Wi-Fi to detect and locate people on the move. This combination offers some advantages over single-technology systems, such as installation cost, computational time, and accuracy. The interface of the application with users is via voice synthesis and recognition. Experimental results demonstrate the suitability of the proposed technologies for navigation assistance. However, so far, the accuracy of the localization solution (1.71 m with 90% reliability) is insufficient for real applications and the supported language is limited to Vietnamese.
Dead-reckoning systems
Riehle et al. (2013) describe the construction and evaluation of an inertial dead reckoning navigation system providing real-time acoustic guidance along mapped routes. It uses information from the mapped route to reduce the accumulation of errors inherent in traditional dead reckoning approaches. The prototype system consists of a wireless inertial sensor module mounted on the users’ hip, which transmits readings to a smartphone executing a navigation algorithm. Experimental tests were conducted with the aid of test subjects to evaluate the effectiveness of the system by studying the performance following British Virgin Islands (BVI) routes while using the real-time guided navigation system. The main weakness of the system is the requirement to place the module on the user’s hip.
The proposed system in Chen et al. (2012) is based on an inertial measurement unit requiring no infrastructural support. The navigation algorithm consists of two parts that include, on one hand, the positioning process and, on the other hand, the orientation process. The positioning process is concerned with estimating the current location based on multiple inertial inputs while the orientation process generates ideal paths from the current position to the destination. In this article, the kinematic characteristics of walking are investigated to develop a step frequency detection algorithm and a step length estimation method. In addition, an efficient position correction algorithm is proposed to improve tracking accuracy. The experimentation demonstrates the accuracy of positioning to be on average off a few centimetres from the actual position.
System design
System architecture
The proposed system aims at enabling individuals with blindness and visual impairments to accurately and safely navigate in indoor spaces. Its basis lies in the combination of a newly proposed pedestrian dead reckoning (PDR) algorithm with surface tactile ground indicator guides, the gyroscope sensor found on smartphone devices, and last but not least, BLE technology radio beacons that are used to correct the accumulated error of the PDR method. The first version of the developed application, called BlindMuseumTourer, revolves around the provision of navigational capabilities inside the spaces of the Tactual Museum of Athens organized into thematic tours that correspond to the available exhibition rooms. The proposed PDR algorithm accurately computes the user’s position and the travelled distance minimizing the associated error. The application provides its capabilities to users via a voice-command-based interface that is configurable to their preferences. In case of an emergency, it can guide the users to dedicated places inside the museum as well as provide the functionality to make emergency calls either to family members or public services. Finally, a part of the system is a companion web application specifically targeted at the employees of the museum that allows the creation and modification of the internal spaces mappings required by the application.
Figure 1 depicts the architecture of the application at a high level. The implementation follows the model-view-controller (MVC) architectural design pattern. Specifically, the model manages the logic, the data, and the rules of the application; the View component provides the user interface; while the Controller component accepts input and converts it to commands for either the model or the view component.
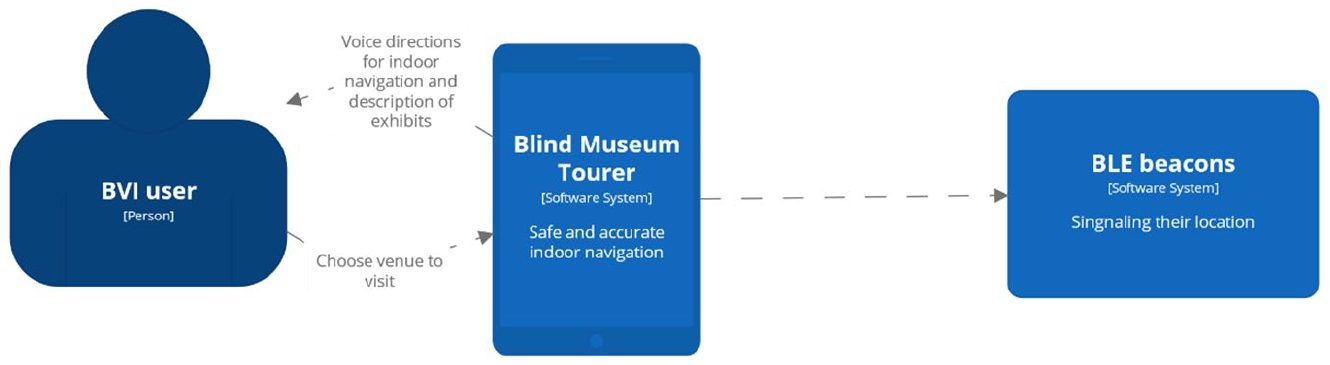
Architectural diagram of the application.
Following that, Figure 2 presents the subsystems comprising the BlindMuseumTourer Android application. As it can be seen, the functionality is decomposed into a motion, a location, and a navigation subsystem as well as an Android BLE beacon library that in the future will be used to receive BLE beacon readings and fuse that input into the application’s algorithm as well.
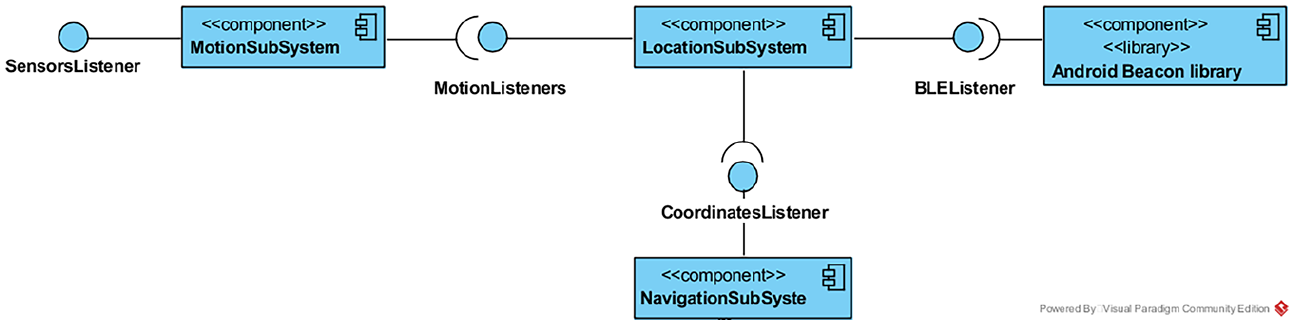
UML diagram of subsystems.
PDR
The core of this application is centred around an innovative PDR algorithm that leverages the three-axes acceleration sensor of smartphone devices and, furthermore, embeds into its model the particularities and special characteristics of the user’s gait. The latter is achieved by requesting users to perform a trial walk on a special surface tactile ground indicator guide at a predefined location before starting a touring experience. The PDR model iteratively calculates the new position of the user in the space having as a point of reference the previously mentioned initial starting location. As with every PDR method, it consists of three operations: step detection, walking distance estimation, and heading estimation. Compared with the state of the art, the proposed PDR solution achieves a more accurate walking distance estimation even at speeds lower than 0.5 m/s, it works in real-time since it has a very small processing delay, has a low computational cost, and has linear complexity in the number of time intervals. The technical details of the proposed PDR algorithm are beyond the scope of this article and will be presented in the near future.
BlindMuseumTourer’s user interface
In addition to the voice-command-based interface, the application provides a graphical user interface (GUI) to address the needs of people that do not suffer from complete blindness but still face moderate to severe visual impairments. To support the range of possible users, the application’s windows are compliant with the available screen readers.
Upon opening the application, users are welcomed by the screen shown in Figure 3, informing them, via voice instructions, about the existence of two possibilities. Either tap twice on the screen to continue to the next window or tap once to replay again the current message. When users continue, a screen presenting the available thematic routes from which to choose is shown in Figure 4.
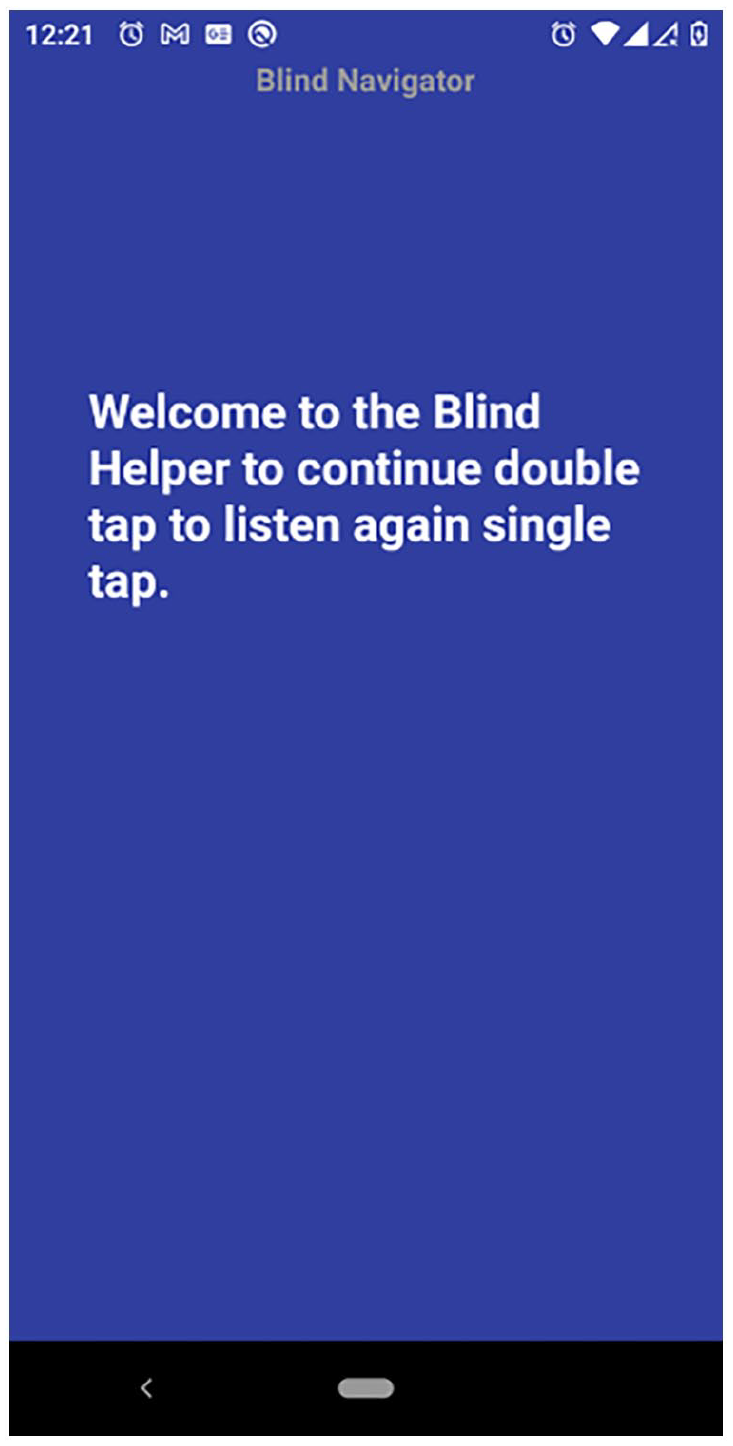
Welcoming screen.
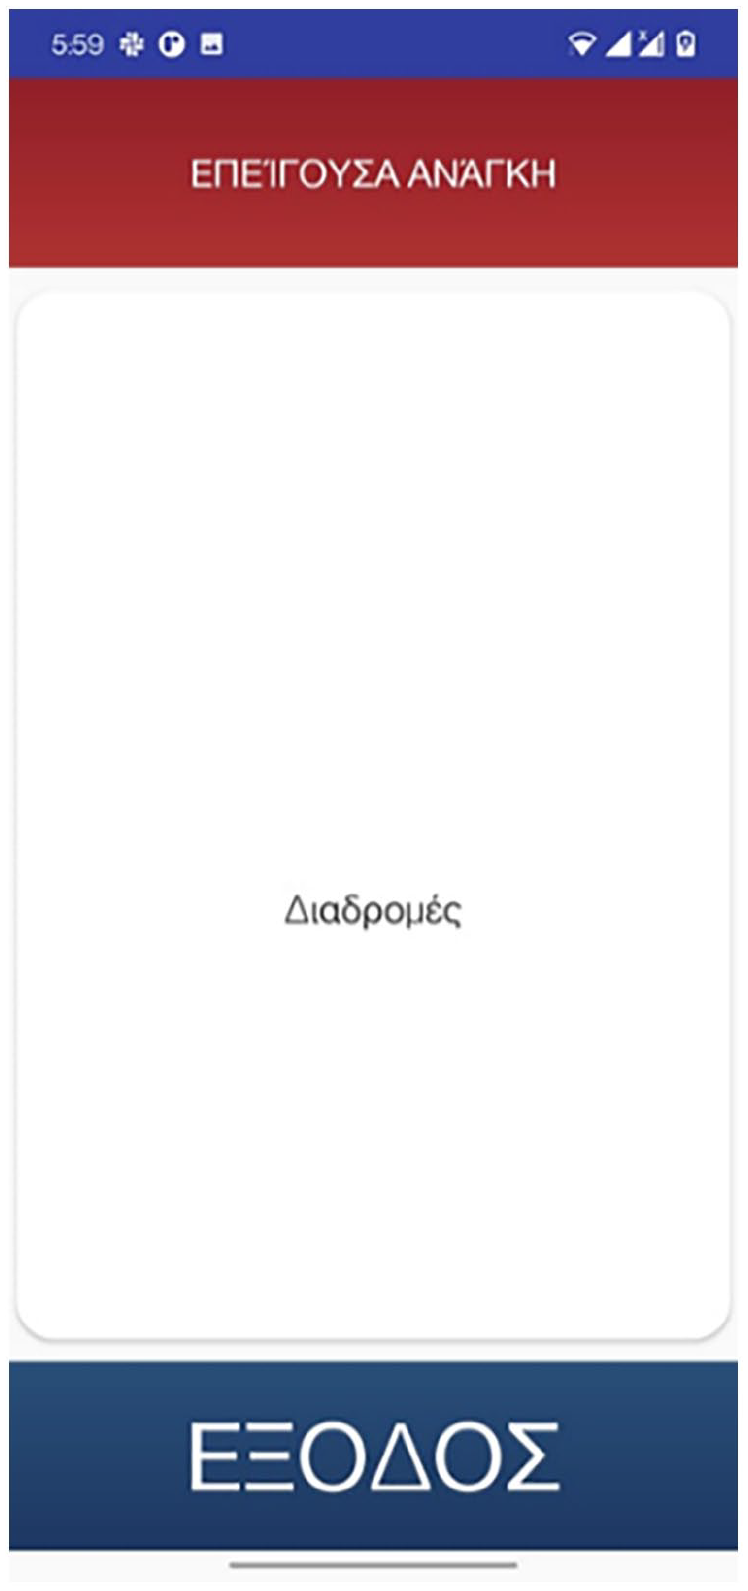
Main screen consisting of three windows: (a) emergency call (top part in red), (b) routes selection (middle part in white), and (c) exit (bottom part blue).
Next, users are required to take a mandatory trial walk the output of which is shown in Figure 5. Finally, while navigating the exhibition rooms, the application provides a graphical representation of the exhibit’s configuration along with the path of the user (Figure 6).
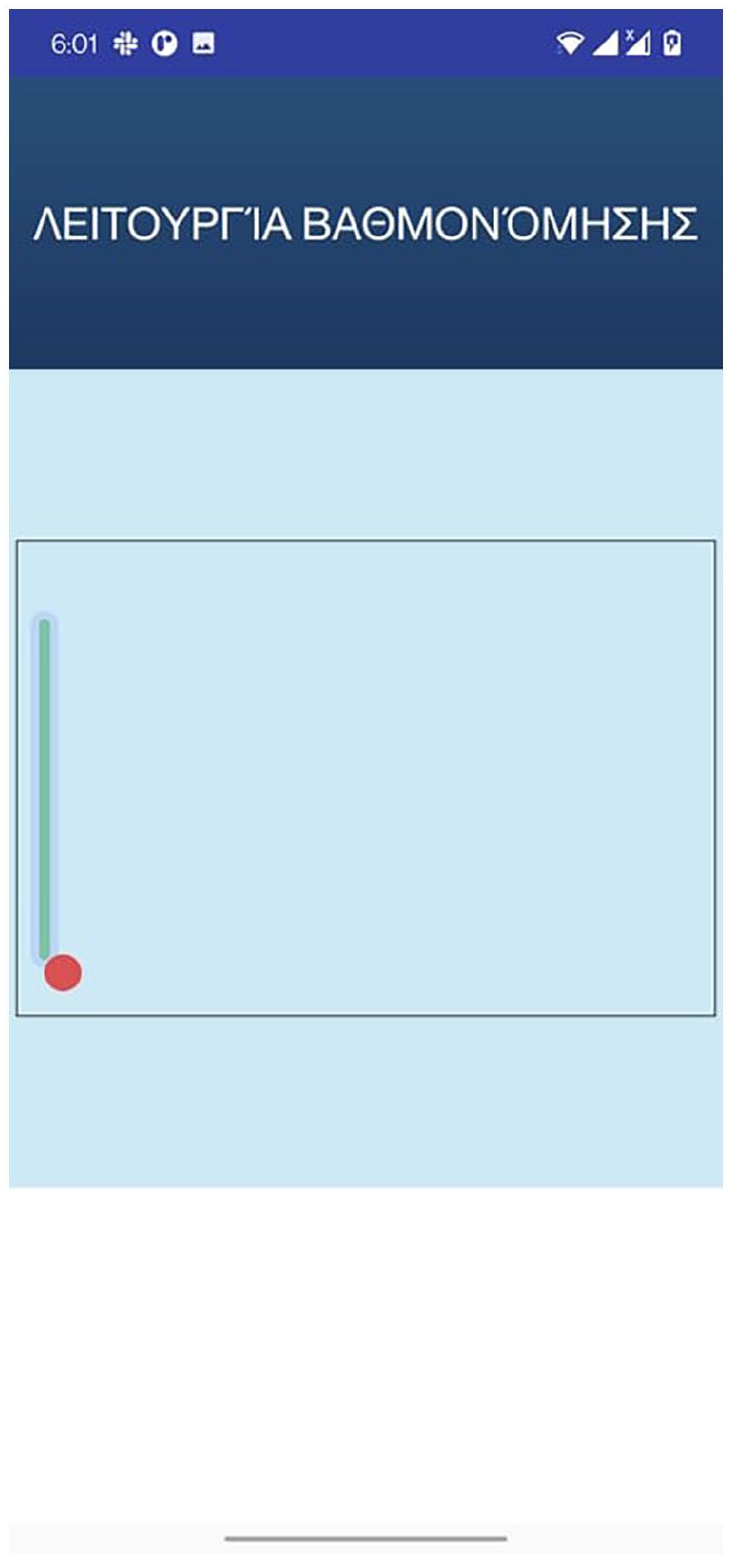
Calibration window depicting the mandatory trial walk.
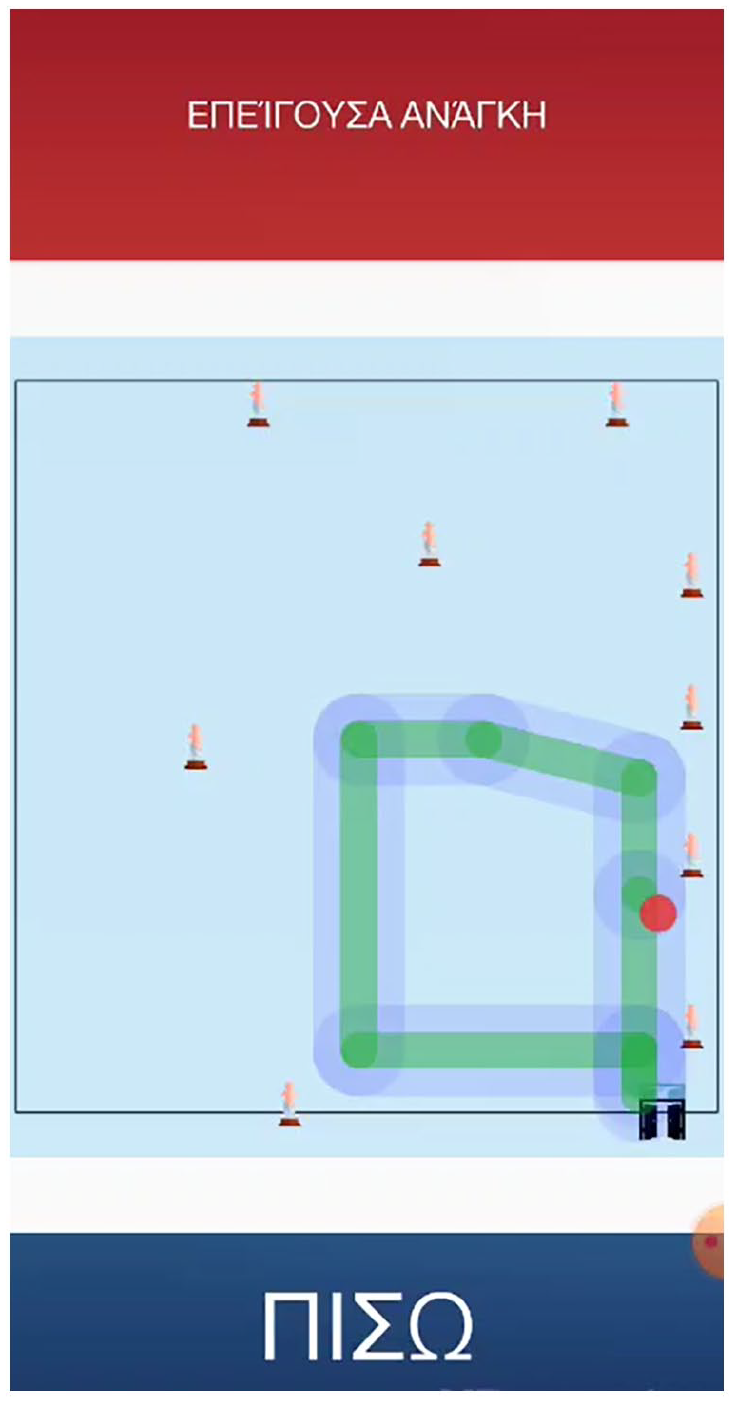
Exhibits location and user path while navigating an exhibition room.
Map administration subsystem
Crucial to the success of BlindMuseumTourer is the provision of correct and accurate mappings of indoor spaces. For this reason, alongside the main application, there exists a companion tool provided in the form of a web application that allows the museum’s staff to either add or remove:
Information about spaces and, in particular, the associated name and coordinates of various POIs such as helpdesks, exits, facilities, and the like as well as sizing information including length and width.
Entrance and exit points that include doors and hallways along with related information such as coordinates, their length, and the like.
Information about POIs such as brief descriptions, dimensions, length, height, and location coordinates among others. Typically, these include museum exhibits, helpdesks, facilities, and the like.
Finally, Figure 7 presents a sample UI page of the web administration tool concerning the insertion of a new surface tactile ground indicator guide.
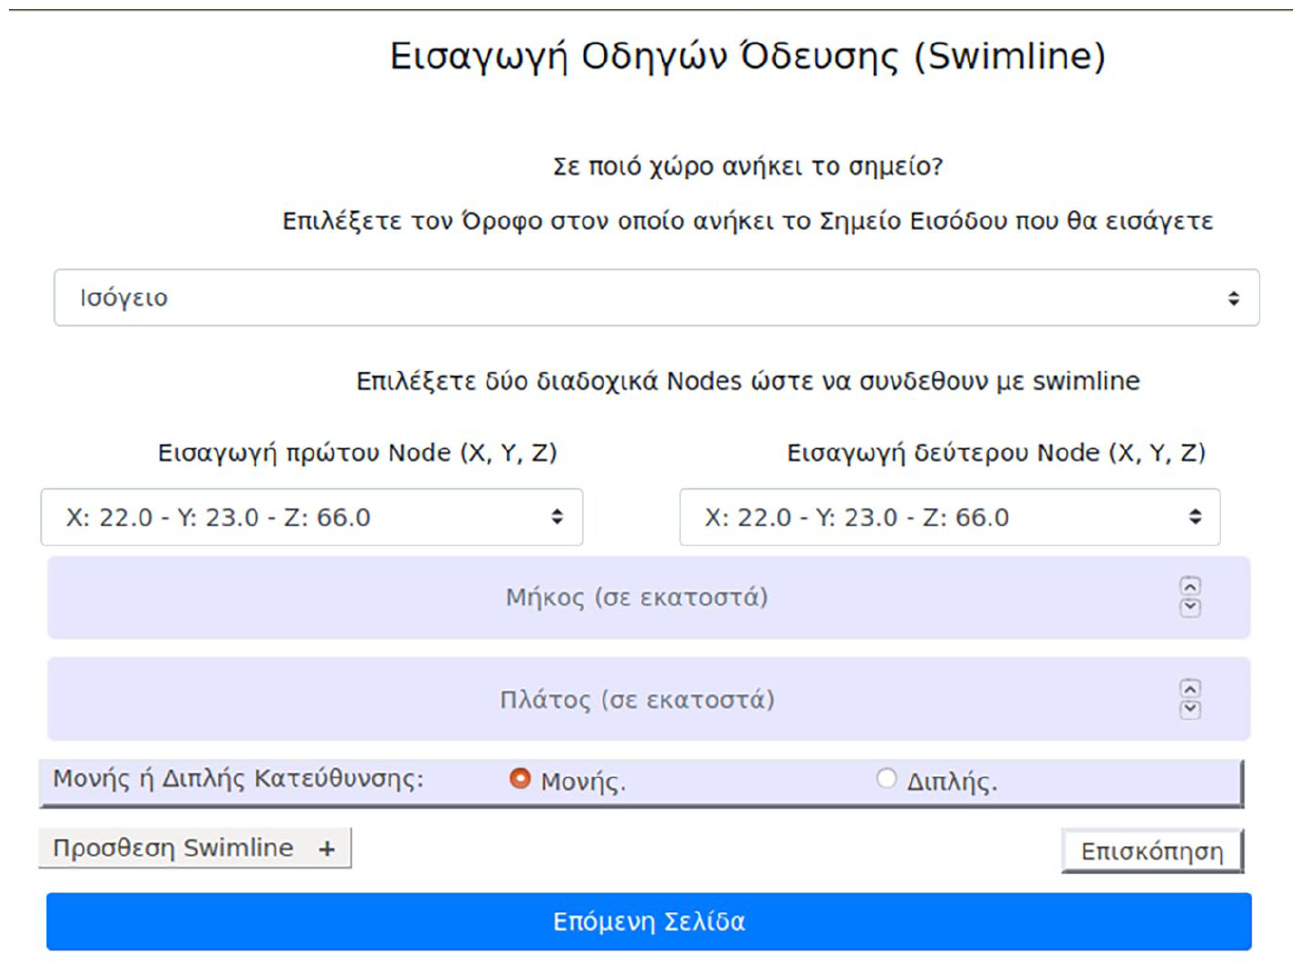
Web administration tool inserting surface tactile ground indicator guides – fields: floor selection, inserting coordinates of two points (nodes) that will be connected via swimline – inserting width and length, selecting directionality one-way or two-way.
Usability and UX evaluation
This article’s main goal is to assess the proposed application’s Usability and UX and subsequently validate, in those terms, the system design. This is a significant but often neglected aspect of a system as an improved UX combined with a low learning curve, besides decreasing the error rate, can make the application more appealing to the user and, thus, increase the, especially low for this type of applications, adoption rate among the individuals that are blind and visually impaired (Gori et al., 2016; Sachdeva & Suomi, 2013). Previous research has shown a variety of factors responsible for assistive technology (AT) adoption, the subsequent low rate of adoption and technology acceptance and, finally, abandonment (Kane et al., 2009). Such factors include a lack of consideration for user opinion, ease of device procurement, poor device performance, adaptability to new requirements or priorities, errors such as misrecognized building features, wrong representation of the exhibits’ configuration and other POIs, as well as the social/environmental setting (Abdolrahmani et al., 2016). The process of evaluating usability and UX will provide the opportunity to better understand these issues and, subsequently, lead to more effective heuristic solutions, thus decreasing the negative impact of the technical difficulties or even impossibilities that plague current assistive technologies for indoor navigation.
Methodology
The literature review revealed various available methods to conduct the assessment. The most prominent methodology comes from the ISO/IEC 25010:2011 (2011) standard that defines usability as ‘the degree to which a product or system can be used by specified users to achieve specified goals with effectiveness, efficiency and satisfaction in a specified context of use’. In particular, the three components measure the following:
Effectiveness – measures the degree to which users can complete a task;
Efficiency – measures the time it takes users to complete a task;
Satisfaction – measures subjectively the quality of interaction with the application.
On the contrary, UX is a term that is broadly used by many researchers and practitioners to include different concepts (Forlizzi & Battarbee, 2004)] quite often overlapping with the concept of usability. The range of dynamic concepts associated with UX include affective, emotional (see e.g., Egger, 2001; Picard, 1999), hedonic (see e.g., Khalid & Helander, 2006; Norman, 2005), experiential (see, for example, Baurley, 2004; Forlizzi & Battarbee, 2004), and aesthetic dimensions (see, for example, Lavie & Tractinsky, 2004). According to the ISO 9241-210:2019 [2019] standard, UX includes users’ emotions, beliefs, physical, and psychological responses, and it is also the result of brand image, presentation, system performance, the user’s internal and physical state resulting from prior experiences, attitudes, skills, and personality, among others. These characteristics of UX and the ones described in a more detailed fashion in Theodorou, Tsiligkos, et al. (2022) justify the selection of this measure for assessing the component of satisfaction as described in the definition of usability in ISO/IEC 25010:2011 (2011). Thus, in our view, UX is a part of usability.
The assessment of both usability and UX following the above-described methodology took place at the Tactual Museum of the Lighthouse for the Blind of Greece, located in Kallithea, where 30 blind and visually impaired users navigated around the premises with the help of the BlindMuseumTourer application. Prior to starting each user evaluation, the team responsible for conducting those tests gave, in the context of special training sessions, accurate and clear instructions to the blind users regarding the use of both the application’s features and the tactile ground surface indicators located near the museum entrance . The guides, besides signalling the start of the tour, are also used for calibrating the application’s pedometer model to match the user’s characteristics. The users had to complete two test scenarios each broken into two parts, the details of which are described in section ‘Methodology’, to quantitatively measure effectiveness and efficiency.
Satisfaction was measured with two UX questionnaires. The first one, distributed via Google Forms, followed the format of a standardized format the details of which are described in section ‘Questionnaire for measuring satisfaction/UX’. The visually impaired users had the opportunity to complete the Google Form questionnaire either with the aid of the personnel at the Lighthouse for the Blind of Greece or at their own time and place. The second questionnaire, which followed a semi-structured interview format, also concerned issues of UX. The details of the semi-structured questionnaires are described in Theodorou, Tsiligkos, et al. (2022). On average, the first questionnaire required 20 min while the semi-structured interviews required 30 min.
The exhibition rooms had no tactile ground surface indicators installed as the museum staff expressed concerns about the required interventions that could negatively affect, on one hand, the accessibility of people with mobility disabilities and, on the other hand, the maintainability of the spaces. Also, BLE beacons were not mounted on the exhibits as, after some preliminary testing, it was found that the characteristics of the museum’s spaces nullified any gains made with the help of readings from those. This was due to the small dimensions of the rooms as (1) the received power readings from the radio beacons were affected by reflection-generated noise and (2) the linear motion mechanisms of our proposed algorithm when combined with input from the gyroscope sensor gave excellent results. The latter was possible due to the users being aligned to the correct route path at the beginning of the museum tour with the aid of the initial tactile ground surface indicators, and due to the application’s features that prevent the user from veering.
Metrics for effectiveness and efficiency
A literature review on finding statistical metrics for measuring effectiveness revealed that among the most common ones include the following: Completion rate, Errors, and Error rate (Fenton & Bieman, 2014). Their simplicity makes them appealing and, thus they are widely used in many studies. Completion rate counts the successfully completed tasks and it is either a pure number or a percentage while Errors count the errors made by a user, as its name suggests. Error rate reports the number of errors per user. Common causes of errors include, among others, mental errors, for example, when a user cannot comprehend a system option, and undesired results as a consequence of either poor interaction with the system’s interface or limitations of the provided information resolution.
For the evaluation of completion rate, error and error rate, the research team defined the following test scenarios for the users to perform:
Completion of thematic routes – users have to complete two thematic routes one of which is known to them, while the other unknown and have no prior knowledge of it. The known case involved the exhibition room of Hermes where the application’s capabilities were first showcased to the users. Its location on the ground floor and the small size made it a good fit for conducting special training sessions facilitated by a customized training version of the BlindMuseumTourer. In contrast, the Poseidon exhibition room was the choice for the unknown case.
Assessing guidance to special POIs – users are requested to stop the thematic route and use the application to guide them to POIs. For the evaluation, the users had to guide themselves to the helpdesk and the toilet facilities (WC).
In total four tasks were evaluated, two for each case. For each of the above test scenarios the successful completion and error conditions were defined as follows:
(a) Completion: successfully completing the goal of the task at hand. For the first test scenario, the users must complete the thematic route in its entirety, while for the second the users must find the requested POIs.
(b) Error: in either case, if the user gives up the attempt or asks for help from the research team counts as an error.
Finally, following the task definition is the mathematical formulation of these metrics. The equation used for the completion rate is calculated as follows
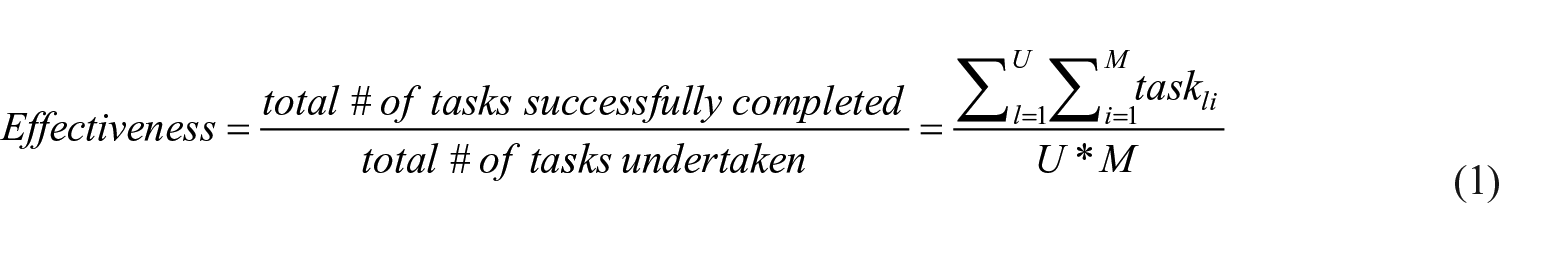
where U = # of participants, M = of tasks per participant, and taskli = i – th task of the l – th user.
Furthermore, taskli takes the value 1 if the task is successfully completed and 0 otherwise.
Efficiency is closely related to effectiveness as it considers the time (in seconds and/or minutes) involved in successfully completing a task. A common way to measure effectiveness is with the help of the following formula
where tij = EndTimeij – StartTimeij, which in turn, EndTimeij is defined as the time required for the i – th task of the j – th user to be completed successfully or the time until the user quits.
Errors will be measured as simply the sum of each participant’s total number of errors

where N = the total number of participants, while the error rate is calculated by the following equation
where Error = # of total errors and P = # of total participants
Last but not least, an added benefit of the above metrics is their deployment flexibility as their required input can be collected, besides the final stage of evaluation, during early stages of the development cycle as well to receive quick feedback.
Questionnaire for measuring satisfaction/UX
The main methodology followed for the study of Satisfaction predominantly consists of questionnaires. According to Díaz-Oreiro et al. (2019), AttrakDiff, UEQ, and meCUE are the three most commonly used standardized questionnaires for UX evaluation. The number of questions, the scales they employ, along with the theoretical models on which they are based, are listed in Lallemand and Koenig, (2017). Out of the three, the authors note that AttrakDiff is the most popular option since it was first introduced in 2003, while UEQ surpassed it in 2017 and 2018. On the contrary, meCUE being a relative newcomer has a substantially smaller usage rate. Frequently, these approaches are supplemented with other methods where over 60% of the cases utilized between one and five additional methods (Díaz-Oreiro et al. 2019) . Hedonistic and pragmatic aspects of UX are found in AttrakDiff (Hassenzahl et al., 2003), meCUE (Minge et al., 2017) and UEQ+. To the best of our knowledge, there are no questionnaires available that evaluate the UX of blind and visually impaired individuals. In addition, one of the most common limitations of the existing questionnaires is the absence of customization for the features they assess. To alleviate that, the UX questionnaire framework UEQ+ was selected.
This framework adds modularity to the original UEQ assessment tool. Its suitability and effectiveness have been demonstrated by evaluating new technologies regardless of sex, age, level of education, and level of technological knowledge (Laugwitz et al., 2008; Schrepp et al., 2014). Also, the ready-to-be-used tools for processing quantitative data add to the appeal of the tool. Specifically, the UEQ+ (Schrepp & Thomaschewski, 2019) is a set of scales that the authors can selectively combine to form a concrete UX questionnaire that better matches the features of the application under evaluation. Each scale is decomposed into five items, four of which contribute to the score of the scale and a single item that measures the relevance or importance of the scale itself. The items are measured on a seven-point Likert-type psychometric scale and the rating of the latter is configured to quantify opposing pairs of the application’s features. According to the evaluation instructions, users always choose to rank the scale according to their preference, even when they are unsure about their evaluation or even when they think that the scale is not appropriate for the product. Last but not least, users rate the importance of each scale according to their view, aggregating them into a score that represents the overall impression of the product.
From our point of view, the following scales best assess the UX of the individuals who are blind and visually impaired utilizing our application:
Efficiency: this scale measures the users’ subjective impression of the effort required to achieve the desired goals as well as the application’s responsiveness to their actions.
Perspicuity: this scale measures the degree to which the users find the application’s functionality familiar and easy to learn.
Dependability: This scale measures the subjective impression of whether the user is in control of the application in terms of the predictability and consistency of the systems’ issued instructions and actions.
Personalization: this scale measures how well the application adapts to the personal preferences of the user along with how promptly this process is completed.
Usefulness: this scale measures the users’ perception on achieving goals, the amount of time saved and the resulting efficiency.
Trustworthiness of content: this scale measures the quality and reliability of the instructions’ content.
Response behaviour: this scale measures the friendliness of the voice assistant (Klein et al. (2020).
Analogous to the scope of the above framework, we have designed a seven-point Likert-type scale questionnaire. The format of semi-structured interviews was preferred as it is flexible and ensures that the views of the blind and visually impaired are highlighted, despite the decreased amenability to statistical analysis.
Finally, a goal of paramount importance was for the participants to remain unbiased to the interviewers’ expectations. For a more elaborate description of the format and the benefits of the semi-structured questionnaires, readers can refer to Theodorou, Tsiligkos, et al. (2022).
Usability and UX results
In this section, we present the results and conclusions drawn from the participation of 30 blind users during the evaluation process that assessed the completion of the above-mentioned tasks as well as gathered input from the questionnaires to quantify in a subjective time the perceived UX. We acknowledge that the number of participants is not representative enough and does not help to draw strong results; however, they can be used to understand the applications in this pilot stage. Finally, these results were also examined in the context of the information gathered during free interviews using a second questionnaire in an attempt to better understand the UX evaluation score.
Effectiveness
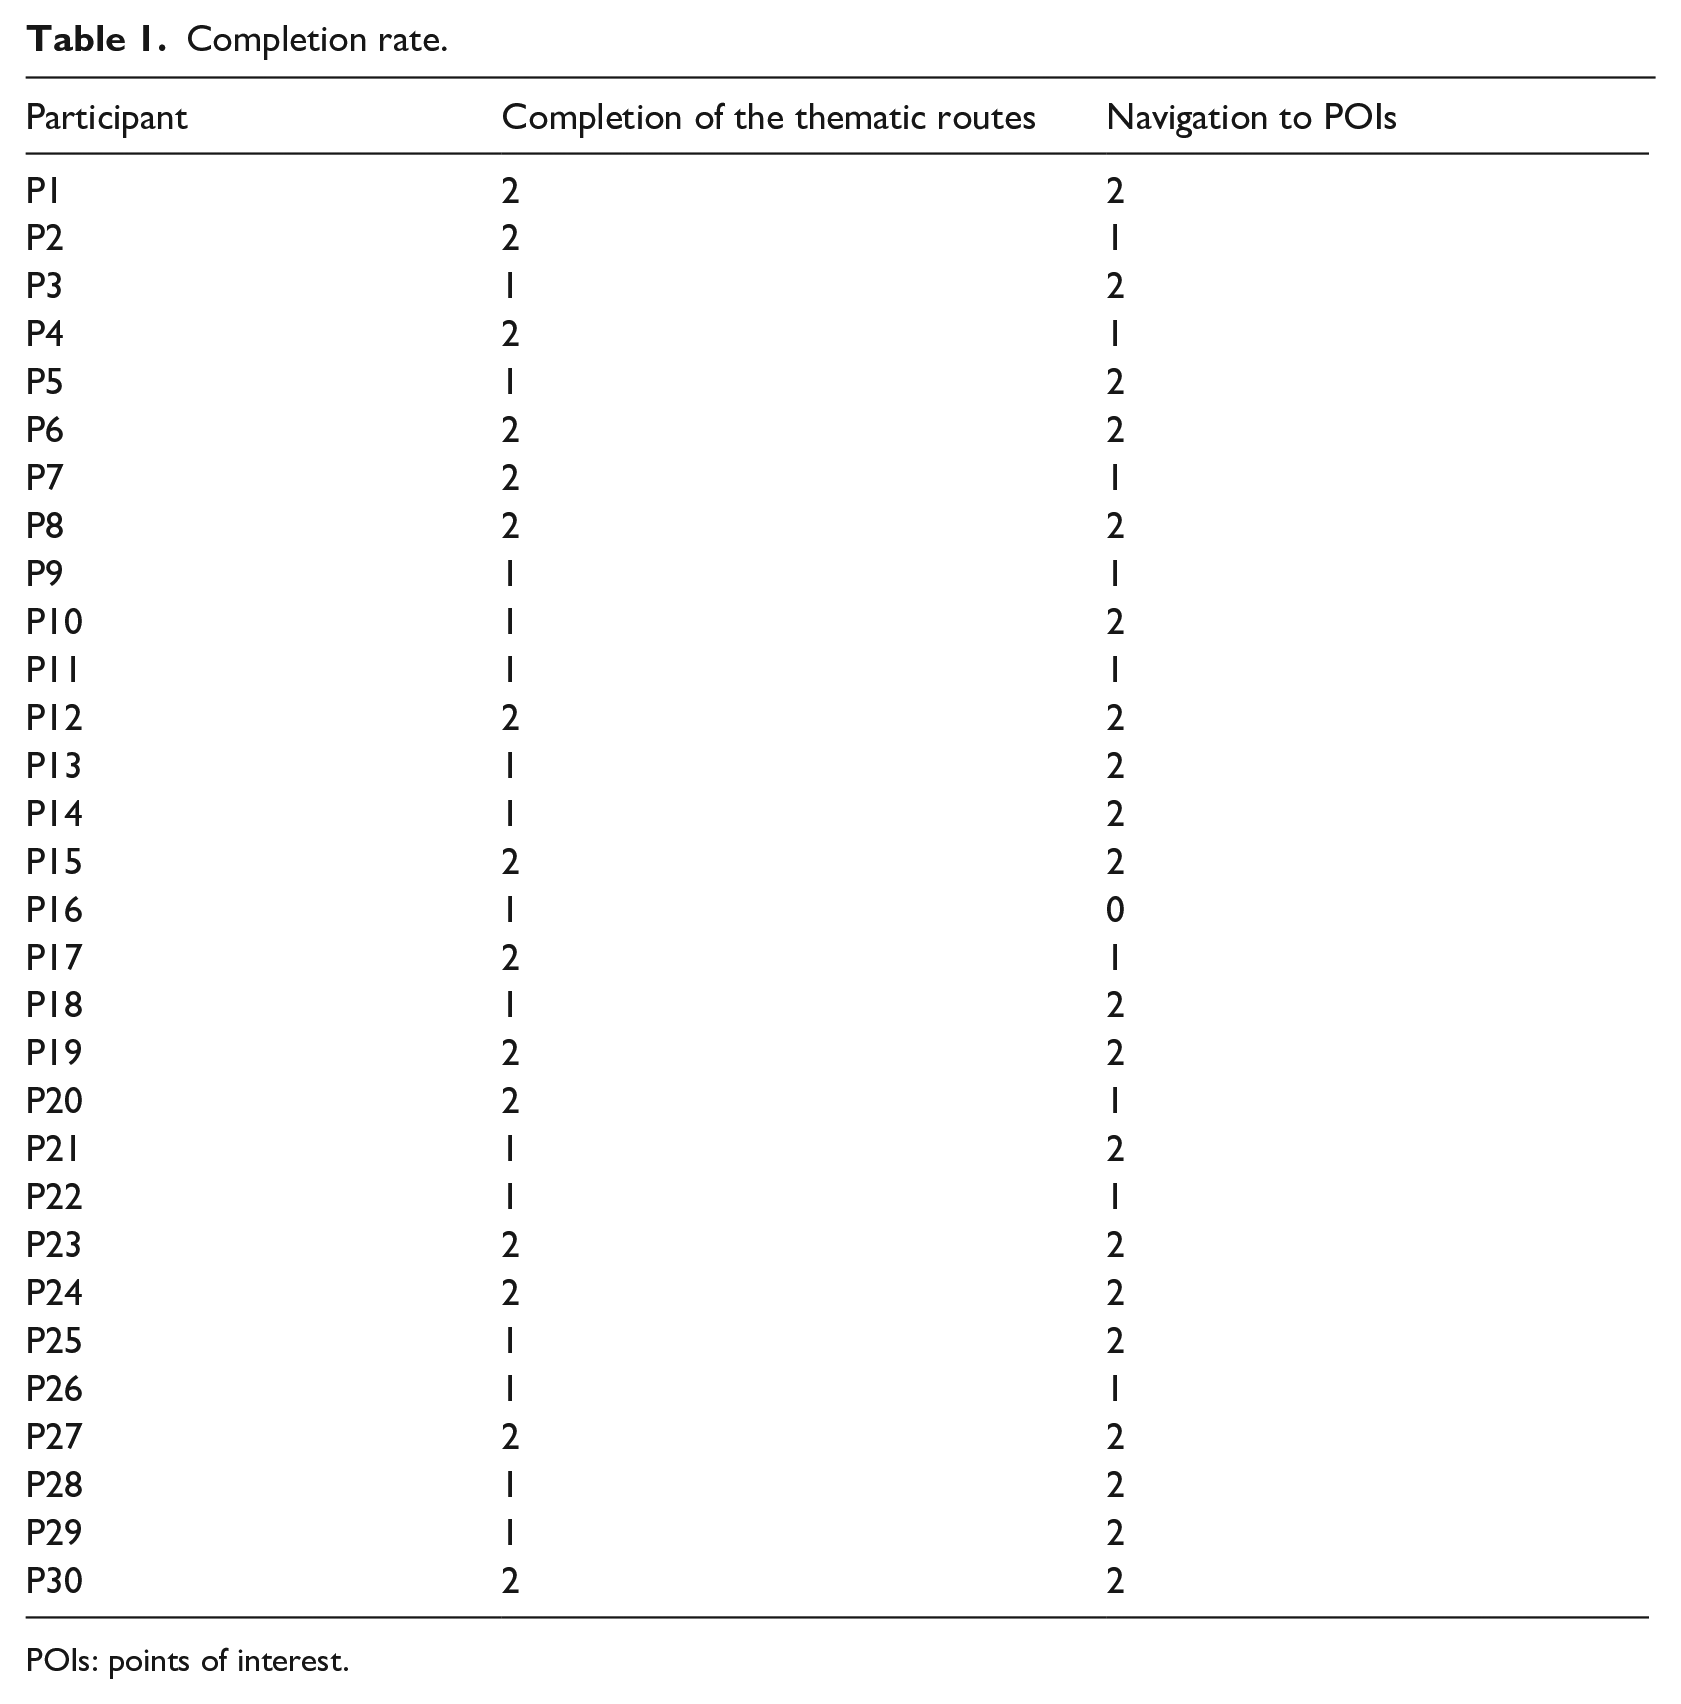
Table 1 presents the number of successfully completed tasks per user for each test scenario. Equation (1) from section ‘Metrics for effectiveness and efficiency’ takes as input the number of successfully completed tasks and the total number of tasks undertaken (Fenton & Bieman, 2014). The latter consists of those tasks for which the result of execution was either a success or a failure, while the former is the sum of each individual’s successfully completed tasks, as shown in Table 1. Finally, by utilizing the table data, we calculate effectiveness as follows:
Total # οf tasks completed successfully = # of tasks ‘Completion of a thematic route’ + # of tasks ‘Navigation to POIs’ = 45 + 49 = 94
Total # of tasks undertaken = #number of tasks per user × #of participants = 4 × 30 = 120
Hence

The complementary metric of completion rate, failure rate, is calculated as follows

where the numerator total # of failed tasks is calculated as the difference between the total # of tasks undertaken – the total # of tasks completed successfully. Therefore, failure rate = (26/120) × 100% = 21.67%.
Completion rate.
POIs: points of interest.
Efficiency
In particular, the efficiency measured by utilizing equation (2) takes into consideration both the tasks of successfully completing the thematic routes and those of assessing the navigation of the user to the selected POIs (see Section ‘Metrics for effectiveness and efficiency’ for more details). The first thematic route, known to the user, was completed at an average time of 18 min with an SD of 2.1 min while the second route, this time unknown to the user, had an average of 58 min with an SD of 5.4 min. For the second task, the attempt to navigate the user to the helpdesk took an average of 8 min with an SD of 2.1 min while for the case of navigation to the WC facilities, it was completed in 10 min with an SD of 2.2 min. Taking into consideration equation (2) and the above data (Table 1), we measured the efficiency to be 67.3%

Errors and error rate
Besides recording information about the completion of the thematic routes, the research team also recorded data regarding the errors committed by the users. They were classified into two types: recoverable and unrecoverable. The former considers errors where the users, despite making them, managed to successfully complete the assigned task, while the latter, considers errors where users could not address the challenge and decided either to quit their attempt or could not complete the task without the help of the research team, thus characterizing this attempt as a failure. During the evaluation, the research team identified the following errors:
Collision with the museum exhibits: counts the occasions of users colliding with an exhibit of the museum;
Veering: counts the occasions of users deviating from the designated path and veering off to one side or the other;
Over-turn: counts the occasions of users turning more or less, thus, creating a wrong angle with the correct navigational path;
Issued instructions: counts the occasions of users feeling confused about the issued instructions.
Table 2 presents the number of navigation errors made during the execution of the indoor navigation tasks described in section ‘Metrics for effectiveness and efficiency’ and after the training sessions were completed. The ‘Assisted’ and ‘Assisted II’ columns contain the number of unrecoverable errors where users failed to successfully complete the first and second task, respectively, according to the criteria described above. The tasks with these kinds of errors are not considered when calculating the completion rate metric. In contrast, the rest of the columns report the recoverable errors, thus contributing to the calculation of the completion rate metric.
Errors.
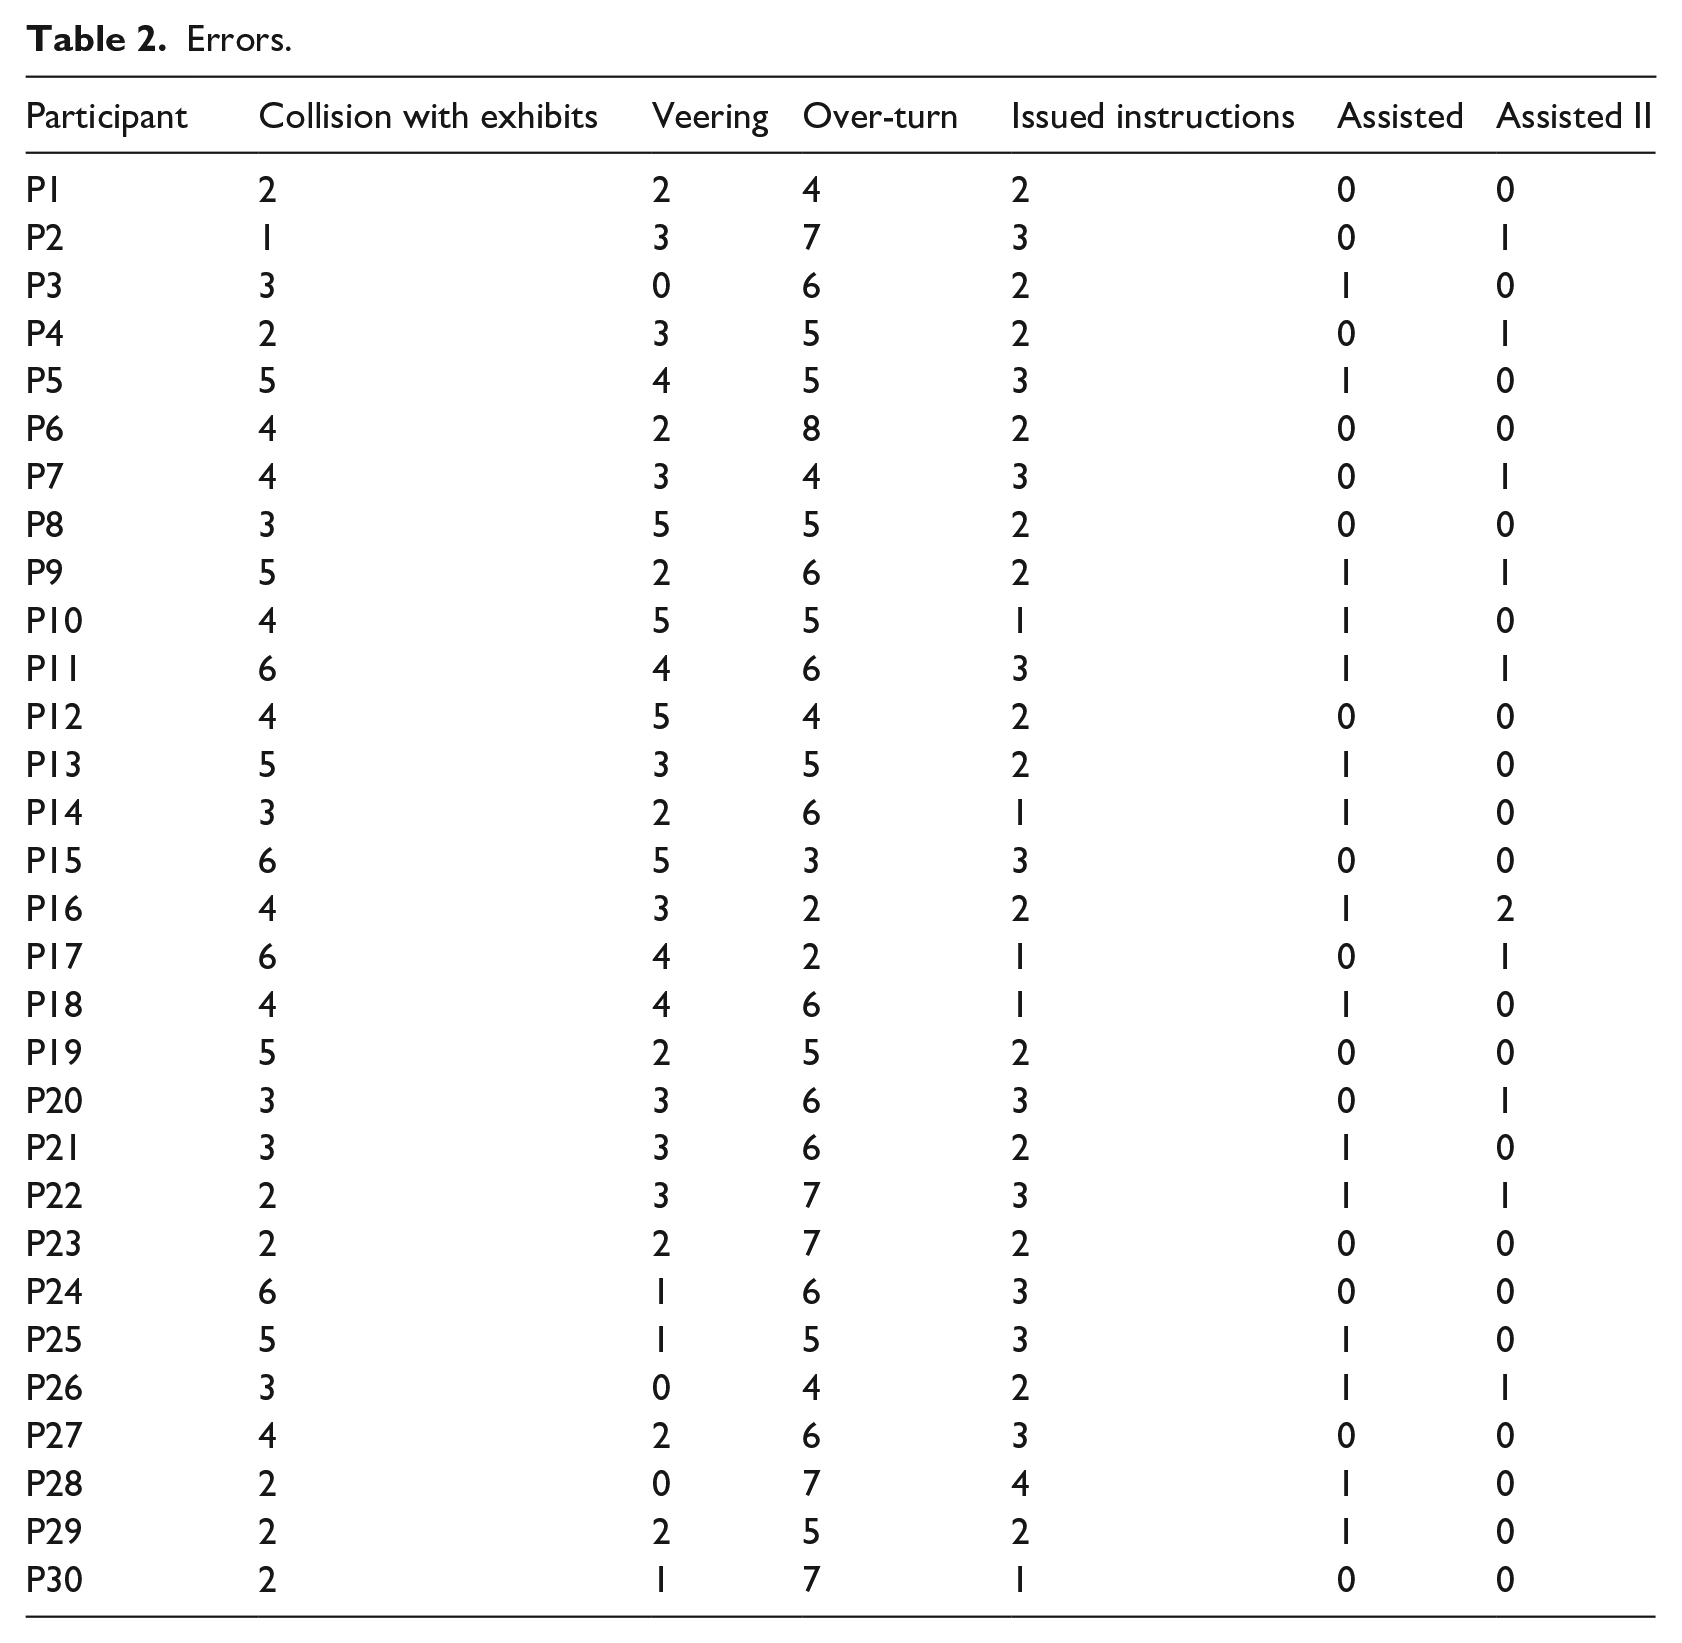
In total, we identified 416 errors where the users recovered on their own, while 15 and 11 of them required external assistance corresponding to the first and second task, respectively. The most commonly occurring error (160 out of 416) concerned the case where the users rotated more or less than required, thus creating a wrong angle with the correct navigational path. This is the most demanding action blind users have to perform since it greatly depends on spatial awareness, a skill that not all of them possess, especially the ones who were born that way. To address this issue, the application monitors the rotation of the user informing about when to stop or in the case of an error made by the user to restart the action. The second most-often occurring error (110 out of 166) concerned minor collisions with the exhibits. This mainly concerned cases of statues where an arm or a leg was extended outwards. For those cases, the application specifically informs the users to be extra cautious. The rest of the cases concerned either the case of veering off the navigational path or clarifications regarding an instruction. Finally, the overall error rate (equation 4) was measured to be 416/30 = 13.8 recoverable errors per user on average.
UEQ+ questionnaire results
This section presents the statistical findings based on the data collected via the questionnaires. Namely, these include the mean value and standard deviation for every scale, the consistency results and the importance ratings for the selected scales, the distribution of answers, as well as a key performance indicator (KPI) to assess the overall UX impression.
Mean and standard deviation by category
This section reports the mean value, the standard deviation, and the corresponding confidence intervals for every scale as well as for each of the items, in which the scales are decomposed, their mean value. To preserve compatibility with the original version, UEQ + statistical tools rescale the results of mean value and standard deviation back to the range of −3 to 3 from the range of 1 to 7. The scales were chosen after considering the importance ratings given by the users and they are presented in Figure 8.
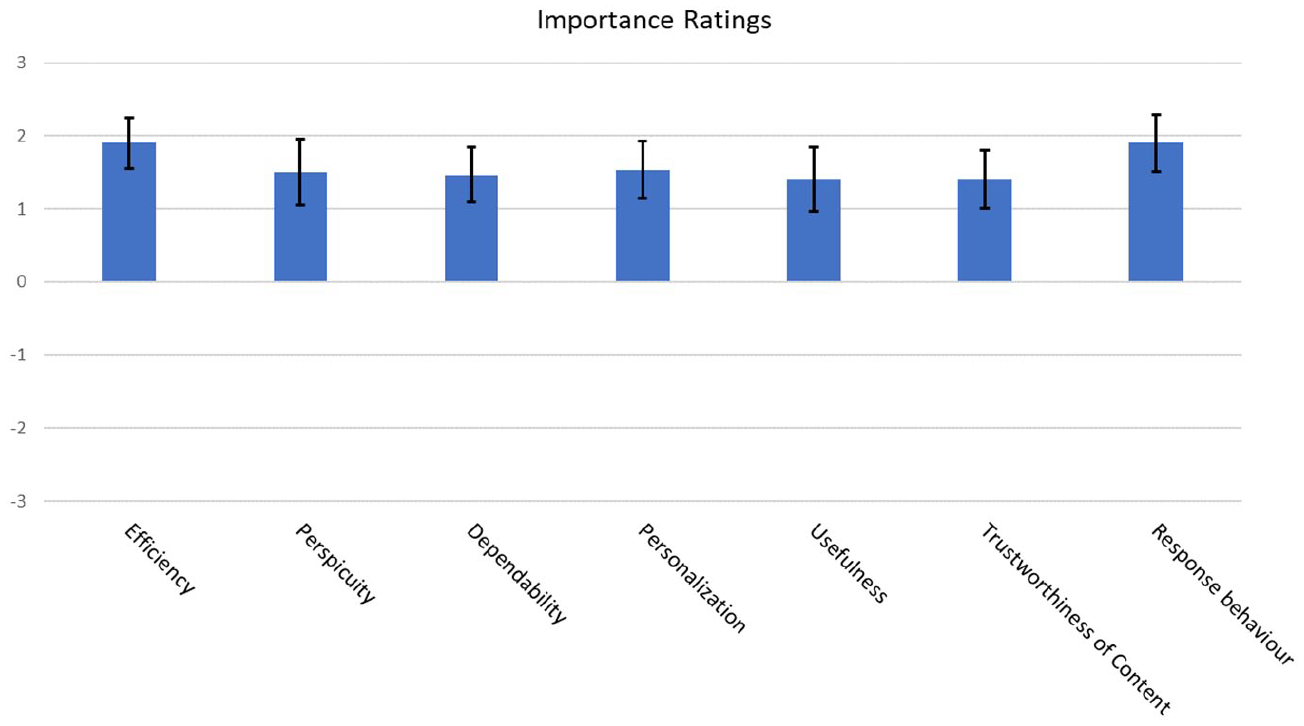
Mean value per scale.
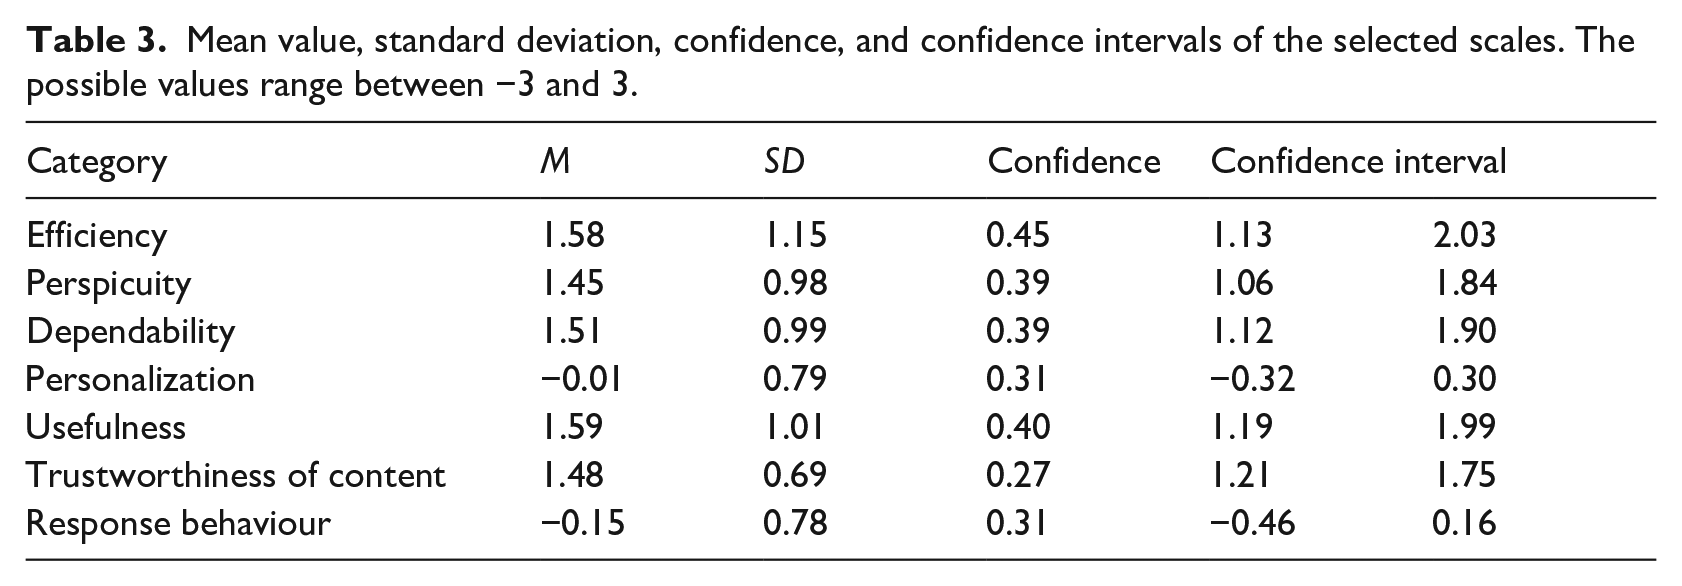
Table 3 shows in detail the mean, standard deviation, and 95% confidence interval level.
Mean value, standard deviation, confidence, and confidence intervals of the selected scales. The possible values range between −3 and 3.
Figures 9 and 10 depict graphically the data from Table 3. The former highlights the mean value while the latter, besides depicting the mean value as well, highlights the standard deviation.
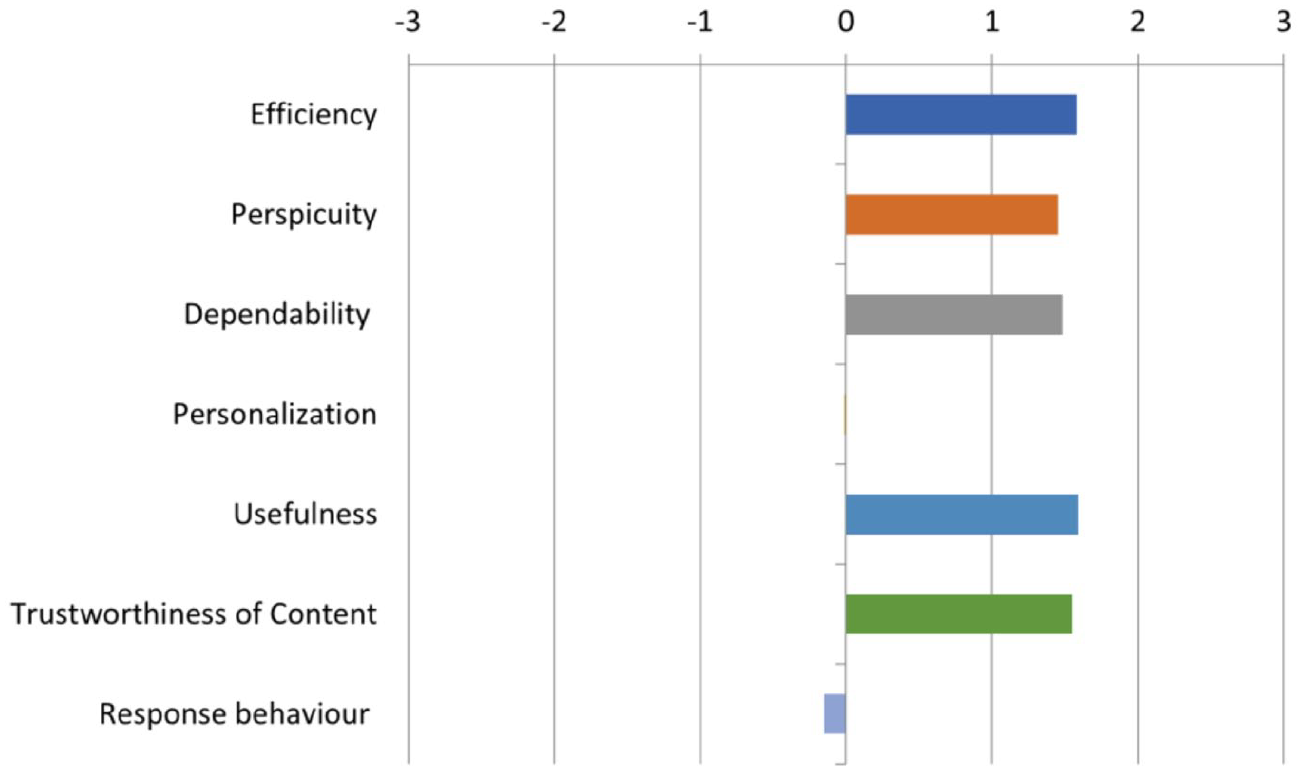
Mean value per scale.
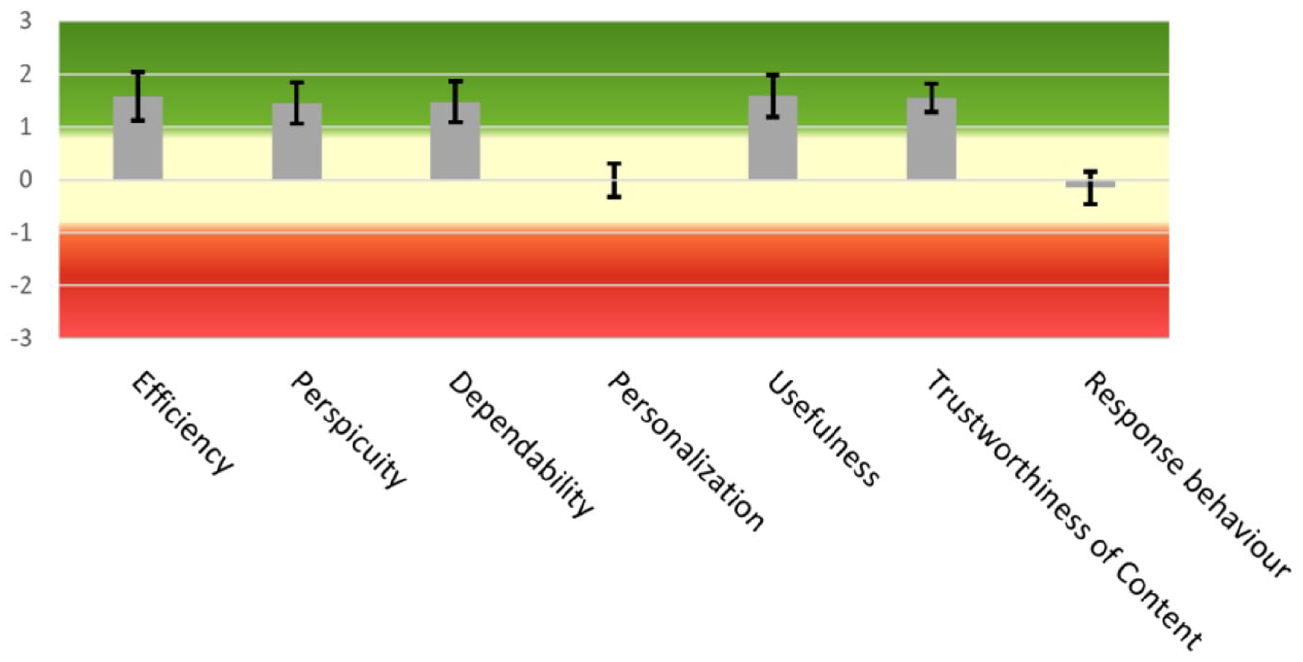
Scale means and standard deviation.
Overall, as it can be seen from the above results, UX has been rated quite positively by all users; however, both the scales of Personalization (−0.01), which measure the ability to adapt to the user’s personal preferences and the scale of Response Behaviour (−0.15), which describes the qualitative characteristics of the voice assistant and highlights the opinion of the users for the issued instructions to have somewhat better quality, received average ratings. In contrast, Usefulness (1.59) and Efficiency (1.58) scored the highest among the scales as users found that they can quickly and efficiently complete their navigation in the museum. The scale followed is Dependability (1.51), as users feel they can freely navigate around the premises of the museum since the predictability of the application makes it easier to rely on it. Trustworthiness of Content (1.48) comes next, highlighting a complementary aspect of dependability concerning the quality of information transmitted via the instructions given during the blind navigation, while Perspicuity (1.45) highlights the fact that users are more or less satisfied with the ease with which they familiarize themselves and learn the provided functionality. Nonetheless, progress can still be made in this aspect as well. For the overall evaluation of the UX, the UEQ + tool provides the KPI value whose range is between −3 for the lowest possible evaluation and 3 for the best possible evaluation. Our application receives a score of 1.20, which can be interpreted as a positive evaluation.
To further elaborate the results of the scales, they are decomposed into their constituent items, four in number for each, and are presented in Figure 11. They adhere to the same range of values as their encompassing scale. Specifically, Usefulness (1.59) was judged as very helpful (1.88), beneficial (1.68), useful (1.48), and sufficiently rewarding (1.32) since it significantly facilitates the navigation of people with blindness and visual impairments in the thematic routes of the Tactual Museum of Athens. For the scale of Efficiency (1.58), users found the application to be very organized (1.76), practical (1.48), fast (1.60), and as a whole very efficient (1.48). Users stated that they do not have to perform unnecessary actions and that the application has a snappy response time. For the scale of Dependability (1.51), users noted that the provided functionality was predictable (1.60), supported their navigation in the museum (1.44), met their expectations (1.52), and made them feel more secure (1.48). Specifically, they praised the accuracy of the navigation given that the application was still in a relatively early stage. Overall, they were highly satisfied with the sense of security provided to them as they were less anxious about damaging the exhibits.
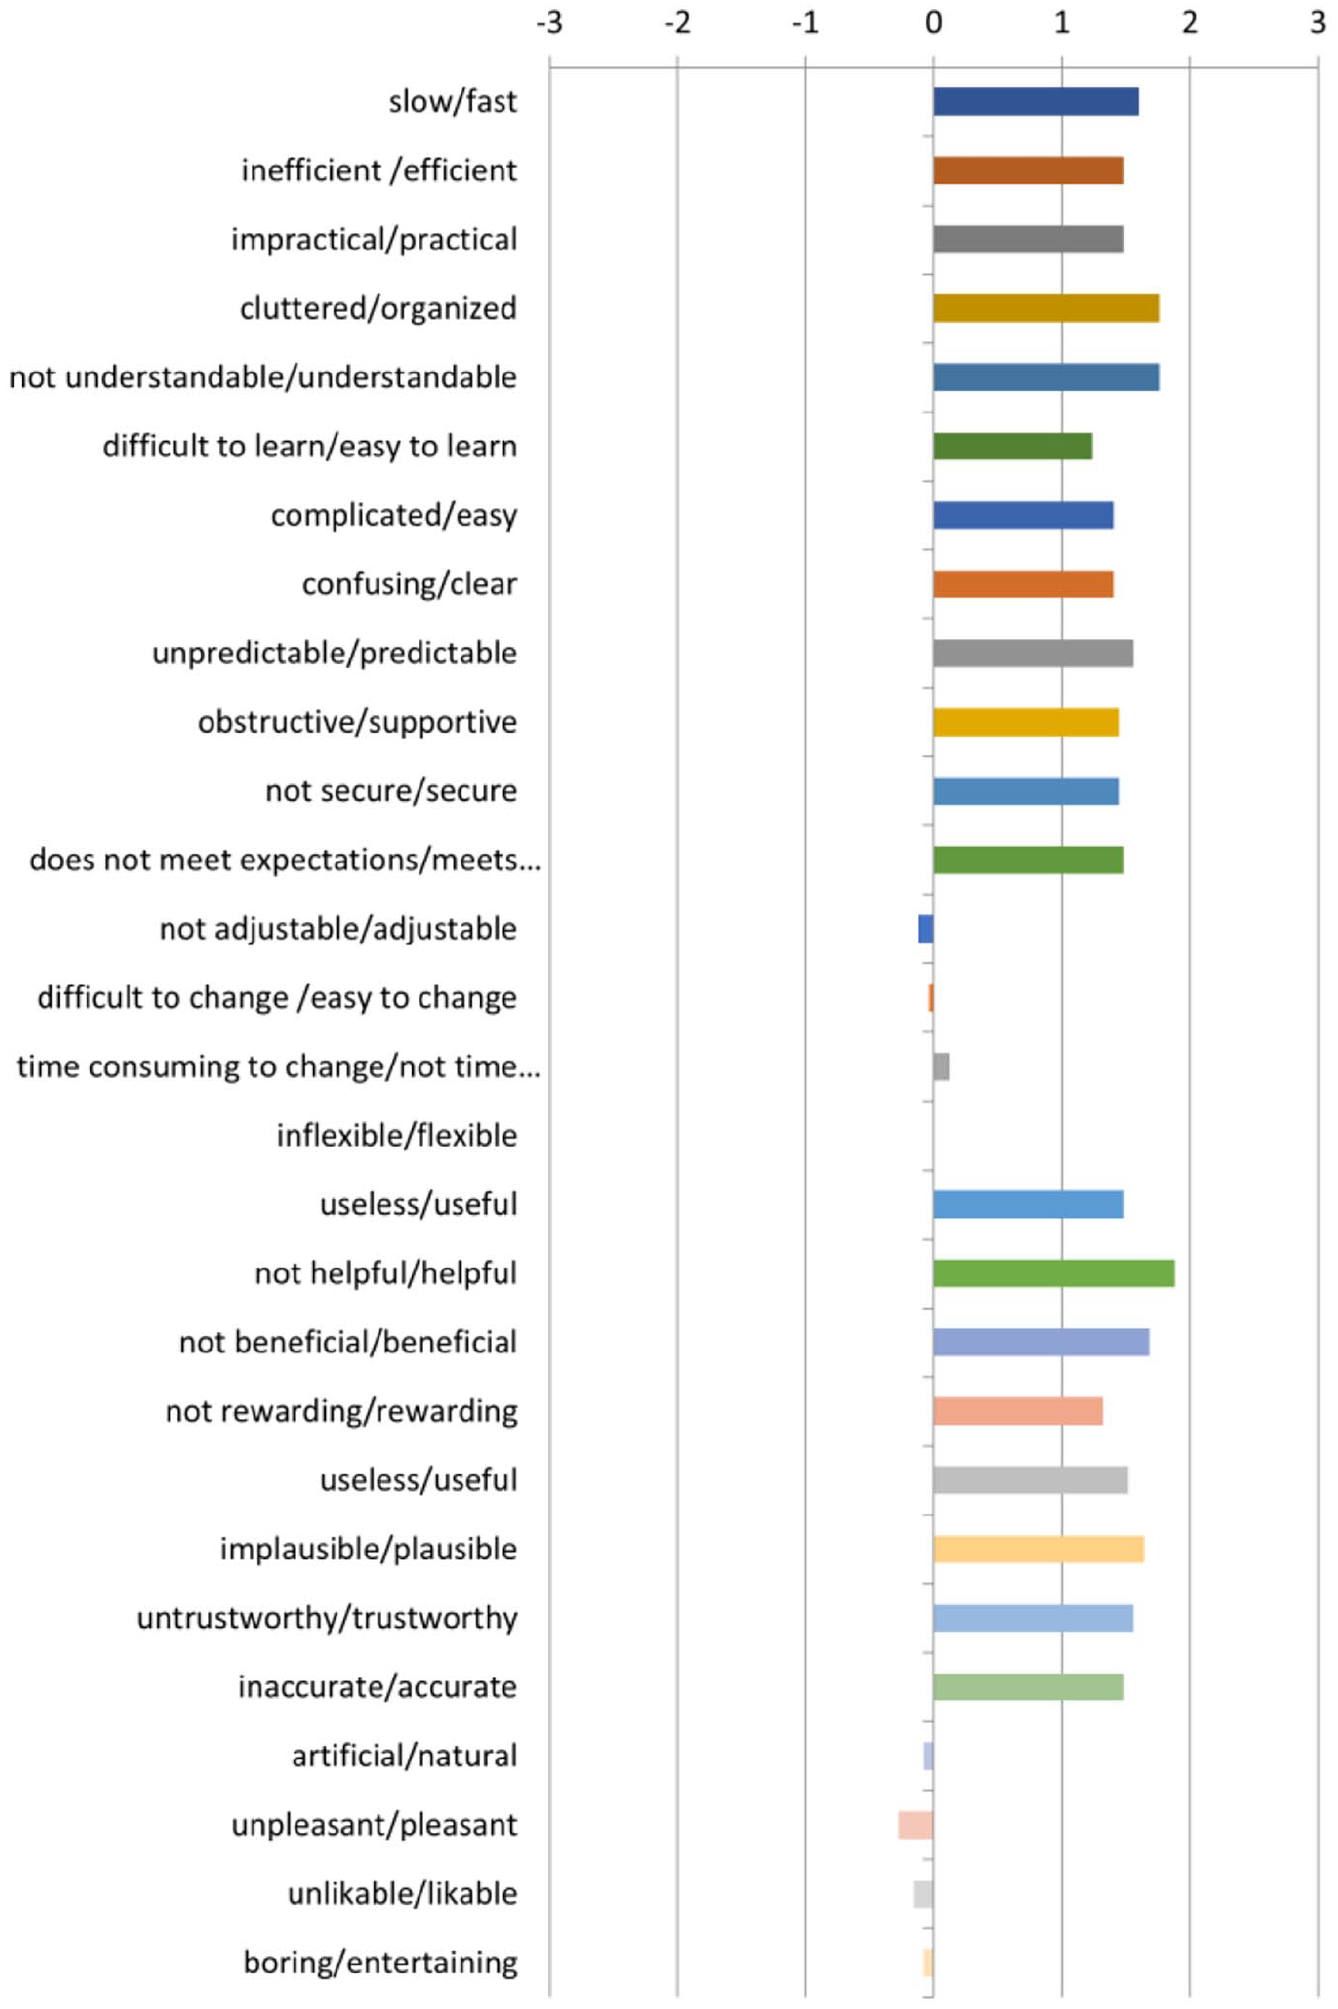
Mean value per item.
Trustworthiness of Content (1.48) shows that users found the voice guidance content trustworthy to follow (1.48), useful (1.44), plausible (1.56), and accurate (1.44). The users stated that the content of the issued instructions was accurate enough to help them successfully complete their navigation in the museum. Finally, they emphasized the effectiveness of the special instruction that helps the users realign themselves back to the correct path direction when they fail to comply with the instruction ‘Rotate’.
Next, the scale of Perspicuity (1.45) was rated as understandable (1.76), easy to learn (1.24), easy to use (1.40), and having a clean structure (1.40). Specifically, users mentioned that they found it easy to use the interface since it follows practices already known to people that are blind and visually impaired, while the available functionalities were well-organized. Another feature mentioned by the users that greatly improves the usability of the application is that it does not require them to recall past information about their navigation, thus decreasing the cognitive load strain. Moreover, the majority gave positive feedback about the accompanying training version as it encouraged them to move more freely and with confidence when using the application, reducing the stress levels they had regarding either damaging the exhibitions or hurting themselves in the process. Finally, the user manual was quite explanatory according to the users; however, they did find the demonstration by someone trained in this application more reassuring. This is also true even for digitally sophisticated blind individuals which are approximately a third of the participants.
For the scale of Response Behaviour (1.18), users had mixed feelings concerning the rate by which the application responds (–0.16). They found it slightly unpleasant (−0.28), not sufficiently natural (−0.08), and not entertaining enough (−0.08). Many of the users noted that they prefer the response behaviour to be more natural and they recommended that many instructions with short duration be substituted by instructions with larger duration. For example, the following instructions are typically issued in succession:
Stop;
Turn right;
Move on.
Should be changed to the following instruction:
Stop, then turn right and then move on.
Finally, the majority of the users, taking into consideration both the educational and entertaining aspects of a museum, suggested that the content of instructions should not be structured in an imperative voice.
The score of the Personalization scale (−0.01) highlights the need to provide more customizability regarding the speed by which the instructions are issued, the available voice assistants as well as the speed by which the exhibits are described (−0.12). In addition, the users stated that changing the current configuration options is neither easy nor difficult (−0.04) and does not slow them down significantly (0.12). Finally, users without complete vision loss and differentiated cases of visual impairments as well as users that have their escorts would prefer the application to have the capability to choose to simply tour an exhibition room without the application issuing navigation instructions. The lack of this feature thereof results in negatively impacting the rating about the flexibility of the application (0.00).
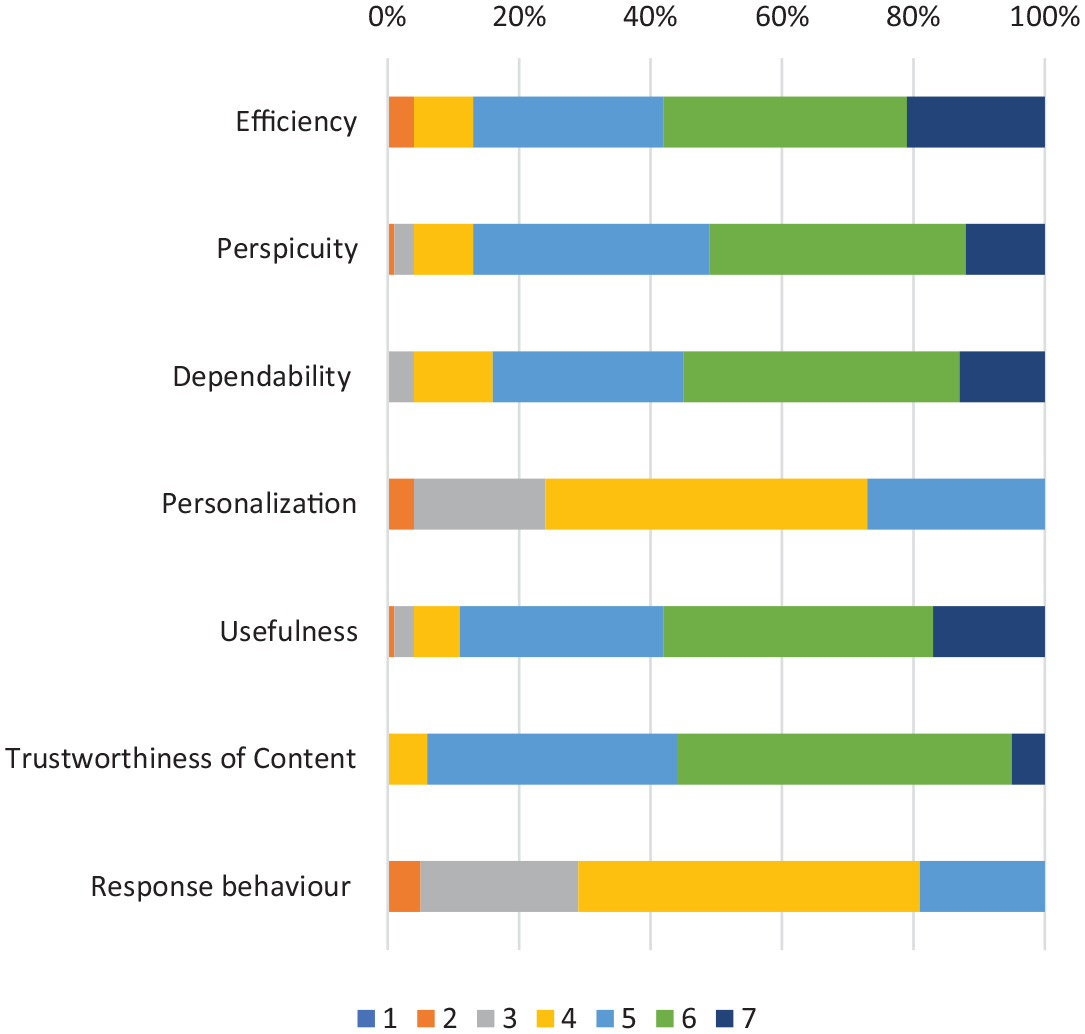
Distribution of responses by scale
Next, Figures 12 and 13 depict the distribution of responses for each scale and per item, respectively, in the range of 1–7. Most of the responses had a score above 5 with the only exceptions that the scales of personalization and response behaviour were their highest scores topped at 5. On average, 50.5% of the responses of these two scales scored a 4 while 22% of them scored a 3. Overall, 77% of responses are lower than 4. The rest of the scales received higher scores closer to 6, thus boosting the average.
Distribution of answers per scale.
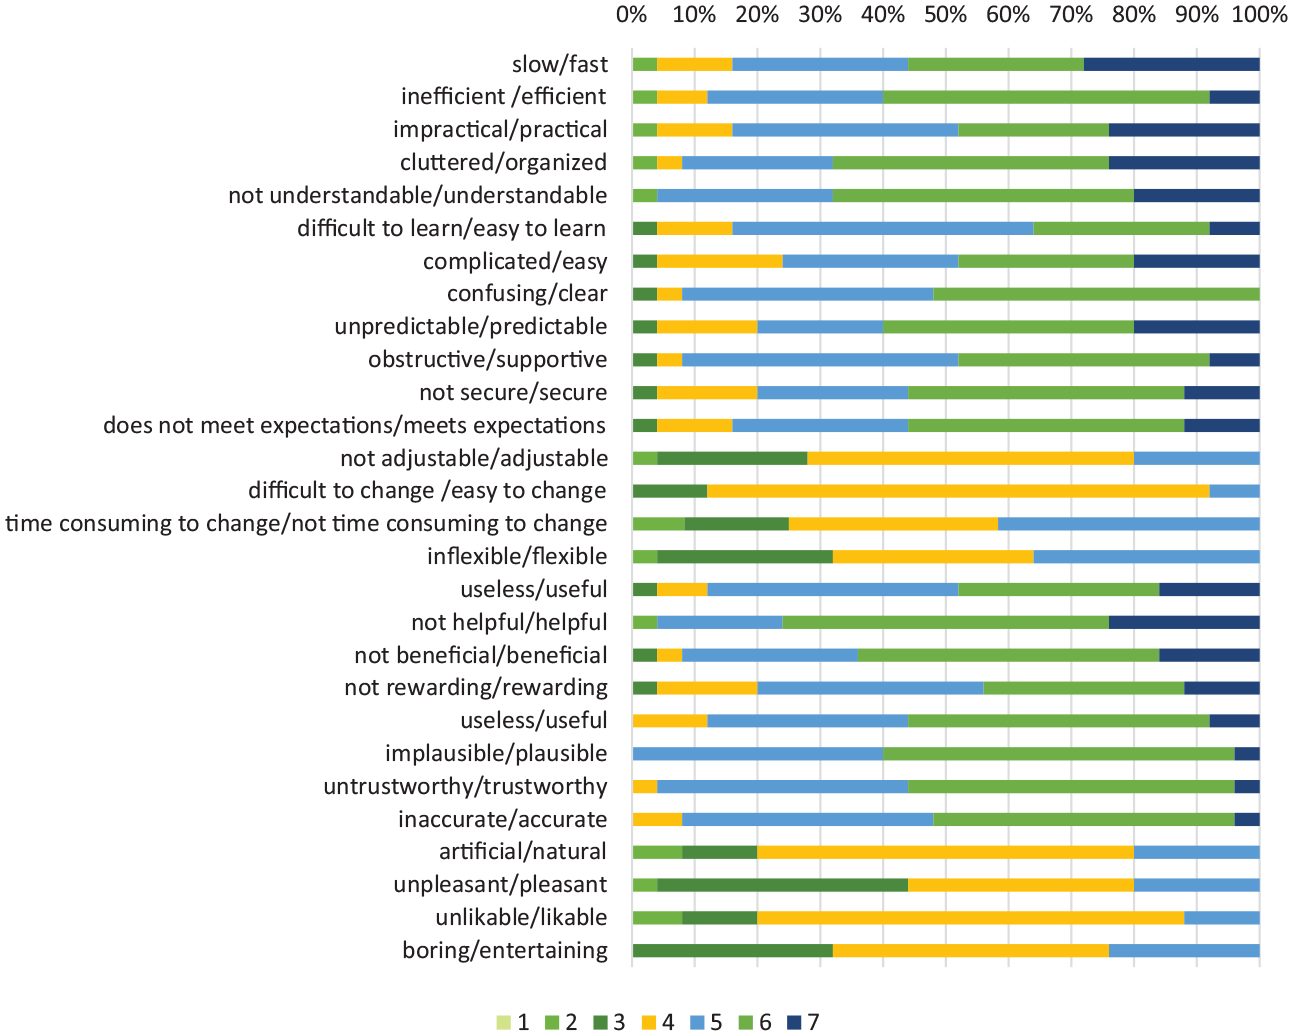
Distribution of answers per item.
Consistency of the scales
Finally, to assert the consistency of our results, we applied Cronbach’s alpha coefficient to user responses. Despite the lack of a generally accepted rule of thumb about the value of the coefficient, in practice, a value greater than 0.7 is sufficient to qualify the results as reliable. Table 4 contains the results of consistency for every scale where we can observe that the results are indeed reliable. Figure 14 depicts Table 4 as a bar graph.
Cronbach per scale.
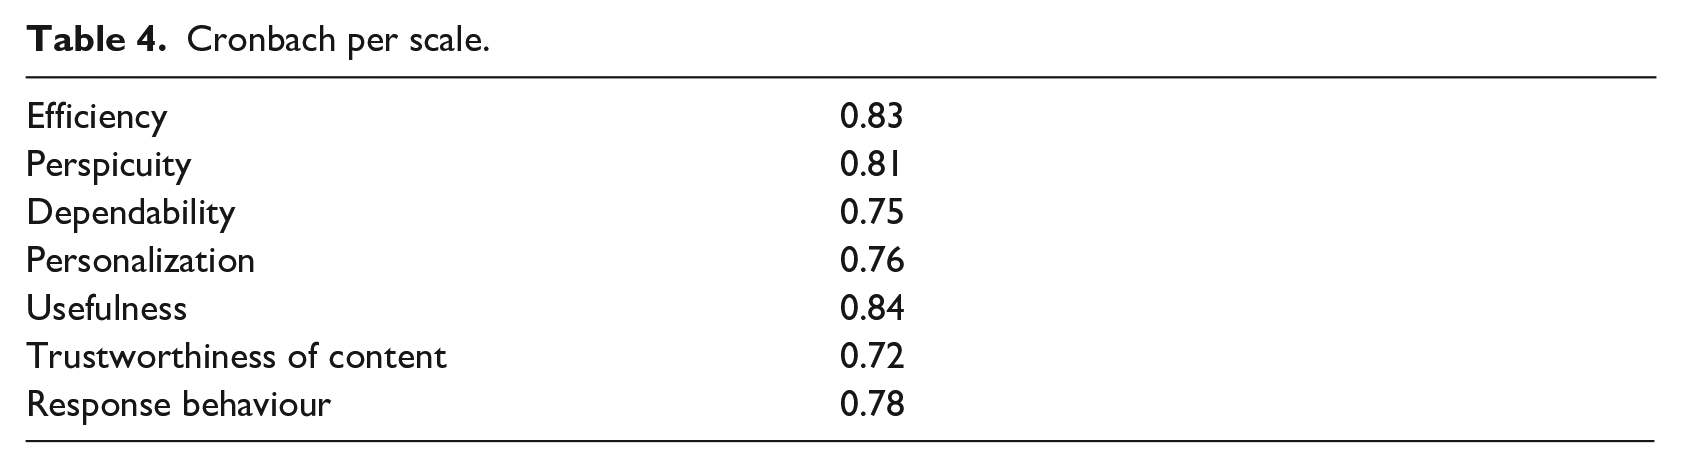
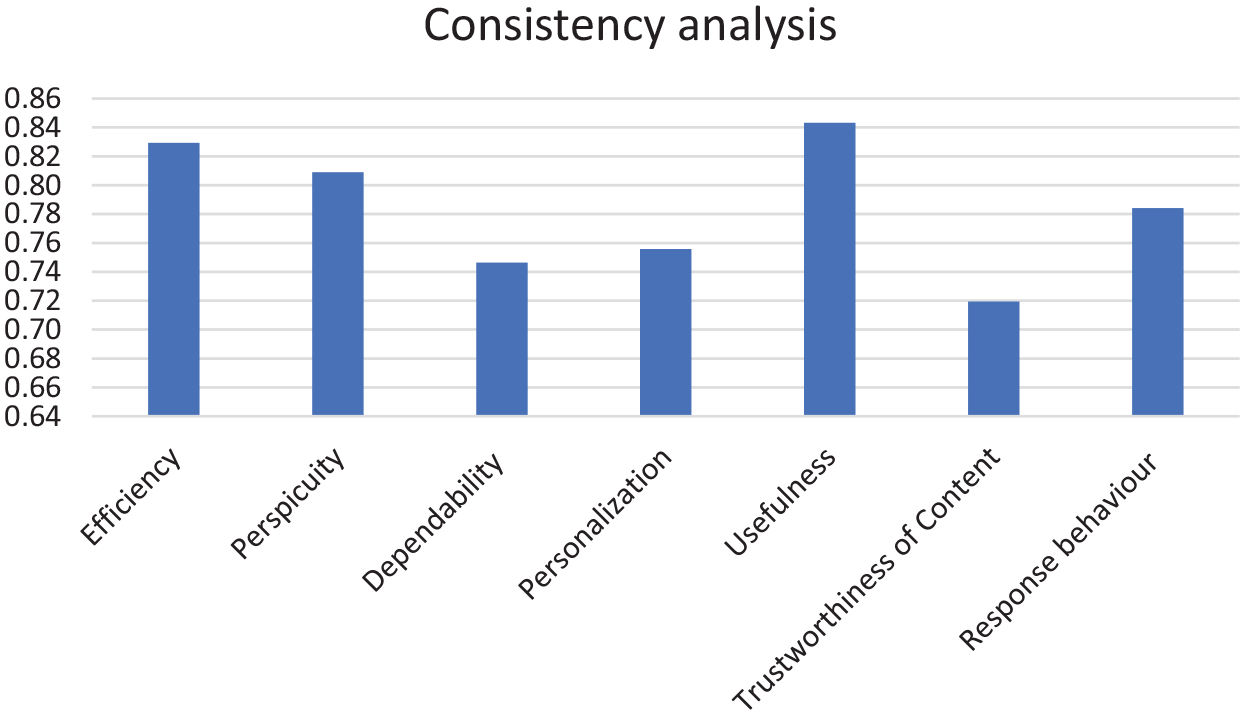
Bar graphic of Cronbach per scale.
Real-life demonstration
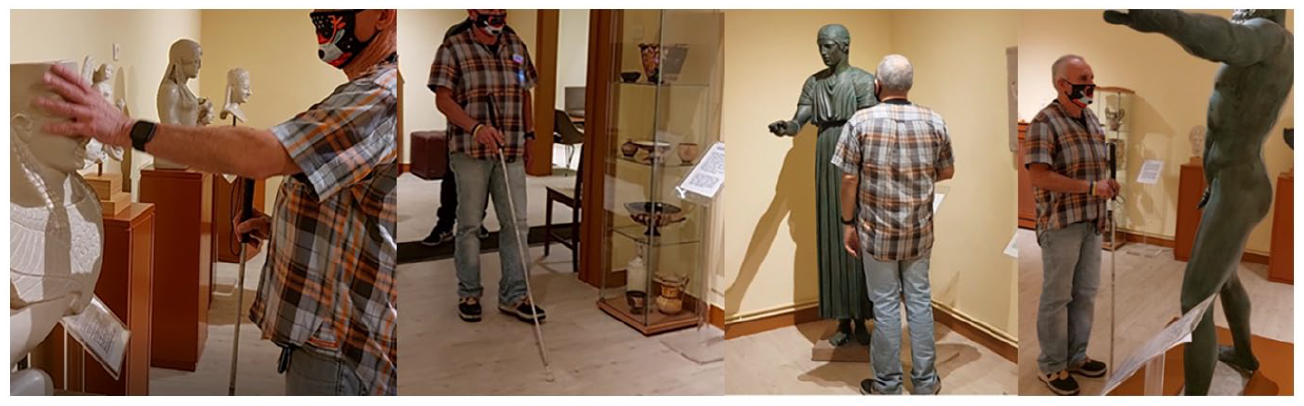
In this section, we demonstrate the application’s functionality as it is being used by a blind individual for navigating inside the exhibition rooms of the Tactual Museum of Athens. In this scenario, the blind user has selected to navigate the rooms of the thematic route including the exhibition room of Hermes, and Poseidon, situated on the ground and first floor, respectively. Besides Poseidon, the first floor has three additional exhibition rooms. After selecting the thematic route via the provided voice interface, the user must stabilize the smartphone device on a part of his body. The following instruction ‘Please, hold the phone and stay still’ is issued. In this case, the user chose to place the smartphone device in the front pocket of his shirt. As soon as this is completed, the application requests the user to perform a trial walk on a special surface tactile ground indicator guide located at the entrance of the museum serving as the starting point for every thematic route. The purpose of the latter is to allow for the calibration of the application’s model to the particularities of the user’s unique gait. The following sequence of snapshots (Figure 15) depicts the previously described process. The first three snapshots from left to right show the user traversing from one end of the special surface tactile ground indicator guide to the other completing the stage of calibration. For this case, the following sequence of instructions is issued: ‘Please, after the distinctive sound, walk down the initial tactile ground surface indicator’ followed by ‘You have reached the end of the route, calibration completed’.
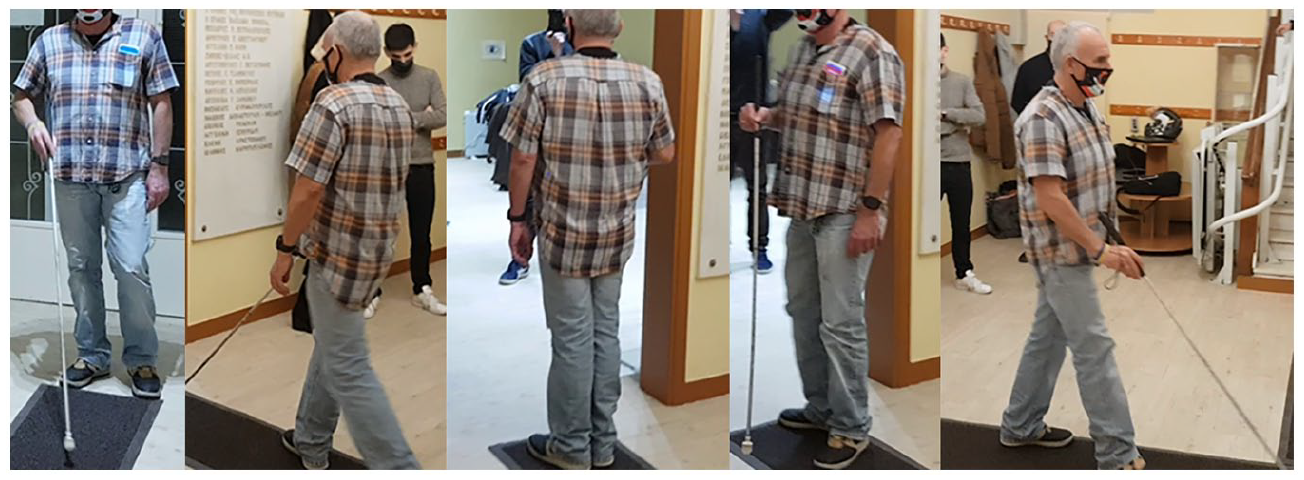
Step 1: Calibrating the application’s model to the user’s gait.
Next, the application requested the user to make a 180° turn issuing the instruction: ‘Make a 180 degree turn until you hear the distinctive sound’. In the fourth figure, the user is depicted midway through this turn. As soon as the turn is complete, the application issues the ‘Please stop’ instruction. Subsequently, it issues navigation instructions for the exhibition room of Hermes. Next, the application issues the instruction ‘Please continue moving straight ahead’. The fifth figure depicts the user navigating to the door of the Hermes exhibition room located on his right side approximately at the middle section of the surface tactile ground indicator guide. When the user reaches the entrance, the following instructions are issued ‘Please stop’ and ‘Please make a sharp right turn until you hear the distinctive sound’.
At the entrance of the Hermes exhibition room and after being properly aligned with the help of the special surface tactile ground indicator guide, the application instructs the user to perform a single step to enter the room. For every exhibit, the application guides the user up to the corresponding location followed by an instruction to make a right or a left turn to properly align the user with the exhibit. To avoid overturns, the application has special instruction that informs the user when to stop. The first three snapshots from left to right (Figure 16) show a sample of the exhibits found in the Hermes exhibition room. The last figure depicts the user following the issued instructions to exit the room and continue the exhibition to the next room. Generally, the instructions issued for the navigation are of the following form: ‘Please make a sharp right/left turn until you hear the distinctive sound’, ‘Stop’, ‘Please continue straight ahead’, ‘The exhibit can be found at the height of your shoulder – Exhibit description’, ‘Would you like the short or full description, yes or no?’
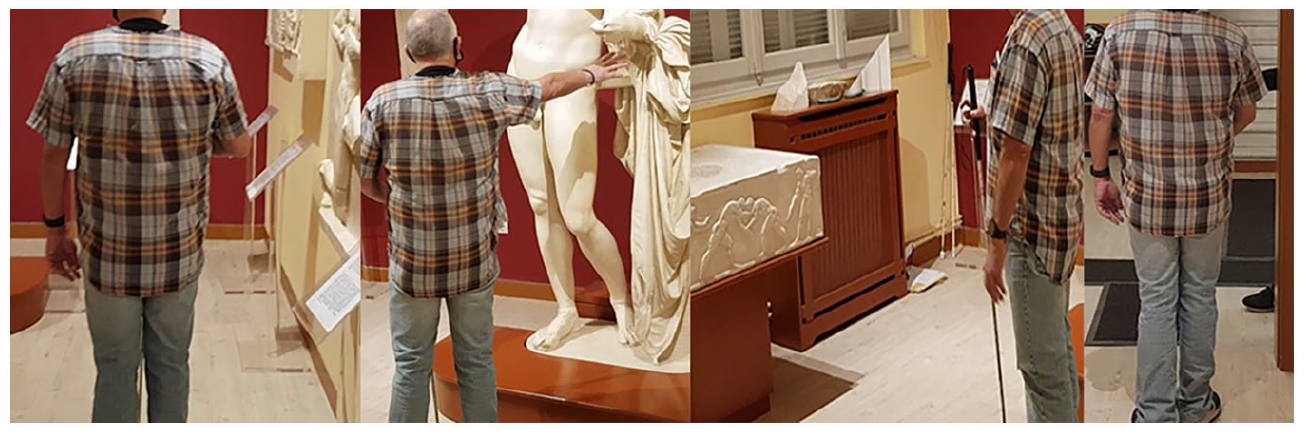
Step 2: Inside the exhibition room of Hermes.
To approach the Poseidon exhibition room, the blind user has to use the staircases that are on the opposite side of the Hermes exhibition room. With the help of the special surface tactile ground indicator guide the user is realigned and becomes ready to use the stairs (Figure 17, first). Special instructions are used to caution the user while using the staircase (Figure 17, second). ‘Please go up the stairs carefully following the handrail on your right, when you go up the stairs, press your screen twice to continue the tour’.
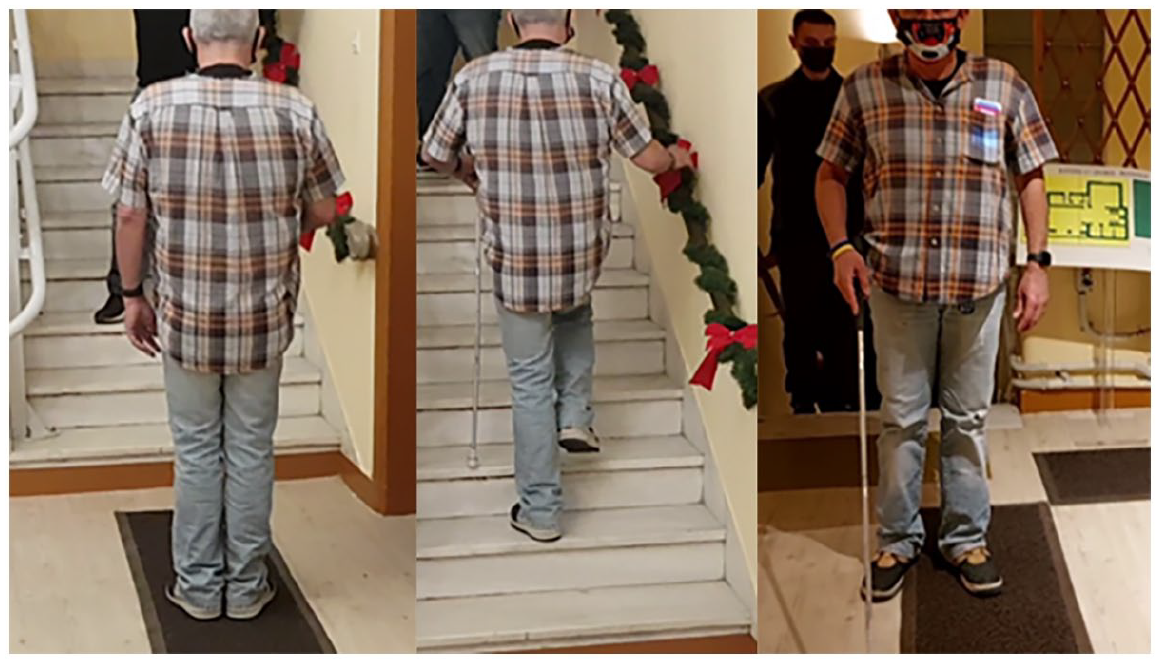
Step 3: Staircase leading to the Poseidon exhibition room on the first floor.
When the user reaches the first floor, another set of special surface tactile ground indicator guides are used to align the user to the correct route.
Analogous to the first exhibition room, the application issues the appropriate instructions to navigate the user to the substantially larger Poseidon exhibition room. The following snapshots present a sample of the available exhibits (Figure 18).
Step 4: Inside the Poseidon room.
At some point during the navigation, the user makes an error and overturns. The application tries to realign the user back to the correct path direction by issuing special instructions that inform him when to stop. In the following snapshots, the user can be seen trying to realign himself after his error (Figure 19). He makes multiple attempts to correct himself (first three snapshots from left to right) before finally succeeding (fourth snapshot). The typical instructions for this scenario are the following: ‘Please make a sharp right/left turn until you hear the distinctive sound’, ‘Stop’ and in case of overturn ‘You turned less/more than needed’.
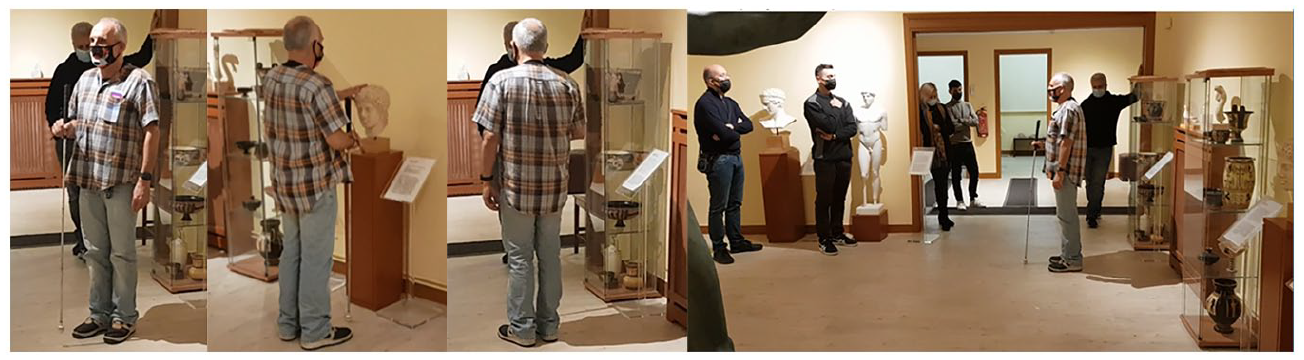
Step 5: Correcting accidental overturn.
When the exhibition of the Poseidon room finishes the application returns the user to the ground floor of the museum where the employees and volunteers take back the smartphone device.
Discussion – limitations – future actions
In contrast to the case of external navigation which uses both the GPS to dynamically calculate the user’s position and the available map services, such as Google Maps, Apple Maps, and other related services, to navigate the user, there is no universally accepted solution for the case of indoor navigation. Also, there is neither an abundance of research results nor available commercial solutions found for the case of internal navigation (Real & Araujo, 2019). The difficulties associated with indoor navigation applications relate, on one hand, to the limited accuracy in positioning that can often deviate significantly from the actual position, creating problems for individuals with blindness and visual impairments, and on the other hand, to the resources and time costs involved in the process of mapping indoor spaces as it is separately performed for each case.
Although there are enough solutions available to track the location of individuals in indoor environments with a fairly high degree of accuracy, most of them require the use of special equipment (e.g., RFID readers, special cameras, and others) that, first, impose costs on individuals with visual impairments and blindness, second, significantly slow down the adoption rate and, third, many of these solutions perform computations that require high processing power (e.g., 3D space representation systems, AR systems, and the like). The consolidation of the use of smartphone devices in indoor navigation applications, with their comparatively lower cost and the integration of powerful computational capabilities, multiple sensors and augmented interfaces in a handheld device, is undoubtedly the best candidate for blind indoor navigation applications.
Taking into consideration the aforementioned and the strong requirement concerning ease of use of indoor navigation applications, we implemented and evaluated a competitive indoor navigation system that has several advantages over the available state-of-the-art solutions. First, the proposed system demonstrates excellent indoor positioning accuracy via the combination of surface tactile ground indicator guides, which follow the ISO 23599:2012 (2012) standard, and of the PDR method. Despite the initial design and implementation of the application including the utilization of BLE beacons for the minimization of positioning errors, the small rooms of the Tactual Museum created challenges (as described in section ‘Methodology’) that prohibited the adoption of this solution. Nonetheless, preliminary trials in bigger spaces suggest the effectiveness of incorporating BLE beacons as proximity sensors of POIs for indoor environments. Second, the adoption of surface tactile ground indicator guides further increases the sense of safety and confidence that is crucial for individuals that are blind and visually impaired. Third, the proposed solution has a low cost facilitated by the adoption of BLE technology radio beacons instead of passive RFID tags for marking the location of POIs. This allows for the formation of one-to-many active-passive relationships between the users and indoor spaces. The alternative solution would instead form one-to-many passive–active relationships between the indoor space and the users, thus, involving a significantly higher cost as it is proportional to the number of users (e.g., one RFID tag reader for each user).
Next, our work highlights the central role of smartphone devices as enablers of indoor blind navigation applications that allow the interaction with POIs facilitated by BLE beacons without requiring additional special equipment to realize such applications. Despite the success of our application, the only limitation concerns the placement of the smartphone device on the user. However, during the testing stages at the Tactual Museum of Athens, the users did not seem to raise any serious concerns about that issue. Moreover, the fact that there is no other similar application in scope available to them reinforces a positive attitude towards our application. Another benefit of our proposed solution, besides satisfying the critical requirement for high accuracy in positioning and system reliability, is that it highlights the importance of another decisive factor for the adoption of such applications by users that are blind and visually impaired. This pertains to the ease of use via proper auditory and tactile interfaces. Unfortunately, many cutting-edge technologies do not focus enough on this important issue as any indoor navigation application should be easy to use. Finally, the successful implementation of an indoor blind navigation application requires mapping the indoor environment. Our system resolves the typical dilemma between the complexity of high positioning accuracy and the cost of the manual indoor navigation mapping process by choosing to simplify the latter without, though, compromising on the accuracy and reliability of the positioning system.
Although the proposed system has been successfully implemented and the results demonstrate a fully functional product, the current implementation does not address the possibility of having multiple users sharing a large indoor space where they can bump into each other. In the near future, we plan to resolve this limitation by adopting one of the following solutions or a combination of them. Either we can leverage the obstacle detection subsystem of BlindRouteVision, our outdoor blind navigation system (Meliones et al., 2022; Theodorou, Tsiligkos, et al., 2022) and integrate into BlindMuseumTourer appropriate voice instructions, or we could develop a companion service running on a server that would extend the basic version of BlindMuseumTourer by transmitting in real-time the position of the users navigating in the same place. With that service available, the application could detect and send a collision-avoidance message in the case of an imminent collision.
Moreover, in the near future, we intend to further leverage the information provided by the BLE beacons to even eliminate the requirement for surface tactile ground indicator guides, to further optimize the PDR mechanism and improve the voice interface. Furthermore, we plan to run more extensive pilot trials in a multitude of different venues requiring extensions to the current version of BlindMuseumTourer. These include larger museums as well as public spaces such as hospitals, airports, shopping malls, and the like. At the time of the writing, we have formally requested and received responses expressing the intent to participate in trials from the National Archaeological Museum, the Acropolis Museum, the Goulandris Museum, the National Historical Museum, the Stavros Niarchos Foundation Cultural Center (SNFCC), Attiko Metro, the shopping centre ‘The Mall’, the Rea Maternity Hospital, and the Evangelismos Hospital where a preliminary mapping of the Emergency Room (ER) section has already been made.
Recognized limitations of our usability and UX evaluation study are both the insufficient number of test subjects and the lack of the sample’s geographical heterogeneity, since the pool comes only from Greece. Subsequently, these affect our ability to make generally applicable statements and their emergence can be attributed to various factors. Among the ones that influenced the most the effort to find a large sample of individuals with blindness and visual impairments are the mobility challenges they face and the unfortunate occurrence of the COVID-19 pandemic. To address these challenges, we intend to recruit participants from around the globe, with the help of World Wide Web communities. In this way, the enriched sample will solidify our effort to reach conclusions that have greater statistical significance. In addition, as part of the above effort, we will try to diversify the sample in key areas such as age, gender, living environment, as well as previous experiences with the conventional white cane and other assistive technologies. Ultimately, this will provide a firm basis for developing more widely acceptable tools due to having a better grasp of the needs and requirements of a wider part of the blind and visually impaired global population.
Nonetheless, all this effort is not fruitless. Although the local group expresses personal preferences, opinions, and suggestions, the gathered requirements during interviews can be leveraged by other researchers in the field as well as from developers of similar applications. This can be argued on the basis that it is reasonable to assume that preferences along with the solutions blind individuals choose to overcome the challenges they face, overlap to some extent regardless of their origin and region.
Response bias was another issue that concerned us during the evaluation phase as it can happen without noticing it. The causes of this issue can be attributed to the influence exerted on the participants by the socio-economic characteristics of the person conducting the interview as well as the potential preferences of that person with respect to the subject of the study (Dell et al., 2012). Given that in our case the interviewer was a member of the research team, we cannot rule out the possibility of having response bias. To address this issue, we intend for the upcoming evaluation with a larger and more diverse sample to provide the semi-structured interviews in Braille form as well, so that blind users can have the opportunity to assess the application completely on their own. Following the same line of thought, the accessible via Google Forms UX questionnaire will be handed out in Braille format as well to include participants with low digital sophistication.
As part of our future work, we intend to further optimize the existing training (simulation) version of the app. It is developed as an interactive virtual navigation software solution for Android smartphones with the end goal to ease engagement with this type of technology and increase the effectiveness of its usage since spatial information can be obtained indirectly (before navigation). Moreover, we consider that the design, implementation, and validation of a relevant virtual reality (VR) application can significantly enhance the trainability of the blind and visually impaired.
One of the outcomes of our involvement with the MANTO project for indoor navigation was the realization of the importance of the participation of the users that are blind and visually impaired during both the design and the validation phase. This was achieved via a cognitive design framework and the conduct of usability and performance studies. The former promotes a set of principles-criteria that include safety, reliability, reinforcement, and preferences and emphasizes the inclusion of the immediate beneficiaries in the design process as well. The latter allowed for the research team to gather information related to adding new features, fixing bugs, improving the application’s performance, and learning about the usability and UX aspects of the proposed system. It is within the deep convictions of the research team that this information was indispensable in the process of designing and validating an indoor navigation application that best serves the interests of the blind and the visually impaired.
Finally, the creation of an extended version of the technology acceptance model (TAM) model is of paramount importance for the goal of improving the acceptance and usage of the proposed and other related technologies. To the best of our knowledge, we are not aware of a TAM-based model that focuses on the individual characteristics of this particular target group and will be the focus of a future paper.
Conclusion
This article presented the extended usability and UX evaluation of a smartphone-based indoor navigation application for people that are blind and visually impaired named BlindMuseumTourer. Prior to conducting the evaluation, the research team ensured that the users familiarized themselves with the functionality of the application during special training sessions. Next, a survey of the available literature highlighted the progress made and the limitations of the various attempts during the past decade. Following, a high-level description of the proposed solution was also included for reasons of completeness the design of which was the result of a cognitive-driven process that incorporated extended interviews with blind users who had expertise in assistive technologies as well as those with low digital sophistication. The proposed solution combines a PDR algorithm with in-premise surface tactile ground indicator guides, the smartphone’s gyroscope sensor, and BLE technology radio beacons, which were not utilized in the current version of the app. The algorithm computes with high accuracy the user’s position and the travelled distance minimizing the associated error, thus allowing the successful navigation of the user around the premises of the museum. Furthermore, the findings of this work confirm that the design process and the selected equipment satisfy the user requirements. Specifically, the results from the usability and UX assessment demonstrate that the current version of the system is both dependable and useful while the overall results from the trials in the museum predict the effectiveness of the system on a larger scale as well. Despite a few limitations described in section ‘Discussion – limitations – future actions’, the application was well-received, its user base is increasing according to the statistics gathered by the Tactual Museum of Athens, and as reported, it created anticipation for future versions that will extend the number and type of supported spaces.