
Abstract
The study set out to examine the impact of the introduction of a national diabetic retinopathy screening programme in Scotland in 2006 on incidence and trends in severe sight impairment (SSI) certification due to diabetes over three decades.
We analysed SSI certification due to diabetic eye disease in Fife, Scotland, between 2010 and 2019 and compared it to previously published estimates from 1990 onwards. Population estimates of the general population and those with diabetes were obtained from the National Records of Scotland and the National Diabetes Register, NHS SCI Diabetes, respectively. Mean annual incidence of SSI in the population with diabetes, 1990–2019, before and after the introduction of diabetic retinopathy screening was compared using a Mann–Whitney U Test.
Mean incidence in 2007–2019 was 19.8/100,000 and was significantly less than the period before the systematic screening, 1990–2006 (57.5/100,000, p < .001). Mean SSI incidence due to diabetes in Fife between 2010 and 2019 was significantly lower than in the previous decades (p < .001) at 16.4 per 100,000 for the population with diabetes, per year (SD 10.0; 95% confidence interval: [9.2, 23.5]) compared to 42.7 per 100,000 in 2000–2009 and 64.3 per 100,000 in 1990–1999.
This study demonstrates a significant reduction in the annual incidence of SSI due to diabetes before and after the introduction of the screening programme provides evidence for the benefit of systematic diabetic retinopathy screening programmes. Other factors including improved management of diabetes and risk factors will have also had an impact emphasizing the importance of a multidisciplinary approach to the prevention of sight loss in diabetes.
Introduction
Diabetes is a significant and growing global public health concern (Harding et al., 2019). The prevalence of diabetes in the United Kingdom has steadily increased over the past decades as a result of lifestyle factors, an ageing population, increased detection, and improved survival (Zghebi et al., 2017). Diabetic eye disease is a leading cause of preventable severe sight impairment (SSI) worldwide (Bourne et al., 2013), and the World Health Organization has highlighted diabetic eye disease as a public health priority (World Health Organization [WHO], 2010). The personal and socioeconomic cost of SSI in combination with available preventive methods makes tackling diabetic eye disease a cost-effective public health target (Cheung et al., 2010; Leasher et al., 2016).
Severe sight impairment can result from proliferative diabetic retinopathy leading to vitreous haemorrhage and retinal detachment, and from diabetic maculopathy, caused by ischaemia or exudation of fluid (Cheung et al., 2010). Severe sight impairment due to diabetes is considered preventable if diagnosed and treated early (Cheung et al., 2010; Harding et al., 2019).
Many countries have introduced national diabetic retinopathy screening programmes with the aim of early identification of asymptomatic sight-threatening retinopathy (Claessen et al., 2018; Harding et al., 2019; Liew et al., 2014; Stefansson, 2006). Scotland’s diabetic retinopathy screening service was introduced in 2006, and by 2010, this was successfully screening almost 80% of eligible people with diabetes (Scottish Diabetes Group, 2020).
Fife is a defined semi-rural region of southeast Scotland with a population of just more than 370,000 (National Records of Scotland, 2020). We have previously reported the prevalence and incidence of SSI due to diabetic eye disease in Fife, in the decades since 1990. Cormack et al. (2001) estimated the incidence of SSI attributable to diabetes in Fife to be 64 per 100,000 in the population with diabetes per year for the decade 1990–1999. Hall et al. (2013) noted a downwards trend in SSI certification in Fife for the following decade, with incidence falling by a mean of 10.6% per year in the population with diabetes to 43 per 100,000. Since 2008, Fife has had an electronic record of sight impairment due to all causes. Using this anonymized data, we can now report the incidence and prevalence of SSI in the third decade from 2010 to 2019, the first full decade of implementation of Scotland’s national screening programme and compare long-term trends of SSI due to diabetes over three decades in a defined population.
Materials and method
SSI (blind) certification data
SSI certification is voluntary and is legally defined by the 1948 National Assistance Act, as ‘a person so blind as to be unable to perform any work for which eyesight is essential’ (UK Government Legislation, 1948). In practice, this is defined as vision worse than 3/60 in the better eye or better than 3/60 with a markedly reduced visual field. In April 2018, the term ‘severe sight impairment’ replaced the term ‘blindness’ on the updated certificate of visual impairment (CVI) (Scottish Council on Visual Impairment, 2018). The criteria for certifying visual impairment remained unchanged. Since 2007, people certified with SSI in Fife have been included in a database held by Seescape (previously called the Fife Society for the Blind). The society also registers any death of patients and updates records accordingly.
In England and Wales, a copy of the CVI is sent to the Certification Office, London, for anonymized epidemiological analysis. In Scotland, there is no equivalent central analysis, and certification data are held locally. Alongside the cause of SSI, information on age, sex, date of certification, age at certification, and, if applicable, date of death was extracted from the database. All SSI certifications between 01 January 2010 until 31 December 2019 were included. Patient written consent for anonymized use of data for the purpose of research is obtained at the time of SSI registration. Ethics approval was therefore not required as an existing anonymized dataset was analysed with appropriate consent obtained at original data collection.
Population data
Population estimates for Fife were obtained from the National Records of Scotland (2020). As these are mid-year figures, end-of-year estimates were obtained by taking the mean of the two neighbouring mid-year figures, to better correspond to the available end-of-year figures for the population with diabetes in Fife. As the mid-year estimate of 2020 had not been published at the time of writing, the 2019 mid-year population estimate was used instead of the mean of 2019 and 2020 mid-year estimates. End-of-year estimates of the population with diabetes in Fife between 2010 and 2019 were taken from the Scottish Care Information–Diabetes (SCI-Diabetes), the National Diabetes Register which is routinely used to record clinical data electronically for everyone with diabetes in Scotland and the associated Scottish Diabetes Surveys (SDS) of 2010 to 2019 (Scottish Diabetes Group, 2020). Data on referral rates from diabetic retinopathy screening to secondary care in Fife were obtained directly from the National Retinopathy Screening Service. Referral criteria are based on National Scottish retinopathy screening standards (Scottish Diabetic Retinopathy Screening Collaborative, 2020).
Statistical analysis
Incidence and prevalence calculation
The incidence of SSI due to diabetes in the general population was calculated for each year for the decade 2010–2019 and expressed per 100,000 population. The same calculation was performed using the estimated population with diabetes for each year in Fife as the denominator. Population and incidence data from the previous two reported decades were obtained from Cormack et al. (2001) and Hall et al. (2013). Mean incidence for the decade 2010–2019 was calculated and expressed with standard deviation (SD) and 95% confidence interval (95% CI), using SPSS (IBM SPSS Statistics for Windows, version 26.0. Armonk, NY: IBM Corp). The latter was compared to the equivalent data from the previous decades reported by Cormack et al. (2001) and Hall et al. (2013), using a Kruskal–Wallis test. The mean incidence of SSI due to diabetes 1990–2006 was compared with that from 2007 to 2019 using a Mann–Whitney U test. The absolute number of new certifications each year recorded from 1990 to 2019 was subjected to Poisson regression. A p value of < .05 was considered statistically significant.
The point prevalence of SSI attributable to diabetes on 31 December 2019 was calculated by dividing the total number of SSI certified persons with diabetes known to be alive on that date by the total estimated population in Fife on 31/12/2019 and, separately, by the population with diabetes, each expressed per 100,000 population.
Results
Population estimates and diabetes prevalence
The estimated total population of Fife rose by 2.6% from 363,955 in 2010 to 373,550 in 2019. The population with diabetes in Fife rose by 30.8% from 17,467 in 2010 to 22,854 in 2019. The rise in the prevalence of diabetes between 1990 and 2019 is illustrated in Figure 1.
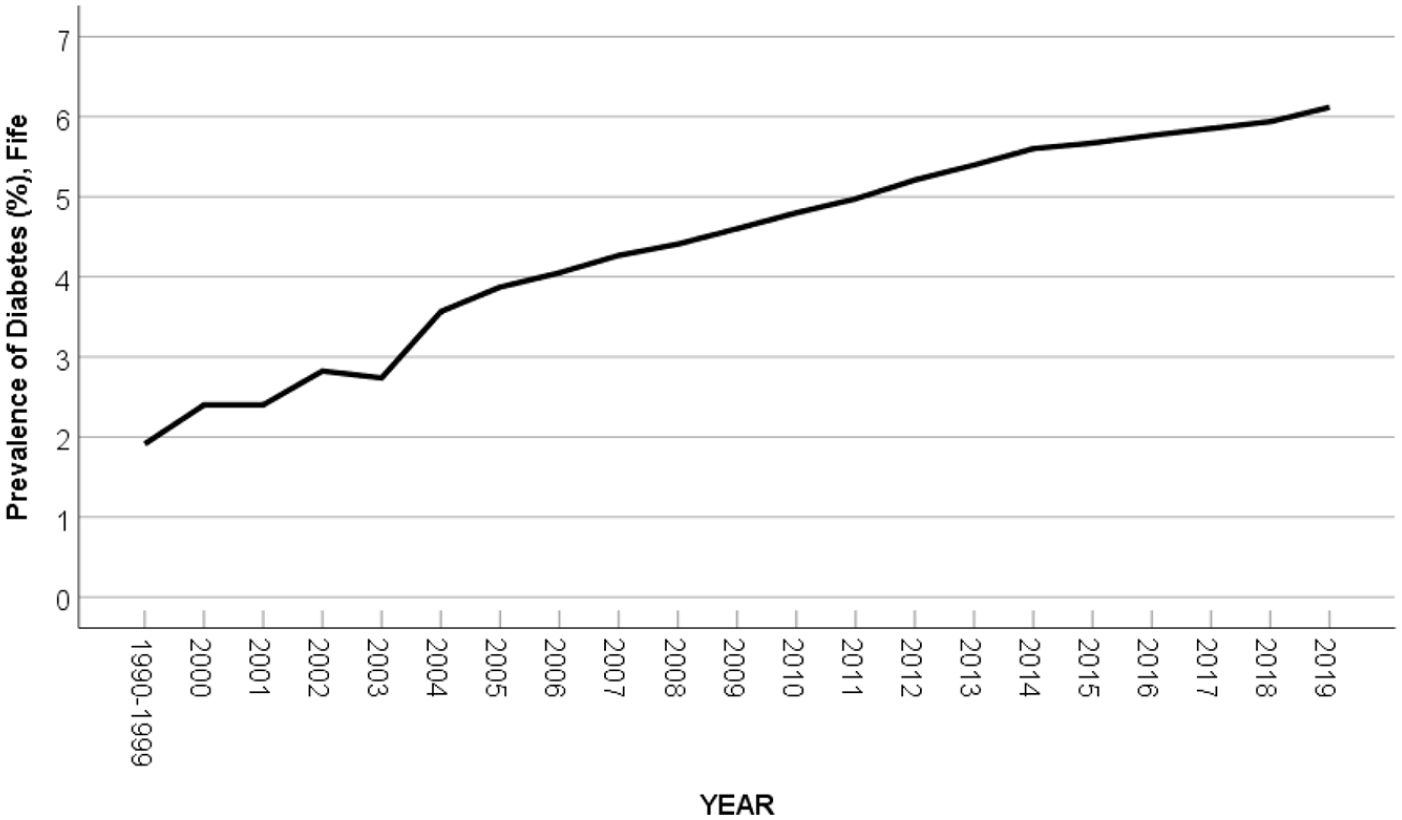
Prevalence of diabetes in Fife 1990–2019, with 2000–2009 data taken from the previous study by Hall et al. (2013) and Cormack et al. (2001) for mean prevalence for 1990–1999.
Causes of SSI
The number of patients certified as SSI over the decade 2010–2019 was 475, of which 34 (7.2%) were certified due to diabetes, 31 with diabetic retinopathy, and 3 with diabetic maculopathy. Sixteen were men, 18 were women, and the mean age at SSI certification was 66 (range 26–93 years). Overall, diabetic eye disease was the third commonest cause of SSI, after age-related macular degeneration (54.7%) and glaucoma (10.1%). Causes of SSI in those of working age are outlined in Figure 2. The cause of SSI could not be traced in 8 (1.7%) out of 475 cases.
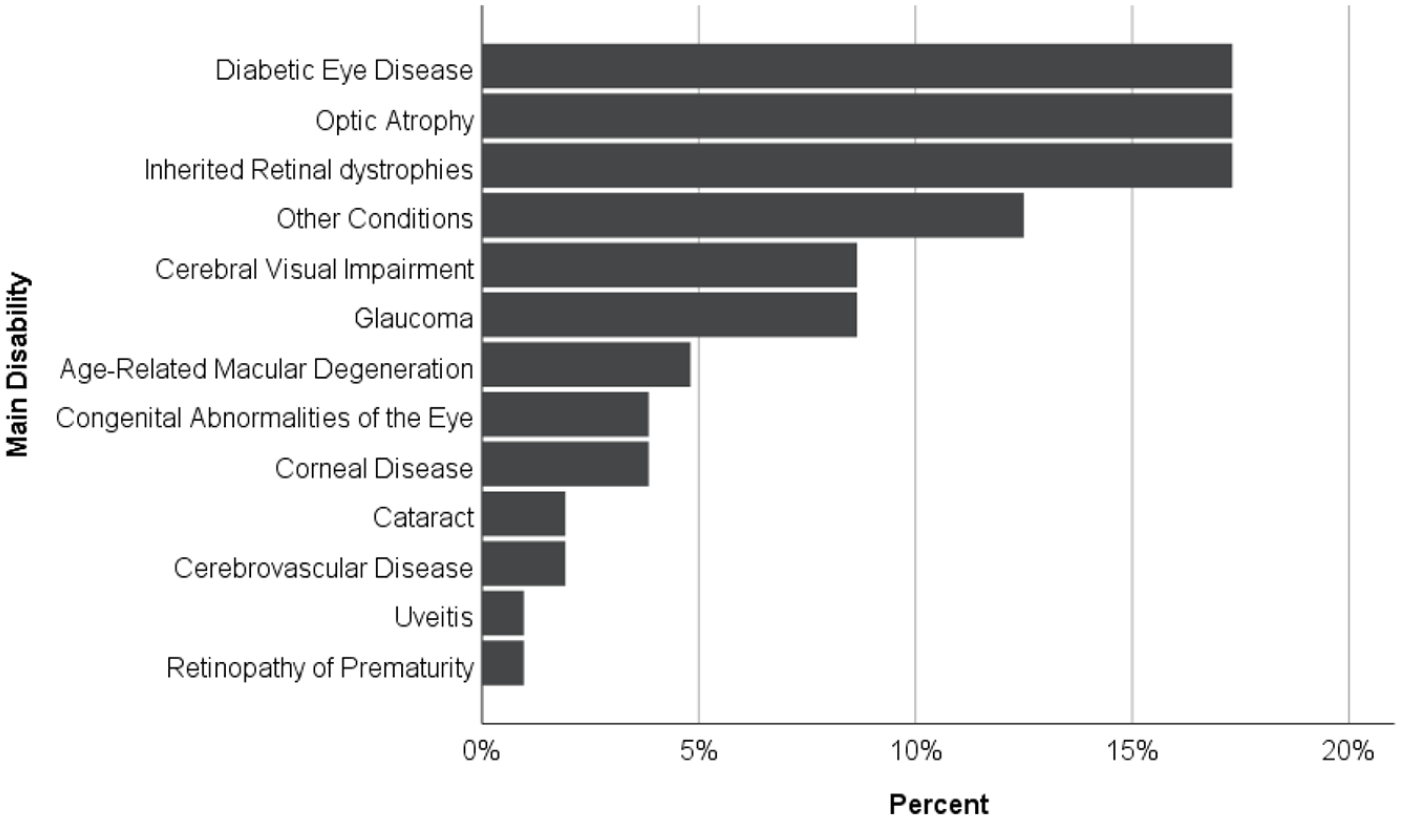
Causes of severe sight impairment in working-age adults (16–64 years) in Fife, Scotland, 2010–2019.
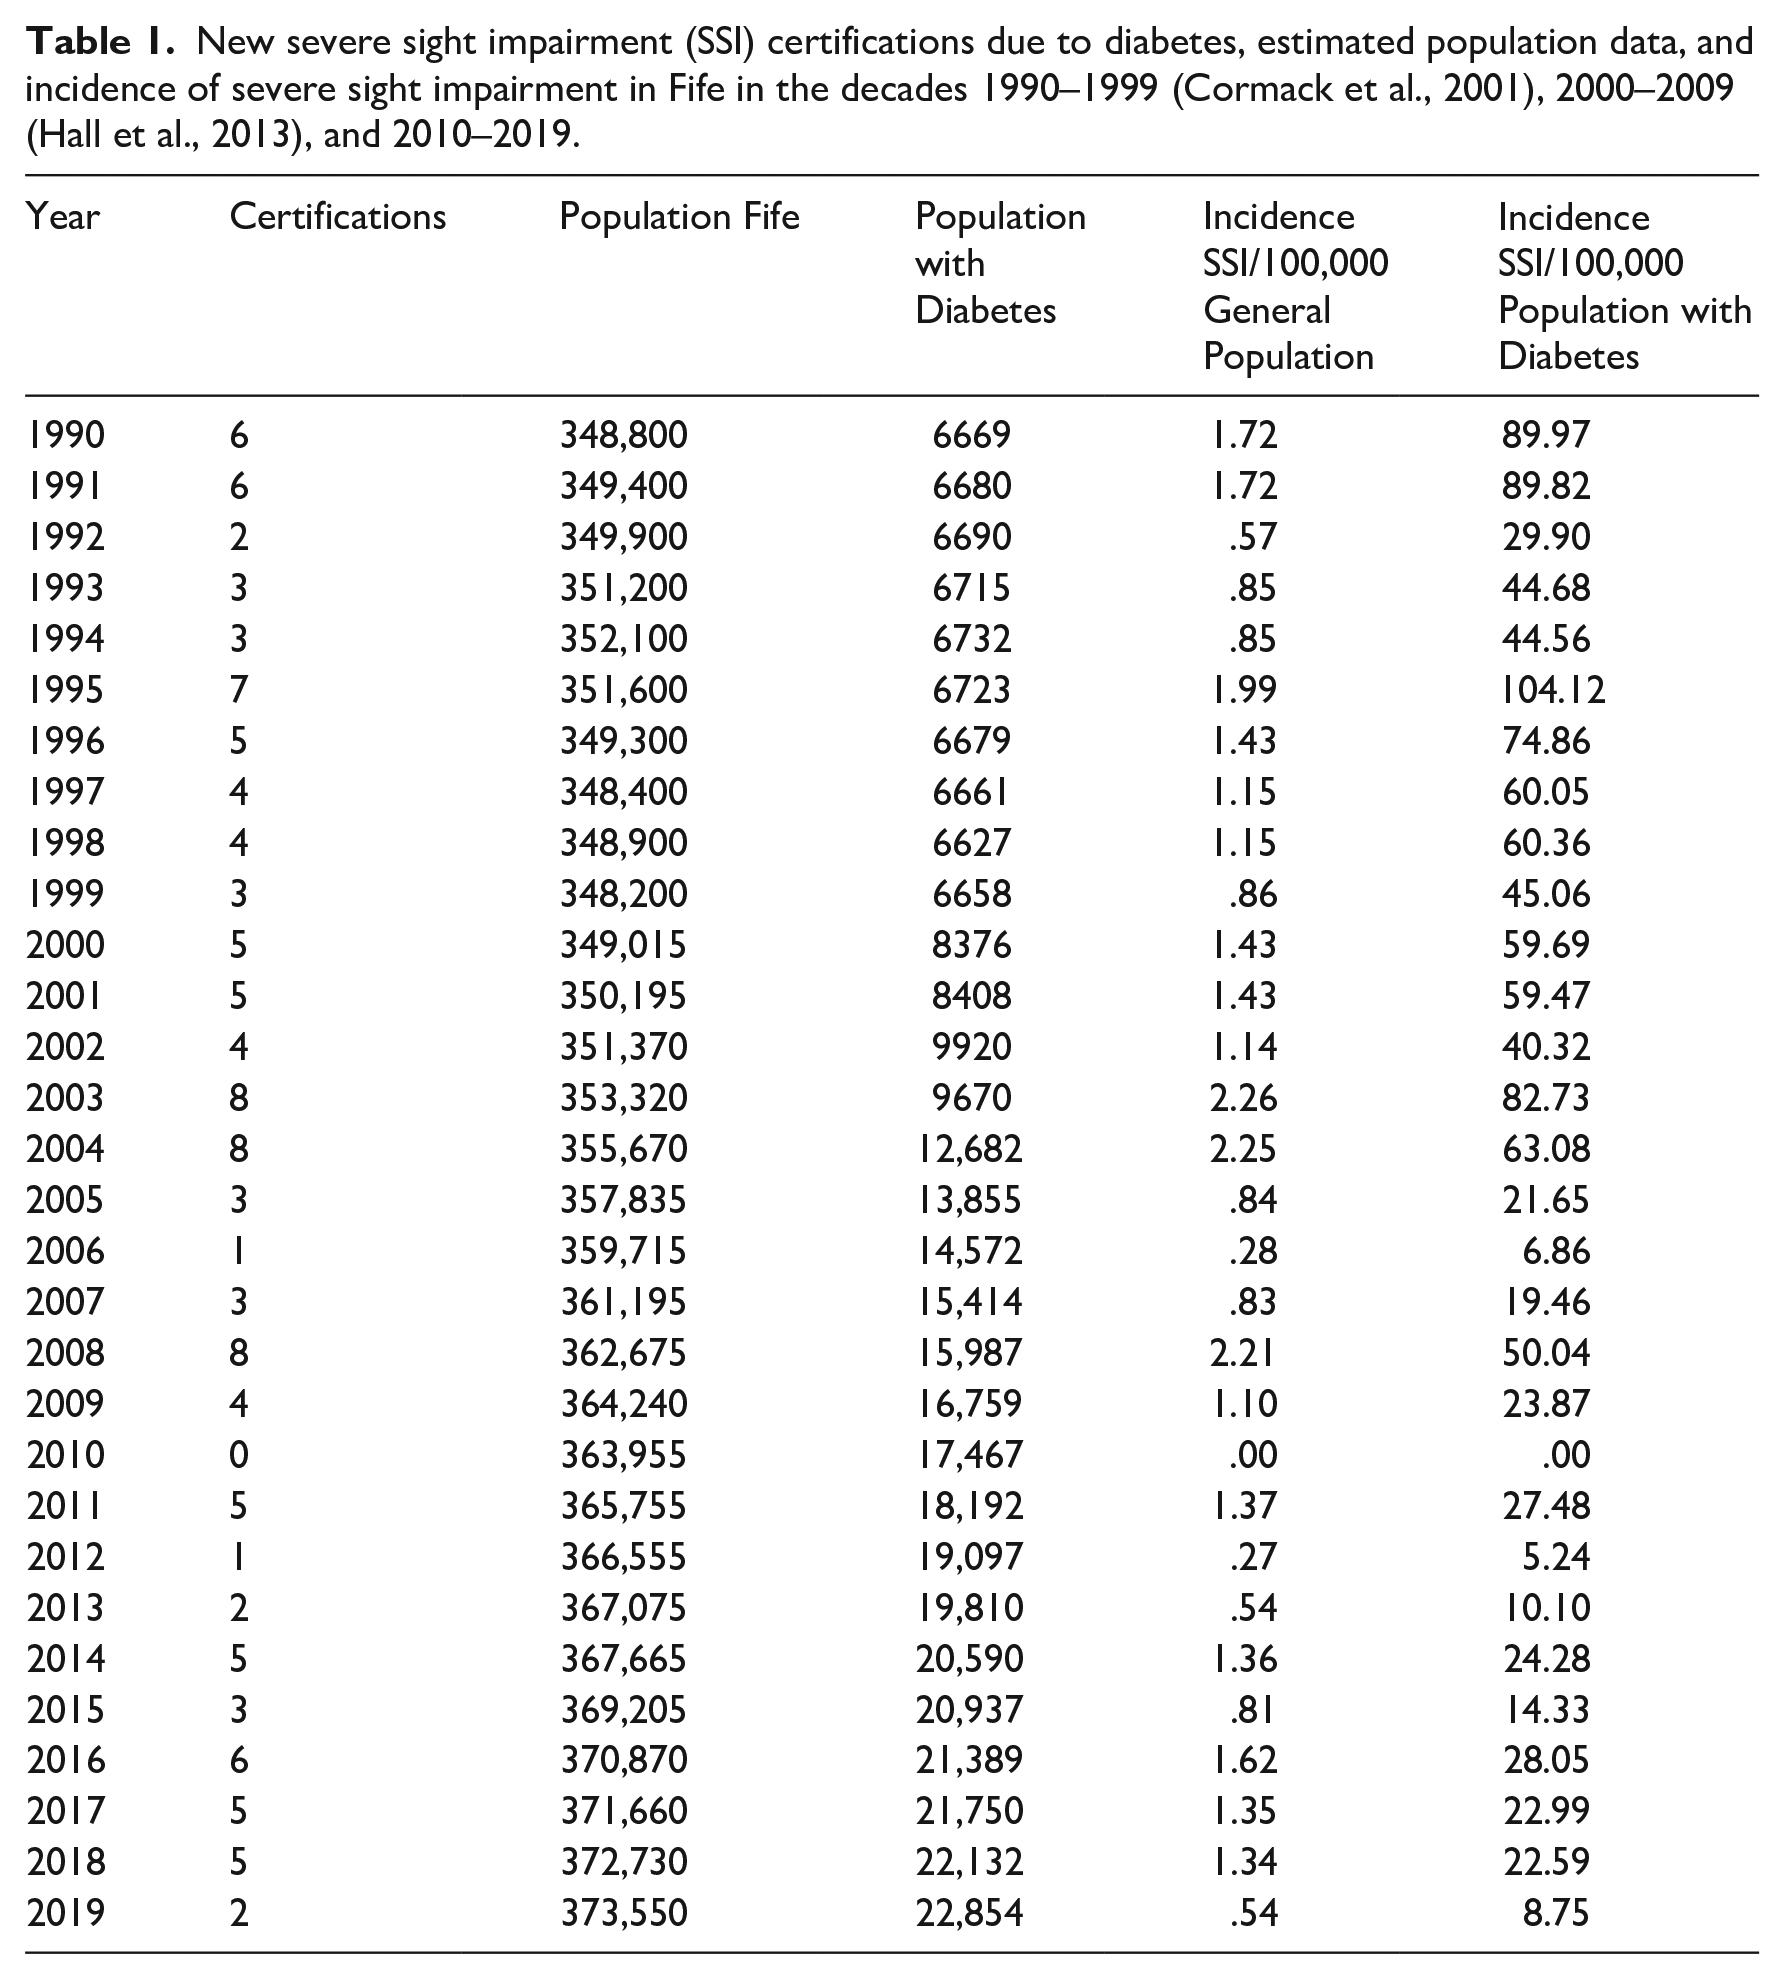
The number of new SSI certifications per year, population data obtained and incidence of SSI due to diabetes among both the general population and the population with diabetes are shown in Table 1. Over the three decades, the absolute number of SSI certifications due to diabetes per year averaged 4.2 (SD 2.1) and was not significantly related to the year in a Poisson regression (p = .376).
New severe sight impairment (SSI) certifications due to diabetes, estimated population data, and incidence of severe sight impairment in Fife in the decades 1990–1999 (Cormack et al., 2001), 2000–2009 (Hall et al., 2013), and 2010–2019.
The average incidence of SSI due to diabetes between 2010 and 2019 was 16.4 per 100,000 for the population with diabetes, per year (SD 10.0; 95% CI [9.2, 23.5]) and was significantly lower than in the previous decades (p < .001, Kruskal–Wallis test, Figure 3). Figure 4 further outlines the trends in the annual incidence of SSI in the population with diabetes over the past three decades.
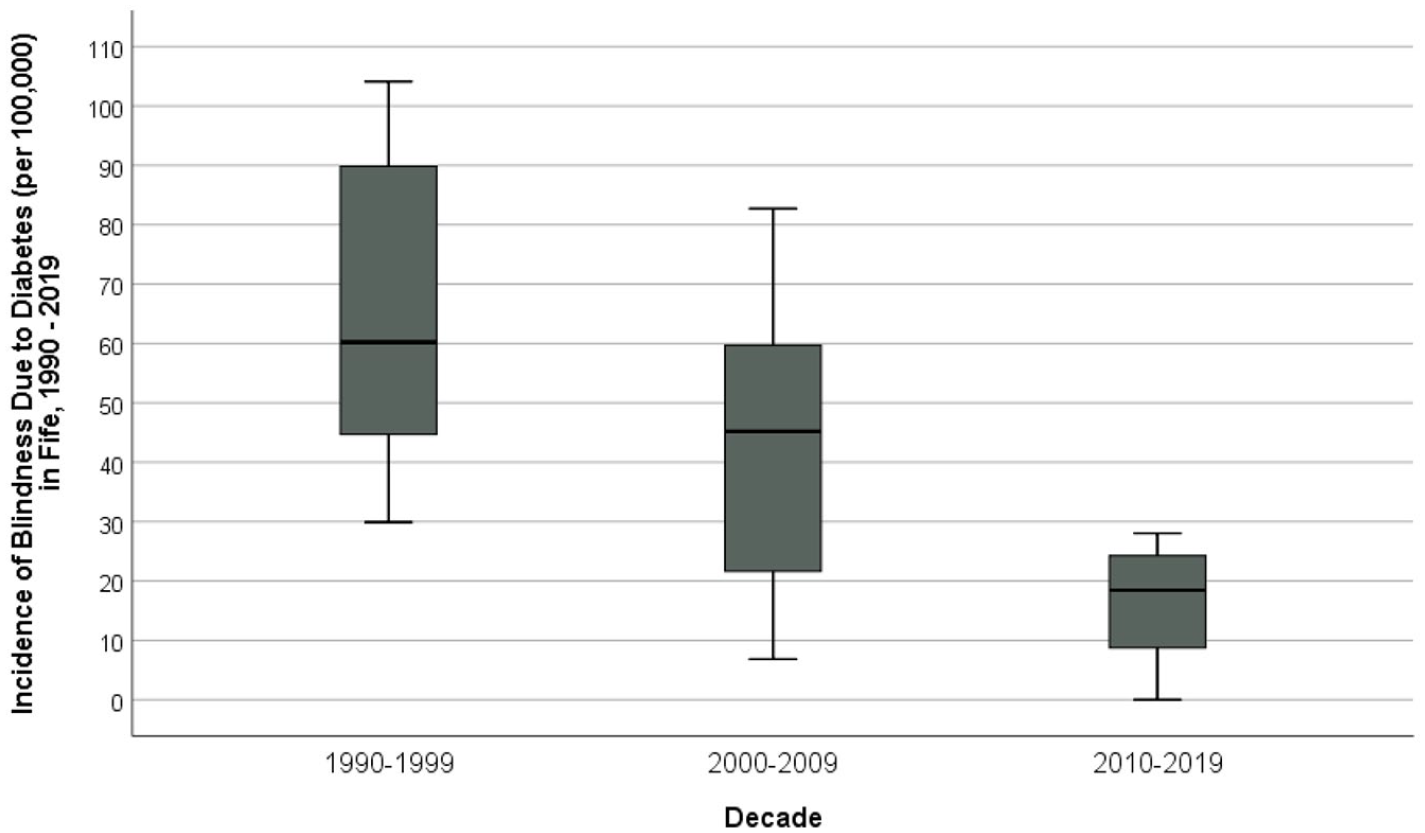
Incidence of blindness (severe sight impairment) per 100,000 due to diabetes in the population with diabetes, Fife, 1990–2019. Data for 1990–1999 from Cormack et al. (2001) and that for 2000–2009 from Hall et al. (2013) (p < .001, Kruskal–Wallis test).
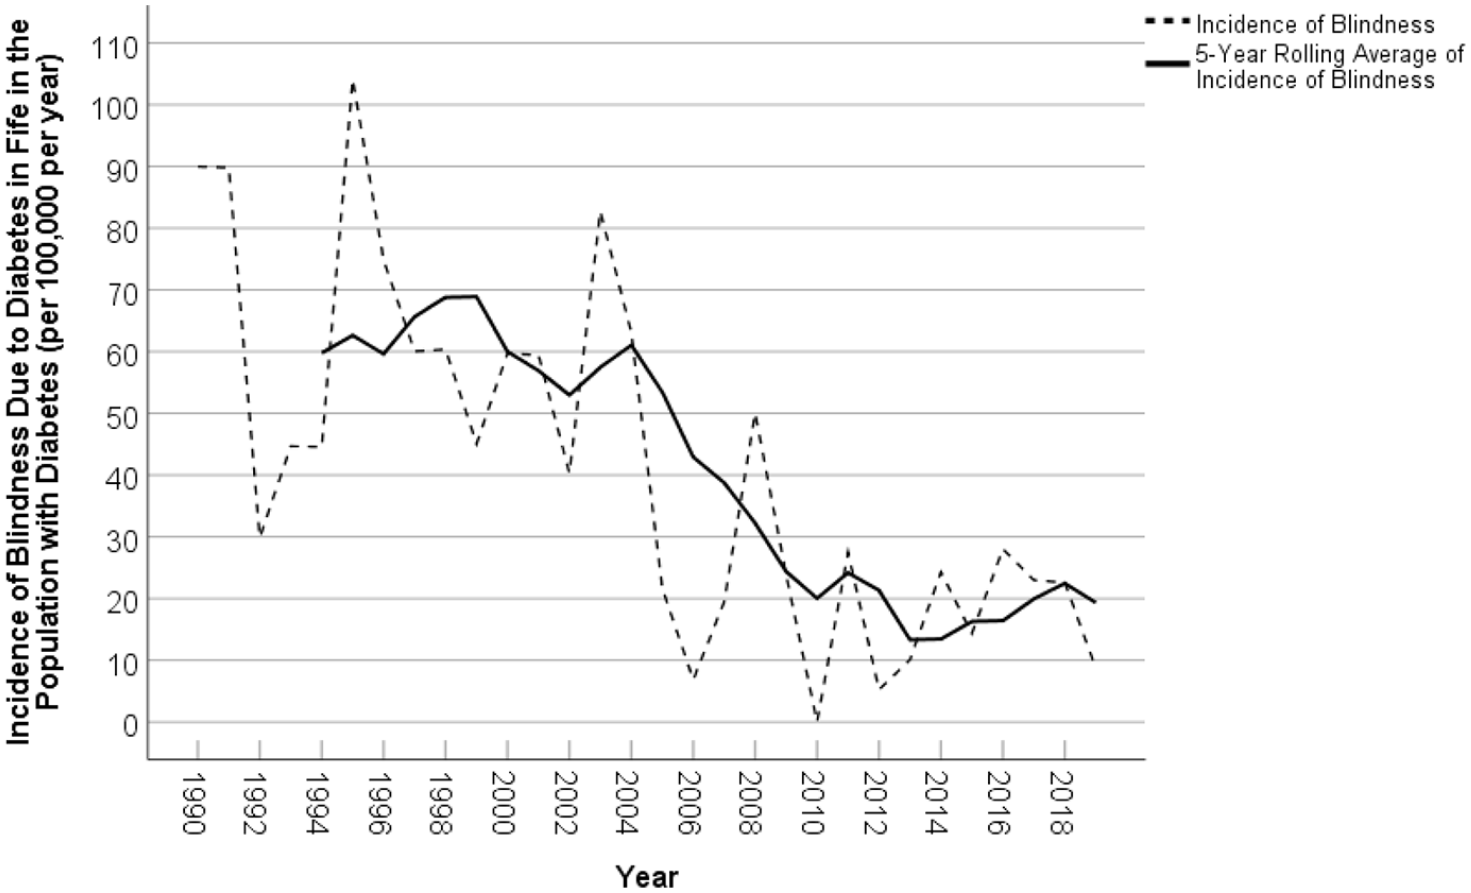
Annual incidence of blindness (severe sight impairment) per 100,000 due to diabetes in the population with diabetes, Fife, 1990–2019 and the 5-year rolling average. Data for 1990–1999 from Cormack et al. (2001) and that for 2000–2009 from Hall et al. (2013).
The mean and median annual incidence of SSI due to diabetes, 1990–2006 was 57.5 and 59.7/100,000, respectively. The equivalent values for the period 2007–2019, after the introduction of the retinopathy screening programme, were 19.8 and 22.6/100,000, respectively (p < .001, Mann–Whitney U test). Although the incidence of SSI decreased in the years following the introduction of the screening programme, the average number of new registrations before and after 2006 did not differ significantly (mean 4.5 and 3.8 new cases per year, respectively, P = .33, t test). A control chart of the number of new registrations did not reveal any special cause variation (Figure 5).
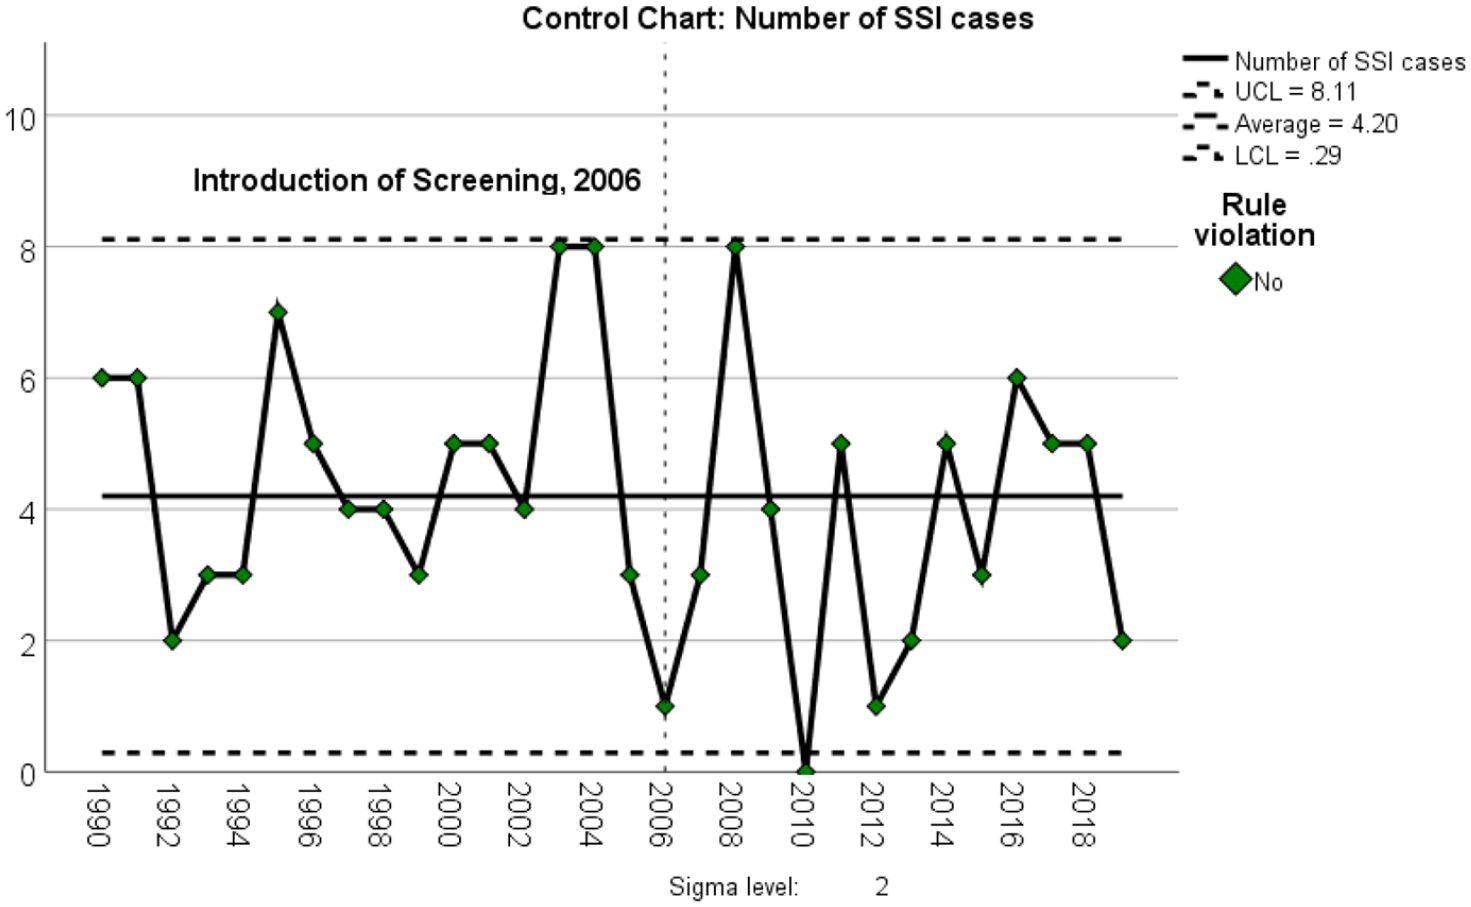
Control chart of the absolute number of new SSI registrations due to diabetes, 1990–2019, showing upper and lower 2-sigma limits.
Forty people certified SSI due to diabetes between 1990 and 2019 were alive on 31 December 2019. The point prevalence on 31 December 2019 was 10.7 per 100,000 for the general population and 175 per 100,000 for the population with diabetes, versus 7.7 and 167 on 31 December 2009 reported by Hall et al. (2013).
Referral rates for ‘referable diabetic eye disease’, as defined by the Scottish Diabetic Retinopathy Screening Collaborative (2020), to specialist eye clinics from the DRS programme in Fife were 6.1% in the first full year of implementation (2007–2008) and dropped to 4.0% and 2.8% in 2009–2010 and 2013–2014, respectively. Since then, the rate has stabilized below 3% with the most recent data in 2018 showing a 2.6% referral rate.
Discussion
This analysis presents the trend in the incidence of SSI due to diabetes in a defined region of Scotland over three decades and reports the incidence and prevalence of SSI due to diabetes after more than a decade of systematic diabetic retinopathy screening. To our knowledge, it is the first study evaluating SSI due to diabetes over such an extended period of time and the only study evaluating long-term trends in SSI in Scotland after the implementation of systematic retinopathy screening. The mean annual incidence of SSI due to diabetes, per 100,000 in the population with diabetes, declined from 64 in 1990–1999 (Cormack et al., 2001), to 42.7 in 2000–2009 (Hall et al., 2013), and to 16.4 in 2010–2019. There are very few reports of the accurate prevalence of SSI due to diabetes, as the date of death is not usually recorded on anonymized visual impairment databases. A strength of our study is that our electronic database does include the date of death of patients with SSI due to diabetes, allowing this information to be reported. The point prevalence of SSI per 100,000 at the end of each decade was 210 in 1999 (Cormack et al., 2001), 167 in 2009 (Hall et al., 2013), and 175 in 2019.
There are a number of potential reasons for this reduction, including the introduction of diabetic retinopathy screening, changes in diabetes care, the huge increase in the number of people with diabetes, due to lifestyle changes, as well as changes in diagnostic criteria for diabetes, increasing the denominator population (Figure 1) (Arora et al., 2012; WHO, 2011). In 2011, the World Health Organization included an HbA1c of >6.5% (48 mmol/mol) as a diagnostic criteria for diabetes (WHO, 2011), and between 2000 and 2009, there were changes in incentives for primary care physicians to diagnose diabetes as well as a reduction of the diagnostic threshold from 7.8 to 7.0 mmol/L fasting glucose (Hall et al., 2013). All these changes would have impacted the denominator populations that affect the estimates of incidence.
We believe it is unlikely that the significant reduction in the incidence of SSI is solely a reflection of the increase in the number of people with diabetes. The early detection and referral for treatment of sight-threatening diabetic eye disease at an early stage could explain a significant proportion of the observed reduction in SSI incidence, despite an increasing at-risk population of people with diabetes.
Other comparable countries have also demonstrated a reduction since introducing diabetic retinopathy screening. In Iceland, the introduction of systematic retinopathy screening as part of a wider public health approach coincided with a reduction in blindness from 2.4% of people with diabetes in 1980 to 0.5% in 2005 (Stefansson, 2006). In England and Wales, Rahman et al. (2020) found that certifications for diabetic eye disease have declined from 4 per 100,000 general population in 2010–2011 to 3 per 100,000 in 2017–2018. Thomas et al. (2017) evaluated visual impairment due to diabetes in Wales between 2007 and 2015 and noted that SSI certification declined from 31.3 to 15.8 per 100,000 with diabetes, with an overall increase in diabetes prevalence during this time. Systematic retinopathy screening was fully established in Wales in 2006 and the authors suggest this, and subsequent improvements in diabetes management contributed to the halving of new certifications in Wales. Our estimates of incidence are comparable over the same period (Figure 4).
In contrast, Arora et al. (2012) found the incidence of any visual impairment due to diabetes in Leeds, United Kingdom, before and for 3 years after the implementation of screening to be similar, suggesting that other influences including improved treatment of risk factors, such as blood pressure and blood sugar control are also important. We believe that our study, as well as the report from Wales (Thomas et al., 2017), suggests that the full impact of a screening programme on visual impairment incidence takes more than 3 years to have an effect.
Lin et al. (2017) reported a low incidence of SSI due to diabetes of 21 per 100,000 in the population with diabetes in North and East Devon, England in 2010–2013, ascribing this to a focus on prevention and treatment of diabetic eye disease and the impact of a long-term screening programme, introduced in 1992. In their study, the mean duration of diabetes at SSI certification was 22 years, indicating that the full effect of the current rise in the prevalence of diabetes on SSI may only become apparent in the coming decades. Our 30-year figures suggest that this may not be occurring to the extent expected based on rising prevalence.
Systematic diabetic eye disease screening in Scotland commenced in 2006 (Scottish Diabetic Retinopathy Screening Collaborative, 2020). The uptake of DRS in its first year (2006) in Scotland was only 70.8% rising to 85.1% in 2010. Since then, it has remained above 85% (Scottish Diabetes Group, 2020). Referral rates from screening to secondary care were highest in the year after commencement of screening (6.1%), then stabilizing at around 3%, similar to previously published data (Looker et al., 2014). The early detection and referral for treatment of sight-threatening diabetic eye disease at an early stage could explain a significant proportion of the observed reduction in SSI incidence, despite an increasing at-risk population of people with diabetes. Furthermore, the reduction in referral rates also suggests the severity of previously undiagnosed diabetic eye disease in the community has reduced.
Overall, these trends have also been noted in long-term data from other European countries. Laatikainen et al., 2016, reported a reducing incidence of visual impairment registration due to diabetes in Finland between 1982 and 2010, alongside an increasing median age at registration over time indicating that in the context of improving incidence in a screened population, patients also appear to develop visual impairment later (Laatikainen et al., 2016). In keeping with this, the mean age at registration, 66, in the current study was higher than the mean age of 61 reported for the previous decade (Hall et al., 2013). In Southern Germany, a significantly reduced incidence of all-cause blindness between the 1990s and the period 2008–2012 was noted, which was much more pronounced in the population with diabetes than the general population (Claessen et al., 2018). Diabetes as a specific cause of blindness was not reported. In the Republic of Ireland, the incidence of blindness due to diabetes in the decade 2004–2013 was reported to range from 14.9 to 54.4 per 100,000 with diabetes, with mean of 33 per 100,000 (Tracey et al., 2016). No clear trend was noted over time. In general, direct comparisons to other studies are limited by differing approaches to population estimation and standards of certification across different countries.
There has also been a step-change in the management of diabetic eye disease over the last decade, in particular the treatment of sight-threatening maculopathy, with the availability of intravitreal anti-vascular endothelial growth factor (VEGF) injections. This treatment is more successful than laser at preventing vision loss (Harding et al., 2019). However, severe sight impairment due to diabetic maculopathy (Lee et al., 2015) is much less common than retinopathy, and between 2010 and 2019, only 3 of 34 patients were registered for SSI in Fife for this reason. It is therefore likely that this improvement in treatment has had less of an impact on SSI incidence than screening.
Our data are derived from a relatively small population of around 370,000. A strength of our data is our national diabetes register, the Scottish Care Information – Diabetes (SCI-Diabetes), which is routinely used to record clinical data electronically for everyone with diabetes in Scotland and covers around 99% of those diagnosed with diabetes and is recognized as a very accurate representation of the population with diabetes (Scottish Diabetes Group, 2020).
Our SSI data were obtained from a comprehensive electronic database. The cause of SSI was missing for only 8 cases (1.7% of 475 records). SSI certification is a voluntary process and can be refused and therefore may underrecord the true number of patients each year developing SSI in the population. An Eye Clinic Liaison Officer (ECLO) has been in place in Fife since 2014 to support people with visual impairment. The presence of an ECLO in clinics can improve the process of certification and registration and influence appropriate SSI certification alongside subsequent access to support and service provision (Boyce et al., 2014). We, therefore, do not believe that refusal of SSI certification is more likely in the most recent reported decade, compared to the preceding decades.
Due to the relatively small population size, a small number of registrations could impact the point estimates in a given year. However, the use of rolling averages and comparison of averages for the pre- and post-2006 periods reduces the impact of annual fluctuations on the observed reduction in SSI incidence. Observed SSI certifications ranged from 0 to 8 per year. No registrations were noted in 2010. There was no change in health care delivery, recording of SSI, or screening set up in that year, so this observation is most likely due to statistical chance. Furthermore, the absolute number of new certifications per year between 1990 and 2019 was not significantly related to year (p = .376) and was stable at around 4 per year. This was despite an increase of over 300% in the population at risk over the same period, due to the increasing prevalence of diabetes in the community. Although the estimates of the prevalence of diabetes will include only those currently diagnosed with the condition, it is extremely unlikely that anyone with undiagnosed diabetes would develop SSI without presenting to our health care system.
The Scottish population estimates, based on the National Records of Scotland databases, may have an inherent uncertainty that could have biased the results observed. However, the same methodology was used throughout the study period and the National Records of Scotland use a standard demographic method (taking into account a wide variety of factors such as, death, birth and migration statistics, and census data), which is widely accepted and used by other official bodies such as the Office for National Statistics, United Kingdom (National Records of Scotland, 2020).
Liew et al. (2014) analysed blindness certifications in England and Wales between 2009 and 2010, finding for the first time that diabetic retinopathy was no longer the leading cause of SSI in the working age group, with inherited retinal disorders responsible for 20.2% of SSI certifications, compared to 14.4% and 14.0% for diabetic eye disease and optic atrophy, respectively. It is thought that the increased number of certifications for inherited eye disease may reflect improved awareness, certification, and diagnosis rather than a true increase in the incidence of these disorders in this age group (Liew et al., 2014) which may now have stabilized. We found that diabetes, optic atrophy, and inherited retinal dystrophies were joint leading causes of SSI in those aged 16 to 64, each accounting for 17.3% of certified cases.
Socioeconomic deprivation is known to be a major risk factor for non-attendance to retinopathy screening (Kashim et al., 2018) and despite good uptake of screening in our study, those most at risk of visual loss may be over-represented in the group of patients not attending screening. Specific efforts to identify barriers to screening will need to be made to further reduce the incidence of SSI due to diabetes in the future.
In conclusion, the incidence of SSI in Fife secondary to diabetic eye disease has significantly decreased in the period following the introduction of systematic diabetic retinopathy screening in 2006. We believe that the figures from Fife over the last three decades are representative of SSI due to diabetes in Scotland and may be considered the first evidence of the impact of the diabetic retinopathy screening programme in Scotland on reducing SSI. Despite this falling incidence of SSI, diabetic eye disease remains a leading cause of SSI, especially in working-age adults, even with comprehensive long-term retinopathy screening. This contrasts with recent findings from other parts of the United Kingdom. A multi-disciplinary approach addressing patients’ avoidable risk factors, identifying those most at risk of sight loss and improving screening uptake by reducing barriers to screening, especially in hard-to-reach groups, is required to maintain the reductions in SSI certification rates, in the context of steadily rising prevalence of diabetes.
Footnotes
Acknowledgements
Declaration of conflicting interests
The author(s) declared no potential conflicts of interest with respect to the research, authorship, and/or publication of this article.
Funding
The author(s) received no financial support for the research, authorship, and/or publication of this article.