
Abstract
Tactile sensitivity is known to decline with age. Braille provides a vital method of reading and writing for working-age and older adults with acquired visual impairment. The proliferation of low-cost braille displays raises new possibilities for adult braille learners, with dots of greater height than standard paper braille, potentially benefitting older adults with reduced tactile sensitivity. This study explored the influence of reading medium (paper vs braille display) on the accuracy and speed of six working-age and older adult braille learners and examined differences when transitioning from one reading medium to another. Findings indicate that (1) learning letters on a braille display resulted in better speed and accuracy (time: M = 44.2, SD = 37.3, accuracy: M = 83%, SD = 24.8%) than on paper (time: M = 54.3, SD = 40.4, accuracy: M = 80.6%, SD = 28.1%); (2) transitioning from one medium to another generally resulted in the same or better performance (reading times decreased by 11.2% and accuracy improved by 2.4%); and (3) the advantage of the braille display appears to be greatest when reading letters in combination (reading times decreased by 26.8% and accuracy improved by 6.5% for letter-pairs vs a 1.9% reduction in speed and a 2% improvement in accuracy for single letters). The benefit of the braille display condition was most pronounced for participants with reduced tactile sensitivity. Although preliminary, these findings suggest that the use of braille displays in early braille instruction may decrease frustration for those with reduced tactile sensitivity and should not adversely affect the ability for learners to transition to standard paper braille, assuming that both formats are introduced and reinforced throughout training.
Keywords
Introduction
Tactile acuity, like visual acuity, is known to decline as part of the typical ageing process (Stevens et al., 1996). Braille is a tactile reading and writing system that provides persons with visual impairments (i.e., those who are blind or who have low vision) with a method for accessing information needed for both functional tasks and more extensive reading demands (Abbott & Connors, 2020). Despite these benefits, little research has been devoted to supporting individuals who learn braille later in life. The recent proliferation of low-cost braille displays (Nadeem et al., 2016) raises new questions for the adult braille rehabilitation context. Such devices, which have traditionally been costly, provide greater access to relevant reading materials that increase motivation for adult braille learners (Martiniello et al., 2020) and incorporate braille characters of greater dot height and density that may benefit those with reduced tactile sensitivity (Wormsley & D’Andrea, 1997). This study explored the influence of reading medium (paper vs electronic braille display) on the accuracy and speed of working-age and older adult braille learners and examined differences in accuracy and speed when transitioning from one reading medium to another.
Tactile sensitivity is a vital component of efficient braille reading. For blind children, an emphasis is placed on developing adequate tactile skills and haptic exploration techniques long before formal braille literacy instruction begins (Wormsley & D’Andrea, 1997). Ample evidence demonstrates that tactile acuity improves with exposure and practice, as indicated by the fact that early learners of braille often maintain higher levels of tactile sensitivity as they age, when compared to sighted controls who lack a similar lifetime of tactile experience (Legge et al., 2008). In a study exploring correlates of braille reading performance among working-age and older adults, frequency of braille usage emerged as a significant predictor of braille reading outcomes, regardless of the age braille is learned (Martiniello & Wittich, 2020). For these reasons, braille learners require ample opportunities to develop tactile sensitivity through the realistic use of braille within daily life (Martiniello et al., 2020; Wong et al., 2013). The importance of developing tactile skills is especially vital for older adults, who experience age-related declines in tactile sensitivity (Legge et al., 2008). Among the sighted, tactile acuity thresholds have been shown to decline at a rate of approximately 1% per year (Bola et al., 2016; Legge et al., 2008; Olson et al., 1975).
In addition to the importance of tactile experience, several studies have also investigated the influence of adjusting the presentation of braille characters to explore whether such modifications improve learning outcomes for older adults. Current research on the manipulation of braille for persons with reduced tactile sensitivity focuses on the influence of adjusting dot height or size. In a series of studies that investigated the legibility of braille labels on pharmaceutical packages, Douglas et al. (2009) compared readability using six different braille dot heights. The authors found that a mean dot height of 0.18 mm was not significantly more difficult to read than standard braille, which typically ranges from 0.46 to 0.60 mm (Douglas et al., 2009; Gardner, 2005; Tiresias, 2009); however, participants above the age of 60 achieved only 83% accuracy at this reduced dot height. Although tactile acuity was not measured, the authors noted that the lower performance of participants above the age of 60 was consistent with the reduced tactile sensitivity expected among older adults (Stevens, 1992). While these results provide evidence that older adults may achieve greater reading accuracy with increased dot height, the dot heights examined in this study were lower than that of standard braille. These findings are therefore not directly transferable to braille instruction, given that these heights are not reflective of what braille readers will encounter in everyday use. Moreover, the participants in this study were experienced braille users, and it is possible that variations in dot height may have more of an influence on older learners of braille with reduced tactile sensitivity.
Several authors have also considered the influence of braille cell size and the use of enlarged or ‘jumbo’ braille (Pester, 1994; Tobin et al., 1986). Barlow-Brown et al. (2019) noted that while young print-reading children traditionally learn to read using larger type before transitioning to standard print size, the potential benefits of this approach have received little attention within braille instruction. In a study of very young, sighted prereading children (N = 67, age M = 47.8 months), the authors observed that participants who initially learned braille patterns tactually using an oversized braille cell were, after training, able to accurately read standard-sized braille significantly better than those who learned using standard braille from the start. The authors hypothesized that beginning with enlarged braille enables learners to focus first on the overall shape of braille characters prior to adding the additional complexity of developing the tactile perception needed for standard braille. While there is evidence that manipulating the spacing between standard braille dots (jumbo braille) may improve outcomes for learners with diabetic neuropathy (Bernbaum et al., 1989; Harley et al., 1985), practitioners highlight that the decision to teach jumbo braille should be made with caution, given that most materials are not produced in this format. Millar (1987) observed that learners may not always be able to transfer knowledge of braille spatial patterns across different sizes of braille cells. Over-reliance on jumbo braille for older learners by default may decrease motivation for those who are reluctant to transition to standard braille, if that is the ultimate goal.
Although practice is vital for the development of tactile skills, adult braille learners report a lack of resources and opportunities to read braille during and after the learning process (Martiniello et al., 2020). Many practice materials are designed for younger children and may not be as relevant or motivating to older learners of braille (Wormsley & D’Andrea, 1997). Within this context, electronic braille displays have greatly increased access to information. These devices can be paired to computers and tablets and instantly transform information into braille through a series of pins that rise and fall to form braille characters (Wormsley & D’Andrea, 1997). The recent proliferation of low-cost braille devices provides additional options for adults and seniors who may not have had access to these tools before, due to restrictive funding regimes that prioritize students and those who are employed, where such programmes have existed at all (Martiniello & Wittich, 2018). Beyond greater access to information, the dot height of braille characters on electronic braille displays ranges between 0.63 and 0.80 mm, compared to a typical dot height of 0.46 mm (25%–43% lower) on standard paper braille (Tiresias, 2009). It is therefore worthwhile to examine whether the use of braille displays during initial braille instruction with working-age and older adults could facilitate the learning of braille symbols as a supplement to traditional paper-based methods. With this objective in mind, this study addresses the following research questions:
Are there differences in the speed and accuracy of participants who learn braille letters on paper compared to those who initially learn on an electronic braille display?
Does learning performance (accuracy and speed) change when transitioning from one reading medium (paper or braille display) to the other?
Are there observed differences in performance based on tactile acuity?
Methods
Using a case series approach (Vandenbroucke, 2001), the goal of this pilot study was to refine the protocol for a larger study and to describe initial observations, given the exploratory nature of this work. Due to the inherently smaller sample size, the objective of the case series method is to provide a description of cases, rather than to engage in statistical comparisons or to make generalizations among participants (Creswell, 2007). The present case series study was designed in accordance with established guidelines (Carey & Boden, 2003).
Ethical approval
This study was approved by the University of Montreal and the Centre for Interdisciplinary Research in Rehabilitation of Greater Montreal (CRIR #1431-0619).
Eligibility and recruitment
Participants who were at least 18 years of age, had no prior experience reading braille visually or tactually, and who were able to communicate orally and in writing in either English or French were eligible to participate. Both those with and without visual impairments could take part. Regardless of vision level, the reading materials were occluded with the use of a cardboard screen. All participants completed two separate sessions of 1.5 hr in length on two consecutive days, either at home or at an approved research site. Informed written or audio-recorded verbal consent was obtained in accordance with the Declaration of Helsinki and Public Health (World Medical Association, 2013).
Materials and procedure
Prior to testing, each participant completed a brief verbal demographic questionnaire to gather information about their age, visual diagnosis and age of onset (if applicable), additional diagnoses, and language ability. Participants who self-identified as having a visual impairment were asked to self-report as having a mild, moderate, severe, or profound visual impairment in accordance with the definitions outlined by the World Health Organization (1993). In addition, the Montreal Cognitive Assessment, as adapted for blind and visually impaired participants (MoCA-B) (Wittich et al., 2010), was administered to screen for participants at risk to have a mild cognitive impairment that could impact their learning or reading performance (Nasreddine, et al. 2005).
Finally, active tactile acuity threshold was measured using Legge’s ‘Dot’ tactile acuity chart. Developed as a measure of active (hand/finger moving) tactile acuity, Legge’s ‘Dot’ Tactile Acuity Chart (Legge et al., 2008) has been validated as a reliable measure of tactile acuity (Bruns et al., 2014) and has been applied to both North American and Japanese samples (Oshima et al., 2014). As shown in Figure 1, the chart contains lines of eight braille-like dot pattern characters (wherein one of four dots in a square pattern has been omitted), scaled upwards or downwards in uniform ±0.10 logMAR steps. logMAR, or the logarithm of the minimum angle of resolution, is an interval unit of measurement used on visual acuity charts commonly employed in prospective clinical research. On the logMAR scale, zero is interpreted as ‘normal’ vision; positive values indicate a degree of vision loss; and negative values indicate supra- ‘normal’ vision (see Hazel & Elliott, 2002; Rosser et al., 2001).
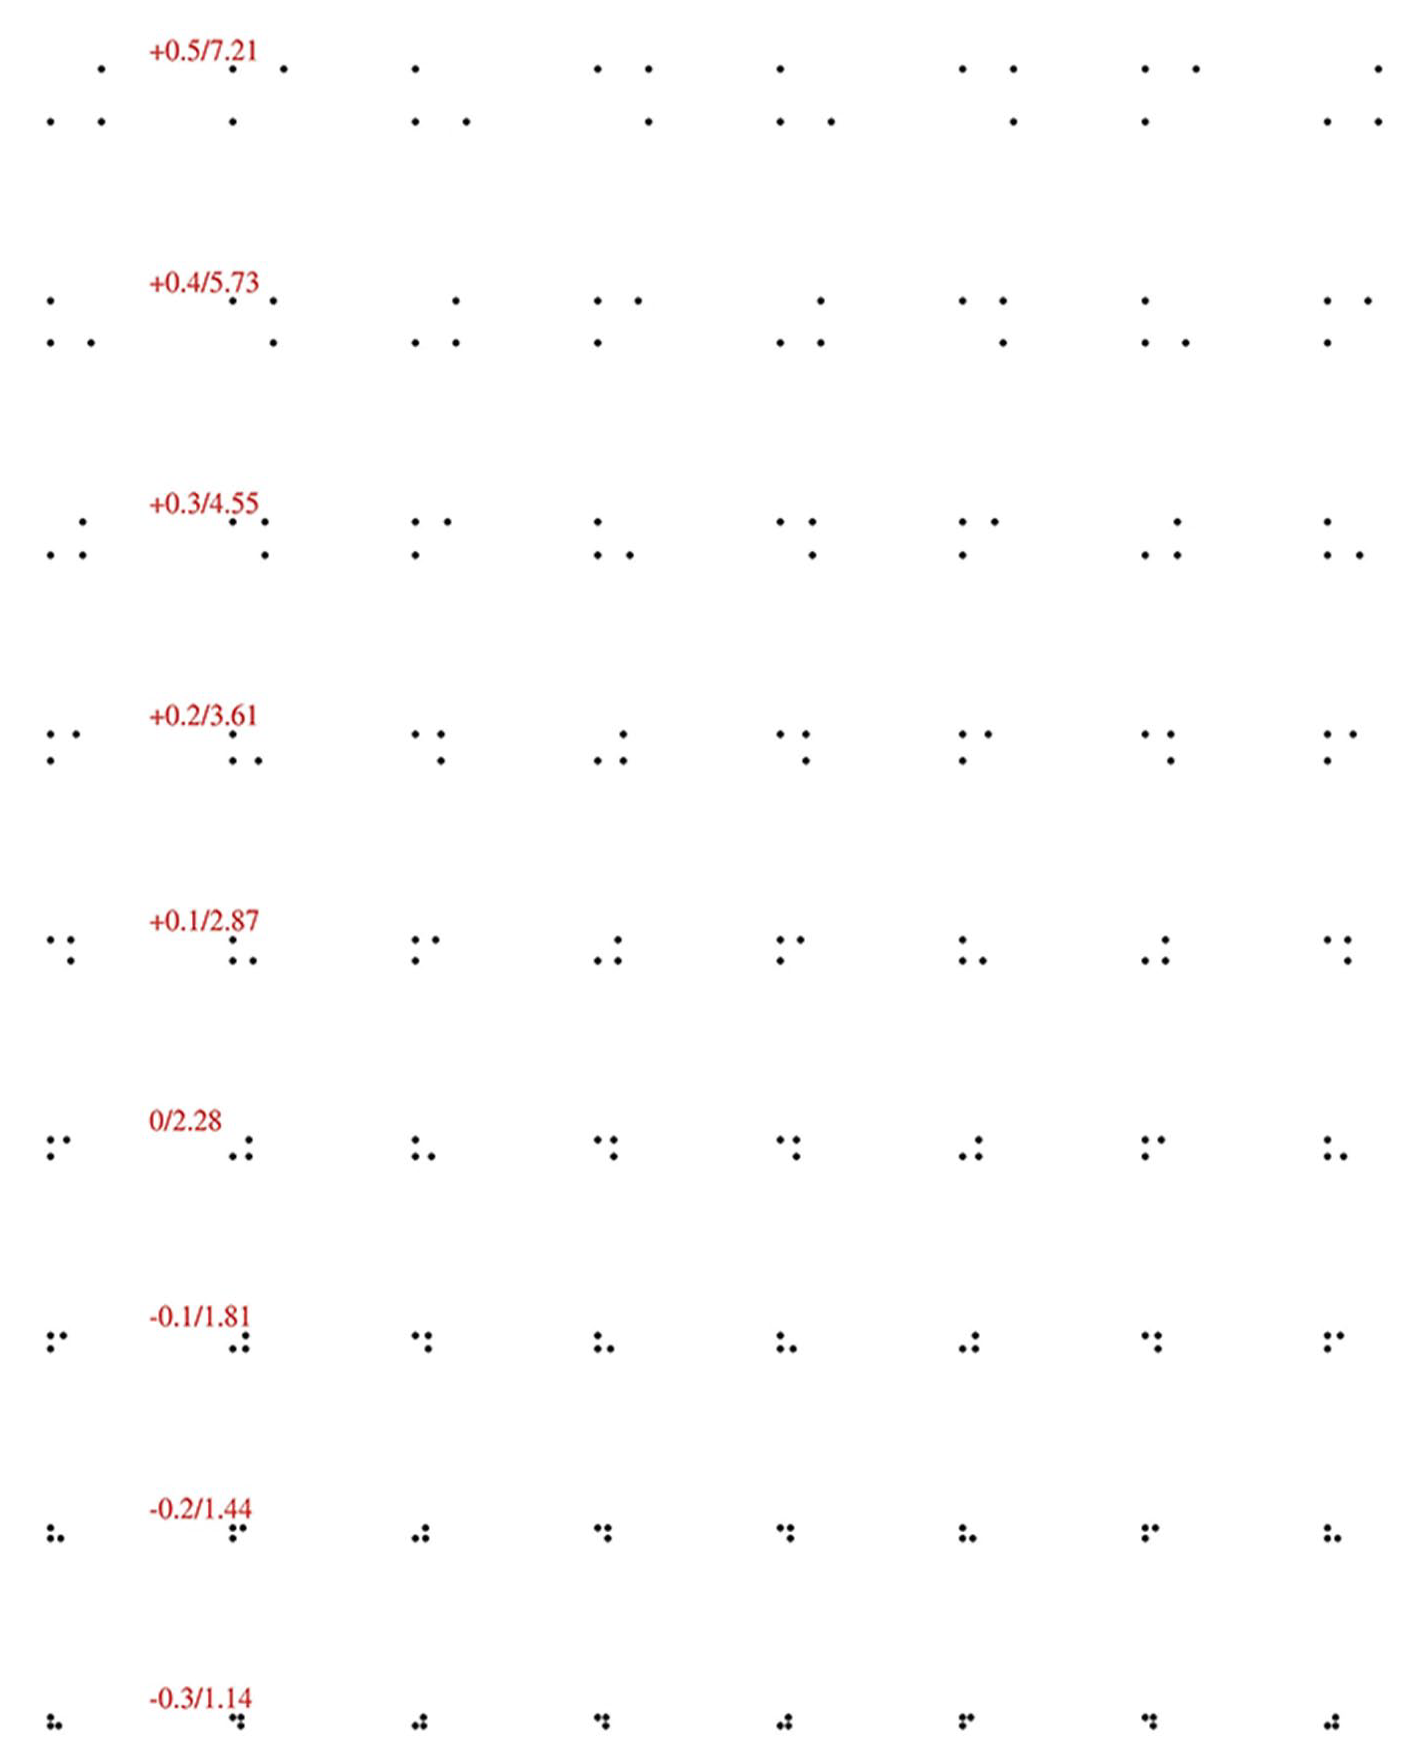
Image of the Legge ‘Dot’ tactile acuity chart. The zero logMAR/2.28 mm line, fourth from the bottom, represents ‘standard’ braille dot spacing.
Following the convention applied to visual acuity charts, the fourth line from the bottom is designated the zero logMAR line, and on this line, the centres of adjacent dots are spaced 2.28 mm apart – the same distance used in standard English braille. Participants read through all of the lines with the index finger of the dominant hand, starting at the top, and reported the location of the missing dot (top-left, top-right, bottom-left, bottom-right). This test was not timed since accuracy was more important than speed. A tactile acuity threshold (in logMAR units) was then calculated based on the number of correct lines and symbols within lines which are read and converted to millimetres as described by Oshima et al. (2014).
Experiment
Participants were randomly assigned to one of two groups (as shown in the flowchart in Figure 2). In the first training session, group A participants were introduced to letters A to D on paper, while group B was introduced to letters A to D on an electronic braille display. In the second training session, group A was introduced to letters E to H on a braille display, while group B was introduced to letters E to H on paper. In all cases, participants in both groups then switched to reading those same letters in the alternative reading medium (their ‘second format’), to evaluate whether there was any immediate change in their performance when transitioning from one format to the other. The letters and their composition within a braille cell are shown in Figure 3.
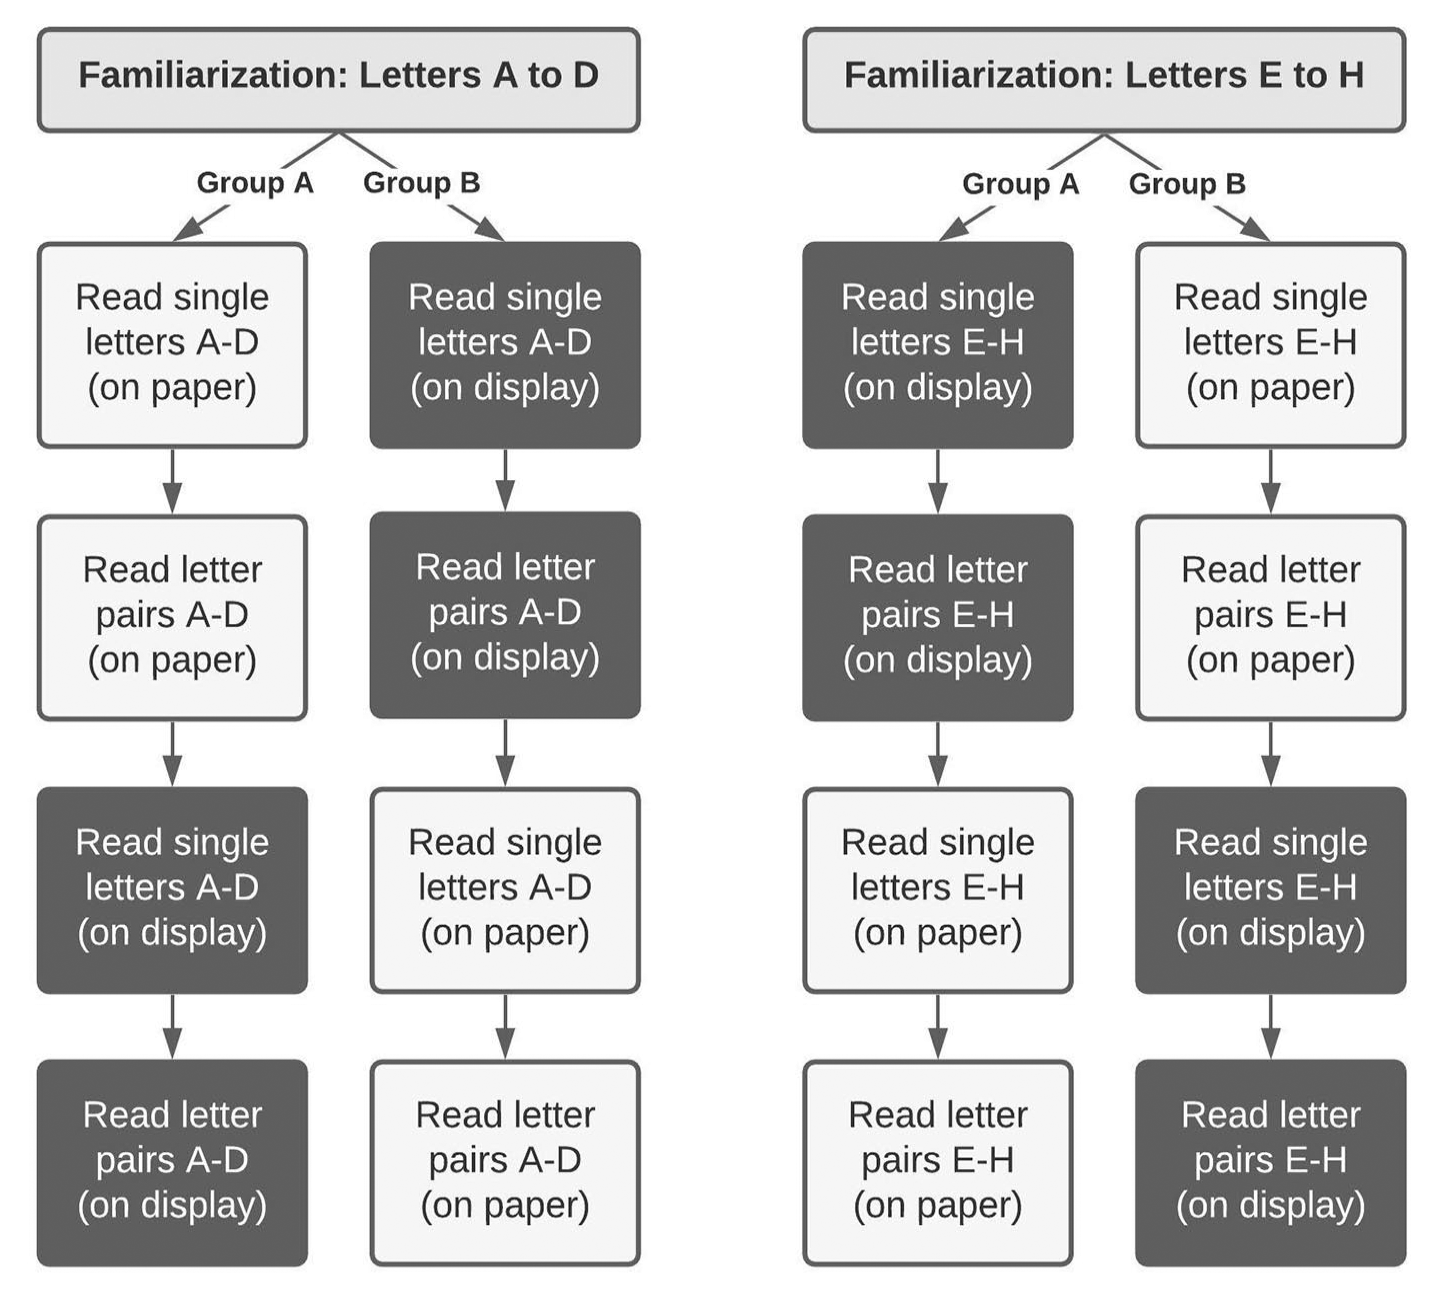
Flowchart depicting the sequence of reading tasks completed by Group A and Group B participants.
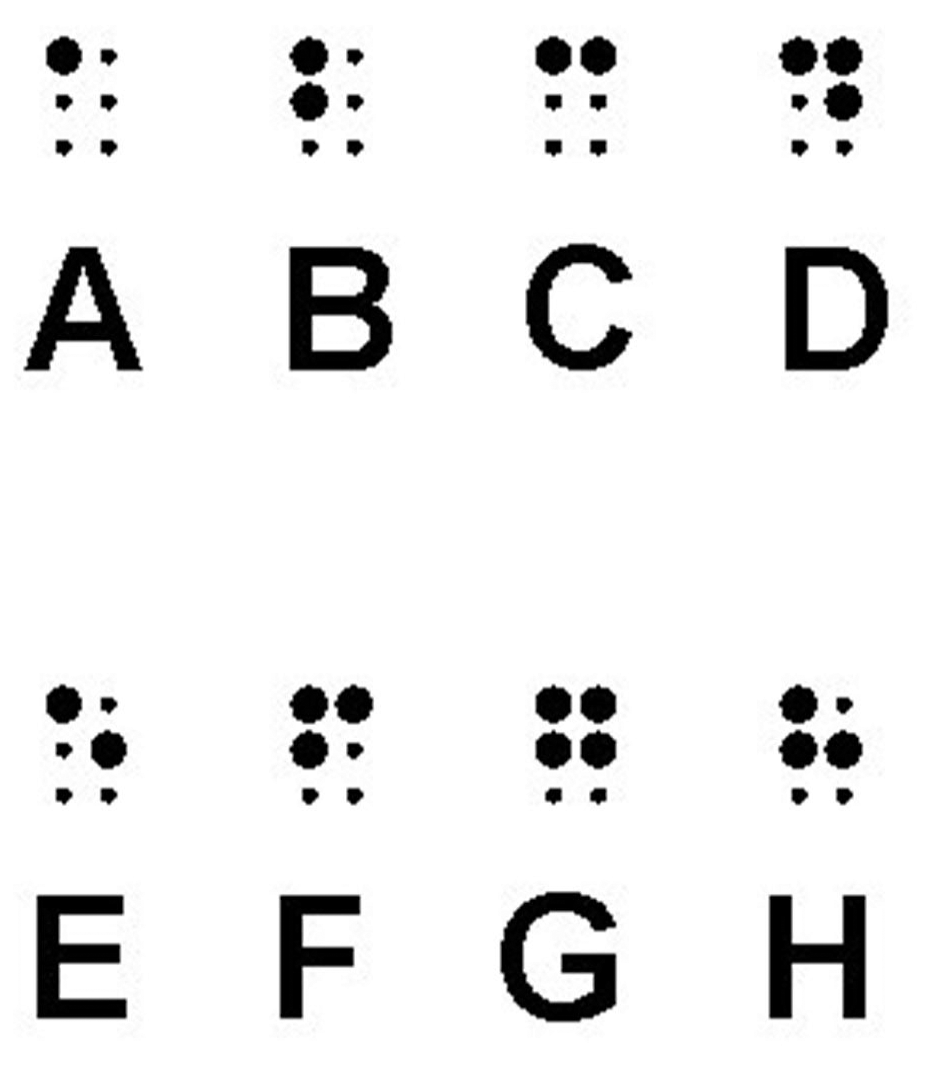
Image showing the composition of the eight braille letters (A-D, E-H) participants read in this study.
Each of the two training sessions consisted of two segments:
Familiarization. At the start of training session 1, participants spent approximately 10 min learning the basics of the 3 × 2 braille cell and the dot configuration for letters A to D. Given standard practice with adult clients (Abbott & Connors, 2020), participants felt the layout for each of the four braille characters (A to D) using a six-holed muffin tin and up to six large plastic balls. The composition of each of the letters A-D was demonstrated, and participants had an opportunity to re-create the letters from memory several times before beginning the reading exercise. This same familiarization activity was repeated at the start of training session 2 to introduce participants to letters E to H.
Reading letters. Participants then read each line of letters aloud in their first format (paper or display). There was no time limit, and no feedback was provided to participants as they read. The first five lines for each set of letters contained only single letters (e.g., ‘D A C B’); the next five lines contained pairs of letters (e.g., ‘AC BD DB BA’). The time taken to read the four letters or letter pairs (in seconds) and the number of correctly read letters or letter pairs were recorded for each line separately. A letter or letter pair was considered correct if it was read correctly or if the participant corrected an error before moving on. After completing the reading activities in the first format, the participant then completed the same reading activity in the second format (paper or display).
The reading materials consisted of five lines of four single letters (or letter pairs) each in pseudorandomized order, for each of the four reading conditions (A-D/E-H, single letter/letter pairs). The paper versions were produced manually on 3″ × 5″ standard index cards using a Perkins Braillewriter (Perkins Solutions, Watertown, MA, USA), with one line of letters per index card. Two spaces were left between each letter or letter pair. Fresh copies were provided to each participant to ensure that the quality of the paper format would be maintained. A BrailleNote Touch Plus 32 (Humanware Technologies, Drummondville, QC, Canada) notetaker was utilized for presenting the electronic braille. The ordering of the lines to be read was counterbalanced across participants to minimize fatigue and any learning effects.
Data analysis
Descriptive statistics have been used to summarize the data, with speed reported as the mean time to read a line of letters or letter-pairs (in seconds) and accuracy reported as the overall mean percentage of correctly read letters or letter-pairs. Analysis was performed using R (The R Foundation for Statistical Computing, Vienna, Austria, version 3.4.4). Following standard case series procedures (Carey & Boden, 2003), information for each participant is presented separately.
Results
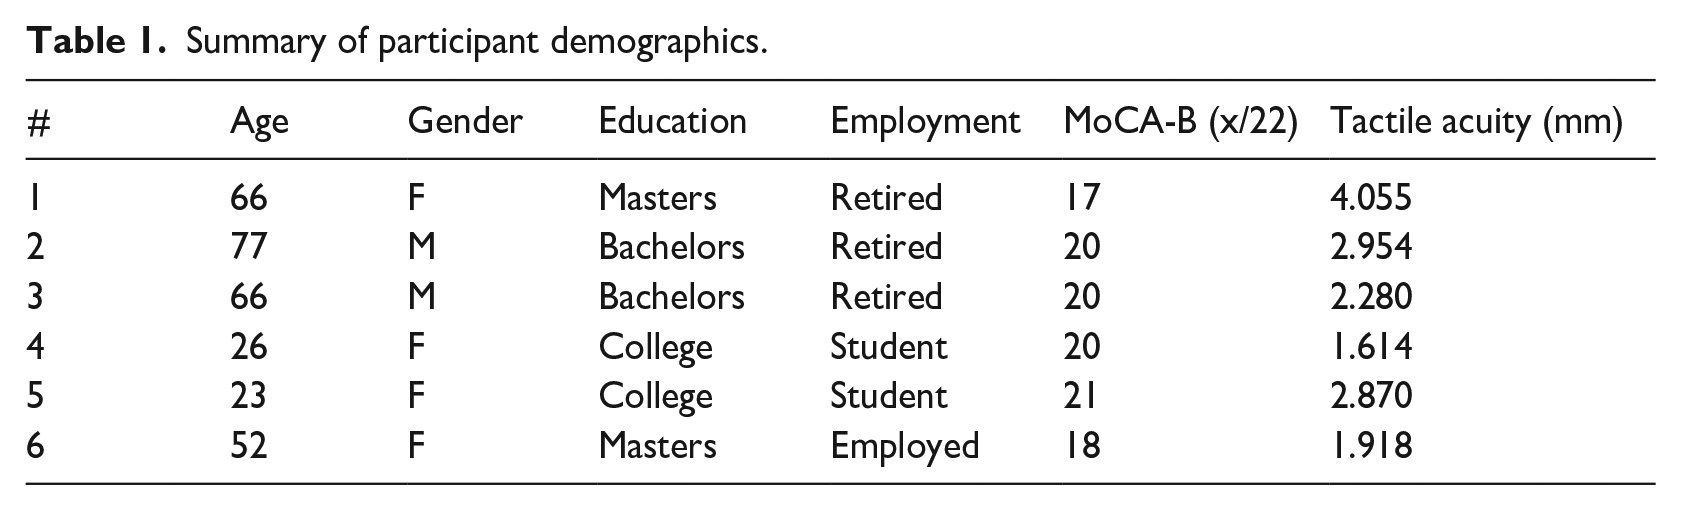
Table 1 summarizes the demographic characteristics of the six participants, including MoCA-B scores and tactile acuity thresholds. Of note, three of the six participants were above age 65, and each of them had a tactile acuity threshold at or above the 2.28 mm limit expected to be theoretically important for braille reading. The overall reading speed and accuracy for paper and braille display for each participant is illustrated in Figure 4. Table 2 outlines participants’ reading performance for each reading medium and letter combination. Table 3 provides a detailed account of the reading times and accuracy for each participant in each of the reading conditions, as well as the differential in performance observed when transitioning from paper to display or display to paper.
Summary of participant demographics.
Descriptive statistics of global reading performance measures for each participant.
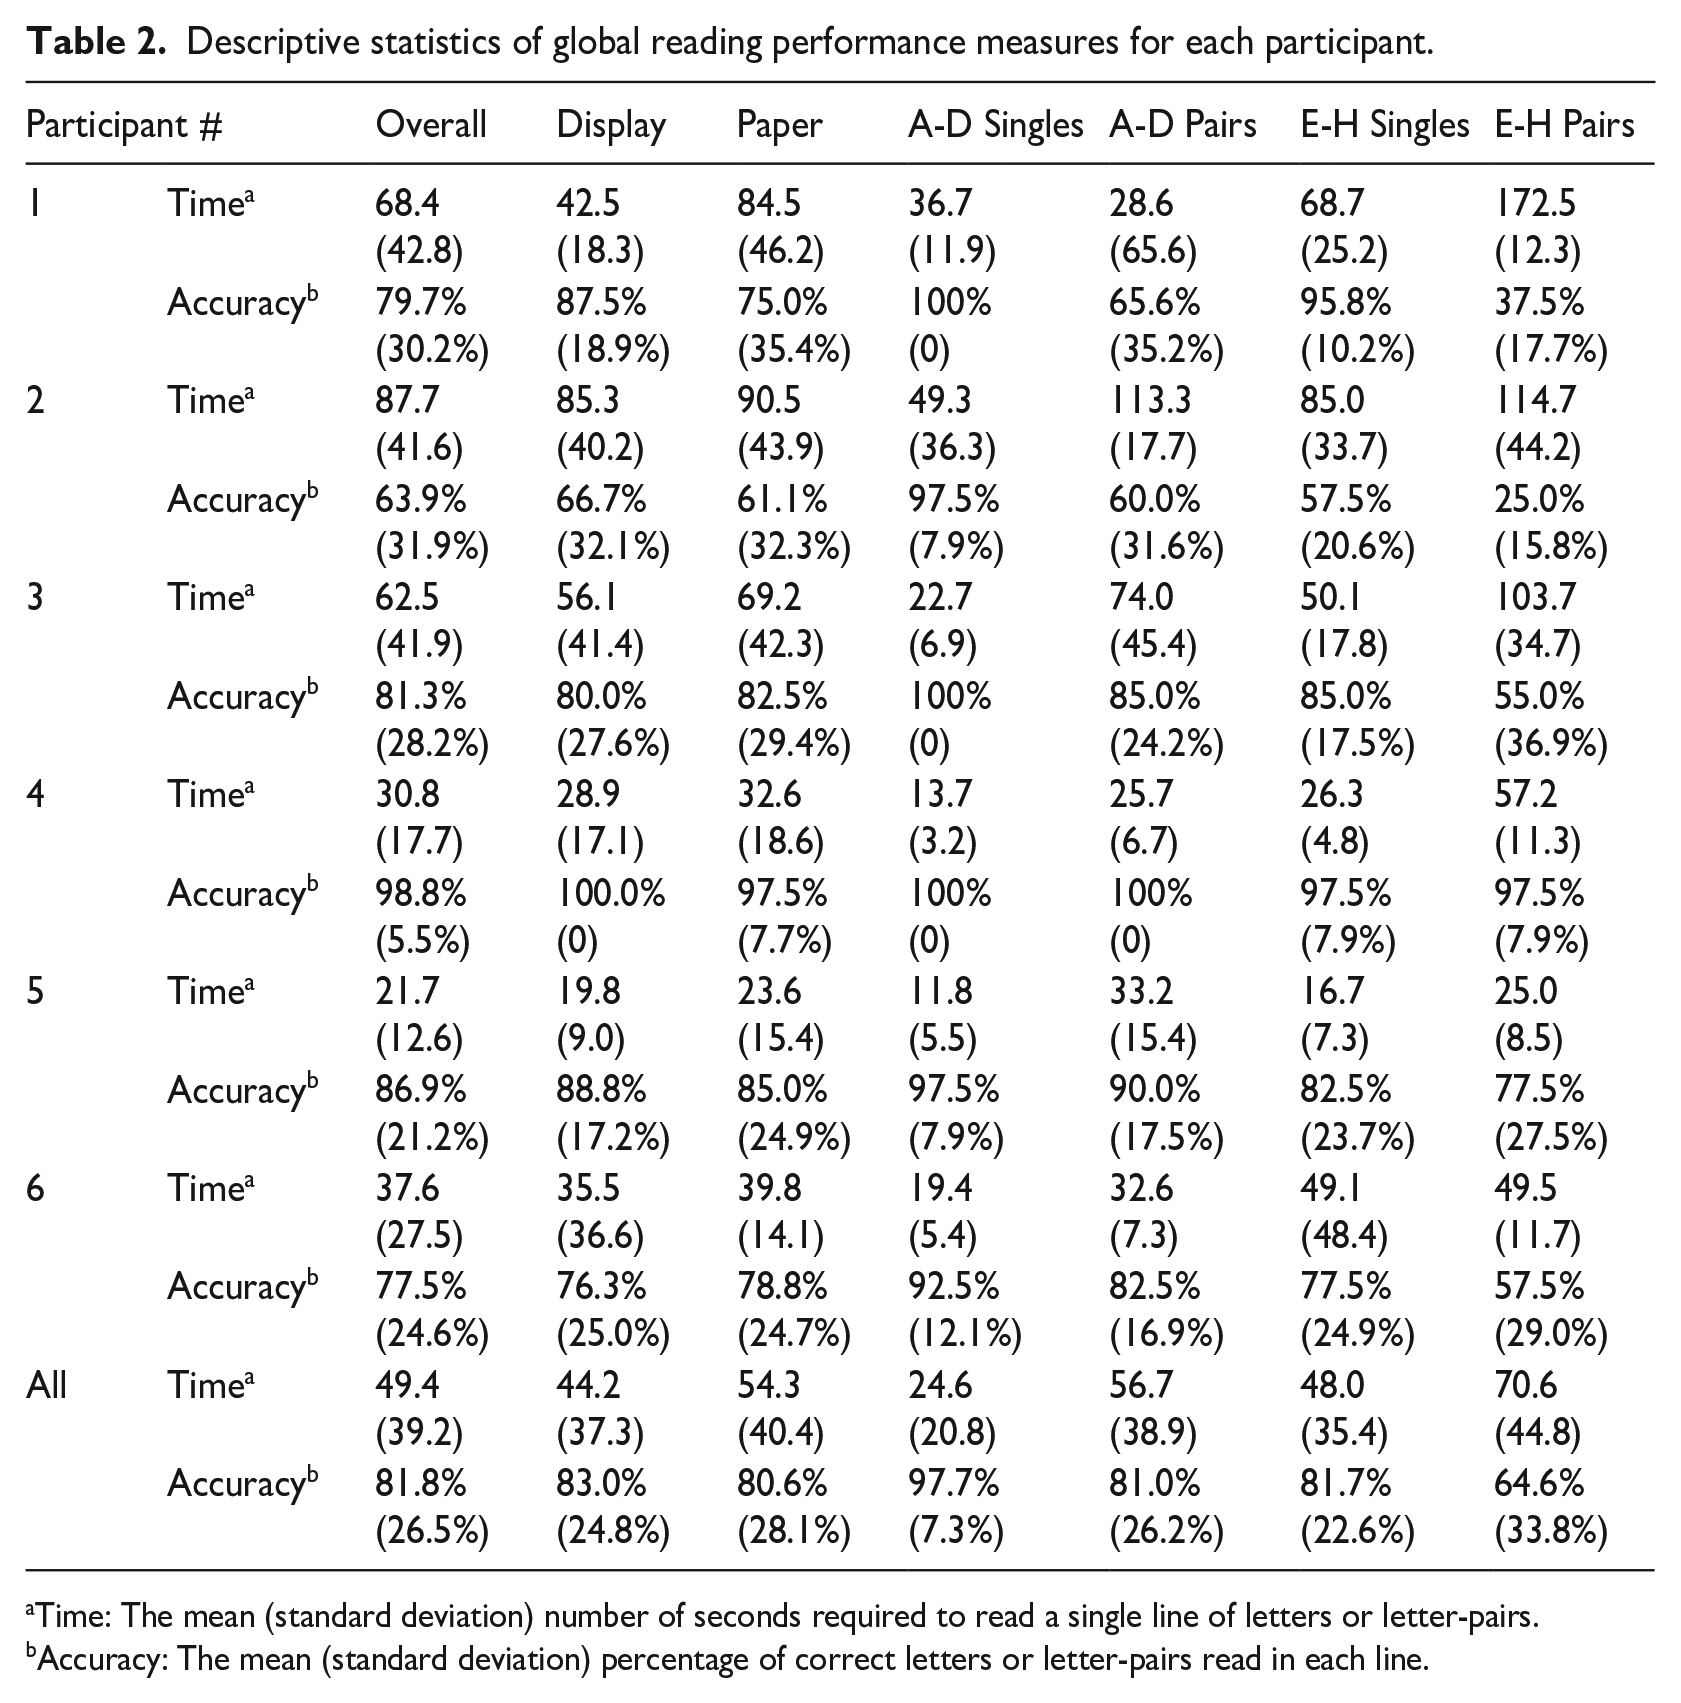
Time: The mean (standard deviation) number of seconds required to read a single line of letters or letter-pairs.
Accuracy: The mean (standard deviation) percentage of correct letters or letter-pairs read in each line.
Mean reading times and accuracies by participant and reading condition.
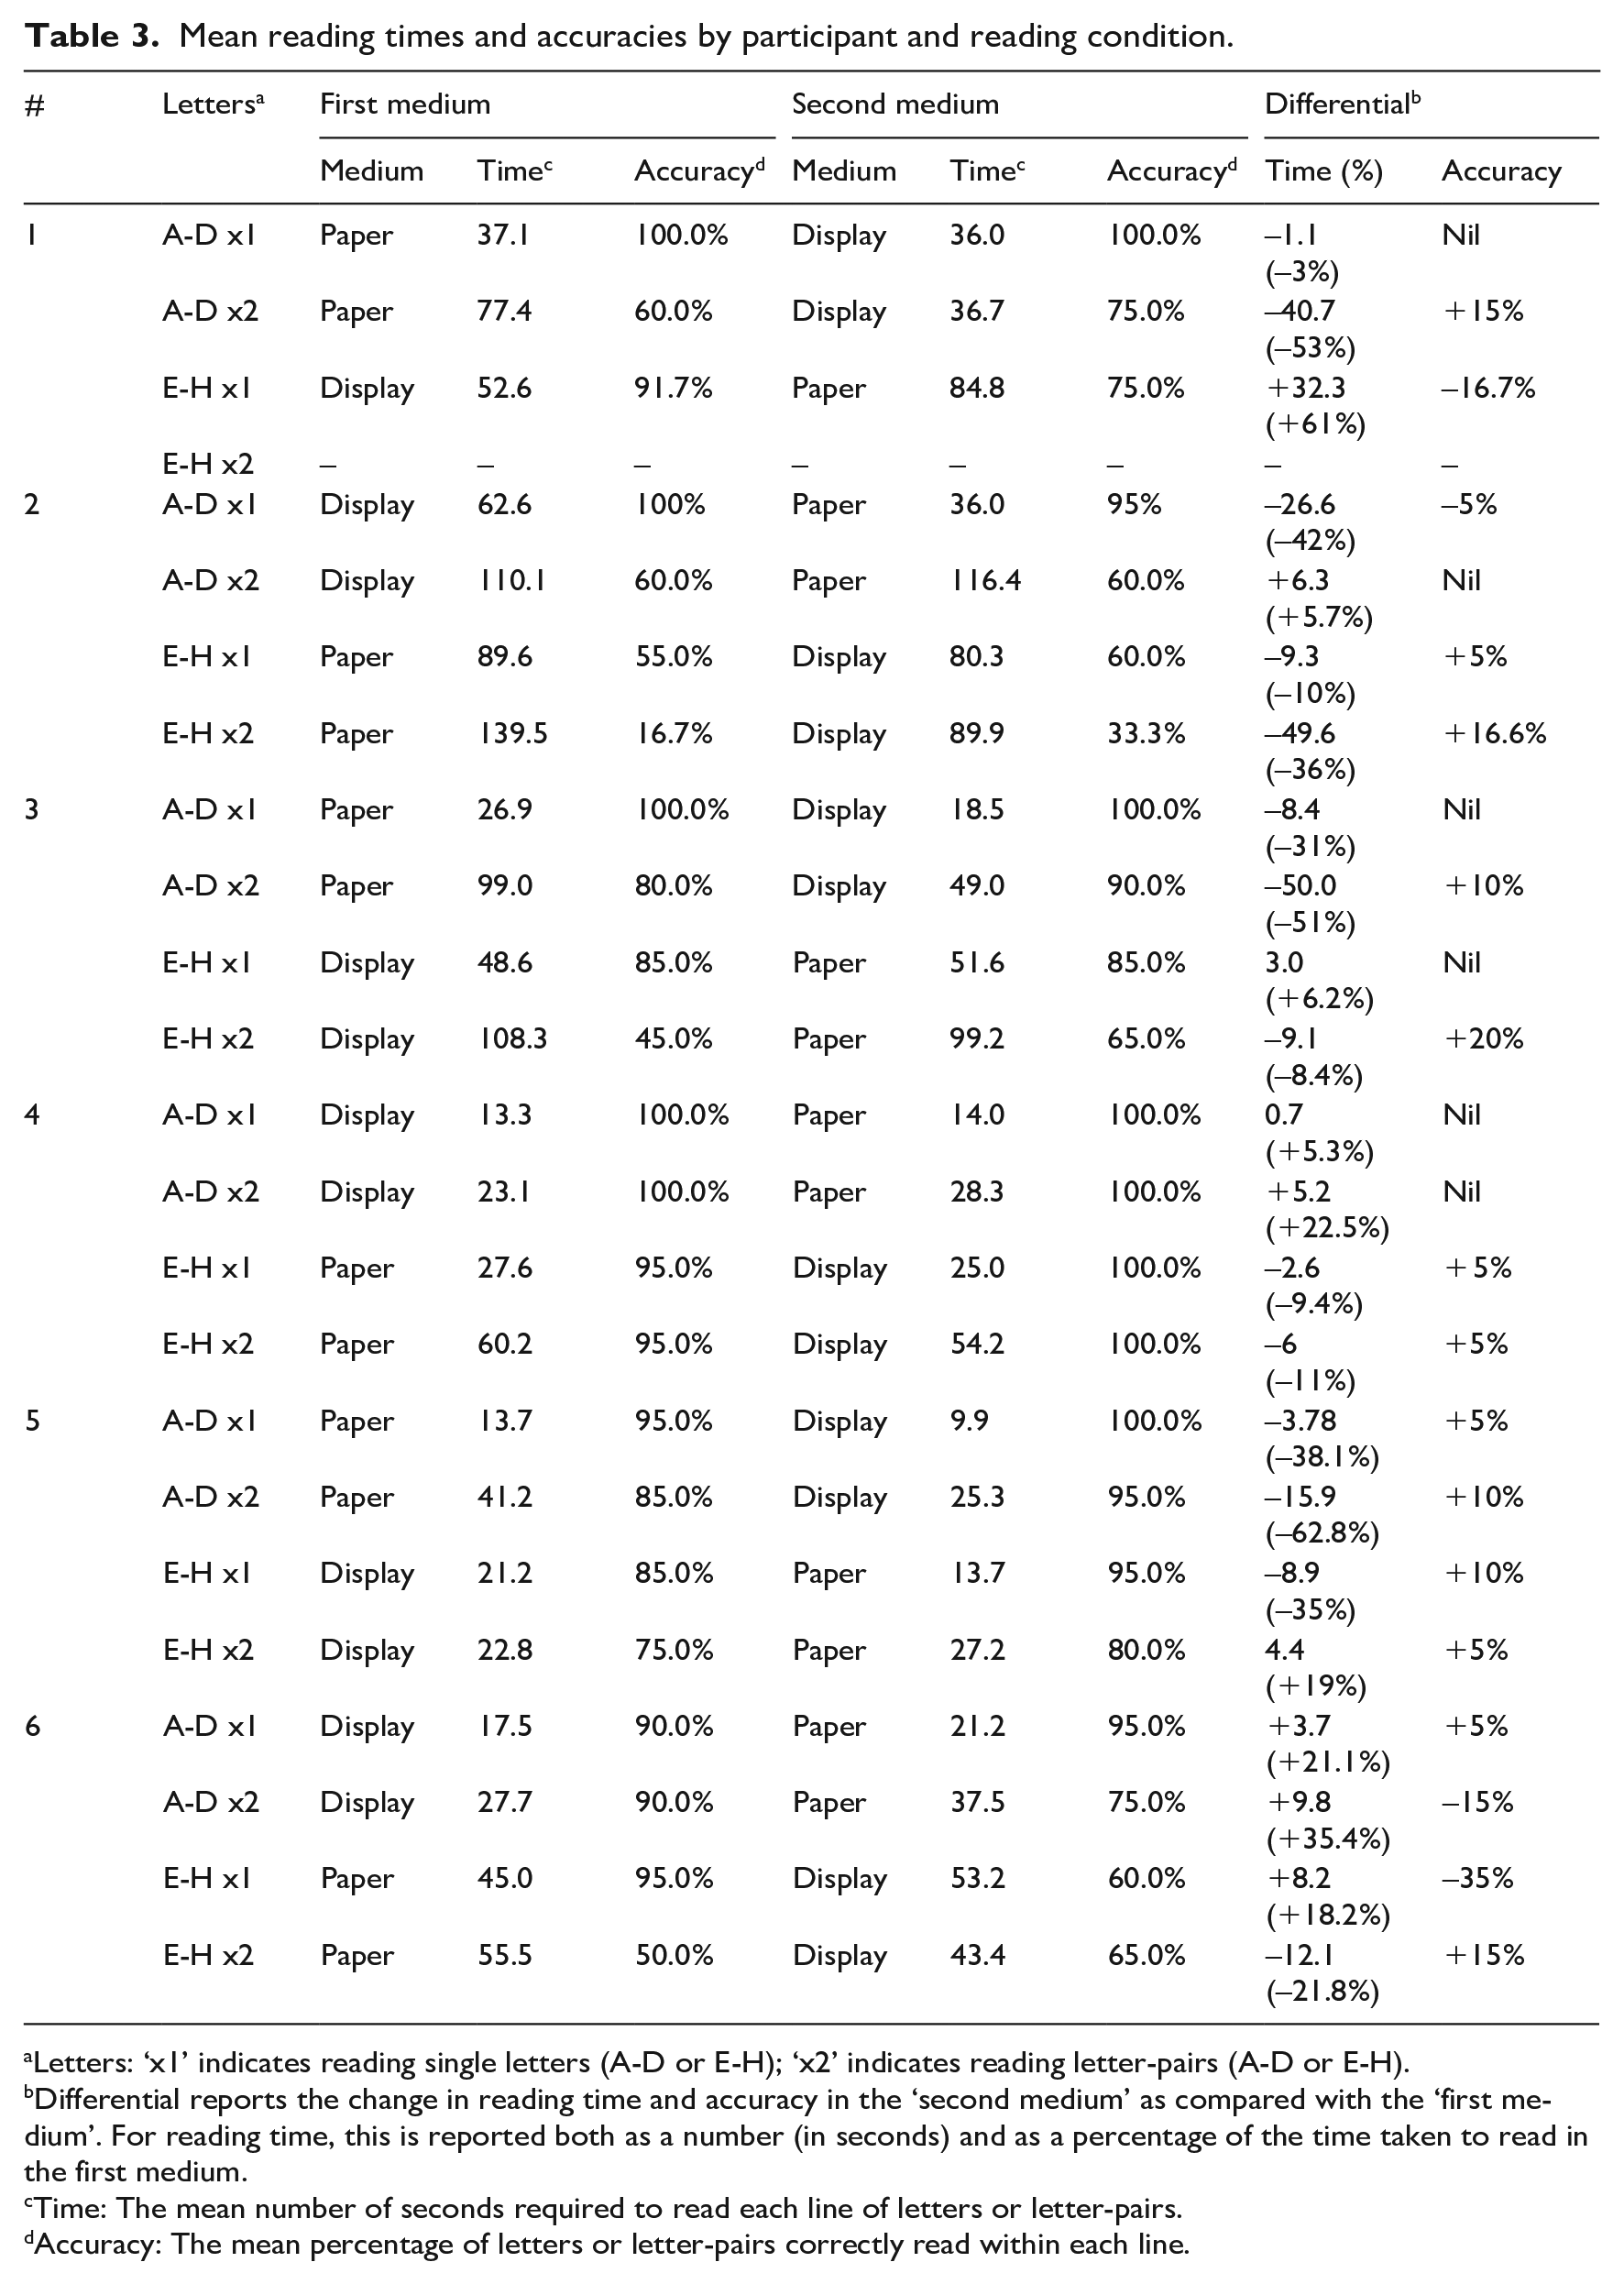
Letters: ‘x1’ indicates reading single letters (A-D or E-H); ‘x2’ indicates reading letter-pairs (A-D or E-H).
Differential reports the change in reading time and accuracy in the ‘second medium’ as compared with the ‘first medium’. For reading time, this is reported both as a number (in seconds) and as a percentage of the time taken to read in the first medium.
Time: The mean number of seconds required to read each line of letters or letter-pairs.
Accuracy: The mean percentage of letters or letter-pairs correctly read within each line.
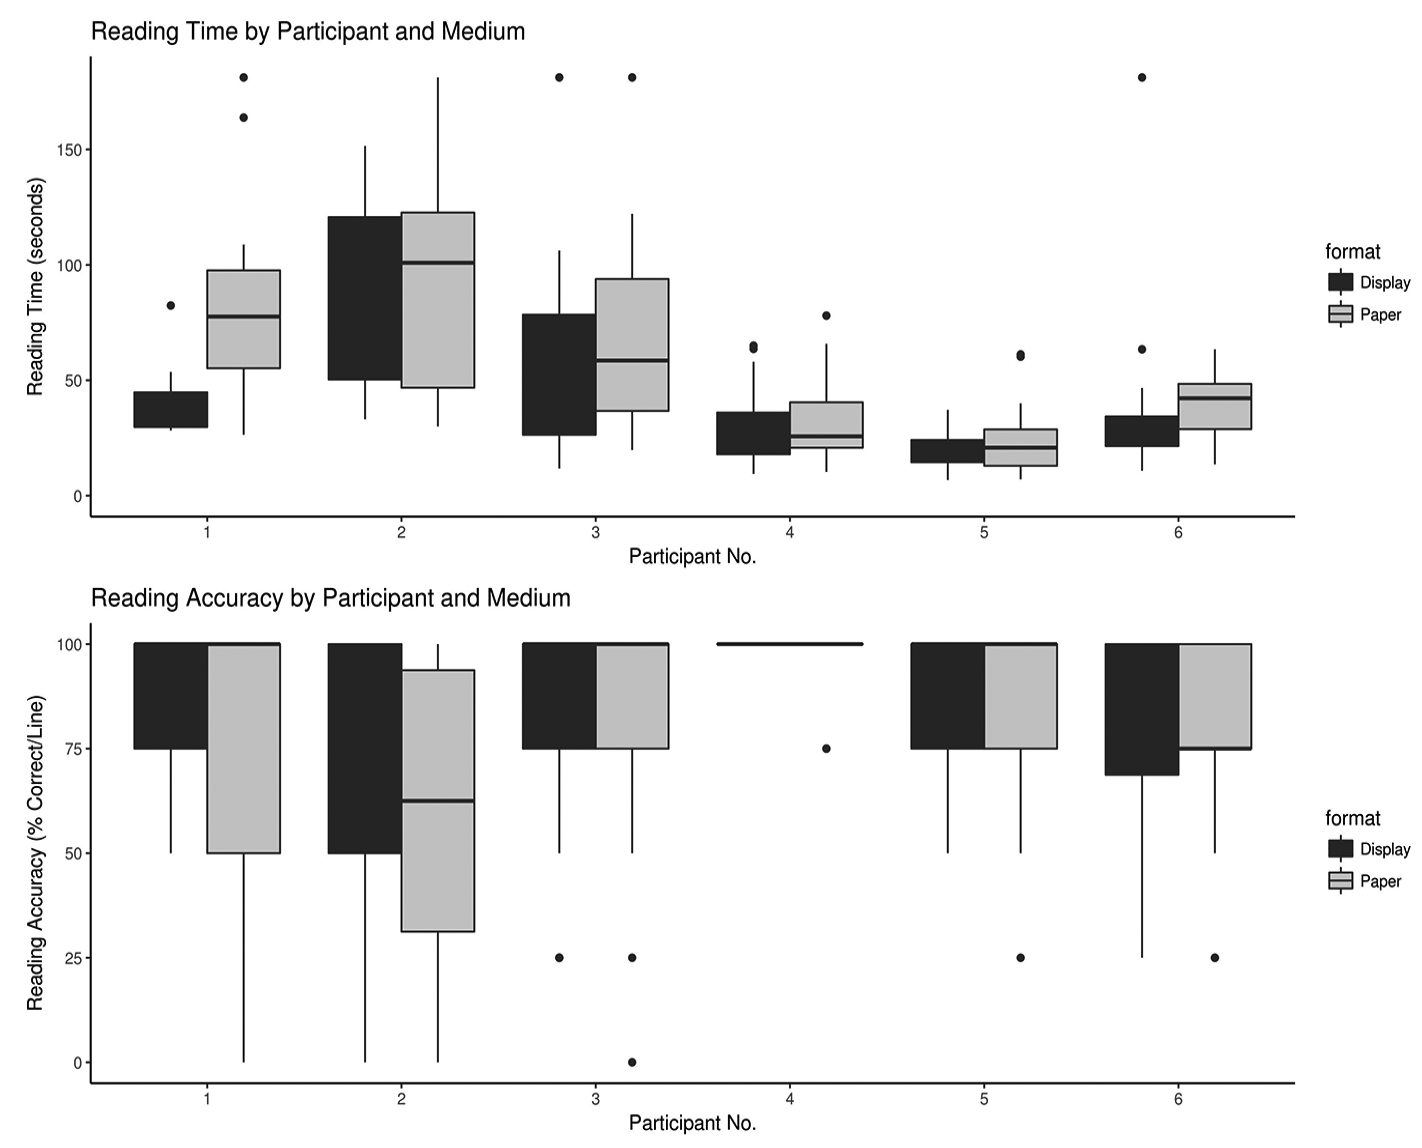
Boxplot depicting the reading time (mean seconds per line of four letters or letter-pairs) and accuracy (mean % of correct letters or letter-pairs per line) using an electronic braille display (black bars) and paper (grey bars) for each of the six participants.
Overall the results indicate that:
Learning new letters on a braille display resulted in better speed and accuracy (time: M = 44.2, SD = 37.3, accuracy: M = 83%, SD = 24.8%) than on paper (time: M = 54.3, SD = 40.4, accuracy: M = 80.6%, SD = 28.1%), especially for those with poorer tactile acuity. However, even those with poor tactile acuity demonstrate the ability to read accurately on both paper and braille display.
Transitioning from one medium to another generally resulted in the same or better speed and the same or marginally better accuracy: on average, when the same letters or letter pairs were read in a participant’s second format, reading times decreased by 11.2% and accuracy improved by 2.4%.
The advantage of the braille display condition appears to be greatest when reading letters in combination. Reading times on the braille display for the letter pairs were, on average, 19.4 s faster than on paper (a 26.8% reduction), and accuracy improved, on average, by 6.5%. For single letters, the differences were less acute: reading time on the display was only 0.68 s faster (a 1.9% reduction), and accuracy improved by only 2%.
Case 1
This 66-year-old sighted female scored the highest tactile acuity threshold (4.055 mm) among the six participants and was the only participant who did not achieve the 18 required to ‘pass’ the MoCA. Despite these apparent disadvantages, she was neither the slowest (overall reading time M = 68.5, SD = 42.8) nor the least accurate (overall accuracy M = 79.7%, SD = 30.2%). She read much more quickly on a braille display (overall reading time M = 42.5, SD = 18.3) than on paper (M = 84.5, SD = 46.2) and had better accuracy with a display (overall accuracy M = 87.5%, SD = 18.9) than on paper (M = 75%, SD = 35.4).
As shown in Table 3, when transitioning from paper to display, this individual’s speed and accuracy either improved or remained approximately the same. Transitioning from a display to paper (for single letters E-H) resulted in a noticeable increase in the time taken to read (by more than 32%) and decreased accuracy by more than 16%. Note that due to fatigue, this participant was unable to complete the paired-letter E-H evaluation.
Case 2
This 77-year-old male scored a tactile threshold of 2.954 mm, approximately 30% above the 2.28 mm braille spacing. He was visually impaired due to glaucoma diagnosed at age 49, with no light perception in his left eye and 20/200 acuity (with less than 100 degrees of peripheral vision) in his right. He demonstrated the longest overall reading times (M = 87.8, SD = 41.5) and the poorest overall accuracy (M = 63.9%, SD = 31.9%). Performance on a display (time: M = 85.3, SD = 40.2, accuracy: M = 66.7%, SD = 32.1%) was generally not very different from paper (time: M = 90.5, SD = 43.9, accuracy: M = 61.1%, SD = 32.3%), and transitions to the second format were associated with similar or better performance. Noteworthy is that when reading the E-H double letter pairs, a significant improvement was observed when transitioning from paper to display, with a 36% decrease in time and a 16% increase in accuracy (see Table 3).
Case 3
This 66-year-old male demonstrated a tactile acuity threshold of exactly 2.28 mm and presented roughly in the middle of the group in terms of both overall reading time (M = 62.6, SD = 41.9) and accuracy (M = 81.3%, SD = 28.2%). He had, at age 56, been diagnosed with macular dystrophy and had a mild vision impairment (between 20/30 and 20/70). He read more quickly on a display (as his second format) for the letters A-D (by a margin of 31% for single letters and 50% for letter pairs). Interestingly, when going the other direction with the letter pairs for E-H (i.e., initially reading E-H on a display and then transitioning to paper), there was a small (8.4%) decrease in the time required but accuracy improved by 20%.
Case 4
At age 26, this sighted female college student demonstrated the lowest tactile acuity threshold among the six participants (1.614 mm), achieving the highest accuracies (overall accuracy M = 98.8%, SD = 5.5%) and the second-quickest times (overall time M = 30.8, SD = 17.7). This pattern held for both reading on paper (time: M = 32.6, SD = 18.6; accuracy: M = 97.5%, SD = 7.7%) and on a braille display (time: M = 28.9, SD = 17.1; accuracy: M = 100%, SD = 0%). Transitions for this participant from paper to display and from display to paper for single letters did not result in any substantial change in performance; however, for letter pairs, the transition to the second format was accompanied by an 22.5% increase in speed for A-D and an 11% increase in speed (along with a 5% increase in accuracy) for E-H.
Case 5
The youngest of our participants, a sighted 23-year-old female college student, presented with an estimated tactile acuity on the Legge ‘Dot’ Chart of 2.870 mm. (This tactile acuity threshold is above what prior research suggests would be expected from a 23-year-old sighted individual, which is in the range of 1.3–1.6 mm (Bruns et al., 2014; Legge et al., 2019), but this did not appear to affect her performance.) She was the fastest reader overall (M = 21.7, SD = 12.6), on paper (M = 23.6, SD = 15.4), and on a braille display (M = 19.8, SD = 9.0), and had the second highest accuracy in each modality (overall: M = 86.9%, SD = 21.2%; paper: M = 85%, SD = 24.7%; display: M = 88.8%; SD = 17.2%). As shown in Table 3, transitioning from paper to a display for the letters A-D significantly reduced her reading times and improved her accuracy, but less consistent results were observed for the letters E-H. She first read E-H as single letters on a display, gaining a 35% speed advantage and a 10% accuracy improvement when transitioning to paper; however, for E-H letter pairs, transitioning from a display to paper took 19% longer (but was 5% more accurate).
Case 6
This 52-year-old female had a severe visual impairment (with a self-reported acuity of approximately 20/400) and had additional diagnoses including diabetes, mild multiple sclerosis, and neuropathy. Notwithstanding these diagnoses, her tactile acuity measured 1.918 mm, which is not inconsistent with what prior research suggests would be expected for a sighted individual in their 50s (Legge et al., 2018, 2019). Her overall reading times were commensurate with her tactile acuity, being faster than the participants over age 65, all of whose tactile acuity thresholds were higher. As indicated in Table 3, transitioning from one media to the other had an inconsistent impact on her performance. For the single and double letters A-D, switching from a display to paper resulted in longer reading times and, for letter pairs, a 15% decrease in accuracy. For the single letters E-H, switching from paper to a display resulted in not only an 18.2% increase in reading times but also a 35% decrease in accuracy. Interestingly, for the E-H letter pairs, the transition from paper to a display resulted in both a 21.8% decrease in reading time and a 15% improvement in accuracy.
Discussion
This study explored the influence of reading medium (paper and electronic braille display) on reading accuracy and speed when presented with single and double-letter pairs and examined the performance differences when transitioning from one medium to another.
Learning new letters on paper versus display
For these six participants, learning new letters on a braille display resulted in better accuracy and speed than learning on paper, though this is especially true for speed. Although accuracy for new letters was overall better on a braille display, the difference was minimal (just over a 2% difference). The advantage of the braille display condition appears to be greatest when reading paired double letters. Douglas et al. (2009) found that experienced braille users achieved similar accuracy when comparing standard braille dot height and a lower dot height of M = 0.18 mm; however, lowering the dot height in that study resulted in slightly less accuracy for those above the age of 60. In this study, the speed and accuracy advantage when learning new letters on a braille display was especially true for participants with poorer tactile acuity. The greater dot height afforded by a braille display may thus be especially beneficial for older adults who are new to braille. However, despite the apparent advantage of the braille display, even participants with poorer tactile acuity read with relative accuracy on both conditions. The older adults demonstrated an ability to read new letters both on paper and display (countering the misconception that older adults will be unable to perceive standard paper braille; Cryer & Home, 2011; Martiniello et al., 2020), but a braille display could ease learning frustration that might be encountered if tactile perception is impaired.
Transitioning from one medium to another
Transitioning from one medium to another generally resulted in the same or better speed. The improvement in performance when transitioning from display to paper (which was expected to result in less accuracy and speed) is likely in part due to practice or learning effects (Greenwald, 1976). However, this finding lends support to the notion that learning to read using a braille display should not disadvantage the client who subsequently transitions to reading on paper. Consistent with the observations made by Millar (1987), practitioners should provide ongoing exposure to both paper and braille display to ensure that tactile perception on both formats is developed and maintained. Moreover, the advantage of the braille display when reading paired double letters is consistent with previous work confirming that novice braille learners may initially struggle most with letters that contain a greater number of dots (Hall & Newman, 1987; Nolan & Kederis, 1969). In this way, a braille display can supplement paper braille when progressing to words and sentences, to increase motivation and solidify learning.
Limitations
Mean reading times and accuracy appeared to differ substantially between letters A-D and letters E-H (see Table 2), potentially confounding comparisons among participants. While previous studies have suggested that braille characters in the upper portion of the cell are easier for novice learners to perceive (Hall & Newman, 1987; Nolan & Kederis, 1969), the letters E to H mostly consist of three or four dots, respectively (with the exception of E) compared to letters A to D (where only D contains three dots). The decision to use the letters A to D and E to H was made because the most common adult braille curriculum in Canada (Rodrigues & Carter, 2013) introduces letters in alphabetical order; however, these letters will be counterbalanced in future work. Second, while this experiment provides useful insights, it does not mimic adult braille training which takes place over a longer period of time, and as with any learning situation, it may involve periods of both regression and progress. Longitudinal studies on the use of braille displays within training paradigms would add to the findings presented here. Finally, the circumstances surrounding COVID-19 disrupted recruitment, preventing the ability to obtain a larger sample size. Nonetheless, the included case studies are presented as these preliminary findings raise the need for future research on braille learning methods within the adult rehabilitation context and highlight important observations for clinical practice.
Conclusion
Although preliminary, these findings provide evidence that older adults are able to read single and double letters on both paper and braille display. However, the braille display condition may serve as an advantage to solidify learning and decrease frustration. This coincides with adult learning paradigms which accentuate the importance of ensuring success early in the learning process and in providing learners with real-life applications of what is being taught (Knowles et al., 2015). There are evident advantages to incorporating braille displays early in the learning process, given the greater amount of relevant reading materials that such devices afford. However, practitioners must ensure that older learners have ample opportunities to encounter and practice braille on paper as well, given the importance of paper braille for specific daily tasks, such as labels and lists (Huebner, 1989). These preliminary findings suggest that the use of a braille display early on should not adversely affect the ability for learners to transition to standard paper braille, assuming that both formats are introduced and reinforced.
Footnotes
Declaration of conflicting interests
The author(s) declared no potential conflicts of interest with respect to the research, authorship, and/or publication of this article.
Ethical approval
This study was approved by the University of Montreal and the Centre for Interdisciplinary Research in Rehabilitation of Greater Montreal (CRIR #1431-0619).
Funding
The author(s) disclosed receipt of the following financial support for the research, authorship, and/or publication of this article: This research was supported by funding from Fonds de recherche du Québec – Santé (Grant No. 32305); CNIB Ross C. Purse Doctoral Fellowship, a MITACS Accelerate Doctoral Fellowship (No. IT12662); and a New Initiatives Grant from the Centre for Interdisciplinary Research in Rehabilitation of Greater Montreal.