
Abstract
Recent European studies present persistently critical views of the under performance of government-backed venture capital (GVC) schemes when compared to their private sector counterparts. However, they assess the performance of outmoded funding models and fail to contextualise the economic development role of these schemes. This paper provides a contemporary assessment of the business impacts of the UK government’s flagship Enterprise Capital Funds VC scheme in addressing the sub-£2 m equity finance gap facing young potential high-growth businesses requiring investments. Supply and demand-side evidence is presented from interviews with ECF fund managers, alternative private VCs, industry experts and surveys of successful and unsuccessful scheme applicants. We find that, despite the limitations of mid-scheme evaluation, Enterprise Capital Funds are addressing the UK equity gap and delivering business employment, revenue and innovation impacts. However, further progress is required in order to achieve optimal business exits and sustainable early stage private VC system impacts.
Introduction
It is notable that many of the most flourishing venture capital (VC) markets globally are catalysed by government support (Lerner, 2009, 2010, 2011). Since the global financial crisis (GFC), intensification in government VC (GVC) scheme investment has occurred, driven by governments’ desire to support innovation and business growth (Lerner, 2010; Mazzucato and Penna, 2014), to plug seed and early stage investment gaps created by retrenchment to later stage funding by bank debt and private VC finance (Cowling et al., 2012; North et al., 2013; Wilson and Silva, 2013) and attempts to attract private investment, enhanced by increasing ability to attract foreign inward investment in the information age (Hopp, 2010; Lerner, 2010; Lerner et al., 2005).
In Europe, public investment in VC doubled to 1.6bnE between 2007 and 2011, increasing its share from 9.9% to 39.1% (EVCA, 2013). In the UK, Murray (2007) has suggested that since the Dotcom crisis, the proportion of government funding in seed and early stage VC increased, whilst Mason and Pierrakis (2013) indicated a rise from 20% to 68% between 2000 and 2008. This trend has most likely continued post GFC, given that British Venture Capital Association (BVCA, 2013) member seed and early stage VC investments in 2011 and 2012 were just £350 m, similar to 1999 prior to the Dotcom bubble. This phenomenon alongside recent large-scale data which cast questions over the value of GVC schemes (Grilli and Murtinu, 2014; Munari and Toschi, 2015), makes it apposite to take a closer look at a major European GVC scheme.
This paper assesses the business impacts of the UK government’s Enterprise Capital Funds (ECFs), the UK’s foremost GVC scheme addressing the equity finance gap facing young, potential, high-growth, small- and medium-sized enterprises (SMEs) requiring investments up to £2m. Established in 2006, ECFs have received £840 m UK government investment, including a £400 m three-year extension tranche announced in Autumn 2014, 1 thus far creating 18 rolling 10 year limited life funds. As Lerner (2002) and Tokila and Haapanen (2009) suggest, scheme assessment should consider its aims and objectives, whilst Greene (2009) highlights the need for thorough mixed methods approaches to more fully understand the impacts. The ECF has a dual rationale to plug the early stage finance gap and develop potential high-growth SMEs, and to stimulate the creation of new early stage VC funds, providing demonstration effects that encourage other private VCs into early stage investment, developing a sustainable VC ecosystem in the UK. Whilst the second aim meets Lerner’s (2010) requirement for GVCs to catalyse private sector VC ecosystems and withdraw, this paper focuses on how the ECF model impacts on businesses, addressing Colombo et al. (2014) in examining how effective the design of contemporary GVC funds are.
The paper draws on empirical interim ECF evaluation demand and policy supply-side evidence in early 2014, including ECF fund managers, other contemporary UK seed and early stage risk equity financiers and views from the wider business support services ecosystem. The focus is on a survey of 75 SMEs assisted by ECFs, since their inception in 2006, examining the evolving design and approach of the ECFs and their impacts on business development. This spans a period immediately prior to the GFC during which the first ‘pathfinder’ group of eight ECFs were established, between 2006 and 2008, and post the onset of the GFC when the newer group of six ECFs included in the study were established between 2010 and 2013.
The paper initially summarises the theoretical context relating to GVC policy intervention, scheme design, and the evolution of the ECFs, before presenting the methodology and key ECF business impact findings. It concludes by discussing the findings and considering how ECFs might achieve their longer-term aim of establishing a sustainable seed and early stage UK private sector-led VC market.
Theoretical context
GVC theories can be defined as predominantly supply-side relating to the rationale for government intervention, addressing an equity gap and developing a VC ecosystem (Lerner’s, 2010 vision of developing professional VC support services), and the related design and implementation of schemes, addressing the fit for purpose question. Demand side theories relate to the entrepreneurial ecosystem and whether there is an adequate supply of suitable young investible potential high-growth businesses (Mason and Brown’s enterprise pipeline, 2013).
Supply side rationale
The rationale for government support to young potential high-growth businesses is predicated on the certification hypothesis, suggesting that policies can pick winners, or in the case of co-funded public–private investment schemes, can pick winning partners (Baldock and Mason, 2014) who can affectively select businesses and assist growth that would otherwise not take place. Colombo et al. (2014) also find that government funding may signal quality to other private investors, generating a crowding-in effect. Since potential high-growth firms are associated with innovation, revenue and job generation (Audretsch, 2002; ERC, 20142; Nesta, 2009b; OECD, 2002), economic growth and economic rebalancing through development of high value export products and services (HM Treasury and BIS, 2011), GVC schemes have come to the fore in the post GFC period (Wilson and Silva, 2013), particularly focusing on seed and early stage development where external financing for these businesses appears most problematic.
Since Macmillan (1931) first estimated a finance gap at below £200,000, equating to below £5m today, the evidence is that the gap relating to entrepreneurial risk finance varies in intensity and scale over time, as demand and supply alter, with supply-side intervention policies able to narrow the gap (Lerner, 2005, 2010; Murray, 2007). Deakins and Freel (2012) define the equity gap as between the upper limits of business angel finance and the minimum capital requirement for the public equity market, considered to range from £250,000 to £2 m in the UK in the mid-2000s when the ECFs were established (Murray, 2007). By the late 2000s, evidence of the trend for private VCs to retreat to later stage investments suggested that the gap had extended beyond £2 m to over £10 m (Rowlands, 2009; SQW Consulting, 2009), whilst as the recession took hold in 2009–2010 blockages in the supply of business angel finance suggested that the gap was also encroaching into the seed and start-up finance stage at below £250,000 (Johnston, 2009; Mason et al., 2010).
The finance gap is caused by market imperfections (Modigliani and Miller, 1958) with information asymmetries considered a major cause (Akerlof, 1970; Myers and Majluf, 1984) due to the unequal knowledge exchange between financiers and businesses. This is particularly problematic for young high-growth potential businesses without track records to demonstrate their market traction and value, and often lacking sufficient collateral with their true value being associated with intangible intellectual property (IP) (Hsu, 2004). These businesses require risk equity finance, but face problems of adverse selection and moral hazard (Carpenter and Peterson, 2002) resulting from the prohibitively high cost of due diligence for relatively small–scale seed and early stage investments and reflected in the resultant poor performance of these equity markets in recent years (BVCA, 2013; Mason et al., 2010).
The temporal changes in the supply of finance are captured in the finance escalator model (Nesta, 2009a), which incorporates Berger and Udell’s (1998) concept of declining information opacity of young firms as they progress through the business development cycle. This suggests that as businesses develop and gain market traction, a different and wider range of finance (debt and equity) become available. The escalator model can be used to demonstrate finance gaps and pinpoint where GVCs can make most impact (Baldock and Mason, 2015; Gill, 2010; Harrison, 2014; North et al., 2013).
Colombo et al. (2014) raise one further important market failure hypothesis that GVCs can address social pay-offs and externalities that private transactions take no account of. They view this as contentious, requiring careful attention to scheme design and context, since it may typically take place in peripheral, less favoured thin markets and can lead to underperforming investments and crowding out of private investors (Armour and Cumming, 2006).
Ecosystem and demand side theories
The development of a more efficient seed and early stage financing escalator, is pyramidal, based on a sufficient pipeline supply of young investible businesses (Mason and Brown, 2013; Mason and Pierrakis, 2013). This requires a carefully integrated policy to develop the VC and equity finance and entrepreneurial ecosystems (Hughes, 2009; Hwang and Horowitt, 2012), taking into account both the supply-side mechanism and also the potential demand-side failures in relation to investment readiness (Mason and Kwok, 2010).
From a supply-side perspective, Hall and Lerner (2010) find that private VCs can address funding gaps, overcoming information asymmetries, adverse selection and moral hazard through their screening, monitoring and management support processes. However, in an under-developed market where there are gaps in VC investment, Colombo et al. (2014) suggest that GVC can attract, train, nurture, and raise the quality and volume of private VC. Lerner (2010) finds it essential for GVC schemes to attract skilled private investors and embed an early stage VC investment culture and support service network (e.g. specialist accountants, lawyers, advisors).
From the demand side, developing the resource based knowledge of small firm management is essential (Baldock et al., 2015; Mac an Bhaird, 2010; North et al., 2013), alongside broadening the pecking order financial preferences of entrepreneurs (Myers and Majluf, 1984; Norton, 1991) and tackling signalling issues which may particularly affect the ability of entrepreneurs in more peripheral areas to find and obtain equity funding (Amini et al., 2012; Mueller et al., 2014). Whilst this paper focuses on the supply-side, the extent of intermediary knowledge and visibility of ECFs to entrepreneurs is discussed.
Design theories
There would appear to be a strong justification for public policy intervention in order to address market failure, but policy interventions require careful consideration of potential pitfalls (Brander et al., 2008; Colombo et al., 2014; Lerner, 2010; Murray and Lingelbach, 2009) which may result from agency failures (Akerlof, 1976) from poor management and policy making. In recent times, there has been a proliferation of GVC design theories, drawing on global experiences in searching for the holy grail of an established private sector-led early stage finance market which addresses the equity gap (e.g. Cumming, 2011, 2014; Lerner, 2002, 2009, 2010, 2011; Lerner et al., 2005; Mulcahy, 2013; Murray, 2007; NAO, 2009; Pierrakis, 2010; Technopolis, 2011). Whilst it is important to take into account different institutional environments (Florida and Kenney, 1988), very few GVC schemes have been deemed successful (Brander et al., 2008; Colombo et al., 2014; Lerner, 2009). The most successful in terms of developing early stage private VC investment and generating successful exits have been the US Small Business Investment Company (established 1958), Israeli Yozma funds (established, 1993), and Australian Innovation Investment Fund (established, 1997). Many more recently established funds have not had sufficient time for proper assessment.
An extensive review of GVC studies suggests that the more successful schemes are private VC led, attract co-investment, inward investment and experienced VCs who up-skill local VCs over time, are time limited but extendable to facilitate optimal exit timing, monitor, and adjust to changing market requirements, have sufficient scale of funding and target market, remain focused and avoid mission creep, and operate within a wider supportive entrepreneurial and financing ecosystem which takes into account exit market opportunities. These points are developed below.
First, Murray (2007) recognised GVC schemes’ shift towards private sector-led ‘hybrid’ co-funding arrangements, which Colombo et al. (2014) characterise as a shift from direct funding which might require private match funding (e.g. Finnish Industry Investment’s direct funding to businesses) to private VC-led co-funding (e.g. the UK ECFs) or fund of fund structures (e.g. UK Innovation Investment Fund). Lerner (2002) questioned the legitimacy of government officials running funding schemes, noting the potential for political distortion and propping up favoured businesses. By the end of the decade, Lerner (2010) strongly advocated a private sector-led approach investing in viable businesses. He highlights the Israeli Yozma funds 3 and their ability to attract foreign investment and skilled fund managers to provide a demonstrator effect for other private fund managers to follow. A key part of the private sector-led approach is the ability to leverage co-investment funding from the private sector, increasing fund size and engendering a private sector investment dynamic. Recent large data European (Grilli and Murtinu, 2014) and UK (Munari and Toschi, 2015) studies point to the importance of experienced hands-on private sector fund managers and support the view that successful VCs have niche “hard to imitate” knowledge of sectors and stages (BIS, 2011) and are persistent performers who build on their experience over time (Gompers et al., 2010; Zarutskie, 2010).
Second, that government intervention should add value to the market (Wallsten, 2000) and withdraw when its job is complete in order to avoid private sector reliance and crowding out (Lerner, 2010). In this respect, Lerner strongly advocates time limited schemes (e.g. the 10-year Limited Partnership (LP) model) driven by private sector performance dynamics which avoid evergreen fund pitfalls of persistently funding poor performing portfolio businesses, as exhibited in Murray et al.’s (2009) GVC review of Finland. Lerner et al. (2005) acknowledge that achieving this performance balance requires regular monitoring to avoid counter arguments that private sector-led GVC potentially cherry pick the best company investments, crowd out the private sector, distort and inflate market valuations, and fail to address wider economic development objectives, such as regional development (Brander et al., 2008; Da Rin et al., 2006; Leleux and Surlemont, 2003; Oakey, 2003).
Third, the required size and scale of GVC activity is widely debated. UK and European VC funds have been dwarfed by their US counterparts; US funds distribute over five times the value from less than four times the number of funds (Ernst and Young, 2010). The implication is that UK GVC funds have insufficient scale to achieve Markowitz’s (1952) portfolio size optimisation. Technopolis (2011) European VC report recommended that funds require sufficient size to follow-on invest in their best portfolio companies and avoid forced early exits at sub-optimal value, suggesting a minimum fund size of £40 m for a seed or early stage VC. In this respect, the ability of GVCs to achieve timely fund cycle development, raising investment for second funds (Gompers and Lerner, 2001), is crucial and appears to have been badly hampered across Europe by declining early stage investment post GFC (Dittmer et al., 2014). Dittmer et al. (2014) also suggest that a possible solution to European GVC scale is to operate across borders on a pan-European scale, as evidenced by the UK Innovation Investment Fund (BIS, 2012).
Fourth, GVC funds require a wide enough focus to meet a sufficiently good pipeline of investible businesses. Reports on the failings of UK (NAO, 2009) and Finnish (Murray et al., 2009) regional GVC funds highlight their being too small in scale and narrowly focused into regions to generate sufficient critical mass of investment and returns. This suggests that funds which are sector- or stage-specific are likely to locate in high density clusters, such as London’s Tech City seed VCs, or to syndicate and work with other VCs and investors such as the recently emerging angel capital groups (Baldock and Mason, 2015) in order to facilitate inter-regional and international investments (Hopp, 2010; Hopp and Rieder, 2011).
Fifth, GVC schemes require a long-term minimum 10-year view (Lerner, 2010) with flexibility to extend further. Whilst Lerner advocates regular monitoring to ensure that funds are performing their intended roles and to avoid mission creep to safer later stage investments (Gill, 2015; Murray et al., 2009), it is equally important that government avoids micro managing and allows GVC funds to develop over sufficient time. The trend towards a doubling in early stage VC portfolio exit timetables, from around four years in the early 2000s to around eight years post GFC (Axelson and Martinovic, 2012; Baldock and North, 2016, forthcoming; CfEL, 2013; Mason and Harrison, 2015; Pierrakis, 2010) has rekindled debates as to whether 10-year LP GVCs will be able to allow their portfolio firms to fully mature and avoid early sales and potential share value dilution. Mason and Brown (2013) point to the importance of an exit market, for trade sales and initial public offerings (IPOs) (Baldock, 2015) in delivering blockbuster VC exits which will lead to recycled funds and new private VC entry.
Finally, GVC operates within a holistic entrepreneurial financing ecosystem which supports enterprise development and appropriate funding supply (Hughes, 2009). From the VC scheme design perspective, Lerner (2010) stresses the importance of developing support and promotional networks, making them visible and accessible, linking different types of finance and financial intermediaries and avoiding duplication. This emphasises the umbrella role of state investment banks such as the German KfW 4 in operating technology funds (Grunderfonds) and managing the evolving finance escalator, highlighting the role that the new British Business Bank can play in achieving this in the UK (Breedon, 2012; Cumming, 2011; Gill, 2015; Mazzucato and Penna, 2014; Van der Schans, 2015).
The role of ECFs
The ECFs, introduced in 2006, mark an important advance in UK GVC schemes, notably the previous small-scale public-led Regional Venture Capital Funds (Colombo et al., 2014). They represent a significant increase in the size and scale of funding and a concerted effort to deliver private VC-led co-investment funds.
Between 2000 and 2012, the UK Department for Business, Innovation and Skills (BIS) placed £600 m in 34 VC funds, financing over 1000 businesses (CfEL, 2013), with private funding leverage of 0.5 × which was set to rise to almost 1 × during the lifetime of the current schemes. Increased private funding leverage results from the increase in co-funding schemes (Murray, 2007), mainly relating to the ECFs, UK Innovation Investment Fund (UKIIF) 5 and Angel Co-investment Fund (ACF), all designed to stimulate private sector investment to increase fund size and generate a private sector-led fund performance dynamic (Lerner, 2010).
From establishment, the ECFs have had two main objectives: 6 first, to provide gap funding for potential high-growth SMEs, mainly in seed and early stage development requiring £250,000 to £2 m; second, to provide a demonstration model for early stage institutional VCs, by establishing a UK early stage VC ecosystem and encouraging new private fund managers into the market, effectively addressing recommendations for private sector-led public funds (Lerner et al., 2005). These key objectives have not changed over time, although the individual funding models have evolved with greater focus from 2010 on seed and earlier stage VC.
The funds require a minimum of one third private investment, restricting private individual investment to 50% of the private funding contribution to broaden the private investment base. They are not pari passu (as favoured by EU schemes), offering an up-side priority private investor return 7 to encourage improved fund management performance, as favoured by Lerner et al. (2005) and Jaaskelainen et al. (2007) to encourage competent early stage private investors. The funds are formed under 10-year Limited Partnership (LP) status, with options to extend up to 12 years, a feature which complies with Lerner’s (2010) requirements for GVCs to have flexibility to enable maximisation of their portfolio exits.
The UK government provided £240 m in 2006 for the initial eight pathfinder ECFs, £200 m in 2010 for eight further funds, and £400 m for Autumn 2014–2017. The recent rise in the scale of ECF funding continues the trend in increasing UK GVC scheme funding since 2000. It demonstrated the UK government’s commitment to develop the seed and early stage VC market and followed negotiations leading to the EU’s January 2014 increase in the state aid limit (EC, 2014a) from £2 m to £5 m on initial investments into portfolio companies, alongside increasing follow-on funding to 15mE capped at 15% of fund value (rising from 10%) and with the public funding limit doubling to £50 m for individual funds. This scaling-up meets the recommendations for larger scale European funds to adequately facilitate follow-on funding and optimise business growth and exit values achieved (Rigos, 2011; Technopolis, 2011).
The evolution of Enterprise Capital Funds (2006–2015).
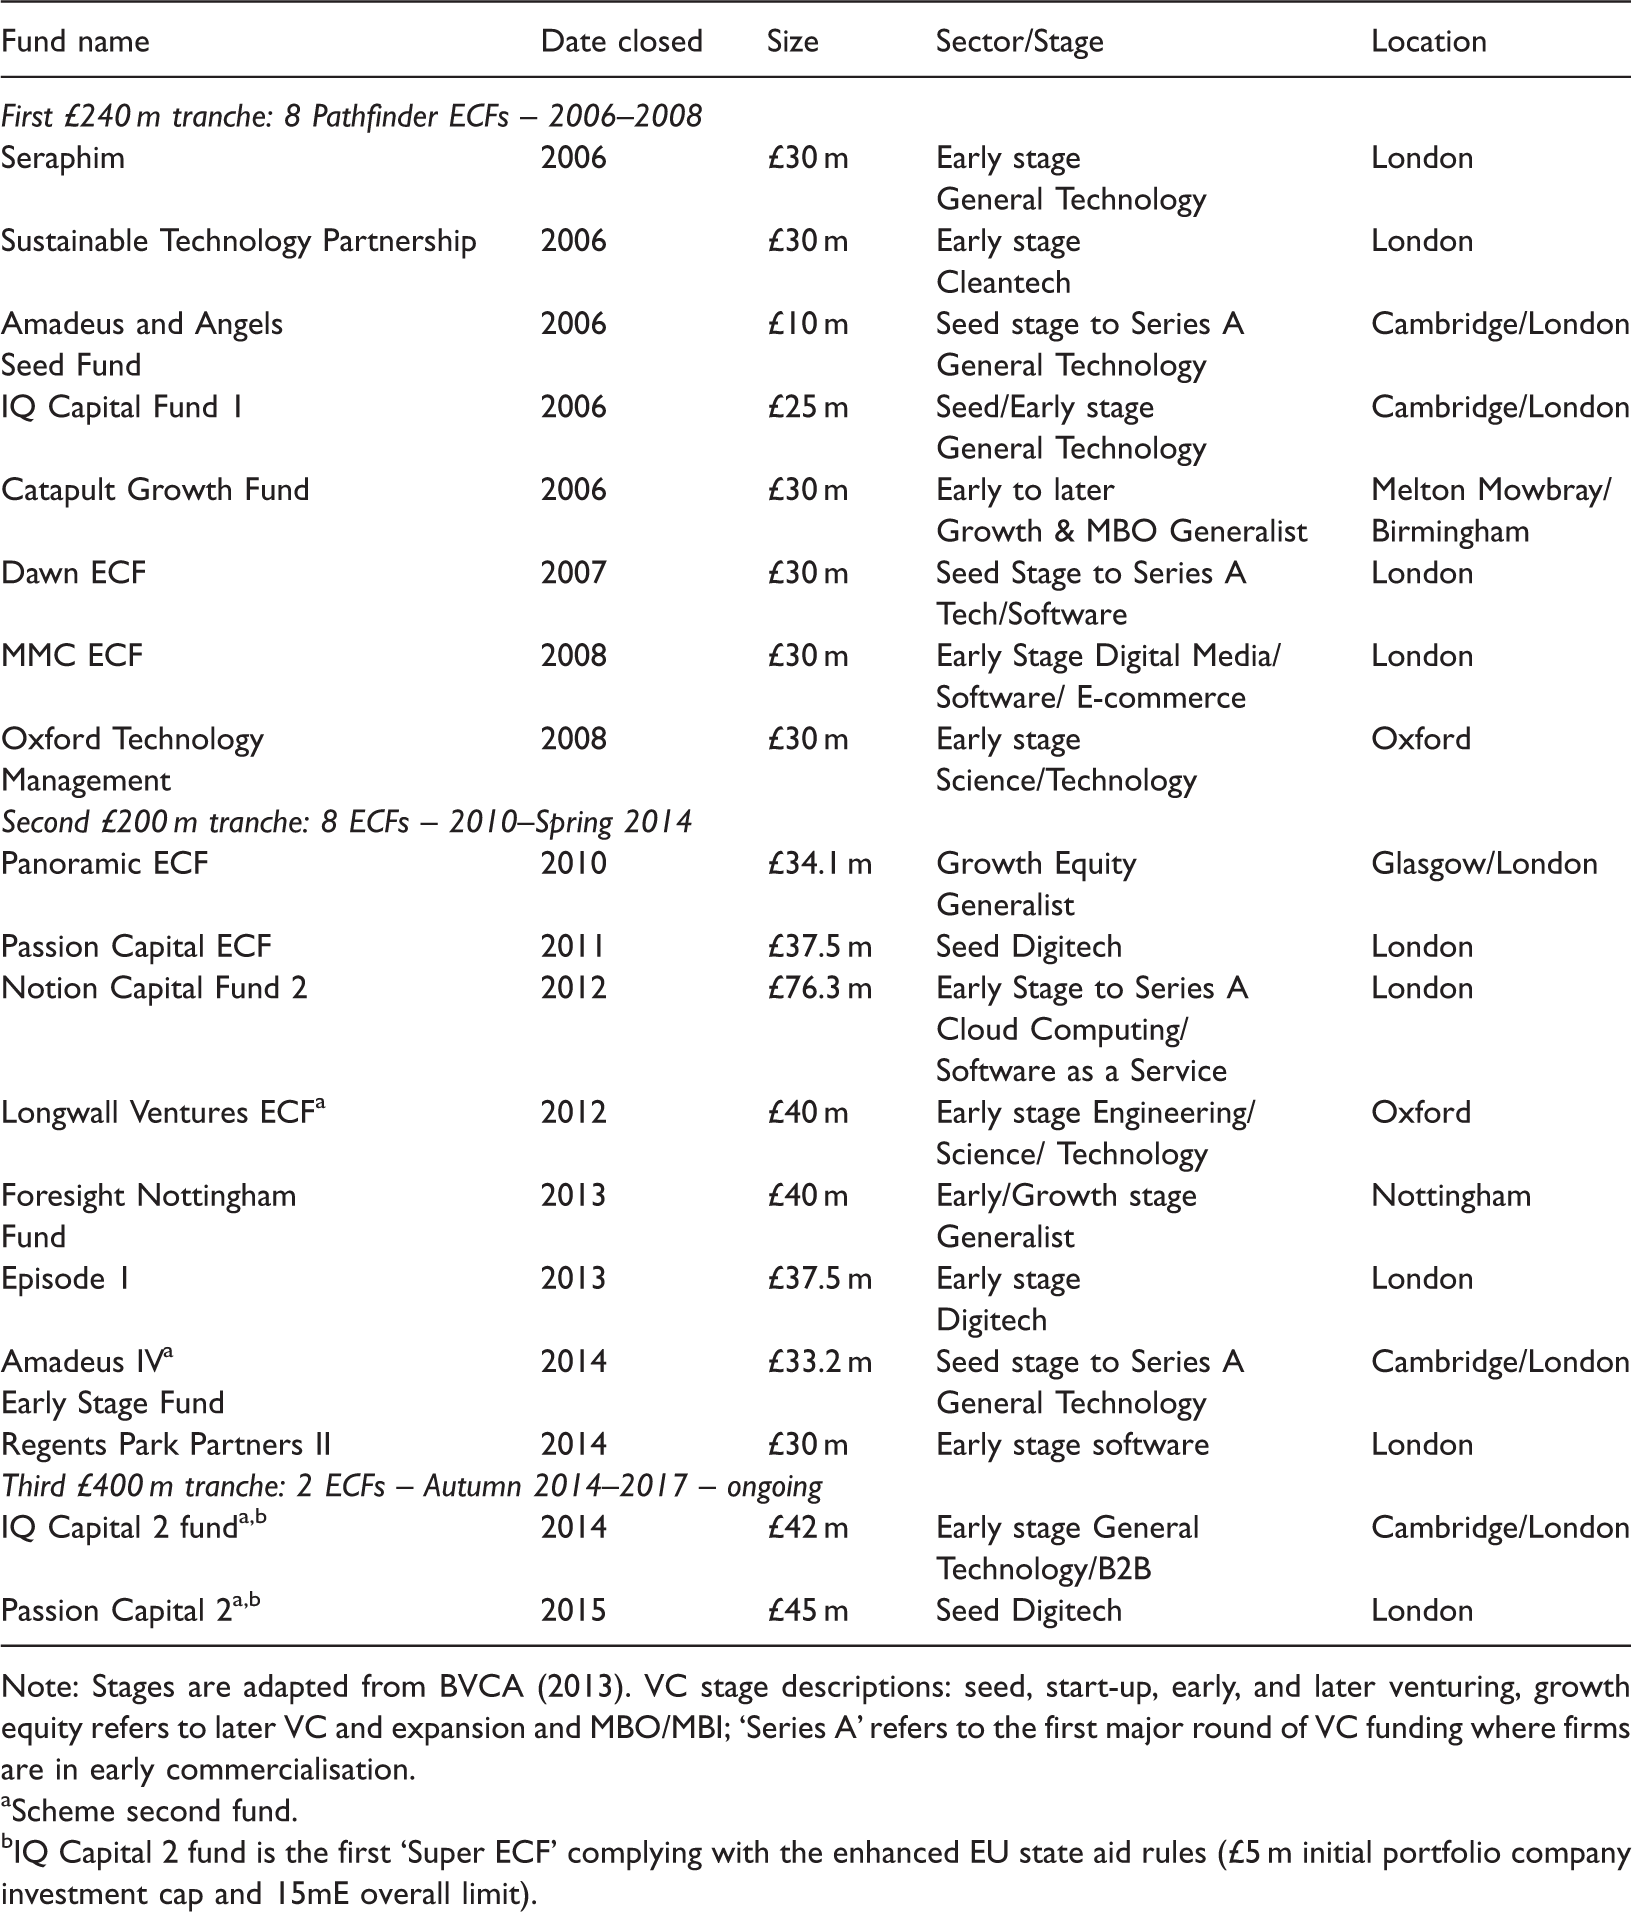
Note: Stages are adapted from BVCA (2013). VC stage descriptions: seed, start-up, early, and later venturing, growth equity refers to later VC and expansion and MBO/MBI; ‘Series A’ refers to the first major round of VC funding where firms are in early commercialisation.
Scheme second fund.
IQ Capital 2 fund is the first ‘Super ECF’ complying with the enhanced EU state aid rules (£5 m initial portfolio company investment cap and 15mE overall limit).
There is further evidence of scheme evolution to adjust to changing post GFC market requirements. The second tranche of ECFs, since 2010, contains innovative features designed to enhance their impacts. These include the Notion fund being able to invest beyond the £2 m state aid limit in European companies, with a minimum investment requirement into UK-based companies aligned to the UK government’s investment, which is similar to the operation of the pan national UKIIF, supporting Lerner’s (2010) globalisation of VC thesis and that specialist sector-based funds can operate on a more effective scale if they are international (Dittmer et al., 2014). There is also avoidance of the RVCFs’ regional market limitations in the 2000s (NAO, 2009). The Foresight ECF focuses on Nottinghamshire businesses, receiving a bonus for local investments, but is also able to invest in other parts of the UK in order to ensure a suitably sized and balanced portfolio. Greater focus is given to seed and early stage investment in the second tranche ECFs, following Lerner et al.’s (2005) recommendations that schemes have to be flexible to adapt to the market’s requirements, which in the UK post GFC saw a sharp decline in seed and early stage investing (BVCA, 2013). The London-based Passion seed fund operates as an accelerator in order to maximise portfolio funding opportunities and minimise due diligence costs. This pure seed fund operates at well below the typical £250,000 lower investment of most ECFs, focusing on seed and earlier stage syndication investments to spread risk and make investments more attractive to later stage VCs (Hopp, 2010). It has provided a seed funding model in London that other private VCs and angel capital groups are following (e.g. EC1, Connect Ventures, Playfair Capital).
A feature of the ECFs has been their stretch-funding provision to new fund managers. This has attracted highly skilled European and US fund manager investors, enabling capacity building of the sector in the UK and potential to achieve the funding scale required to create a lasting scheme legacy, following Lerner et al.'s (2005) inward investment investor skills recommendation. An important element of this VC development cycle is generation of second funds (Gompers and Lerner, 2001) that can build on the initial ECFs, providing further scale-up and ability for substantial follow-on funding to the best performing portfolio companies. Notably, thus far, the scheme has seen just four second funds created (Table 1) and these have taken six to eight years to appear after the first funds, which may have resulted in some portfolio company funding shortfalls (examined later).
Over time, the ECF scheme aims to establish a sustainable private seed and early stage VC market in the UK and then withdraw (as advocated by Lerner, 2010). However, the absence of blockbuster exits, due to the poor exit markets in the post GFC period, has prevented recycling of investment funds and signalling of widespread encouragement of private VCs into these markets (Mason and Brown, 2013). As such there is no evidence of the scheme withdrawing and it is likely to have an increasing presence in follow-on investments upstream into the ‘series A-B’ later phases in order to generate optimal exits (as predicted by Cumming, 2011).
Approach and methodology
Summary of data and survey sources.
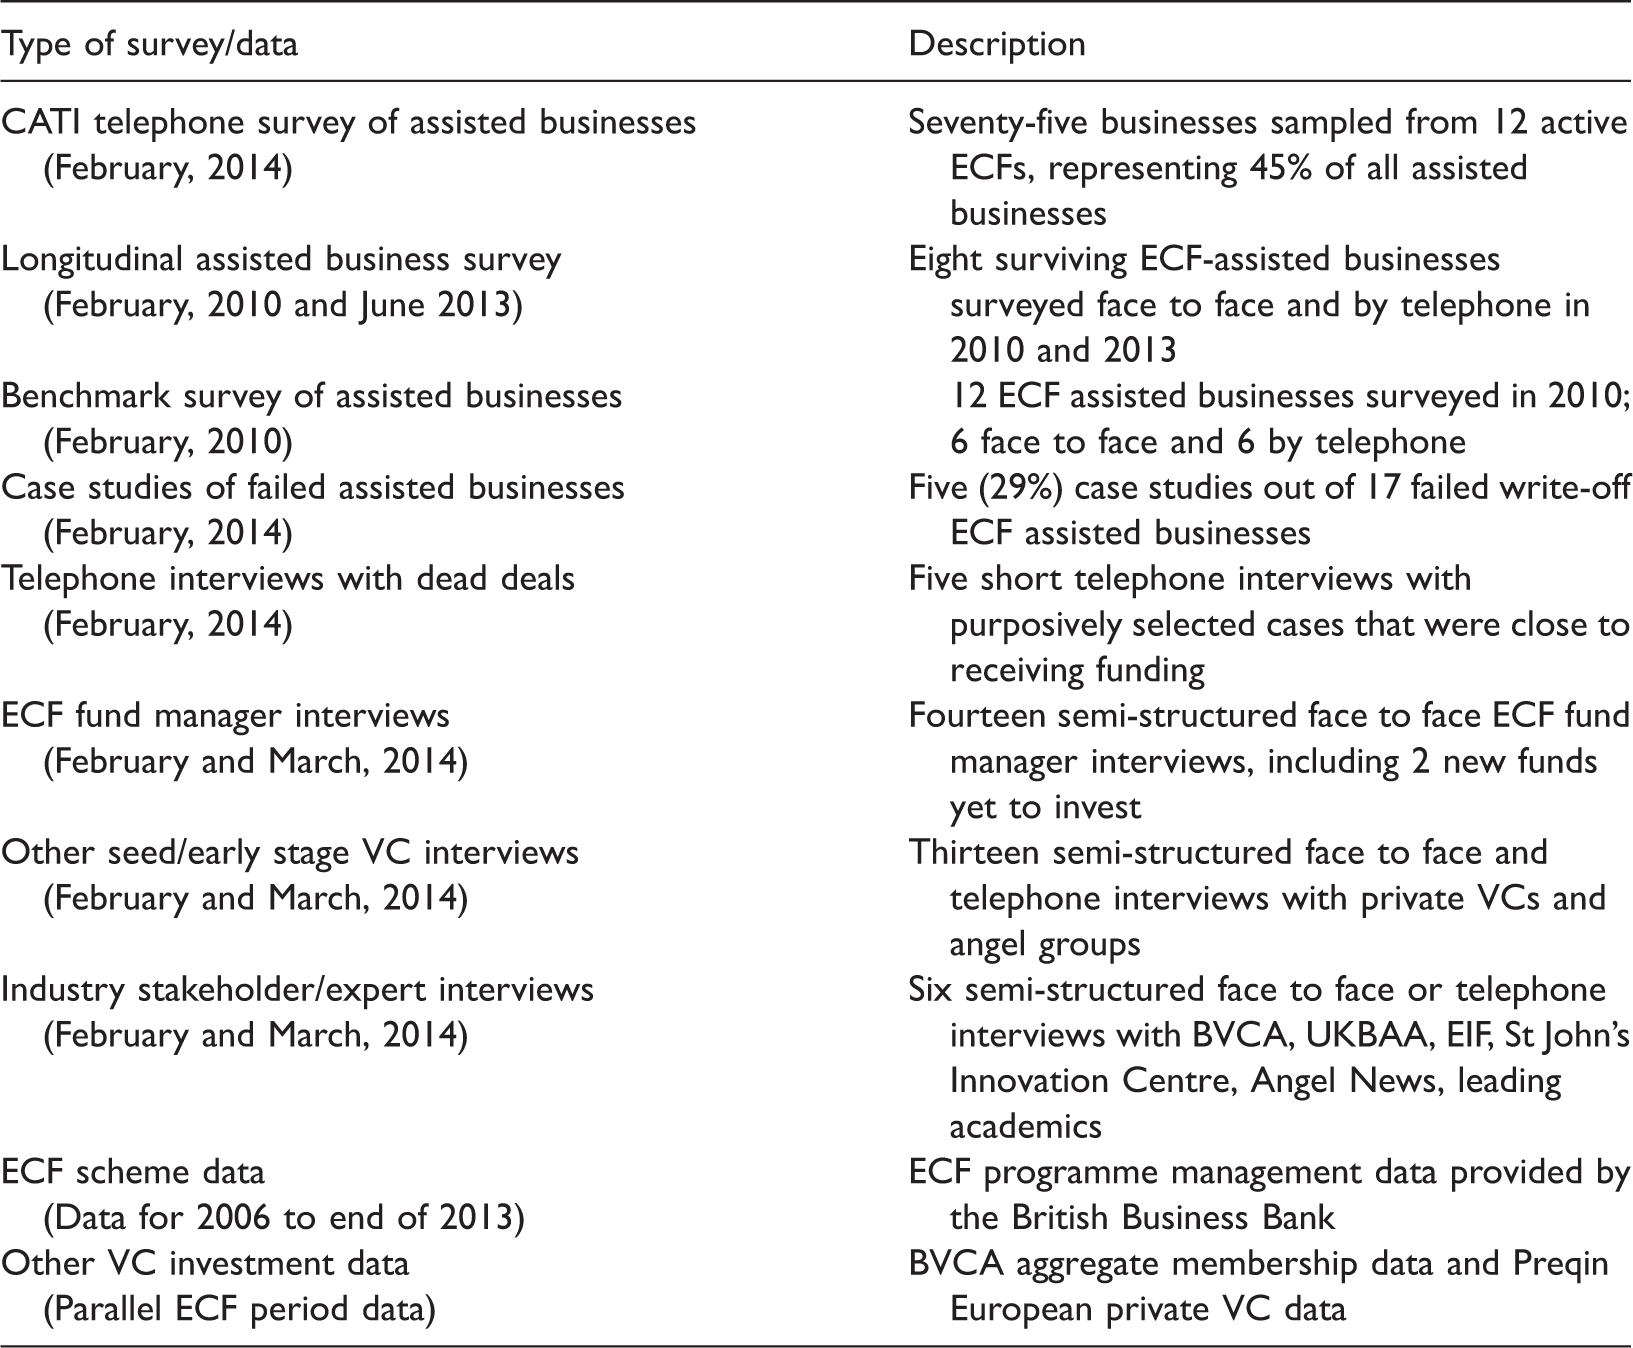
Secondary data review included ECF scheme data (2006–2013) provided by the British Business Bank and contextual parallel timescale VC industry data from the UK and Europe, drawn from the British Venture Capital Association (BVCA) and Preqin’s private European VC data set. The ECF desk study relates to 166 businesses funded through the first 12 funds operational by the end of 2013. Additionally, surveys were undertaken in February 2014 with assisted and unassisted applicant businesses, ECF fund managers, other UK seed and early stage investors, and industry stakeholders to provide triangulation of robust supply-side and demand-side data (Brewer and Hunter, 1989). A caveat is the interim, largely cross-sectional, nature of the research, at a stage when even the older funds operating for up to eight years have yet to experience their plum stellar exits, which typically take place later (Wiltbank, 2005). However, it has been possible to obtain a highly representative sample of both demand- and supply-side data and cross section of stakeholder viewpoints.
A survey of 75 ECF recipient businesses, covering 12 active funds representing 45% of the scheme’s portfolio businesses, was undertaken using CATI recorded telephone interviews 9 with senior managers. Surveyed businesses were randomly selected being restricted only by survey time frame constraints and requests from fund managers that portfolio businesses that had exited, closed or were undergoing exits should be excluded (representing 30 recipients). There were also 23 refusals, with the owner-managers of the remaining 38 businesses being unobtainable for interview within the survey time period of four weeks in February 2014. Representativeness tests, Mann–Whitney two-tailed tests, reveal no significant differences by sector, stage and region between the overall and surveyed samples, noted in Table 2. Stage analysis adopted in the study complies with the standard BVCA definitions (Appendix 1), adopted by the British Business Bank. Survey piloting on five businesses ensured effective questioning and routing (Patton, 1990). Interviews took 30 minutes on average, covering a series of mainly closed pre-coded questions, supplemented by strategic open questions to explore explanations and processes. Questions addressed are: business profile (e.g. employment size, sector, stage, location); external financing history and requirements; reasons for seeking ECF; ECF leverage, additionality, displacement and attribution to post funding business performance (HM Treasury, 201310); exit timetables and strategies. Additionally, five case studies were undertaken with failed ECF business write-downs, and supplementary counterfactual data are drawn from short telephone interviews with five ‘dead deals’ where applicants did not receive ECF finance.
Longitudinal telephone survey work was undertaken with eight surviving ECF recipient businesses between 2010 and 2013 (representing one fifth of the ECF business portfolio in 2010) and benchmarking reference is made to the BIS (2010) early assessment survey of 12 ECF recipient businesses (Marshall and Rossman, 1999).
In parallel, in early 2014, supply-side interviews were undertaken face-to-face or by telephone with fund managers at all 14 current ECFs 11 (including two new funds yet to invest), using a semi-structured interview approach. These were supplemented by 13 interviews with other private VC, Venture Capital Trust (VCT) and angel capital group fund managers operating in the UK seed and early stage equity markets along with six interviews with industry stakeholder experts including the BVCA, UK Business Angel Association (UKBAA), European Investment Fund (EIF), and St John’s Innovation Centre, Cambridge. These interviews focused on the role and effectiveness of delivery of the ECFs and were recorded, transcribed, and checked by respondents to correct errors (Miles and Huberman, 1994). Collectively, they provided an extensive contemporary assessment of the UK’s seed and early stage equity market and ECFs’ current and likely future impacts.
ECFs’ impacts on assisted businesses
Drawing mainly on empirical survey evidence collected in February 2014, the paper now examines the ECFs’ impacts on assisted businesses, alongside some counterfactual evidence drawn from unsuccessful ‘dead deals’.
Meeting financing requirements
ECF portfolio company investment distribution compared with BVCA members.
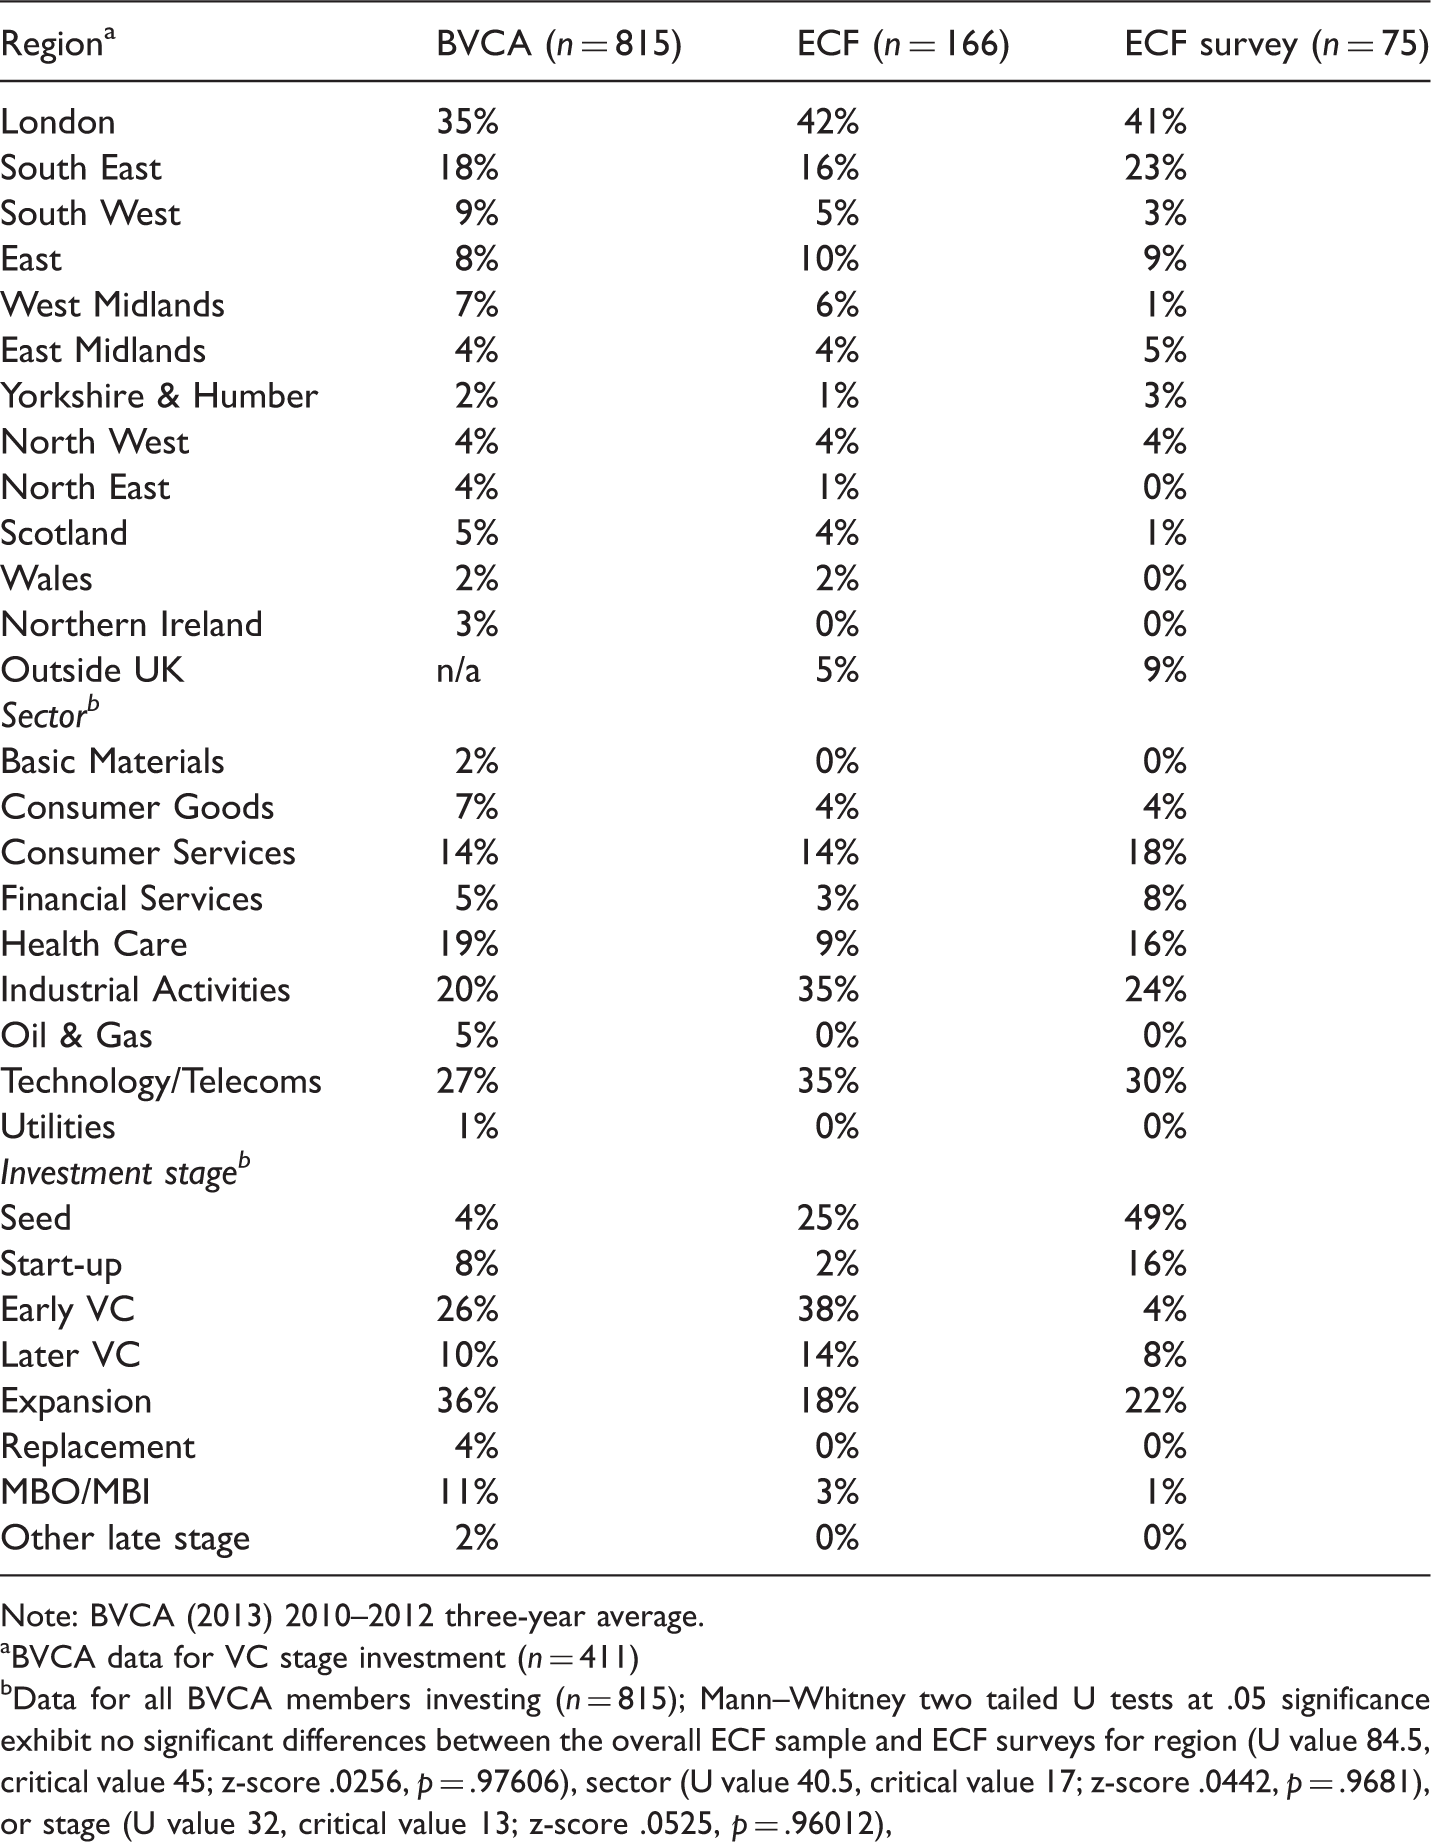
Note: BVCA (2013) 2010–2012 three-year average.
BVCA data for VC stage investment (n = 411)
Data for all BVCA members investing (n = 815); Mann–Whitney two tailed U tests at .05 significance exhibit no significant differences between the overall ECF sample and ECF surveys for region (U value 84.5, critical value 45; z-score .0256, p = .97606), sector (U value 40.5, critical value 17; z-score .0442, p = .9681), or stage (U value 32, critical value 13; z-score .0525, p = .96012),
Main purposes and uses of ECF finance.
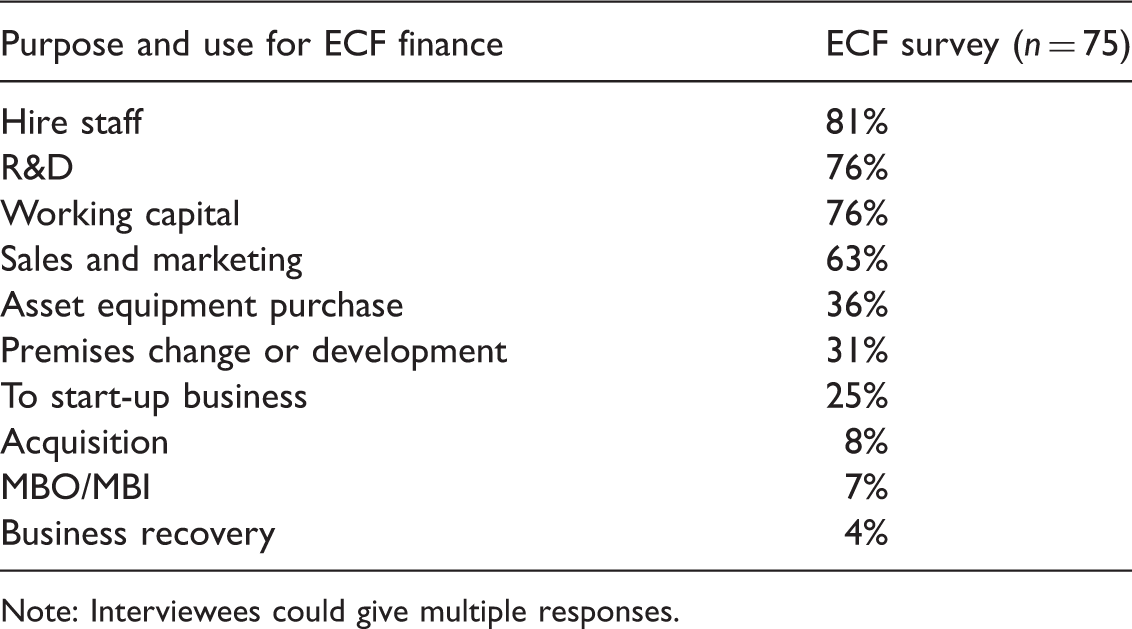
Note: Interviewees could give multiple responses.
ECF investments cover seed and more substantive early stage ‘series A’ and ‘B’ rounds, ranging from £20,000 seed investment to a share of a £9 m ‘series B’ early commercialisation round, with a mean of £964,000, and supplying 90% of the amount applied for. Average ECF shareholdings were 19%, ranging from 4% to 60%, reflecting the high proportion of early stage investments where business valuations were relatively low. The shift towards seed and earlier stage investment by post 2010 ECFs has resulted in average recipient business funding falling from £1.14 m pre-2010 to £547,000 post-2010.
Half of the surveyed recipients applied for alternative funding immediately prior to their ECF application. This was proportionally lower amongst post GFC recipients (42% compared to 59% pre GFC), suggesting increasing scarcity of suitable alternative financing. They mainly approached equity sources, with half accepting offers. A further one in 10 (seven cases) rejected offers, preferring the fund managers and growth opportunities ECF offered. Some managers suggested “alternative early stage corporate VC would be restrictive in terms of product and market development” stressing the “meeting of minds” required for equity investment (Baldock et al., 2015). Only 7% applied for bank finance, none since 2010. It was mainly “out of the question”, as the businesses were too risky, being early stage without a trading track record of at least two years.
Although ECFs are not required to lever additional private funding, their initial investments typically represented half of the overall funding round. Just 2% was duplicative, where managers considered additional funds were raised “instead of ECF”, and they attributed almost half (46%; 1:0.46 ratio) as levered in by ECF. Post 2010, this ratio rose to parity, mainly through angel and VCs syndication for very early stage investments, supporting Hopp (2010) and Hopp and Rieder’s (2011) syndication thesis.
Follow-on funding
Two-thirds (67%) of managers forecast follow-on investment requirements within the next year; including 83% of those funded since 2010. Requirements range from £100,000 for working capital to £20 m of private equity to fund substantial export growth in a life science business, prior to an IPO. Follow-on investment requirements are substantial (mean £3.9 m, median £3 m) to ensure growth momentum through early marketing to establish (often global) market leading positions. Other recent research (Baldock et al., 2015; Mason et al., 2013; North et al, 2013) suggests that timely follow-on funding is crucial to securing market primacy and business growth. Most (75%) would seek instititional VC and private equity, but around one-third will seek further ECF funding, due to insufficient trading record or profitability to attract debt or private equity finance. A clear benefit of ECF involvement was that 92% of the managers were more confident in their ability to raise future finance.
Post GFC, ECF fund managers are making far greater provision for retaining sufficient funds to provide follow-on funding for their better performing portfolio businesses. This is particularly evident amongst more recently established seed and early stage ECFs. Notably, Passion Capital’s accelerator model initially invests small amounts into a large number of businesses, holding back funds to enable follow-on funding of more substantial size investments to better portfolio business performers, conforming to Markowitz’ (1952) principles. However, ECFs have been hampered by EU state aid restrictions, particularly the 10% of fund size limit on individual portfolio business investments. This has resulted in one in 10 surveyed recipient businesses being “considerably constrained ” in raising follow-on funding, supporting recommendations for larger more flexible GVC funds (Rigos, 2011; Technopolis, 2011).
Additionality or displacement?
Examples of current uk private equity fund activity.
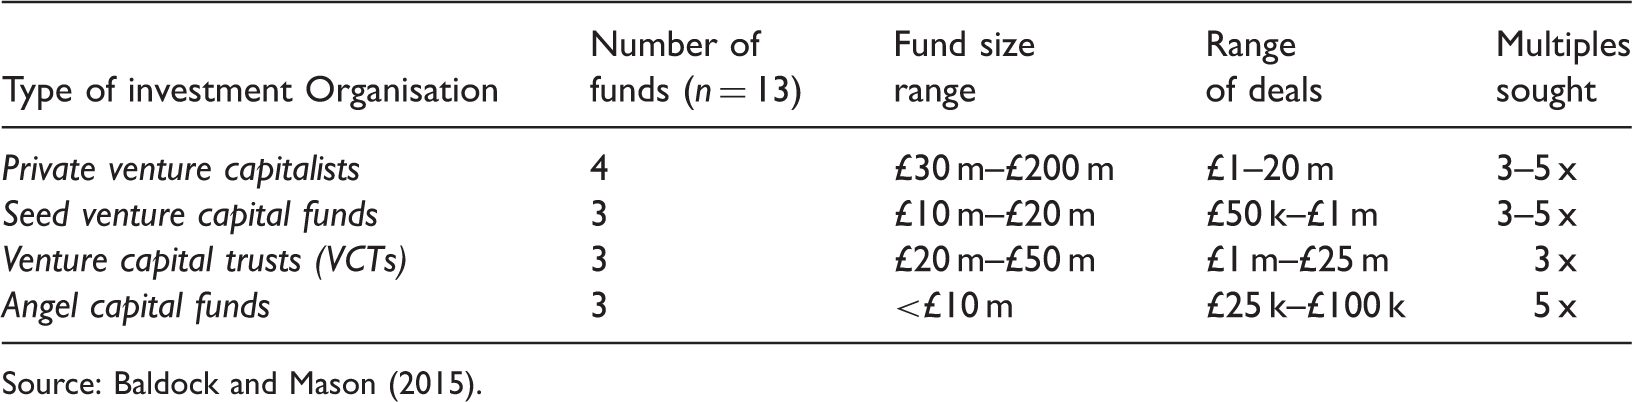
Source: Baldock and Mason (2015).
Key ECF interim investee business performance measures.
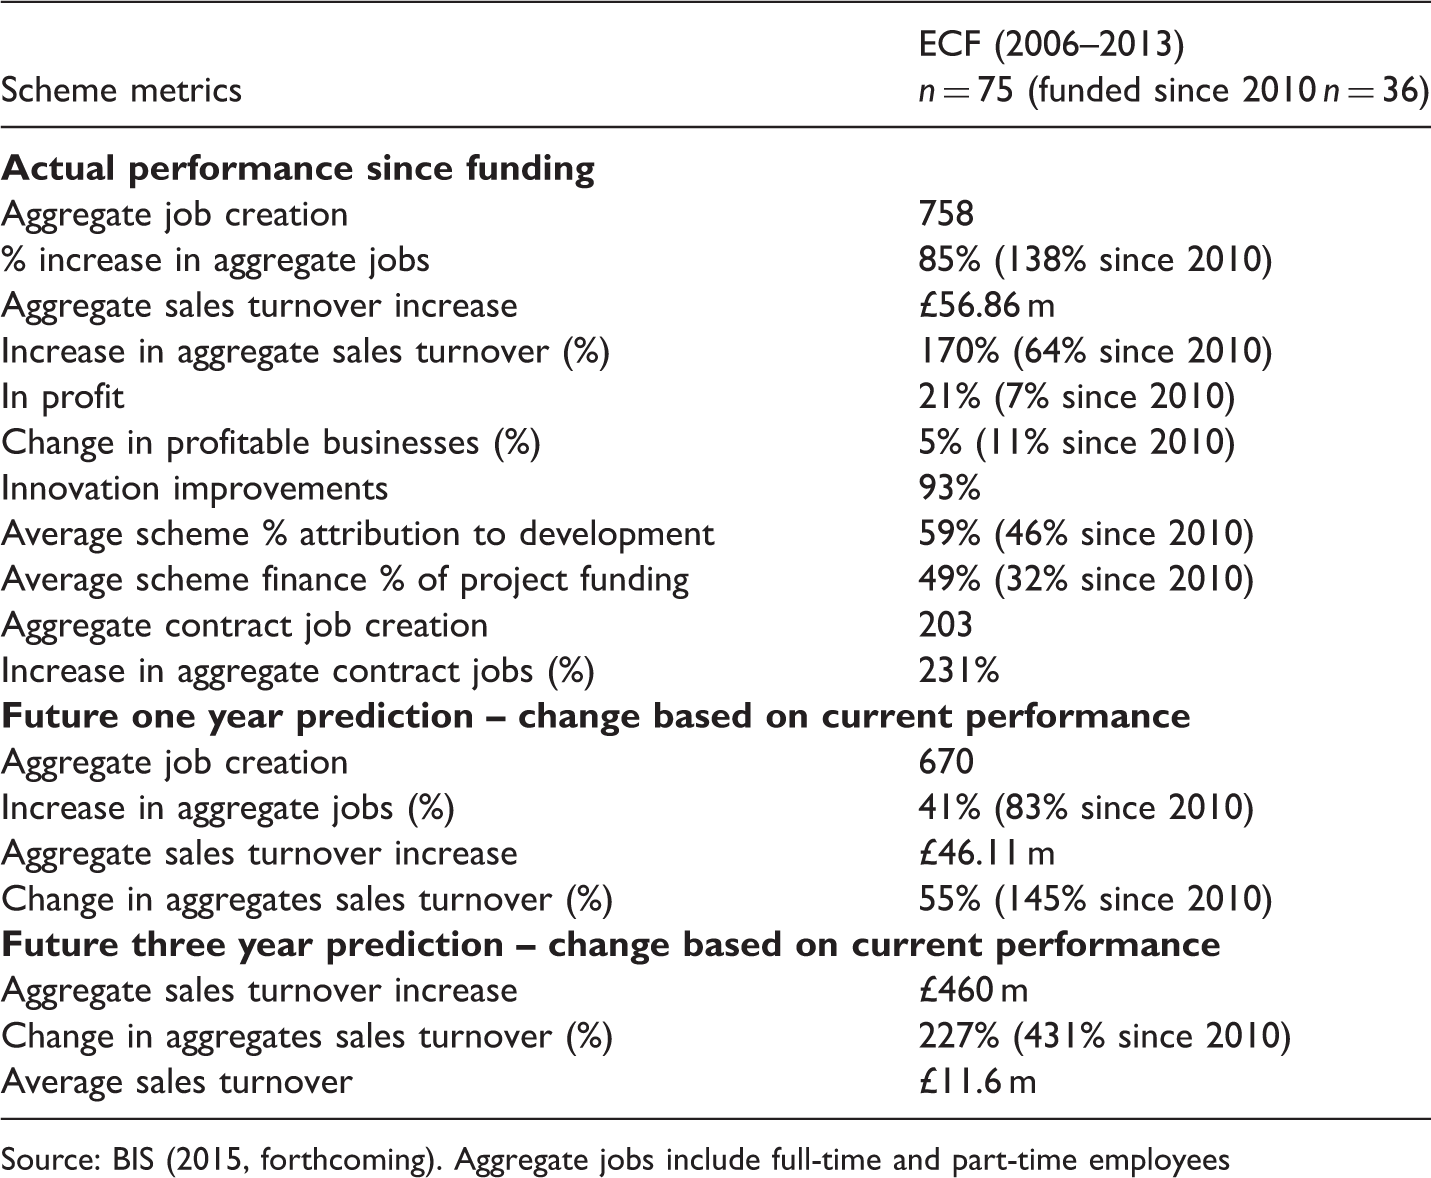
Source: BIS (2015, forthcoming). Aggregate jobs include full-time and part-time employees
The choice of VC and fund manager, or angel investor is also crucial in achieving a “meeting of minds” alignment of business development aims and appropriate level of input into areas such as financial management, sales and marketing including export market developments, networking contacts and linkages to further funding (Baldock et al., 2015). This supports the Gompers et al. (2010) postulation of better performing VCs possessing niche management and sector skills to deliver successful investment outcomes. Conversely, our five case studies of ECF write-off investments demonstrate that a breakdown in the entrepreneur – fund manager relationship is a key factor in failure.
Fund performance: interim assessment limitations
Interim assessments may occur too soon to adequately assess fund performance. Wiltbank (2005) recognised early exit sales are often poorer performing ‘lemons’, whilst ‘plum’ best performers typically take far longer to exit. Lerner (2010) also advocates a patient, long game, approach which fund manager feedback supported. First, the top performing 10% of 10 × plus investment multiple portfolio companies which determine the overall success of funds can take 10 years to mature. Second, the GFC typically set back older portfolio investments by two years, lengthening average exit times to 5–7 years, a finding supported by Baldock and North’s (2016, forthcoming) UK GVC longitudinal study 14 and CfEL’s 15 (2013) fund managers report. This underlines the need for flexible fund management timescales (Lerner, 2010) and favours the VCT and ACF evergreen approaches over ECFs’ LP agreements.
GFC impacts meant that older, pre-2010 ECF fund managers, initially aiming for at least 3 × multiples now recognised they would do well to achieve between 2 and 3 × . Most would seek two-year fund extensions to manage their stronger performing portfolio companies to optimal exit points, typically via trade sales. Internal rate of return (IRR) data fell below expectations, supporting the view that, even after 6–8 years, it was still too early to adequately evaluate fund performance. Benchmarking against Preqin’s 16 equivalent aged European private VC funds offered limited value since these were self-reported, potentially by the better performing, faster maturing, later stage focused funds. BVCA member data revealed a median negative return on investment (−1.1%) for 38 funds established between 2002 and 2008. Further benchmarking against the Scottish Investment Bank’s (SIB) portfolio of 378 companies, including the slightly older established (2004) Scottish Co-investment Fund 17 indicated similarly small numbers of exits (8 in 2013–2014, compared with 13 recorded ECF exits). These findings underline the need for more time for funds to mature after the GFC. Indeed, each ECF fund manager forecast one or two portfolio companies that could achieve 10 × multiples, but these exit returns would not be taking place for several years.
Economic outputs
More satisfactory economic development evidence came from the survey of current portfolio business performance outputs and projections, the fund managers’ caveat being that portfolio business managers’ projections are optimistic and rarely achieved (BIS, 2010, 2012). Table 6 compares the actual performance of the 75 surveyed ECF recipient businesses since initial funding until the time of interview in early 2014. Figures in parenthesis represent those businesses funded since 2010, where it is helpful to contrast their performance with the overall survey. The table provides key economic impact insights for policymakers relating to employment, income generation, innovation, and scheme attribution. Data come from a compliant survivor subset, but positive and negative response bias is likely to be controlled by the omission of successful exits and unsuccessful write-offs and the highly significant (>.05 level) representativeness of the survey sample (Table 3).
Surveyed managers assessed their ECF funding attribution to subsequent business development (59%) as proportionally greater than its financial contribution to external project funding received (49% for the relevant funding round). This suggests that ECF investment generated at least a 10% net positive catalytic impact on business development (i.e. jobs, sales, profits, innovation) to date (this could be higher if follow-on funding was subsequently received from other sources). The lower attribution proportion (46%), but higher positive net impact (14%), amongst ECF recipients since 2010 reflects newer ECFs’ increase in syndication (spreading investment risk and increasing investor skills) producing lower proportional ECF funding contribution in seed and early investment rounds post GFC (Hopp, 2010), resulting in median ECF investment after 2010 of £255,000, with median additional funding of £550,000 (a 1:2 ratio of newer ECF to other external funding, compared with the overall scheme ratio of 1:1).
Overall, in terms of both aggregate sales turnover and employment growth since receiving initial scheme funding, surveyed ECF recipients performed well, with employment almost doubling (+85%) and sales turnover approaching trebling (+170%). For the newer ECF recipients (post 2010), the relatively lower increase in sales turnover (+64%), but higher increase in employment (+138%) is indicative of their smaller size (average 5 employees at time of funding) and younger trading age (81% trading less than four years). Almost three quarters (74%) of new employment has been full-time in both older and newer ECFs with scheme attribution to new job generation particularly high (83%), representing an average of 8.5 jobs per surveyed business. A key spillover impact was the rapid parallel growth (+231%) in contract labour (e.g. IT, technical production, sales and manufacturing jobs) demonstrating, alongside 26% growth in new part-time employment, the flexible labour requirements of these businesses to facilitate growth (North et al., 2013). Notably, the vast majority of contract work was UK-based.
Profitability proved more complex to measure as older ECF recipients were taking longer to gain market traction than originally planned. ECF fund managers noted that traditional ‘J’ curve increases in profitability were not yet occurring, with the vast majority of portfolio businesses still languishing in a deep valley of R&D and early commercialisation pre-profit activities.
The vast majority of surveyed ECF businesses (93%) had increased their level of innovation since funding, including new and improved products, services, marketing, and processes. Similarly, 93% experienced management improvements, with 74% improving work practices. ECF fund managers have introduced improved corporate and financial management and strengthened portfolio management teams, either through their board presence as NEDs, or by selective board appointments, notably in sales and marketing. These findings support assertions that VCs can add value to the performance of their portfolio companies (Baygen and Freudenberg, 2000; Gompers et al., 2010), with improved corporate management viewed as crucial to increasing the opportunities for future investments.
Control perspective
A control survey of five ‘dead deals’ were randomly selected from three older ECFs, allowing sufficient time for performance comparison with funded counterparts. They come from circa 15% of applicants reaching interview and negotiation stage, with potentially viable propositions, which do not convert into fund investments (BIS, 2010). Fall-out explanations varied: two withdrew, perceiving themselves too early stage; one preferred an alternative deal; two were rejected based on proposition and due diligence evidence.
Whilst the small control sample is not representative of unassisted potentially viable applicants, it provides a suitably comparable range of sectors (three IT/telecoms, 1 bio-science, 1 recycling) spanning shorter and longer horizon investments, and regions (two Northern regions and three Southern regions). It therefore offers useful policy-off insights when triangulated with other survey evidence. First, four out of five found alternative private equity funding, suggesting that potential duplication was avoided. Second, the dead deal firms generally under-performed those assisted, suggesting that the funds’ selection process was working efficiently. One out of five failed, compared with one out of 10 for assisted ECFs, and another reported that delay in finding alternative funding resulted in 30% slower development than anticipated. This latter finding is indicative of the earlier assessment of surveyed-assisted businesses that the timing of ECF funding for viable business applicants is crucial to their growth. Overall, the four surviving ECF dead deals achieved aggregate 43% sales turnover and 22% employment increases since their applications, compared to 177% sales turnover and 69% employment increases amongst surviving surveyed older ECF portfolio companies.
Triangulating with recipient survey findings, ECFs appear to have selected more viable cases, or offered more timely smarter finance, rather than duplicated any private investor activity.
Forecast performance
Business performance forecasts are subjective. Focusing on probably more accurate near-term one year forecasts substantial aggregate job (+41%) and sales turnover (+55%) growth is anticipated. This is higher amongst newer ECF recipients, suggesting that some will considerably step up early commercialisation activities, with nine businesses predicting annual sales turnover increases between £1 m and £8 m, coming from the information technology, manufacturing and financial services sectors, with two-thirds located in the London-Oxbridge triangle.
The three-year sales turnover forecast indicates the potential value of recipient businesses closer to exit. At this stage, they predict annual average sales turnover of £11.6 m (median £8.6 m). This contrasts to the time of initial ECF funding, when many were pre-trading (60%) and those with annual sales turnover averaged £1.1 m (median £400,000).
Exit strategies
Ultimately, ECFs’ success depends upon exit market conditions, which were reportedly very tough in the UK during the post GFC period (Baldock, 2015). The UK AIM, providing smaller cap business progression into public equity, has shown signs of revival with the notable £120m IPO in Spring 2014 of the Cambridge-based life science company Horizon. Likewise, stellar trade sales, within the recently depressed UK market rather than to US or other international corporate buyers, will increase confidence and establish a more buoyant UK exit market. However, concerns persist that too many UK GVCFs sell their prized portfolio assets under value, because they cannot afford to follow-on fund and retain businesses until they achieve optimum exit size, market traction and sustainability (Baldock and Mason, 2015; Rigos, 2011).
Surveyed ECF fund managers put much greater emphasis on planning their investment exit from the point of initial investment than previously pre GFC, supporting a similar trend found amongst business angels (North et al., 2013). They broadly accept that “…it is no longer sufficient to invest in a good business in the expectation that it will sell itself.” ECF fund managers, alongside portfolio businesses, now invest more time contacting and networking with potential trade buyers and VC investors, with seed VCs particularly keen to work with potential follow-on investors at the full ‘series A’ stage, a point at which they may no longer wish to be lead investor.
There have been 13 ECF exits (8%). Three recent exits were reported in our survey, 18 all being trade sales at multiples between 2–5×. Three-fifths of future exits are expected to be via trade sales, almost one-fifth to private equity takeovers, and under one in 10 by IPO, suggesting continuing perceptions of weakness in the AIM which attracted closer to 20% of VC exits in boom times (BIS, 2013). Importantly for the UK economy, just over half of the managers seeking trade sales expect the business to remain wholly in the UK and a further third expect core R&D to remain. Furthermore, amongst portfolio managers seeking trade sales, most will seek managerial roles in existing (50%) or new (36%) UK companies and those that reinvest (43%) will do so in UK businesses. Overall, this suggests that future funding and IP spin-out development from ECF exit companies will take place in the UK, suggesting considerable benefits from Lerner’s (2010) global free market GVCF thesis.
Failures
ECFs exhibit proportionally low write-down investment failures (10%), raising concerns that fund managers are inefficient in culling poorer performing portfolio businesses and focusing on their star performers. One quarter of older ECF recipients exhibited negative or zero sales turnover change over a median funding period of five years. This can result in sub-optimal fund performance (Markowitz, 1952) diverting fund manager time and investments into “zombie” unsustainable companies. Contrastingly, the emerging ECF seed VC accelerator model appears more ruthlessly efficient, adhering to Lerner’s (2010) private sector-led GVCF vision.
Importantly, the five investment failure case studies demonstrated investment spillover impacts, including managers finding senior industry roles, the retention and redeployment of IP and patent activity, and in some cases the seeds of new business opportunities.
Discussion
Whilst general consensus existed amongst demand and supply side informants that ECFs are addressing the sub-£2 m UK equity gap for young potential high-growth SMEs, with little sign of duplication or displacement, considerable debate remains as to whether they have the scale, profile and reach to make significant and lasting impacts on the wider UK seed and early stage VC ecosystem to deliver their sustainable and private sector led VC aim.
Supply-side informants (particularly industry trade associations and experts) supported holistic VC ecosystem perspectives (Hughes, 2009; Hwang and Horowitt, 2012), suggesting the scheme can make a difference if it forms part of a cohesive government policy addressing both the support mechanisms developing a pipeline of viable young high-growth potential businesses through investment readiness programmes, accelerators and mentors (Mason and Brown, 2013) delivered through the UK government’s Business Growth Service (BBB & BIS, 2015) and a suitable finance escalator supply of appropriate financing instruments. The latter point suggests an important role for the British Business Bank (Mazzucato and Penna, 2014; Van der Schans, 2015) in monitoring and developing more effective design and operation of the ECFs. A key requirement is raising ECFs’ profile (highlighted by fund managers); they are less known than VCTs, particularly amongst financial intermediaries outside of specialist VC networks, underlining Lerner’s (2010) requirement to develop support services (accountants, lawyers, fundraisers). All supply-side informants agreed that it is crucial to develop a suitable exit market, including a functioning IPO public feeder market (Baldock, 2015), because high profile successful exits (lacking during the GFC period) will do most to encourage increasing earlier stage private VC investment.
Fund managers and stakeholder trade associations noted that ECF design has seen increased fund size with greater attention now given to planning follow-on funding and exits. However, they also widely agreed that scheme funds remain too small and require double the £40m size previously recommended (Rigos, 2011; Technopolis, 2011). Larger scale would enable the number and range of investments to meet Markowitz’s (1952) optimum of 30 investments, creating a realistic chance of “backing their most successful portfolio businesses through to large 100 employee plus high profile £100 m plus trade sales or IPOs.” ECF fund managers particularly noted that improved ability to develop scheme second funds would also assist the VC fund development cycle, enabling sizeable follow-on funding, addressing a perceived emerging “series A funding crisis” and supporting Cumming’s (2011) view of successful VC transition to balanced portfolios across stages, potentially offering greater attraction to large institutional (e.g. pension fund) investors that have avoided earlier stage investment post Dotcom (Pierrakis, 2010).
ECFs are designed as feeder demonstrators, to attract high-quality, innovative emerging fund managers with seed and early stage investment track records, enabling fund scaling-up and ultimately to spin-out and attraction of more private VC fund managers into the market, in line with Lerner’s (2010) prescribed approach. Thus far, ECFs have supported early stage VC activity, contributing to the increasing public sector presence in the early stage UK VC market (Mason and Pierrakis, 2013), but as one private VC mentioned, “there is very limited evidence of it spurning independent private VC activity,” due largely to the depressed nature of the post GFC UK market. However, signs of change were emerging, notably in the London market where Passion Capital’s ECF model has encouraged angel capital group and private seed VC activity, assisted by the catalysing effect of increasing seed stage syndication (Hopp, 2010), allied to the attraction of Enterprise Investment Scheme (EIS) and Seed EIS investor tax breaks (HMRC, 2014). Here, it was commented by a trade association that ECFs are “offering a smart money lead in a rapidly developing market.”
Finally, the future development of the enhanced £400 m ECF scheme was widely supported, provided this harnesses the enlarged EU state aid limits. As one private VC noted, “new Super ECFs could attract substantially more private and institutional investment,” better addressing follow-on funding and sustainability issues, also potentially offering the scale of funding to address the Rowlands gap (2009) in longer horizon intensive R&D investment which currently extends upwards of £5 m. This was not addressed by other UK funds as UKIIF was fully invested and the Business Growth Fund was for more established businesses with annual sales turnover of at least £5 m.
Conclusions
Despite continuing suggestions that GVCFs perform more poorly than their private sector counterparts, this paper finds that ECFs have evolved and adapted to meet the challenges of changing UK early stage entrepreneurial financing requirements post GFC. Focusing on assessing scheme impact demonstrates that they are effectively meeting the needs of viable UK seed and early stage equity gap SMEs. First, they have encouraged and stretch funded experienced national and international private-led VCs into UK seed and early stage investment, with little sign of duplication or displacement in addressing the sub-£2 m funding gap. Second, they have increased in size and scale, adopting innovative strategies of inter-regional and international investing, increasing syndication and investor networking, increasing portfolios, spreading risk, and improving planning for follow-on funding and exits. Third, they have generated economic impact; levering investment, attributable to direct and indirect job generation, increased sales turnover and innovation, and improved business management.
However, the ECFs are still a long way from meeting their objective of achieving a legacy of a sustainable private sector-led early stage UK VC market. The combination of further increased size ‘Super ECFs’ and second fund developments enabling follow-on funding and optimal portfolio exits should enhance their profile, notably through successful exits, and encourage increased earlier stage investment from institutional, corporate and private VCs, including ECF fund manager spin-outs. The British Business Bank will have a crucial role in overseeing this process and developing a more cohesive entrepreneurial financing ecosystem.
Our study has single scheme, cross-sectional limitations, undertaken during scheme mid-term at a time when the GFC had severely disrupted fund performance. A clearer view will emerge over the next three years as early pathfinder ECFs complete their maximum 12-year cycle. However, this paper establishes a robust framework for future scaled-up and longitudinal research, including the potential for international GVCF comparator studies.
Footnotes
Acknowledgement
The author wishes to thank three anonymous referees and the editor for their helpful guidance. This paper draws from a study of the ECFs commissioned by the UK Department for Business, Innovation and Skills and the British Business Bank. The views expressed are entirely those of the author.
Declaration of conflicting interests
The author(s) declared no potential conflicts of interest with respect to the research, authorship, and/or publication of this article.
Funding
The author(s) disclosed receipt of the following financial support for the research, authorship, and/or publication of this article: The research was partially funded by BIS/BBB commission.