
Abstract
Climate change and the continual rise in cooling demand means more efficient and environmentally friendly refrigeration technologies are required more than ever. One attractive route to reducing future demand is to improve adsorption refrigeration technologies based on natural refrigerants such as ammonia. The choice of ammonia adsorbent plays an important role in achieving improved refrigeration efficiency and suitable operating conditions. This paper reports a detailed study on the role of pore size on thermal efficiency, desorption temperature and cooling capacity of ammonia–carbon adsorption refrigeration systems. Systematic Monte Carlo simulations were conducted to study ammonia adsorption in carbon slit-pores with pores sizes ranging from 0.5 nm to 3.0 nm. Simulations were carried out at temperatures between 0°C and 50°C and pressures up to 15.0 bar. It is found that nanoporous carbon with very small pore sizes is not a good adsorbent for thermally efficient adsorption refrigeration systems. However, carbon mesopores can provide higher refrigeration capacities and coefficients of performance together with lower desorption temperatures, thus offering the possibility of relying on low-grade thermal waste heat to drive the refrigeration process.
Keywords
Introduction
As global temperatures continuously rise due to climate change there is an increasing demand for more sustainable cooling technologies (Afify and Sweatman, 2024; Delay, 2015; Davis et al., 2021). Current refrigeration systems use synthetic fluorinated gases (F-gases) which are powerful greenhouse gases with higher global warming effects (Afify and Sweatman, 2024; Delay, 2015). According to recent UK regulations, these synthetic gases need to be replaced by natural refrigerants such as ammonia (Afify and Sweatman, 2024; Yang et al., 2021). There are three main types of cooling technologies: vapour compression, adsorption, and hybrid refrigeration systems (Nikbakhti et al., 2020; Zeng et al., 2017; Palomba et al., 2019; Srikhirin et al., 2001; Kang et al., 2020). The great advantage of adsorption refrigeration systems is that they can be driven by low-grade thermal waste energy (Nikbakhti et al., 2020; Zeng et al., 2017; Palomba et al., 2019; Srikhirin et al., 2001; Kang et al., 2020) and use natural refrigerants such as ammonia, water, ethanol, and methanol, which have very low global warming and ozone depletion potentials compared to F-gases (Sah et al., 2016). A review of the working principles of a basic adsorption refrigeration system and how to design this system starting from Monte Carlo simulation results is provided in our previous paper (Afify and Sweatman, 2024).
In adsorption refrigeration systems, the choice of the adsorbent–adsorbate working pair is of great importance. Ammonia as a natural refrigerant has many advantages when compared to water, methanol and ethanol. For example, ammonia is stable at temperatures up to 200°C which makes it usable in a wide range of driving temperatures (Afify and Sweatman, 2024; Hu, 1998). Compared to water, methanol and ethanol, ammonia can also be used at higher pressures which can lead to good mass transfer performance. In adsorption refrigeration systems the choice of adsorbent is equally import. There are three main types of solid adsorbents used by adsorption refrigeration systems: physical, chemical and hybrid adsorbents.
Physical adsorbents such as activated carbon, alumina, silica (Zeng et al., 2017; Wang et al., 2010) and zeolites (Kang et al., 2020; Liu and Aika, 2003; Ouyang et al., 2021), generally exhibit fast mass transfer and high mass uptake of ammonia, but they can suffer from poor thermal conductivity (Zeng et al., 2017). Chemical adsorbents, on the other hand, such as CaCl2 and MgCl2 provide high adsorption capacities, but they tend to swell and agglomerate which can result in poor heat and mass transfer performance (van der Pal and Critoph, 2017). To overcome the limitations of physical and chemical adsorbents, composite or hybrid adsorbents have been proposed. For example, CaCl2 was impregnated in porous alumina (Sharonov et al., 2006), activated carbon (Goshayeshi et al., 2015) and graphite (Li et al., 2010). These composite adsorbents have shown higher system performance and enhanced heat and mass transfer (Zeng et al., 2017).
Kang et al. recently reviewed ammonia adsorption in many porous materials for gas removal applications (Kang et al., 2020). Unfortunately, the temperatures mentioned in their review were above 20°C which is not sufficiently low for refrigeration applications. In a previous paper (Afify and Sweatman, 2024) we used Monte Carlo simulations to study adsorption of ammonia in several zeolite frameworks at temperatures between −50 and 50°C and pressures up to 4.0 bar. We showed that zeolites with significant mesoporosity could be very good ammonia adsorbents for adsorption refrigeration applications since their use allows for large refrigeration capacities and tuneable operating conditions with good coefficients of performance (COP). As a low-cost alternative to such zeolites, in this work, we use Monte Carlo simulations to evaluate ammonia adsorption in nanoporous carbon for adsorption refrigeration applications. The study of ideal graphitic pores with fixed pore widths allows us to study and isolate the effect of pore size on refrigeration performance.
Computational details
In this section, we describe preparation of our initial carbon slit-pore configurations, selection of force fields, and Monte Carlo simulation procedure. Each carbon slit-pore is composed of two graphite walls spaced in the z-direction. Each wall is composed of 14 × 8 × 1 (3.4 nm × 3.4 nm × 0.671 nm) graphite unit cells in the x, y and z-directions corresponding to two layers of graphene in each wall. We employed chemical pore widths of 0.5, 0.6, 0.7 0.8, 0.9, 1.0, 1.5, 2.0 and 3.0 nm. We define the chemical pore width to be 0.24 nm less than the physical pore width between atom centres in the inner graphene layers. For all simulations, we imposed periodic boundary conditions only in the x- and y-directions. Thus, all the studied slit-pores were not periodic in the z-direction.
Here we provide information on the force fields we employed to describe ammonia–carbon interactions. We used the ammonia force field optimised by Eckl et al. (2008). When benchmarked against several ammonia models this force field was found able to predict experimental densities and pair distribution functions of ammonia liquids at a wide range of temperatures and pressures with reasonable accuracy (Afify and Sweatman, 2024). For the carbon adsorbent, we used parameters often employed with the Steele potential (Steele, 1973). This potential has previously been intensively used to study adsorption of many gases, including ammonia, by carbon pores (Birkett and Do, 2006; Zeng et al., 2018; Zeng et al., 2016; Herrera et al., 2008). Cross-interactions are generated via the usual Lorentz–Berthelot rules. Table 1 reports the Lennard–Jones parameters and partial atomic charges for each type of atom. Carbon atoms in the slit-pore walls were fixed in place during Monte Carlo simulations. We treated ammonia molecules as rigid units and excluded their intramolecular interaction energy from total energy calculations. This allowed us to obtain pure ammonia–carbon intermolecular energies which are very useful for isosteric heat analysis.
Lennard-Jones parameters and partial atomic charges of atomic interactions.

Lennard-Jones parameters and partial atomic charges of atomic interactions.
Grand canonical Monte Carlo (GCMC) simulations were carried out using the Cassandra Monte Carlo code (Shah et al., 2017). All interactions were cut-off at a distance of 1.2 nm, being constrained to half of the box size in the z-direction. For samples with small pore widths, we added two extra layers of graphene to each wall so that we are able to use the same cut-off for all samples. The interaction of these extra graphene layers with nitrogen atoms in ammonia was cut so that they do not interact in any way with ammonia molecules within the pore; their purpose is simply to prevent the grand-canonical insertion of ammonia molecules outside of the slit pores. We tested this procedure on the samples with large pore widths and confirmed that the presence of these extra layers does not have any effect on ammonia uptake or the isosteric heat. Long-range electrostatic interactions were calculated using the Ewald summation method (Fennell and Gezelter, 2006). The probabilities of molecular insertion, deletion, translation, and rotation moves were all set to 25%. GCMC simulations were carried out at temperatures ranging from 0°C to 50°C in steps of 10°C. At each temperature, we employed a range of pressures from 0.02 to 15.0 bar, with step-size increasing with pressure. Each MC simulation comprised 75 million MC cycles at each pressure and temperature, with average properties collected every 1000 cycles.
The isosteric heat of adsorption (Cardenas et al., 2023), Qst, was calculated using the well-known fluctuation method (Afify and Sweatman, 2024; Dickinson, 1984). This method relates fluctuations of the configurational energy U and the adsorbed amount N during GCMC simulations. In Equation (1), T and R are the GCMC simulation temperature and universal gas constant. Ensemble averages 〈〉 are calculated along the entire production simulation trajectory for each sample. Finally, adsorption refrigeration cycles were designed following the same procedure described in our previous paper (Afify and Sweatman, 2024).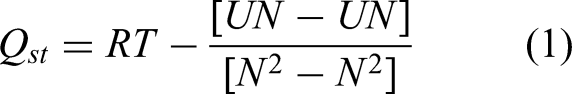
Before reporting the main results, we should first evaluate the statistical quality of our MC simulations. In Figure S1 in Supporting Information, we report ammonia–carbon intermolecular energy and ammonia uptake trajectories for all studied pore widths. The reported plots correspond to maximum pressure of 15.0 bar and lowest temperature of 0°C. We have selected these conditions for demonstration of equilibration since they are the most demanding ones from equilibration point of view. Reaching equilibrium for lower pressures or higher temperatures requires fewer simulation cycles.
From the reported ammonia uptake trajectories in Figure S1(a) in Supporting Information and intermolecular energy trajectories in Figure S1(b) in Supporting Information, we can see that our simulations are well-converged. As expected, at lower temperatures more MC simulation cycles are needed to achieve good equilibration. For this reason, we discarded simulations at temperatures below 0°C since their statistical quality was not reliable. From Figure S1 in Supporting Information, it is also clear that samples with larger pore widths require much longer simulations to reach equilibrium. Based on the trajectories reported in Figure S1 in Supporting Information, it is reasonable to compute final properties from the last 50 million MC cycles.
Adsorption isotherms
In Figure 1, we report ammonia adsorption by carbon slit-pores with different chemical pore widths at different adsorption temperatures and pressures. We see that the isotherm shape gradually changes when we increase the pore size from 0.5 nm (Figure 1(a)) to 3.0 nm (Figure 1(i)). Capillary condensation is evident for pore sizes greater than ∼0.8 nm, and significant surface adsorption is evident for pore sizes larger than ∼1.5 nm.
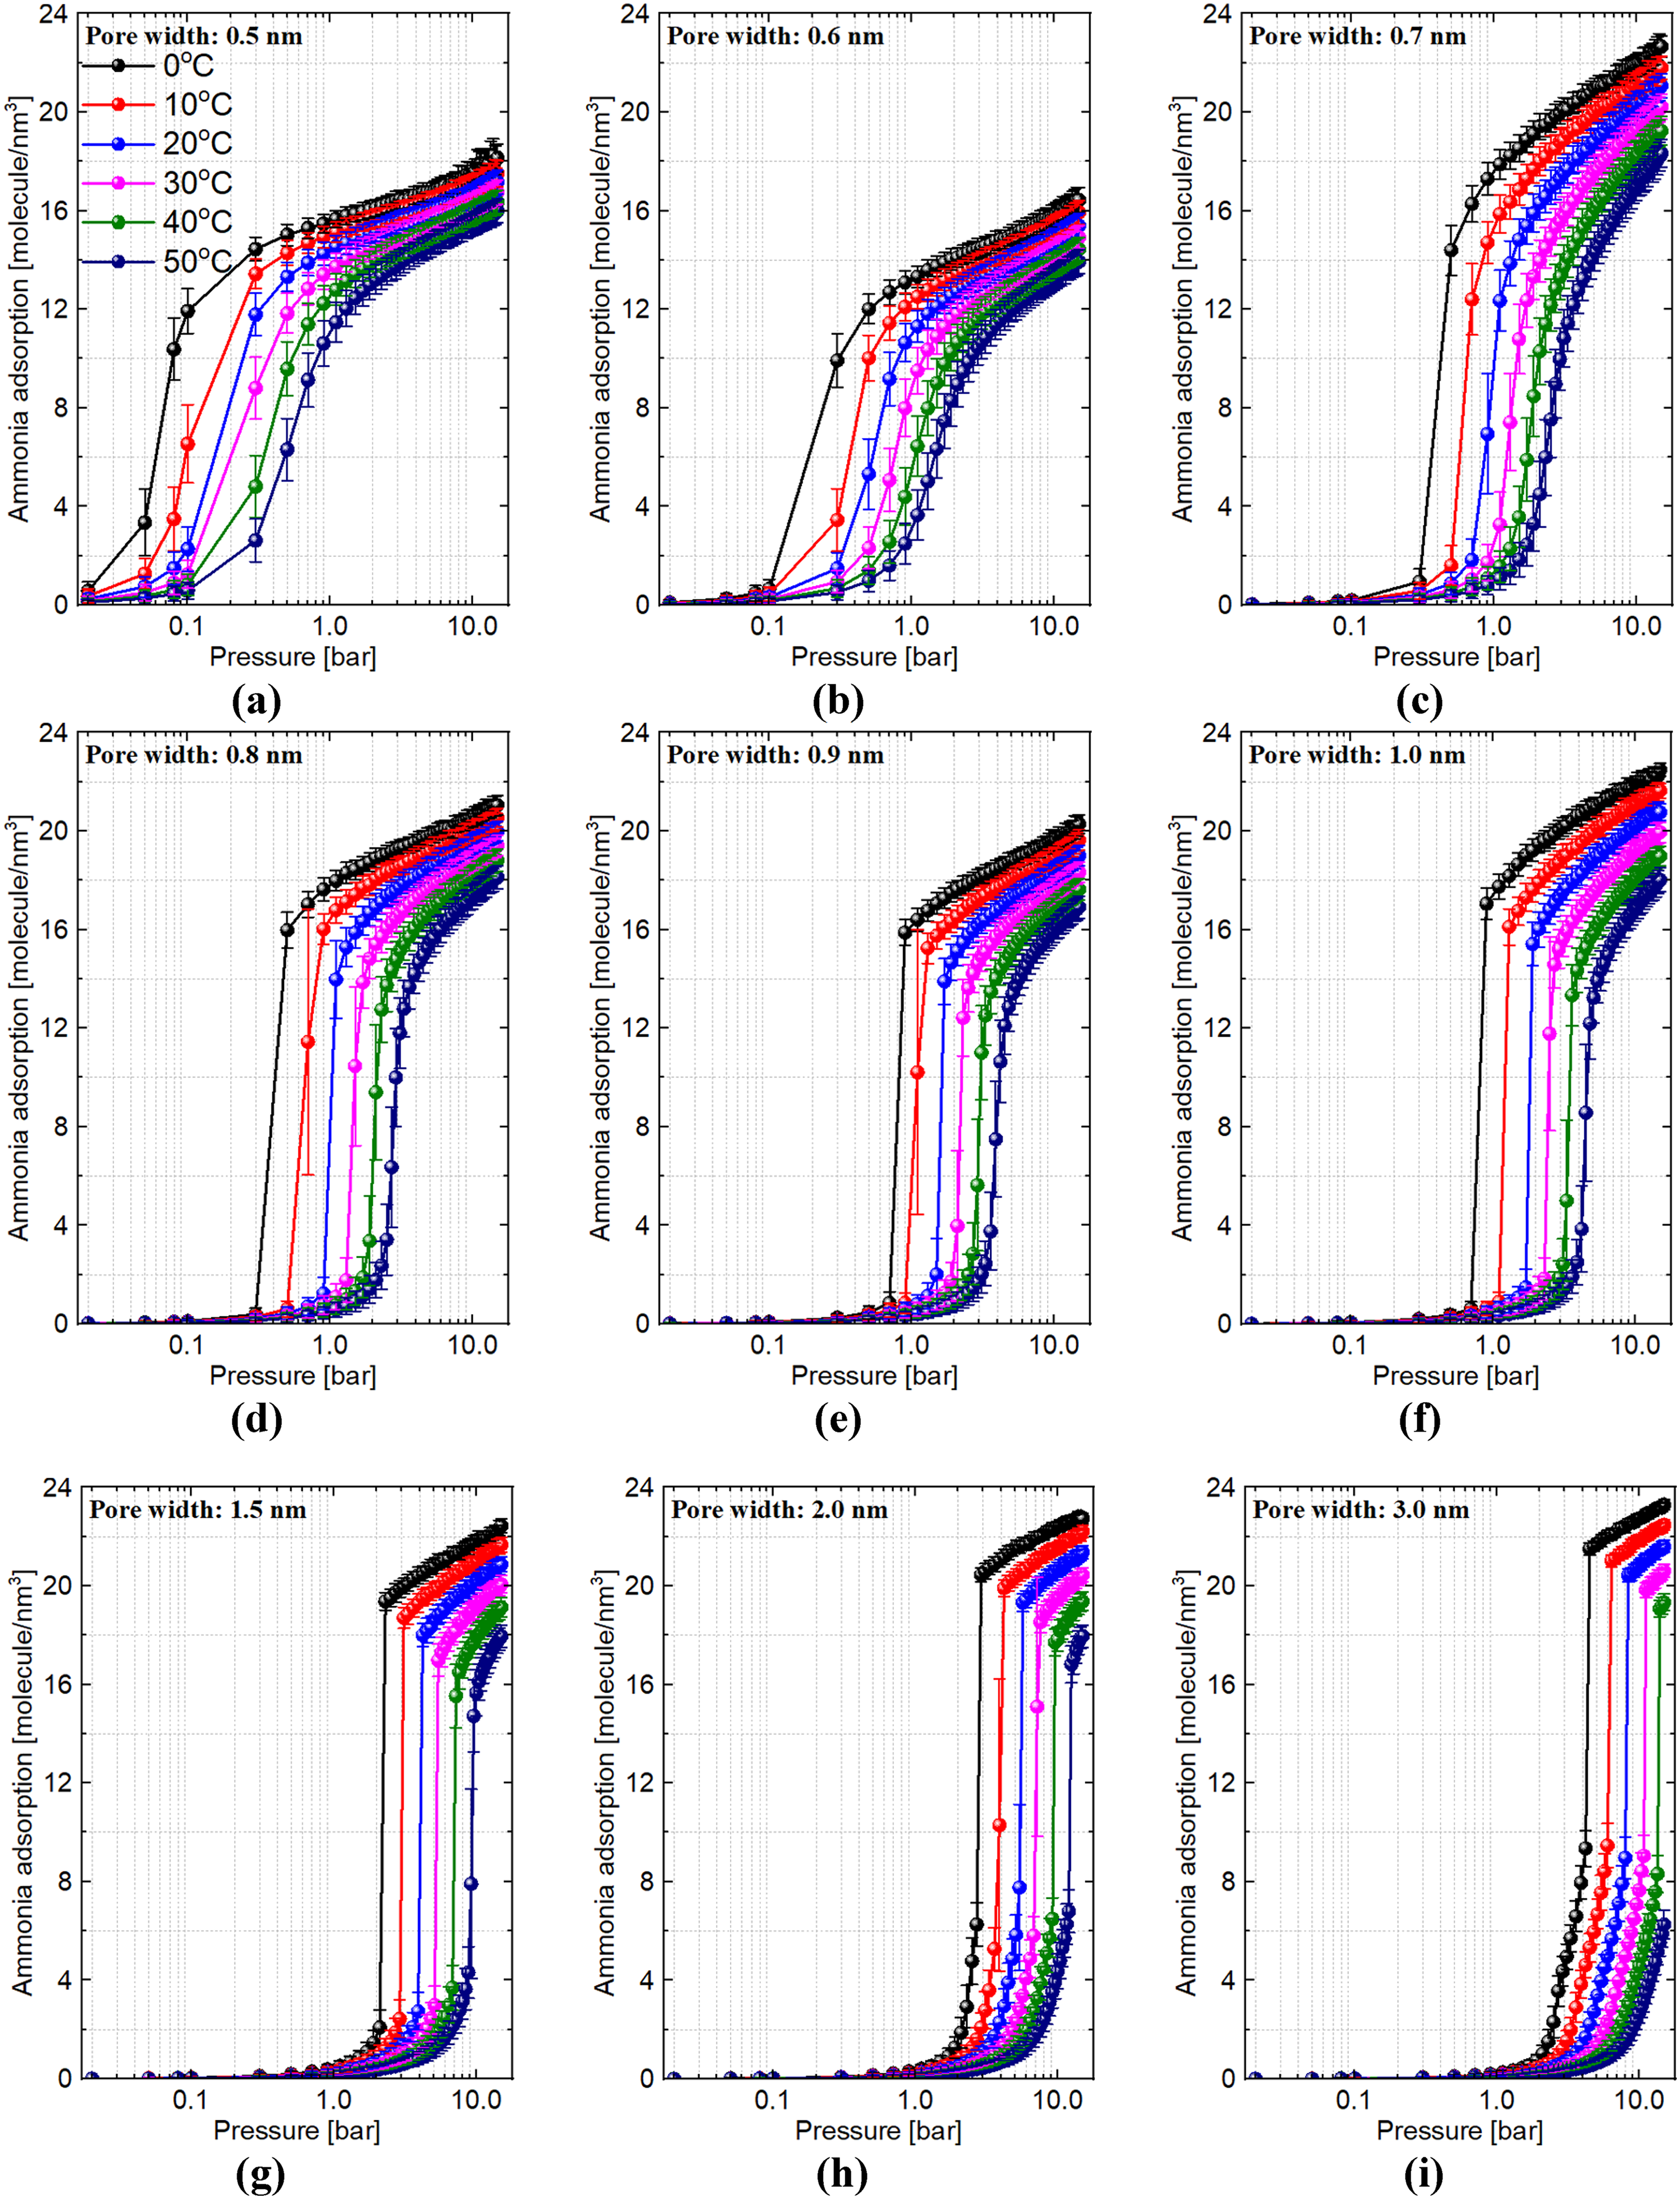
Ammonia uptake by carbon slit-pores with different chemical pore widths at different adsorption temperatures and pressures.
From Figure 1, we can see that graphitic pores with pore width of 0.6 nm have lower adsorption capacity than pores of width of 0.5 nm. Likewise, pores of width of 0.9 nm have lower adsorption capacity than pores of 0.7 nm and 0.8 nm. These results demonstrate the strong preference of ammonia in graphitic slit pores to form a layered structure if the pore width is commensurate with the molecular size. To demonstrate this preference, in Figure 2, we report the final configurations of selected carbon slit-pores saturated by ammonia at temperature of 0°C and pressure of 15.0 bar. In this figure, carbon, nitrogen and hydrogen atoms are represented by the grey, blue and white circles. We removed the outmost carbon layers for clarity.

Final configurations of carbon slit-pores saturated by ammonia at 0°C and 15.0 bar. Carbon, nitrogen and hydrogen atoms are represented by the grey, blue and white circles. The external layers of carbon atoms were removed to save space and improve readability.
At the smallest pore size (Figure 2(a)) the adsorbed ammonia molecules form a well-defined monolayer. If we slightly increase the width from 0.5 nm to 0.6 nm (Figure 2(b)) this monolayer becomes thicker although we can begin to see the formation of two separate layers. If we further increase the pore width to 0.7 nm (Figure 2(c)), two distinct layers of ammonia are now clear. The same behaviour repeats in Figures 2(d–f). When the pore width is increased to 1.0 nm (Figure 2(f)), we can clearly see the formation of three distinct ammonia layers. At larger pore widths such as 2.0 nm (Figure 2(h)) and 3.0 nm (Figure 2(i)), the layer structure disappears, except for layers adjacent to the walls, and the adsorbed ammonia molecules display bulk-like structure.
Capillary condensation is evident in Figure 3, where we report the final configurations before and after capillary condensation for several pore sizes. It is interesting to note the difference in capillary condensation between the cases of small and large pore sizes. In large pores such as 2.0 and 3.0 nm, capillary condensation occurs after a full coverage of the pore walls by ammonia molecules. This explains the adsorption regimes discussed above. As we will see later, when it comes to the design of adsorption refrigeration cycles, we anticipate that the above behaviour will play an important role in controlling the cycle working conditions and thermal efficiency.

Capillary condensation effect in slit-pores with sizes of 1.0, 1.5, 2.0 and 3.0 nm at 0°C. The top and bottom rows show final configuration before and after capillary condensation. Carbon, nitrogen and hydrogen atoms are represented by the grey, blue and white circles. The external layers of carbon atoms were removed to save space and improve readability.
Because some pore widths display capillary condensation, we can expect adsorption hysteresis to occur in these pores. This will manifest during desorption of saturated pores as pressure is reduced. However, since we do not expect hysteresis will significantly affect our refrigeration calculations (see below), which are the focus of this report, we did not investigate this issue further. In practice, hysteresis might affect how a refrigeration cycle is operated, but it should not significantly affect refrigeration performance provided the upper and lower adsorption limits of the refrigeration cycle (i.e., xmax and xmin below) are outside of the range of hysteresis.
Now we move our attention to discussing the obtained isosteric heat results. The isosteric heat of adsorption is an important property for the design of any adsorption–refrigeration process. It is defined as the heat released when an adsorbate binds to the surface of an adsorbent, which effectively measures the strength of adsorbent–adsorbate interaction (Afify and Sweatman, 2024; Nuhnen and Janiak, 2020; Cardenas et al., 2023). Furthermore, the magnitude of isosteric heat of adsorption will determine the desorption temperatures and pressures required to desorb certain adsorbate concentrations.
We found that the isosteric heat depends mainly on ammonia loading, i.e., it does not change significantly with temperature or pressure at the same ammonia loading. This result is evidenced by Figure S2 (Supporting Information), which reports isosteric heat of adsorption computed from trajectories at different temperatures for two selected pore widths. Isosteric heat values at low temperatures are more noisy, due to the fact that energy trajectories are hindered by very small insertion and deletion rates, and the isosteric heat measurement is very sensitive to this. From Figure 4, it is clear that the isosteric heat generally increases with ammonia uptake in all studied pore widths due to enhanced ammonia–ammonia interactions as the pore fills. From these results, we anticipate that larger pores will be more useful for adsorption refrigeration applications, since we should require lower desorption temperatures in this case.

Dependence of isosteric heat of adsorption on chemical pore width and absolute ammonia loading.
The aim of this study is to design ammonia–carbon adsorption refrigeration cycles and to optimise the pore size for thermally efficient refrigeration cycles. A detailed procedure for the design of adsorption refrigeration cycles from Monte Carlo simulation results is explained in our previous study on ammonia–zeolite adsorption refrigeration systems (Afify and Sweatman, 2024). We use the same procedure along with the same performance criteria here.
To design an adsorption refrigeration cycle, we need first to construct a Clausius-Clapeyron P-T-x diagram. A Schematic of the adsorption refrigeration cycle and a sample P-T-x diagram can be found in our previous paper (Afify and Sweatman, 2024). To construct these diagrams, we need to choose appropriate minimum (xmin) and maximum (xmax) ammonia uptake levels for each pore width that define the working capacity. At any given uptake level between these bounds, a plot of ln(P) vs. −1/T will result in a reasonably straight line. This is true even for cases where capillary condensation occurs as is quite evident from Figures 1 and 3, where a large change in ammonia uptake occurs over a very tiny range of pressures. Since our Monte Carlo simulation results display inherent noise, to aid calculations we fit our simulated P-T-x data with perfectly straight lines.
It should be noted that xmax and xmin determine the maximum amount of ammonia in the adsorption bed upon the completion of the adsorption and desorption parts of the refrigeration cycle. For a given adsorbent–adsorbate working pair, the difference between these two values will determine the working capacity and hence the cooling effect and performance of the process.
As shown above, the adsorption isotherms gradually change their shape as temperature increases. Moreover, our simulated data is noisy. Thus, even though we fit straight lines to our simulated data there will remain a small degree of sensitivity of our calculated performance measures to the choice of xmax and xmin. We therefore selected three suitable values for xmin and three values for xmax and took an average over the different xmax–xmin pairs. While the selected values for xmin were the same for all pore widths, the values of xmax were chosen on the basis of maximum ammonia uptake at 40°C for each pore width. Our choices should ensure our results are not affected by hysteresis. The average values of xmin and xmax are reported in Table 2. The ammonia uptake in kg ammonia/kg carbon for carbon slit-pores with different chemical pore widths at different adsorption temperatures and pressures is reported in Figure S3 in Supporting Information.
Effect of the carbon adsorbent pore width on working temperatures, pressures, specific cooling effect (SCE) and coefficient of performance (COP) of an ideal ammonia–carbon adsorption refrigeration cycle.

Effect of the carbon adsorbent pore width on working temperatures, pressures, specific cooling effect (SCE) and coefficient of performance (COP) of an ideal ammonia–carbon adsorption refrigeration cycle.
In our design of refrigeration cycles, we selected a condenser operating pressure (Pc) corresponding to a condenser temperature of 25°C: that is the pressure corresponding to a temperature of 25°C on the experimental ammonia saturation line. For each slit-pore, we also selected an evaporator pressure (Pe) corresponding to a temperature of 25°C on the P-T-xmax line. This combination of parameters (xmin, xmax, Pc and Pe) defines a refrigeration cycle. A detailed description of our design of adsorption refrigeration cycles is provided in our previous paper (Afify and Sweatman, 2024). For each cycle, we completed the design to obtain values for the working temperatures, specific cooling effects (SCE) and coefficients of performance (COP). In Table 2 and Figure 5, we report the effect of carbon pore width on the operating conditions of an ideal ammonia–carbon adsorption refrigeration cycle including evaporator pressure (Pe), desorption temperature (T3), SCE and COP. The reported design parameters represent the obtained average values and associated error bars. As stated above, we do not expect the occurrence of any hysteresis to play any significant role in these calculations.
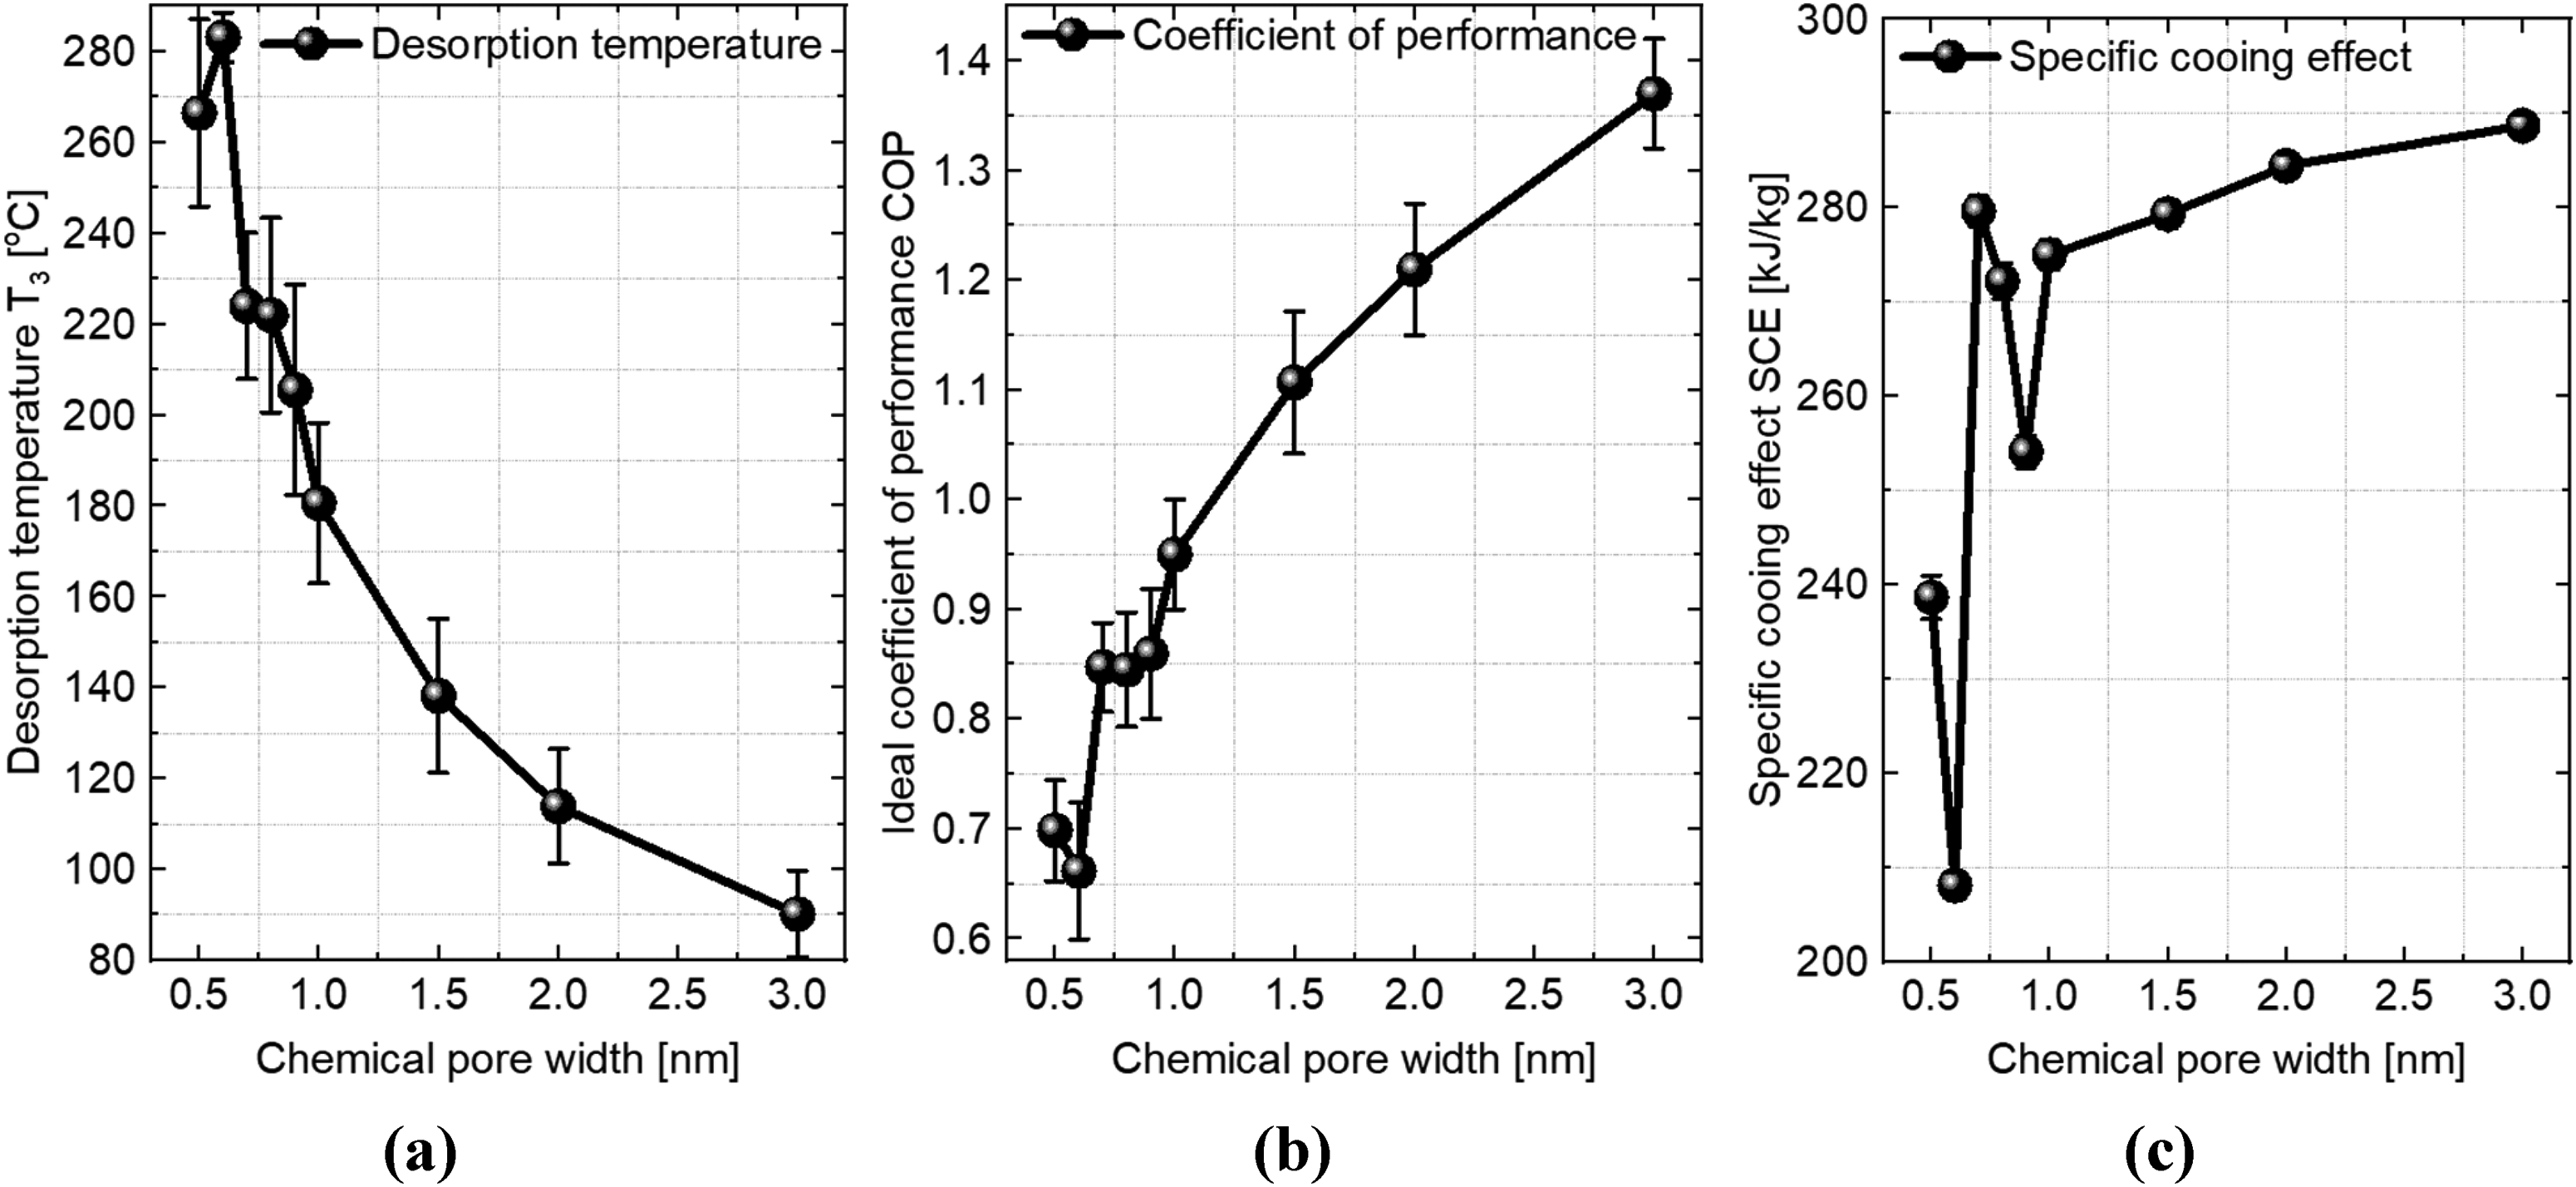
Dependence of an ideal ammonia–carbon adsorption refrigeration cycle parameters on the carbon adsorbent chemical pore width. (a) Desorption temperature T3, (b) coefficient of performance COP and (c) specific cooling effect SCE.
As can be seen in Figure 5(a), the desorption temperature significantly decreases by going from very small to large pore widths. In fact, the desorption temperature decreases from 188.1 ± 19.5°C for a pore width of 0.5 nm to 90.2 ± 9.5°C for a pore width of 3.0 nm. Thus, the use of large carbon pores reduces the minimum temperature required to desorb ammonia. This is an important result, since in this case, we can rely on waste thermal heat at ∼100°C to run an adsorption refrigeration system when the pore width is larger than ∼2 nm. Note that these values are somewhat sensitive to our choice of xmin; choosing smaller values for xmin will result in higher desorption temperatures and vice-versa.
From Figure 5(b), it is also clear that the use of large pores increases the thermal efficiency of the refrigeration cycle. For example, we can double the COP by using carbon pores of width 3.0 nm instead of 0.5 nm. Furthermore, the use of large pores increases the cooling capacity. From the SCE reported in Figure 5(c), we can increase the cooling capacity by about 50% by using pore width of 3.0 nm instead of 0.5 nm.
In Table 2, we also report 50% of our ideal COPs to estimate COPs for actual refrigeration cycles. We first compare our results to ammonia-based adsorption refrigeration systems reported in literature. Zeng et al. have experimentally studied ammonia adsorption in a wide range of activated carbons with a wide range of pore sizes (Zeng et al., 2017). The authors carried out initial adsorption and microstructure characterisation of different activated carbon types including MSC30 with average pore size of 2.31 nm, BAC with average pore size of 0.55 nm and BA with average pore size of 0.52 nm. The authors found MSC30 the most promising adsorbent of ammonia and have singled it out for detailed performance analysis (Zeng et al., 2017). The authors recorded a COP of 0.24, 0.31, and 0.35 at evaporating temperatures of 5, 10 and 15˚C. Our current study agrees with these experimental results regarding the superiority of mesopores for better system performance.
Finally, we compare ammonia–carbon to ammonia–zeolite working pair. In our previous Monte Carlo study, we concluded that the RWY zeolite is a very promising adsorbent for ammonia refrigeration systems. RWY has a pore size of 1.5 nm and porosity of 74.01%. The use of this zeolite at 20˚C ambient temperature resulted in an ideal COP of 1.07, desorption temperature of 71.8 ˚C, and specific cooling capacity of 473.3 kJ/kg. From Figure 5 and Table 2, we can estimate the performance parameters of a carbon adsorption cycle using 3.0 nm pores, taking into account that porosity was assumed to be 50% in all studied carbon slit-pore samples. This ammonia–carbon adsorption refrigeration cycle would have an ideal COP of 1.37 ± 0.05, desorption temperature of 90.2 ± 9.5°C, and specific cooling capacity of 288.7 ± 1.1 kJ/kg. From these results we can see that the RWY zeolite and 3.0 nm carbon-based adsorption refrigeration systems provide similar performance considering the carbon porosity is estimated very roughly. Therefore, it seems that for ammonia refrigeration systems what really matters is the pore size and porosity.
Conclusions
In this paper, we used Monte Carlo simulations to study the effect of carbon pore size on ammonia uptake, isosteric heat of adsorption, and performance parameters of ammonia–carbon adsorption refrigeration cycles. We studied pore sizes ranging from 0.5 nm to 3.0 nm at temperatures between 0°C and 50°C. From the designed refrigeration cycles, we concluded that large carbon pore sizes, i.e., mesopores, are more beneficial, since they are characterised by lower isosteric heats, lower desorption temperatures, larger COP, and larger cooling capacities. Thus, for more efficient adsorption refrigeration systems it is useful to choose adsorbents that are inexpensive, mechanically and thermally stable, with suitable pore structure in the mesopore range. Both zeolite and carbon-based adsorption refrigeration cycles were found to be useful.
Supplemental Material
sj-docx-1-adt-10.1177_02636174241300816 - Supplemental material for Monte Carlo simulation of ammonia adsorption in nanoporous carbon: Optimal pore sizes for adsorption refrigeration applications
Supplemental material, sj-docx-1-adt-10.1177_02636174241300816 for Monte Carlo simulation of ammonia adsorption in nanoporous carbon: Optimal pore sizes for adsorption refrigeration applications by Nasser D. Afify and Martin B. Sweatman in Adsorption Science & Technology
Footnotes
Acknowledgements
We would like to thank the ACCESS Project team members for their collaboration.
Data availability
The data used to support the findings of this study are included in the article. Should further data or information be required, these are available from the corresponding author upon request.
Declaration of conflicting interests
The authors declared no potential conflicts of interest with respect to the research, authorship, and/or publication of this article.
Funding
The authors disclosed receipt of the following financial support for the research, authorship, and/or publication of this article: The ACCESS research project was funded by EPSRC (Grant Nos. EP/W027593/1 and EP/W027593/2).
Supplemental material
Supplemental material for this article is available online.
References
Supplementary Material
Please find the following supplemental material available below.
For Open Access articles published under a Creative Commons License, all supplemental material carries the same license as the article it is associated with.
For non-Open Access articles published, all supplemental material carries a non-exclusive license, and permission requests for re-use of supplemental material or any part of supplemental material shall be sent directly to the copyright owner as specified in the copyright notice associated with the article.