
Abstract
Are grant flows from the Westminster government to local authorities influenced by political dynamics, and if so do these politicised transfers influence local election outcomes? John and Ward suggested that, through the 1980s and 1990s, Conservative central governments favoured politically aligned local authorities. We demonstrate the continuation of this trend across the cohort of Labour, coalition, and Conservative governments from 2007 to 2019, and also establish evidence of inter-party variation in the type of grant manipulation in existence. We also more substantively extend John and Ward’s work by demonstrating that electoral ‘ill-gotten gains’ follow from these politicised flows, with higher resource transfers being associated with marginally stronger incumbent electoral performance. Given the importance of central grants to subnational government in the UK, these findings are of significant contemporary policy relevance.
Introduction
Some two decades ago, John and Ward (2001) tested for evidence of partisan alignment effects in Westminster-to-English local authority resource flows. Focusing on ‘formula funding’ distributions from 1981 to 1995, John and Ward found evidence that Conservative central governments had favoured politically aligned local authorities from across a sub-sample of the 100 largest English councils. The politicisation of grants from Westminster to local government has, over recent years, again become a hot topic. The UK Conservative government’s New Towns Fund and its Levelling-Up Fund have been lightning rods for criticism, decried for suspected ‘favouritism’ towards Conservative-held or Conservative-targeted seats (Hanretty, 2021; Knott, 2021), and even subjected to a High Court legal challenge against the government’s seeming use of public money for partisan ‘pork barrelling’. 1 More generally, the increased use of central government-controlled competitive grant schemes has been criticised for the intensive efforts required from local authorities to capture funds, and for the reduced capacity of councils to plan over the longer term when resource flows are unpredictable and short term. 2
Given the importance of central grants to local authority operations, it is vital that we understand more fully the political determinants of, and the impacts from, these flows. Beyond the UK, studies of other national systems have established evidence of central governments’ willingness to use the ‘power of the purse’ to favour politically aligned units (e.g. Bracco et al., 2015; Dixit and Londregan, 1998; Kleider et al., 2018; León-Alfonso, 2007; Migueis, 2013; Solé-Ollé and Sorribas-Navarro, 2008). In addition, with Bracco et al. (2015), we have evidence of such politicised transfers being translated into improved electoral performance. Through this article, we test whether English partisan alignment effects hold beyond Conservative Westminster governments, focusing on the grant flows that John and Ward suggested are more difficult to manipulate. Our finding that grants are being systematically channelled to aligned local authorities demonstrates that the Westminster-to-local authority fiscal transfers are more heavily politicised than previously thought. We also move beyond John and Ward by probing the electoral effects of politicised Westminster financing, showing that governing parties can accrue electoral ‘ill-gotten gains’ from politicised resource flows.
We develop our analysis through the following structure. In the first section later, we outline the expectations we derive from scholarship on partisan alignment effects, and from literature on local spending and election outcomes. Here, we outline the main hypotheses to be tested by our empirical work. In the second section, we contextualise our case study with overviews of the funding relationship between the central government and local authorities in the UK, and of the UK’s relatively complex local election system. In the third section, we provide an explanation of data sources and methods used to operationalise the study, before in the fourth section presenting and discussing the results of our analysis. We conclude the article by recapping the extensions to party politics scholarship offered through the article, and reflecting on the policy implications of our findings.
Partisan alignment effects and electoral performance: Extensions to existing scholarship
Our study involves a two-staged approach that explores both the determinants of variation in grant flows from central to local government, and the electoral impact from these flows. In line with these two dimensions of our study, we engage on the one hand with scholarship on partisan alignment effects, and on the other with scholarship on the relationship between spending and election outcomes. Below, we outline the hypotheses that we derive from these bodies of work, and that we test in our empirical work.
We move first, then, to scholarship on partisan alignment effects. Partisan alignment is defined by the condition of two or more levels of a political system being under the control of the same political party (Solé-Ollé and Sorribas-Navarro, 2008: 2317). Most typically, studies of partisan alignment effects have sought to explore the relationship between party control and the flow of finance from the upper to the lower level of government. 3 Earlier studies of intra-government resource flows were focused on modelling rather than empirical analysis. As demonstrated through, for example, Oates (1972) and Dahlby and Wilson (1994), this scholarship sought primarily to design allocatively efficient distributional systems that would achieve maximum overall productivity gains under conditions of scarce government resources. A notable ‘politicisation’ of this scholarship came through interventions that modelled resource distribution to maximise electoral payoff, rather than economic efficiency. In this vein, Lindbeck and Weibull (1987), for example, suggested that governments would target resources towards concentrations of ‘marginal voters’ who do not have a strong party attachment, and who therefore require an inducement to lock-in their support.
Following on from this theoretically oriented turn towards the politics of intra-government resource transfers, a wide body of work emerged to probe the issue empirically. Focusing on the US, Grossman (1994) used a dataset covering 1974, 1977, 1980, and 1983 to test for a federal-to-state partisan alignment effect, finding overall that the increase in resource flows was strongest under Democrat control. Also focusing on the US, Levitt and Snyder (1995) again found evidence from 1984 to 1990 of a significant partisan alignment effect, with districts that contained higher numbers of democrat voters benefitting under times of Democrat control. Turning attention towards Australia, Worthing and Dollery (1998) examine grant transfers using observations for 1981/1982 and 1991/1992, and find evidence that the volume of ad hoc health and education payments increased with the number of state-level seats held by the federal government party. Broadly similar dynamics are confirmed by Case (2001), León-Alfonso (2007), and Migueis’ (2013) studies of intra-government transfers in Albania, Spain, and Portugal, respectively.
With their study of the determinants of English local authority funding, John and Ward’s (2001) work coheres closely with our own empirical focus. John and Ward present an analysis of partisan alignment effects within a sub-set of English local authorities. Focusing on 107 of the larger local authorities during the period 1981/1982–1995/1996 (during which there was continuous Conservative Westminster government), John and Ward take formula-based funding as their outcome variable. Using this cohort and measure, John and Ward (2001: 327–328) find evidence of a systematic partisan alignment effect, with the Conservative central government targeting more resources to Conservative-controlled councils within their sample. By including the whole cohort of English local authorities, covering a time period that includes variation in party control at Westminster, focusing on grants (which John and Ward suggest constitutes a more difficult-to-manipulate mode of central-to-local funding), and by exploring the electoral impact from these resource transfers, our study provides useful extensions to John and Ward. Hanretty’s (2021) analysis of outcomes from the UK Towns Fund also finds evidence of a Conservative-led Westminster government systematically favouring politically aligned authorities.
Overall, from this existing scholarship on partisan alignment effects and intra-governmental transfers, we derive the first hypothesis to be tested by our study:
H1: Local authorities that are politically aligned with the Westminster government will receive higher grant transfers from the Westminster government.
Given the consistency with which partisan alignment effects have been detected elsewhere, we have a strong expectation that this hypothesis will be confirmed. The underlying intuition is that the Westminster government takes a ‘multi-layered’ approach to their party 4 ; higher resource flows to aligned councils will be seen as a mechanism to improve the aligned council’s performance, with the reputational and electoral benefit being enjoyed by the party as a whole.
Within the scholarship on partisan alignment effects, a focus has developed on the electoral politics of fiscal transfers. Evidence of electorally driven politicised spending comes from Bracco et al. (2015) and Brollo and Nannicini’s (2012). Both Bracco et al and Brollo and Nanicini identify ‘mini-election cycles’ within intra-governmental flows in Italy and Brazil, respectively, with flows to politically aligned municipalities increasing in the run-up to elections. Brollo and Nannicini additionally find that margin of electoral control influences the distribution of resources, with the governing party specifically targeting marginal municipal seats. Ward and John (1999), too, present evidence of electoral targeting, in this case with Conservative Westminster governments channelling additional resources to marginal constituencies.
We know that, at a general level, government spending can be positively related to electoral performance. From an analysis of 65 democracies over a 30-year period, Klomp and de Haan (2013) find a significant but small electoral boost for governments that increase spending in the run-up to an election. Along similar lines, Manacorda et al. (2011) find evidence of ‘pocket book voting’ in their study of government transfers and political support, with recipients of resources reporting an increased support for the incumbent party. Relatedly, studies of ‘pork barrel’ politicised transfers, both in the US and more broadly (Catalinac et al., 2020; Lancaster and Patterson, 1990; Tavits, 2009), have shown that increased flows of money can bring electoral gain. Focusing specifically on central-to-sub-national government resource transfers, Spáč (2021) analysed local elections in Slovakia between 2006 and 2018 and found that higher grant flows from central government were associated with better performance by the incumbent mayor in the election. Bracco et al. (2015), from their analysis of Italian municipal elections between 1998 and 2010, found that politicised resource flow increased the re-election chances of the incumbent.
From these studies of the electoral politics of grant flows and spending levels, we derive the second hypothesis to be tested through our study:
H2: Higher Westminster-to-local authority grant flows will be associated with improved incumbent local election performance.
The underlying intuition here is that higher grant flows have the potential to both allow an authority to deliver improved services and outcomes and also to provide local authorities with enhanced capacity to credibly commit to delivering future improvements. While the existing scholarship provides relatively robust expectations of this electoral boost from higher resource flows, 5 the contextual sensitivity of sub-national elections does introduce questions about the existence of this pathway of influence.
Westminster-to-local government relations: An overview
The UK system of government is generally characterised as being highly centralised (Eckersley, 2017; Leach et al., 2017). Devolutions of power to the Scottish Parliament and Welsh Assembly in the late 1990s bolstered the significance of these national levels of government. In England, transfers of power to city regions and other sub-national structures in England have engendered some diffusion of power. However, particularly in relation to control over the power of the purse, English local authorities remain in thrall to Westminster (Ladner et al., 2016). After giving an overview of this funding relationship, I then sketch the variegated system of local elections.
Local authorities are responsible for the delivery of key public services in the UK, including social care for children and adults, libraries, waste management, and aspects of transport, housing, and education. There are three main channels through which funding flows to local authorities. First, there is local taxation. Council Tax is levied on residential properties, at a rate set according to the value of the home. Although there is notable variation across individual authorities in revenue composition, across England as a whole around 50% of revenue comes from this source. Second, there is the central government formula funding. Here, measures of local need are used to determine the value of resources sent to an authority, with an average of around 25% of revenue coming from this source. 6 Third, there are additional specific grants from central government. These might cover resources for schools, sixth-form colleges, the police, housing benefit, or to address a particular challenge or centrally defined policy priority. On average, this source constitutes around 25% of authority revenue. 7 John and Ward (2001) suggest that politicisation of such grants is a more costly affair for political authorities, requiring ongoing informal pressure or repeated calibration of scheme-specific goals, requirements, and criteria. In comparison with other European sub-national government structures, local authorities in the UK typically hold fewer powers and are more heavily dependent on direct, and relatively heavily discretionary, fiscal transfers from central government (Bessis, 2016).
Through our study, we focus on ‘additional specific grants’ from the central government to local authorities. These grants originate from central government departments and are reported annually by the Ministry of Housing, Communities, and Local Government (MHCLG). MHCLG differentiates between grants over which authorities have a higher degree of discretion and that are listed within authorities’ own financial accounts (technically known as ‘grants within the annual expenditure framework’), and grants for which the central government sets the purpose and that are not listed within authorities’ financial accounts (technically known as ‘grants outside the annual expenditure framework’) (DLUHC, 2021: 11). These grants support a wide variety of activities and operations, with, for example, funds for improvements in adult social care and the creation of links between local authorities and NHS providers, for defraying local authority loan payments associated with large infrastructure developments, and for capital investment in schools and providers of sixth-form education. 8 While there is little analysis of the detail of decision-making processes underlying these Westminster-to-local authority grants, prominent anecdotal reports have been made of political interference shaping some of these grant-flow outcomes (e.g. Knott, 2021; Savage, 2021).
The structure of local government in the UK is complex, falling into four types. The first type is the ‘two-tier’ model, with responsibilities split between the upper County Council and the lower District Council. The remaining three types operate on a ‘single-tier’ model. Unitary Authorities provide all local government services in their areas, mainly covering cities and larger towns. London Boroughs are the primary service providers in their areas but with the Greater London Authority fulfilling some city-wide functions. Metropolitan districts are primary service providers in their areas but with overarching joint authorities fulfilling some region-wide functions. In terms of the balance between these forms, there are currently 24 County Councils with 181 subsidiary District Councils, 58 Unitary Authorities, 32 London Boroughs, and 36 Metropolitan Boroughs. 9
While variation in voting systems does not perfectly map on to local authority type, it is possible to give a broad sense of the differing election cycles associated with different authority types across England. 10 Ordinarily, County Councils operate with a single election every four years, at which all seats are contested. The subsidiary District Councils typically work across the same 4-year cycle, holding three consecutive elections at which one-third of seats are contested followed by a fallow year. For County Councils, the most recent council term started in May 2021. 11 Most Unitary Authorities follow the single election every 4 years model, with in the preponderance of cases the most recent council term having to start in May 2019. 12 A number of Unitary Authorities use the three annual elections with fallow year model, and some use a biannual election model with half of seats contested each time. For London Boroughs, the single full election once every 4 years is used, with May 2022 representing the most recent council term. Finally, across a 4-year cycle, the majority of Metropolitan Districts elect by thirds with a fallow year, with May 2022 representing the most recent council term for Metropolitan Districts. 13
Data sources and methods
Given our interest in the determinants of Westminster grants to local authorities, and in the impact of these grants on election performance, we have designed a two-stage analysis. After providing information on the data sources used to operationalise variables associated with each of these stages, we then explain the analytic methods deployed to gain insight into the relationship between chosen variables.
The first outcome variable of interest is central government grants to local authorities. To operationalise this measure, we turned to the MHCLG ‘Local authority revenue and financing: England’. This source provides an annual overview of grants made by central government to local authorities. Grants are recorded as either being ‘outside the annual expenditure framework’ (where the end use is more highly prescribed by the Westminster government) or as being ‘within the annual expenditure framework’ (where authorities enjoy a relatively high level of discretion over the end use of the finance). 14 The series covers financial year 2008/2009 through to the contemporary period, with a delayed release. At the time of writing, 2019/2020 is the most recent available year, and we therefore take this as the end year of our study. To give a sense of the scale of grant flows involved, in 2019/2020 around £17.1bn was provided to local authorities ‘outside the annual expenditure framework’, and £40.4bn ‘within the annual expenditure framework’. The MHCLG dataset disaggregates according to the sector, with both sides of the ledger containing entries relating to education and housing, with the ‘within’ measure also containing entries on transport and social care. Both sides of the ledger contain sizable ‘miscellaneous’ entries; £4.9bn on the ‘within’ measure and £789 m on the ‘outside’ measure in 2019–2020. We created three versions of this outcome variable, ‘Grants outside of aggregate expenditure framework’, ‘Grants within aggregate expenditure framework’, and a ‘Total grants’ measure that aggregates the two previous figures.
To explore the influence of partisan alignment on these intra-government resource flows, we created a partisan alignment dummy variable. The variable draws on The Election Centre ‘Councils composition’ database, which classifies councils according to the party in control (i.e. holding greater than 50% of seats). 15 The Labour party controlled the Westminster government in 2008–2009 and 2009–2010, and so for these years, all Labour-controlled local authorities were coded 1 and all other authorities zero. There was a Conservative-Liberal Democrat coalition from 2010–2011 to 2014–2015, so for these years, both Conservative and Liberal Democrat-controlled authorities were coded 1 and others zero. From 2015–2016 to 2019–2020, there has been Conservative control of the Westminster government, so for these years, Conservative authorities were coded 1 and others zero. Because decisions on funding are taken the year before distributions occur, the partisan alignment variable was lagged by one year relative to the outcome variable. The intuition here is that alignment in, for example, 2011 would influence decision-making in 2011 and therefore actual disbursals in 2012. Beyond this variable of primary interest, we introduced a number of controls for political, socioeconomic, and institutional factors into the empirical model.
To control for potential election effects, we created three dummy variables. First, bringing together The Election Centre data on council control with MHCLG data on election occurrences in its ‘Local government structure and elections’ resource, 16 we created a variable to capture instances where an election occurred in an authority that was politically aligned with the Westminster government. The intuition behind this ‘Election in aligned authority’ variable is that the Westminster government may wish to divert resources to aligned authorities in the lead-up to an election. 17 We run this variable contemporaneously with the grant flow outcome variable, given the likelihood that governments want to announce funding for new projects in the immediate run-up to an election. The second and third of the election-focused variables were used to identify authorities that may be seen as marginals by the Westminster governing party. The ‘Marginal control – defence’ variable was coded 1 where a Westminster governing party held the council by less than 5 percent of the seat share, the intuition being that the party may wish to divert resources to shore up support for the incumbent. The ‘Marginal control – offense’ variable was coded 1 where a Westminster governing party was not in control but did hold 45 percent or more of seats, the intuition being that the Westminster party would want to starve the governing authority of resources to enhance its own local prospects of capturing control. We run these variables on a 1-year lag relative to the outcome variable, the intuition being that featuring on a priority list in 2011 would influence Westminster government decision-making in 2011, and therefore shape disbursals in 2012.
To control for the influence of local authority type, we introduce dummy variables to capture District Councils, London Borough Councils, and Metropolitan Borough Councils, leaving Unitary Authorities as the baseline referent. The intuition here is that, given the different responsibilities across the various modes of council, grant flows may systematically vary in line with authority type. Information on authority type within The Election Centre dataset was used as the input for these dummy variables. To control for population size, we incorporated Office for National Statistics data on ‘Estimated resident population’. 18 This source includes local authority-level figures in both aggregate and age-cohort form. We used the same source to control for the size of the population of children and older people, defined respectively as the number of individuals under the age of 16 years or over the age of 65 years. The intuition behind these population-related measures is that higher populations are likely to receive higher grant transfers, and that concentrations of younger and older populations are likely to generate higher transfers relating to education and elderly adult care, respectively. The final control we used was from the ONS Index of Multiple Deprivation (2015), 19 specifically the health deprivation average score (which captures measures of morbidity, disability, and early mortality). The intuition behind this measure is that a higher level of deprivation is likely to be associated with higher grant transfers, given a greater need for care services in a given authority. The above variables constitute the first stage of our empirical analysis, which seeks to explain variation in Westminster-to-local authority grant flows.
The second stage of our analysis focuses on election success as the outcome variable. To operationalise this focus, we created an ‘incumbent swing’ variable, to capture the extent of the local authority incumbent party’s gain or loss following a given election. The variable expresses the proportion of total seats gained or lost by the incumbent. So, for example, if the Conservatives were in control of a given authority and following an election shifted from controlling 60% of seats to 75% of seats in the authority, the variable would have a value of 15. To construct this variable, we again turned to The Election Centre ‘Council composition’ dataset for the source data.
To test the influence of grant flows on election outcomes, we incorporate the three measures of grant flows noted above (i.e. grants outside the AEF, grants within the AEF, total grants) into this second stage of our model. We also control for the underlying popularity of the incumbent party. To do so, we draw on Mark Pack’s ‘Pollbase’. 20 Pollbase provides national voting intention data from a wide range of individual opinion poll surveys, averaged to give a monthly figure for each of the main political parties. 21 In our dataset, we use the average national support for the local authority incumbent party for the month during which an election took place. We also deploy a ‘Governing majority’ variable drawn from The Election Centre dataset that captures the size of a governing party’s majority; where a party held 53 percent of seats, for example, it would attain a value of 3 for this variable. The purpose of this variable is to control for the pre-existing strength of the local incumbent. Given the importance of economic performance as a determinant of election outcomes, 22 we deploy a control variable to capture local-level economic success or failure. We specifically turn to the ONS Annual Survey of Hours and Earnings to create a rolling measure of the change to median earnings in the local authority over a four-year period. The final control we incorporate into this second-stage model is a contemporaneous measure of partisan alignment, on the intuition that local elections can, other things being equal, often be used to express dissatisfaction with the Westminster government.
In terms of methods of analysis, to explore the relationship between outcome and independent variables we deploy a two-stage panel-corrected standard error (PCSE) model. With its capacity for analysing time series cross-sectional data in which temporally and spatially correlated errors and heteroscedasticity may be present (see Beck and Katz, 1995), the PCSE approach is appropriate in this scenario.
Results and discussion
Stage one of the empirical analysis, which focuses on the determinants of grant flows from Westminster to local authorities, included 3,563 observations across the 2008/2009 to 2019/2020 time frame. Descriptive statistics are summarised in Table 1. We see very significant variation in grant flows. The lowest annual total grant flow of £6.93 m went to Melton District Council in 2019, the highest of £1.79bn went to Birmingham Metropolitan Borough Council in 2012, and the mean figure was £166.39 m. In terms of the grants outside the annual expenditure framework, the lowest total of £1.68 m went to Oxfordshire County Council in 2019, and the highest of £692.24 m went to Birmingham in 2011. In terms of the grants within the annual expenditure framework, the lowest total of £80,000 went to Richmondshire District Council in 2019, and the highest of £1.14bn to Birmingham in 2012. The clustering of peak payments in earlier years and nadir payments in later years reflects the ‘austerity-era’ cuts to local authority budgets since 2010.
Descriptive statistics (stage one analysis).
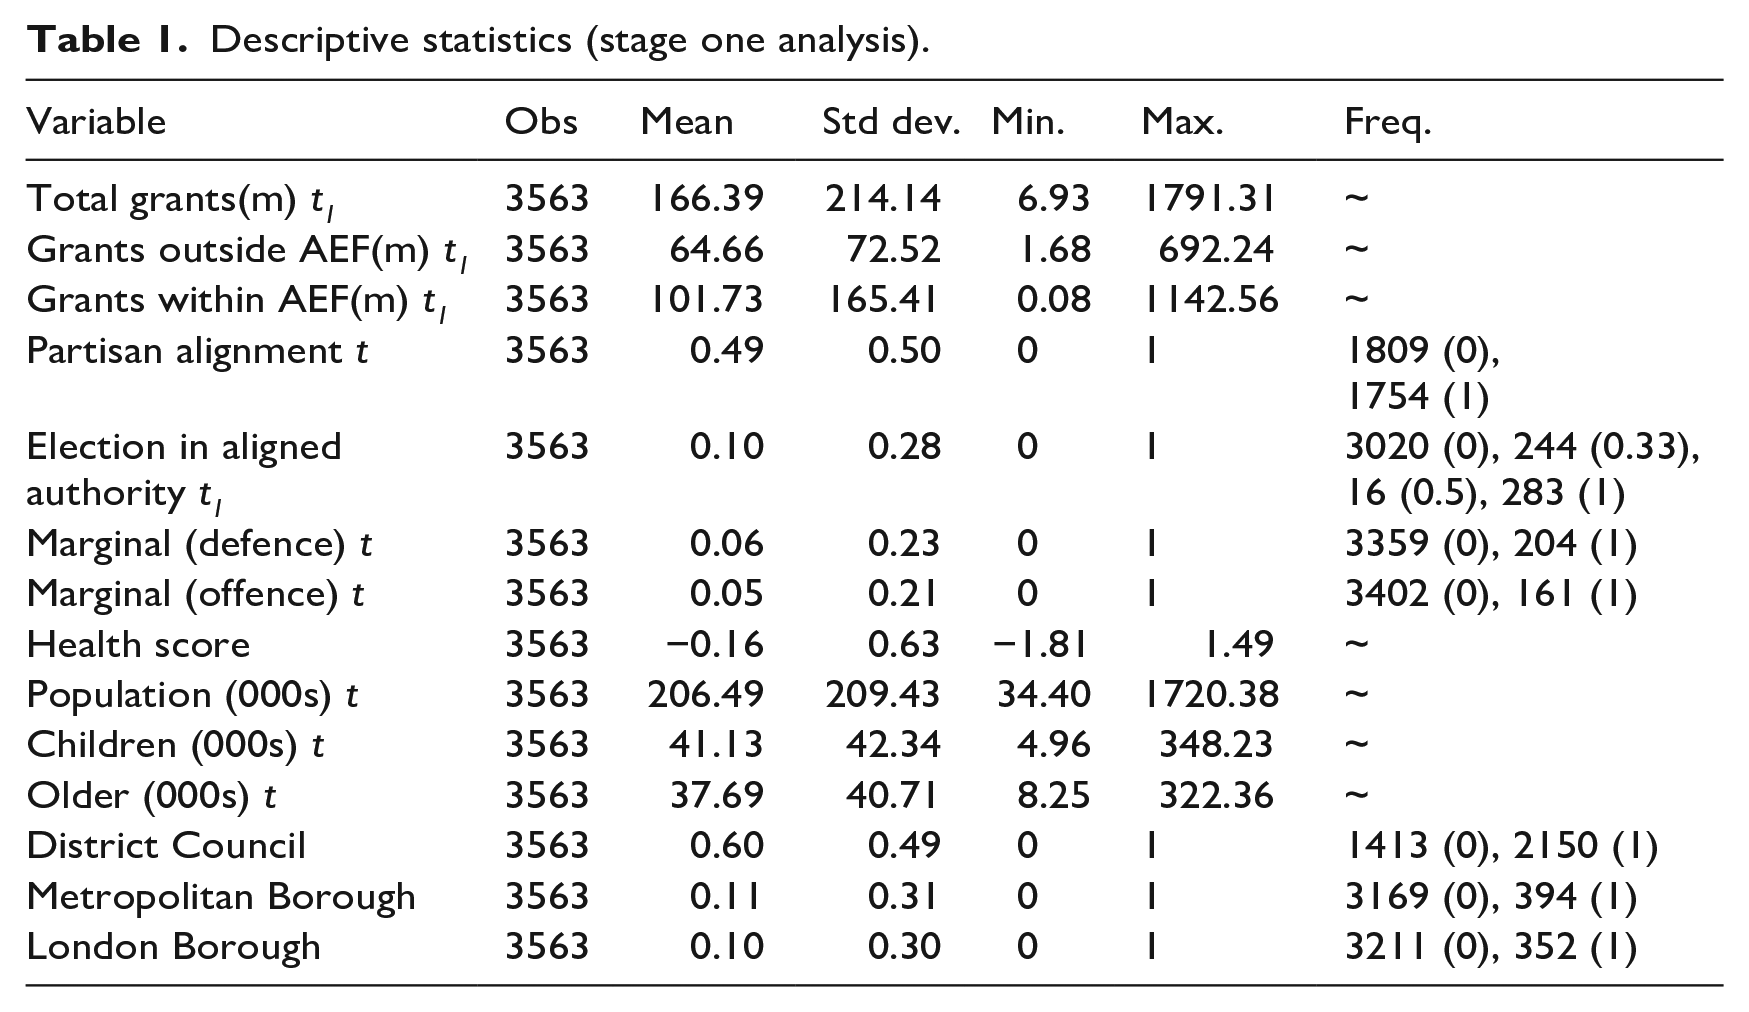
Across the time period, we see that around half of observations feature partisan alignment. This outcome is heavily driven by Conservative success in Westminster and local elections, with just 72 cases of Liberal Democrat alignment of control and 60 cases of aligned Labour party government. Bearing this distribution in mind, the extent to which the observed partisan alignment effects can be claimed to represent general as opposed to Conservative party-specific tendencies is limited. A total of 543 election events occur in aligned local authorities within our sample, predominantly of the one-third-of-seats-under-contestation and the whole-council-election types. The distribution of local authority types follows the national pattern, with a little over half being District Councils, around 10% Metropolitan Boroughs and London Boroughs, and the remainder Unitary Authorities.
Stage two of the empirical analysis, which focuses on the determinants of incumbent parties’ local election success, included 680 observations. Descriptive statistics are summarised in Table 2. The main reason for the reduced number of observations is the necessity for an election to occur for the incumbent swing variable to be generated, which results in all non-election-year observations being dropped. We also excluded authorities with no overall control from this second stage of the analysis, given the challenge of generating an incumbent swing variable when political control may be shared or not clearly delineated. The time lag introduced by the ‘Local economic performance’ measure also causes cases to be lost from the early years of our time frame.
Descriptive statistics (stage two analysis).
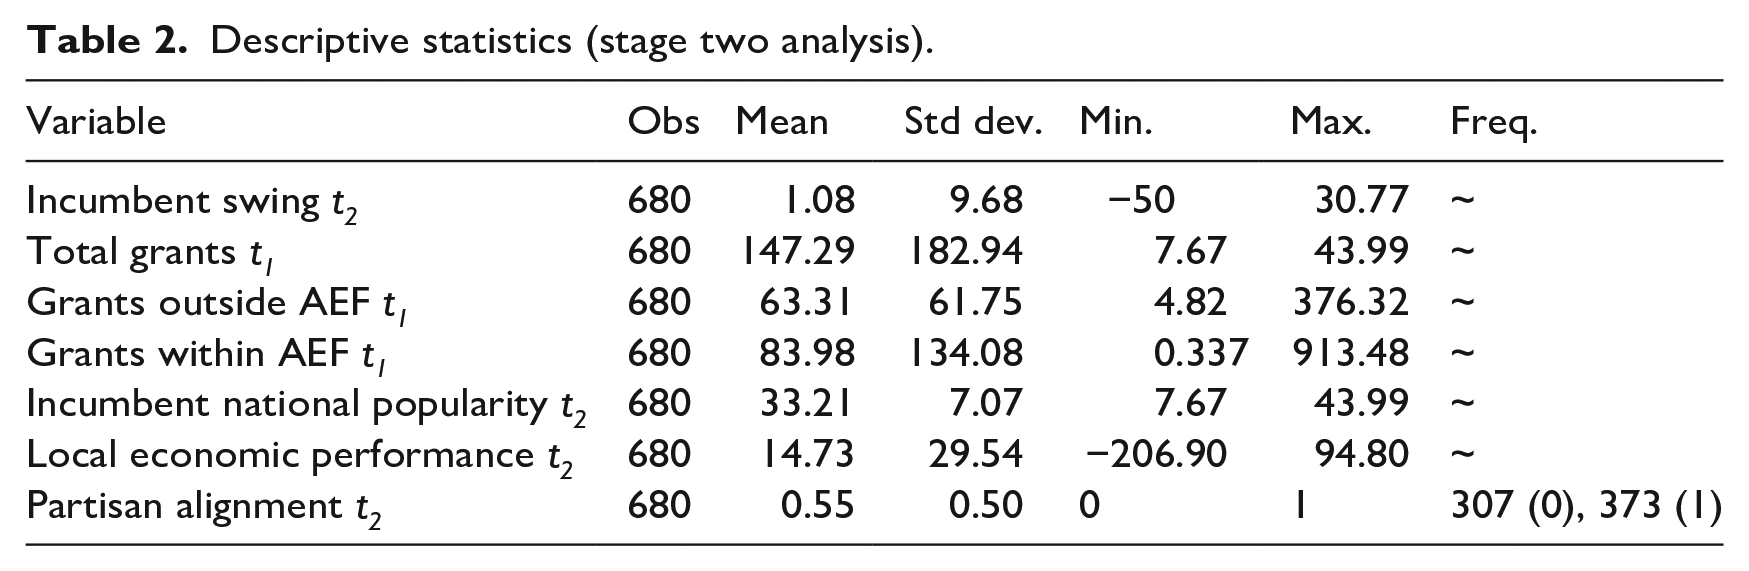
In the reduced stage two sample, we see a broad similarity in the minimum, maximum, and mean values for total grants, grants outside the annual expenditure framework, and grants within the annual expenditure framework, relative to the stage one sample. On average, the local governing party enjoyed a 33.21 approval rating, ranging from a low of 7.67 for the Liberal Democrats in May 2018 to a high of 43.99 for the Conservatives in May 2019. The average level of wage growth observed in a local authority over the preceding 4 years was £14.73, with Kensington and Chelsea London Borough experiencing a drop of £206.90 from 2013 to 2016 and Rutland Unitary Authority leading the way with an increase of £94.80 from 2010 to 2013. In this second stage of analysis, the prevalence of partisan alignment is in line with that found in stage one.
Figure 1 provides a visual overview of our operationalisation of stages one and two of our analysis. We have incorporated three time periods into our analysis; t, t1, and t2 as represented in Figure 1. As explained earlier, the outcome variable for stage one, the grant flow measure, occurs at t1, while the outcome variable for stage two, the incumbent swing measure, occurs at t2.
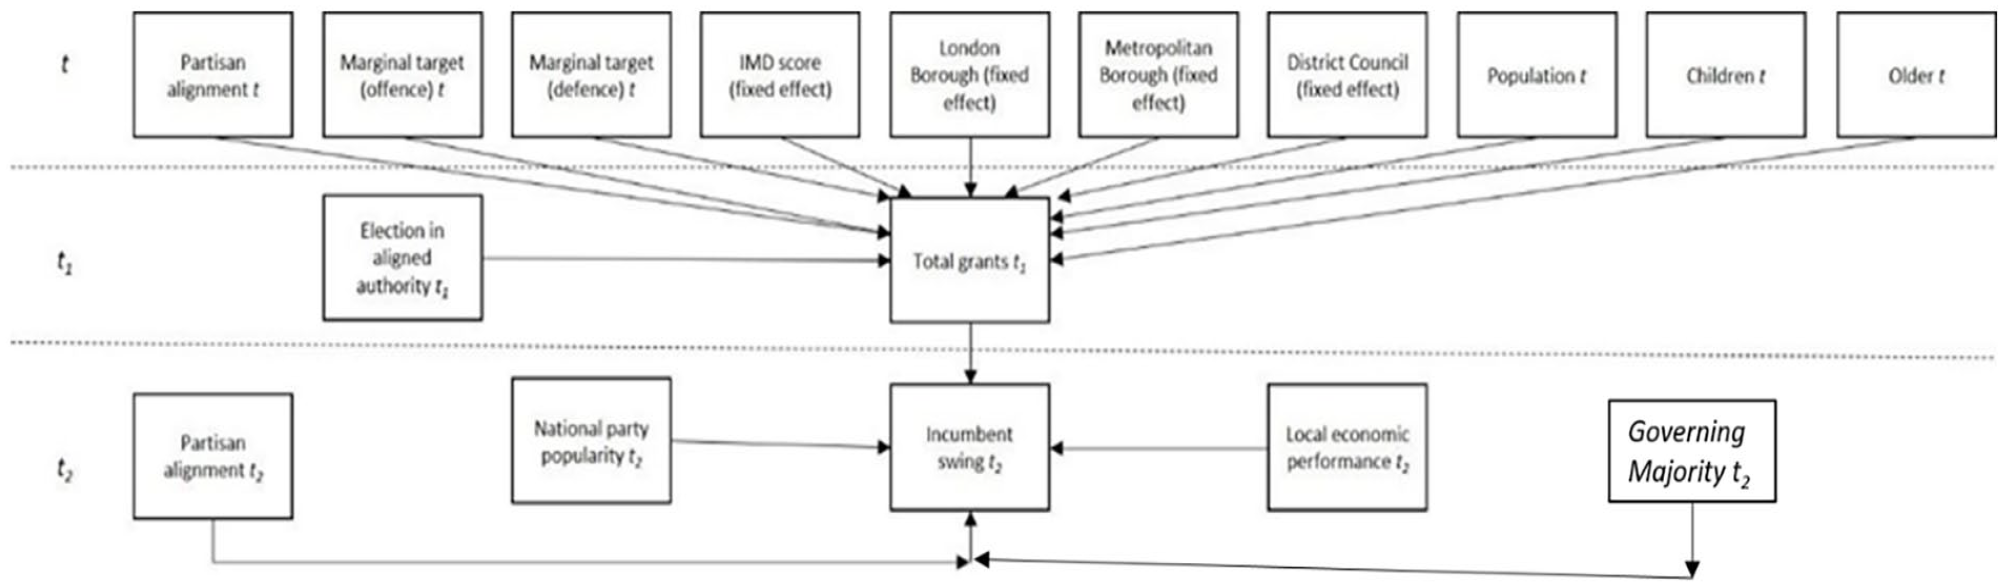
Overview of two-stage models.
In the first iteration of the model, we use total grants as the stage one outcome variable, and incorporate this measure also into the stage two analysis. Results are reported in Table 3 (Model 1). We see here that partisan alignment does have a significant and positive effect on resource transfers from Westminster to local government. This finding confirms H1. Under this partisan alignment effect, each aligned local authority received on average some £3.94 m in additional funding each year. Turning to the effect of these grant flows on electoral outcomes, we see through stage two of the analysis that total grant flows are positively related to the size of the incumbent swing. This form of politicised grant distribution is, in the realm of local election outcomes, serving to generate ‘ill-gotten gains’. The margin of impact remains very small; with an additional £1 m being associated with an increased swing of 0.004 percentage points, an aligned authority received on average an electoral boost of just 0.016 percentage points off the back of its higher grant receipts. Throughout Model 1, we see that controls generally exert the expected effect on outcome variables. It is, however, notable that electoral considerations (as measured by the presence of an election in an aligned authority, or the status of an authority as a marginal target) seem not to influence grant flows. The first and second stages of Model One are statistically significant, respectively, explaining around 87% of the observed variation in total grant flows and 30% of variation in the incumbent swing. Figures 2 and 3 present marginal effects plots of the results from the first and second stages of Model One.
Results.
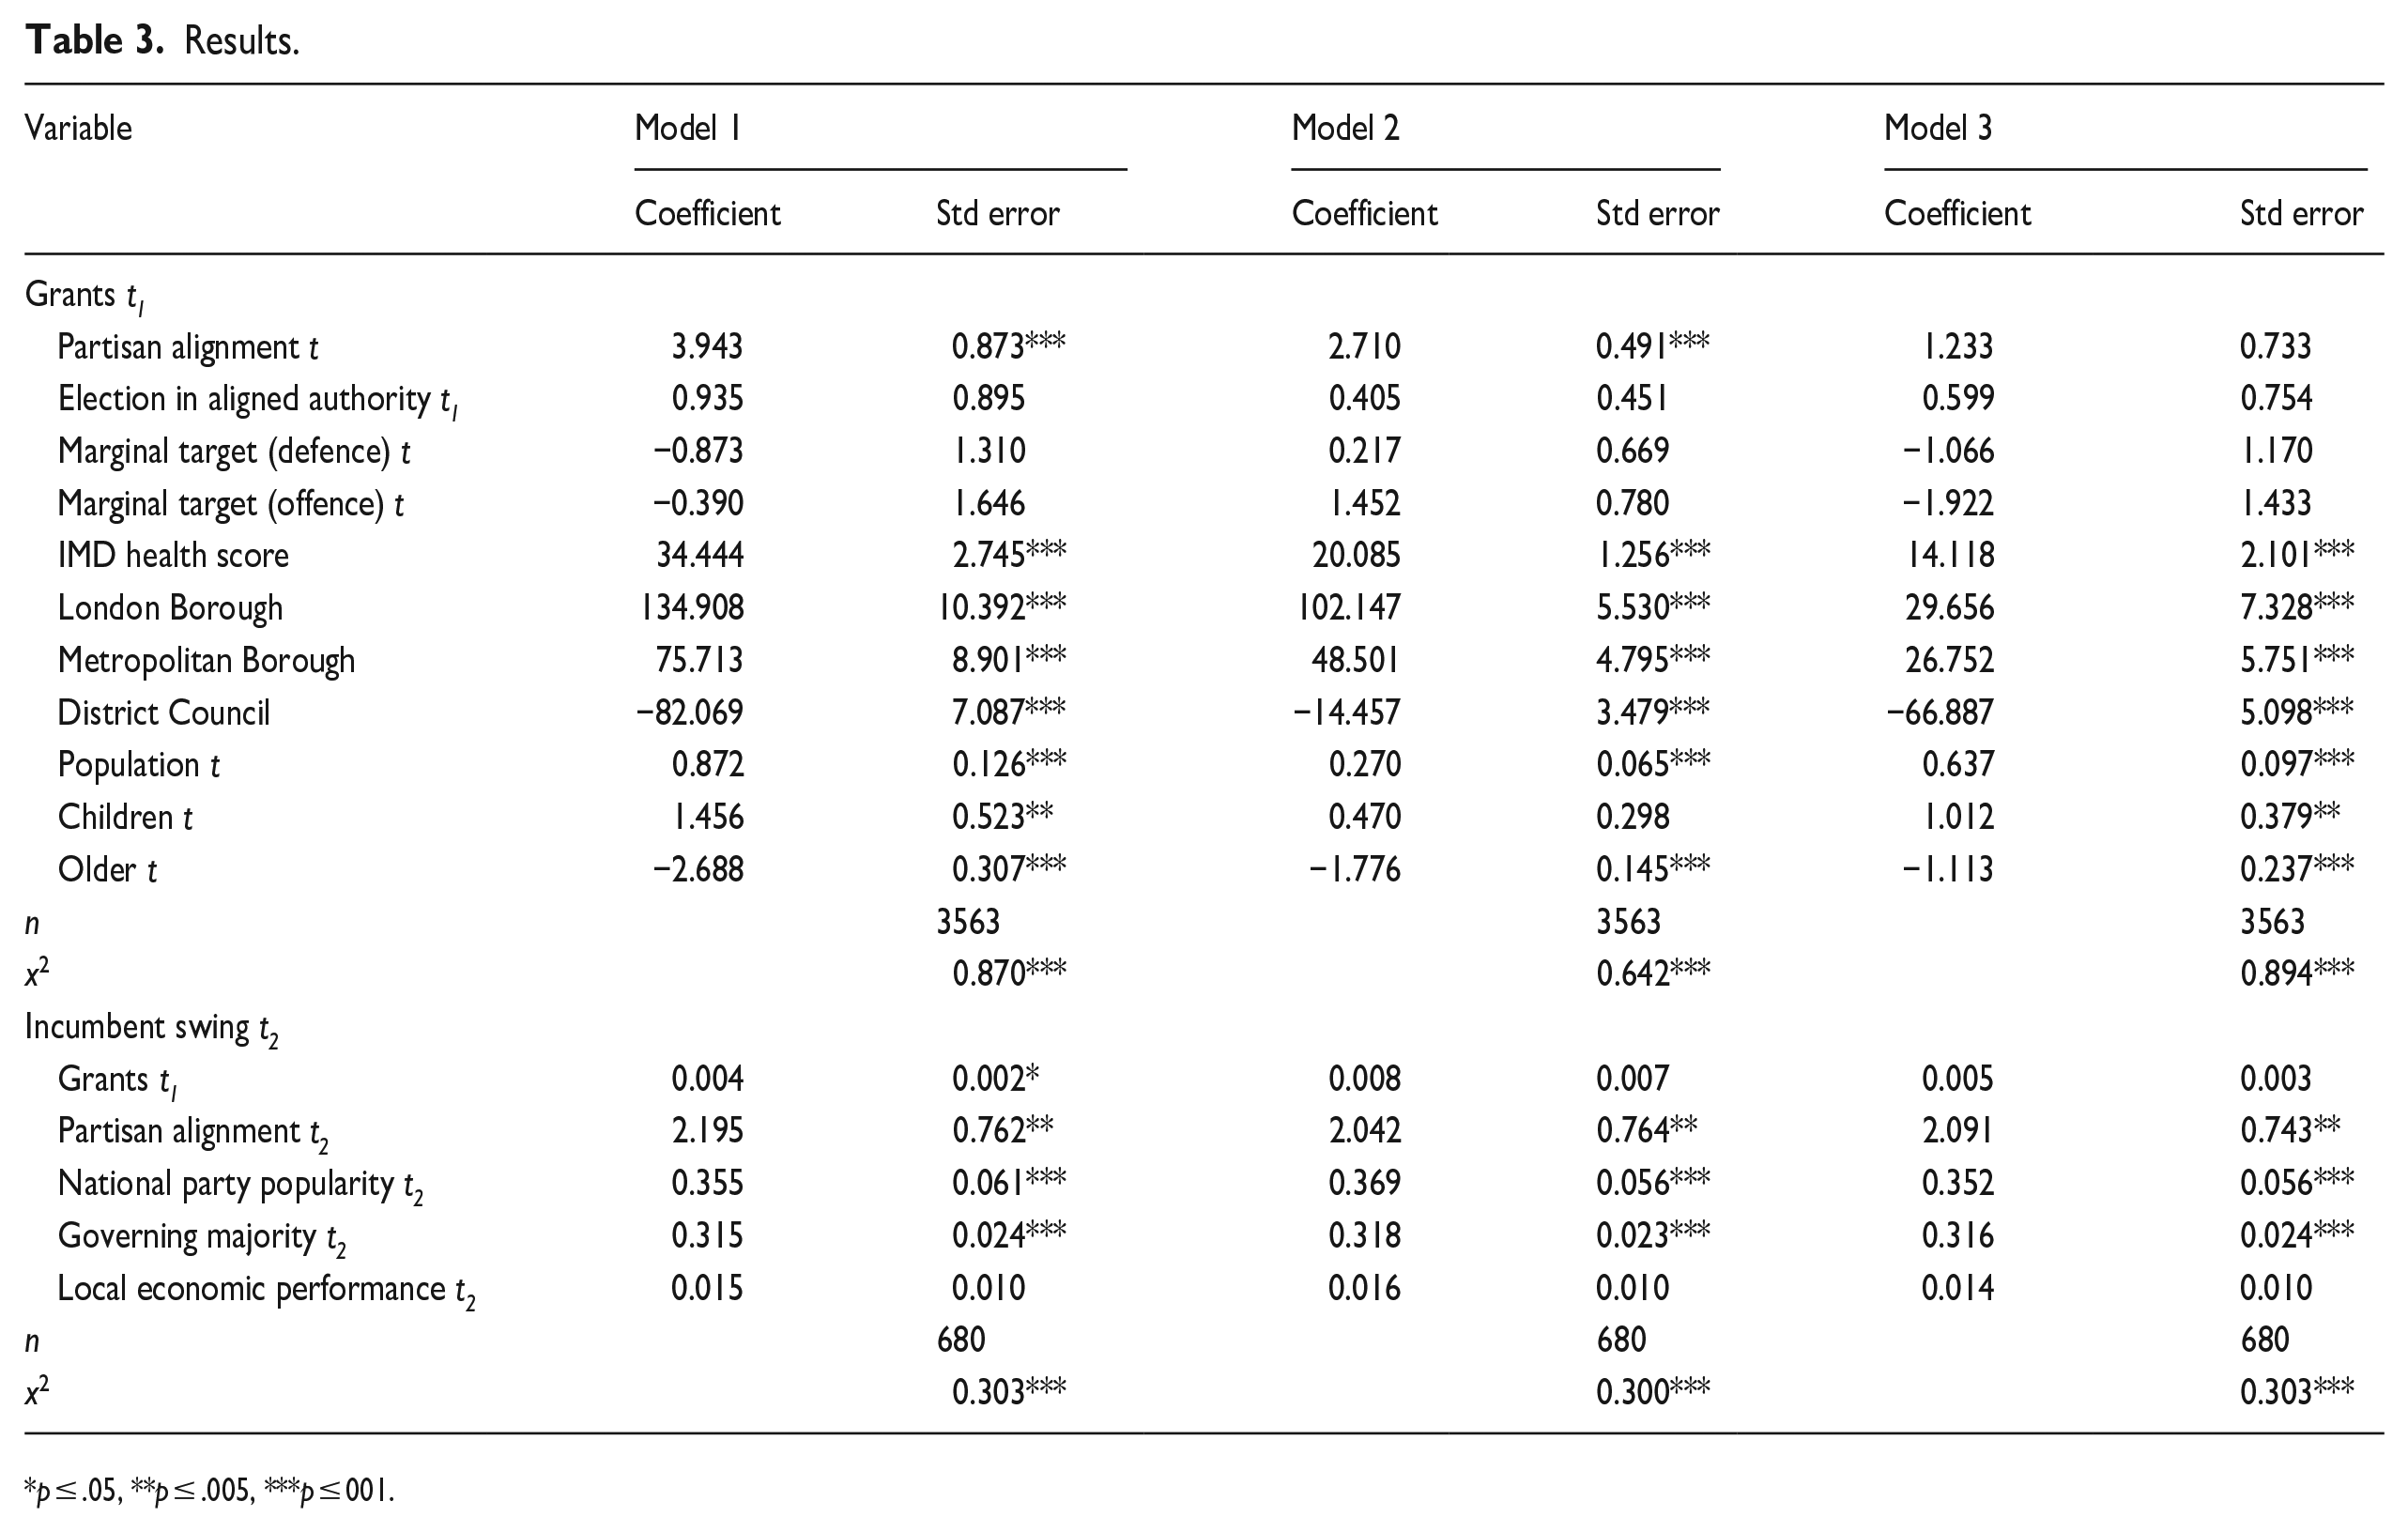
p ≤ .05, **p ≤ .005, ***p ≤ 001.
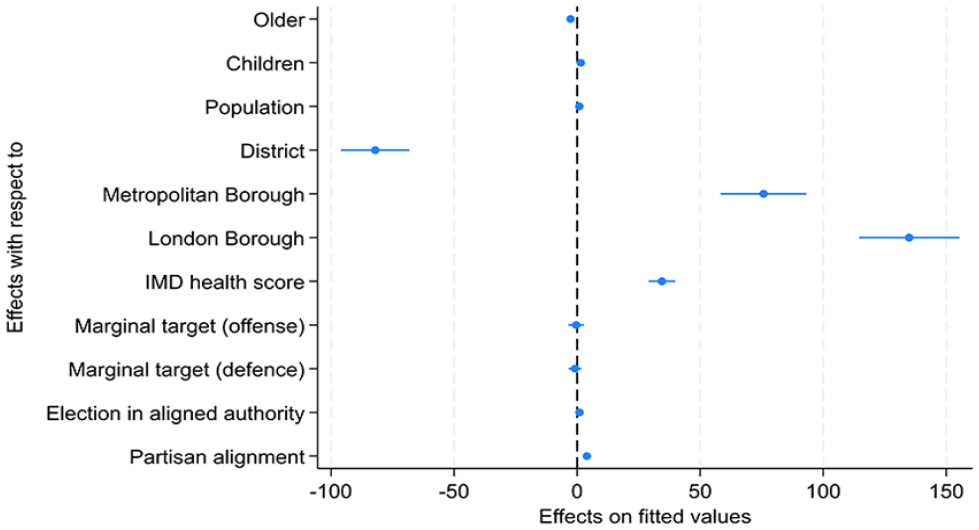
Model One, marginal effects on independent variables on total grant flows (95% confidence intervals).
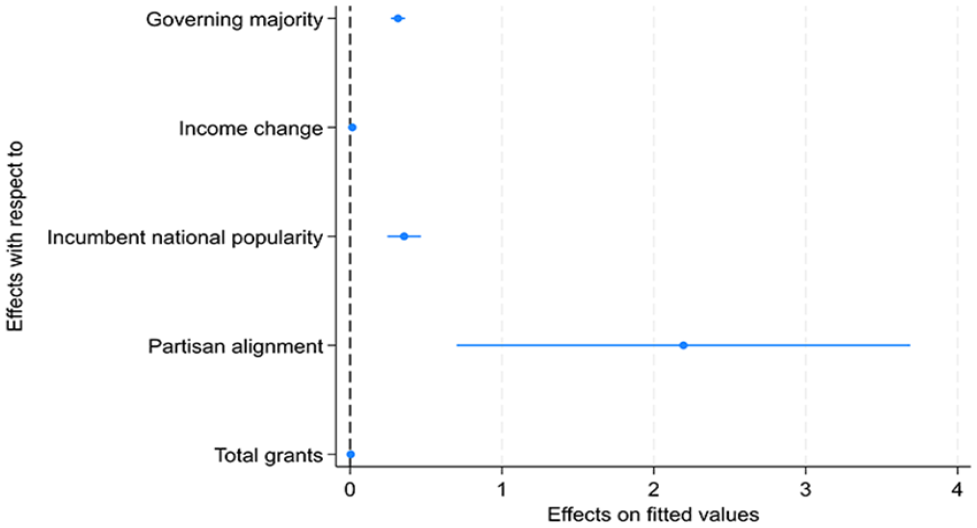
Model 1, marginal effects of independent variables on incumbent swing (95% confidence intervals).
Through Models Two and Three, we ran the ‘grants outside the annual expenditure framework’ and the ‘grants within the annual expenditure framework’ measures of fiscal transfers, respectively. The first stage of Model Two mirrors Model One, with partisan alignment having a significant and positive influence on the flow of grants outside the AEF to a local authority. However, under stage two, we see no significant effect of this sub-category of grant flows on election outcomes. Under Model Three, we find no evidence of a partisan alignment effect on grants within the AEF nor of a significant relationship between grants within the AEF and the magnitude of incumbent swing.
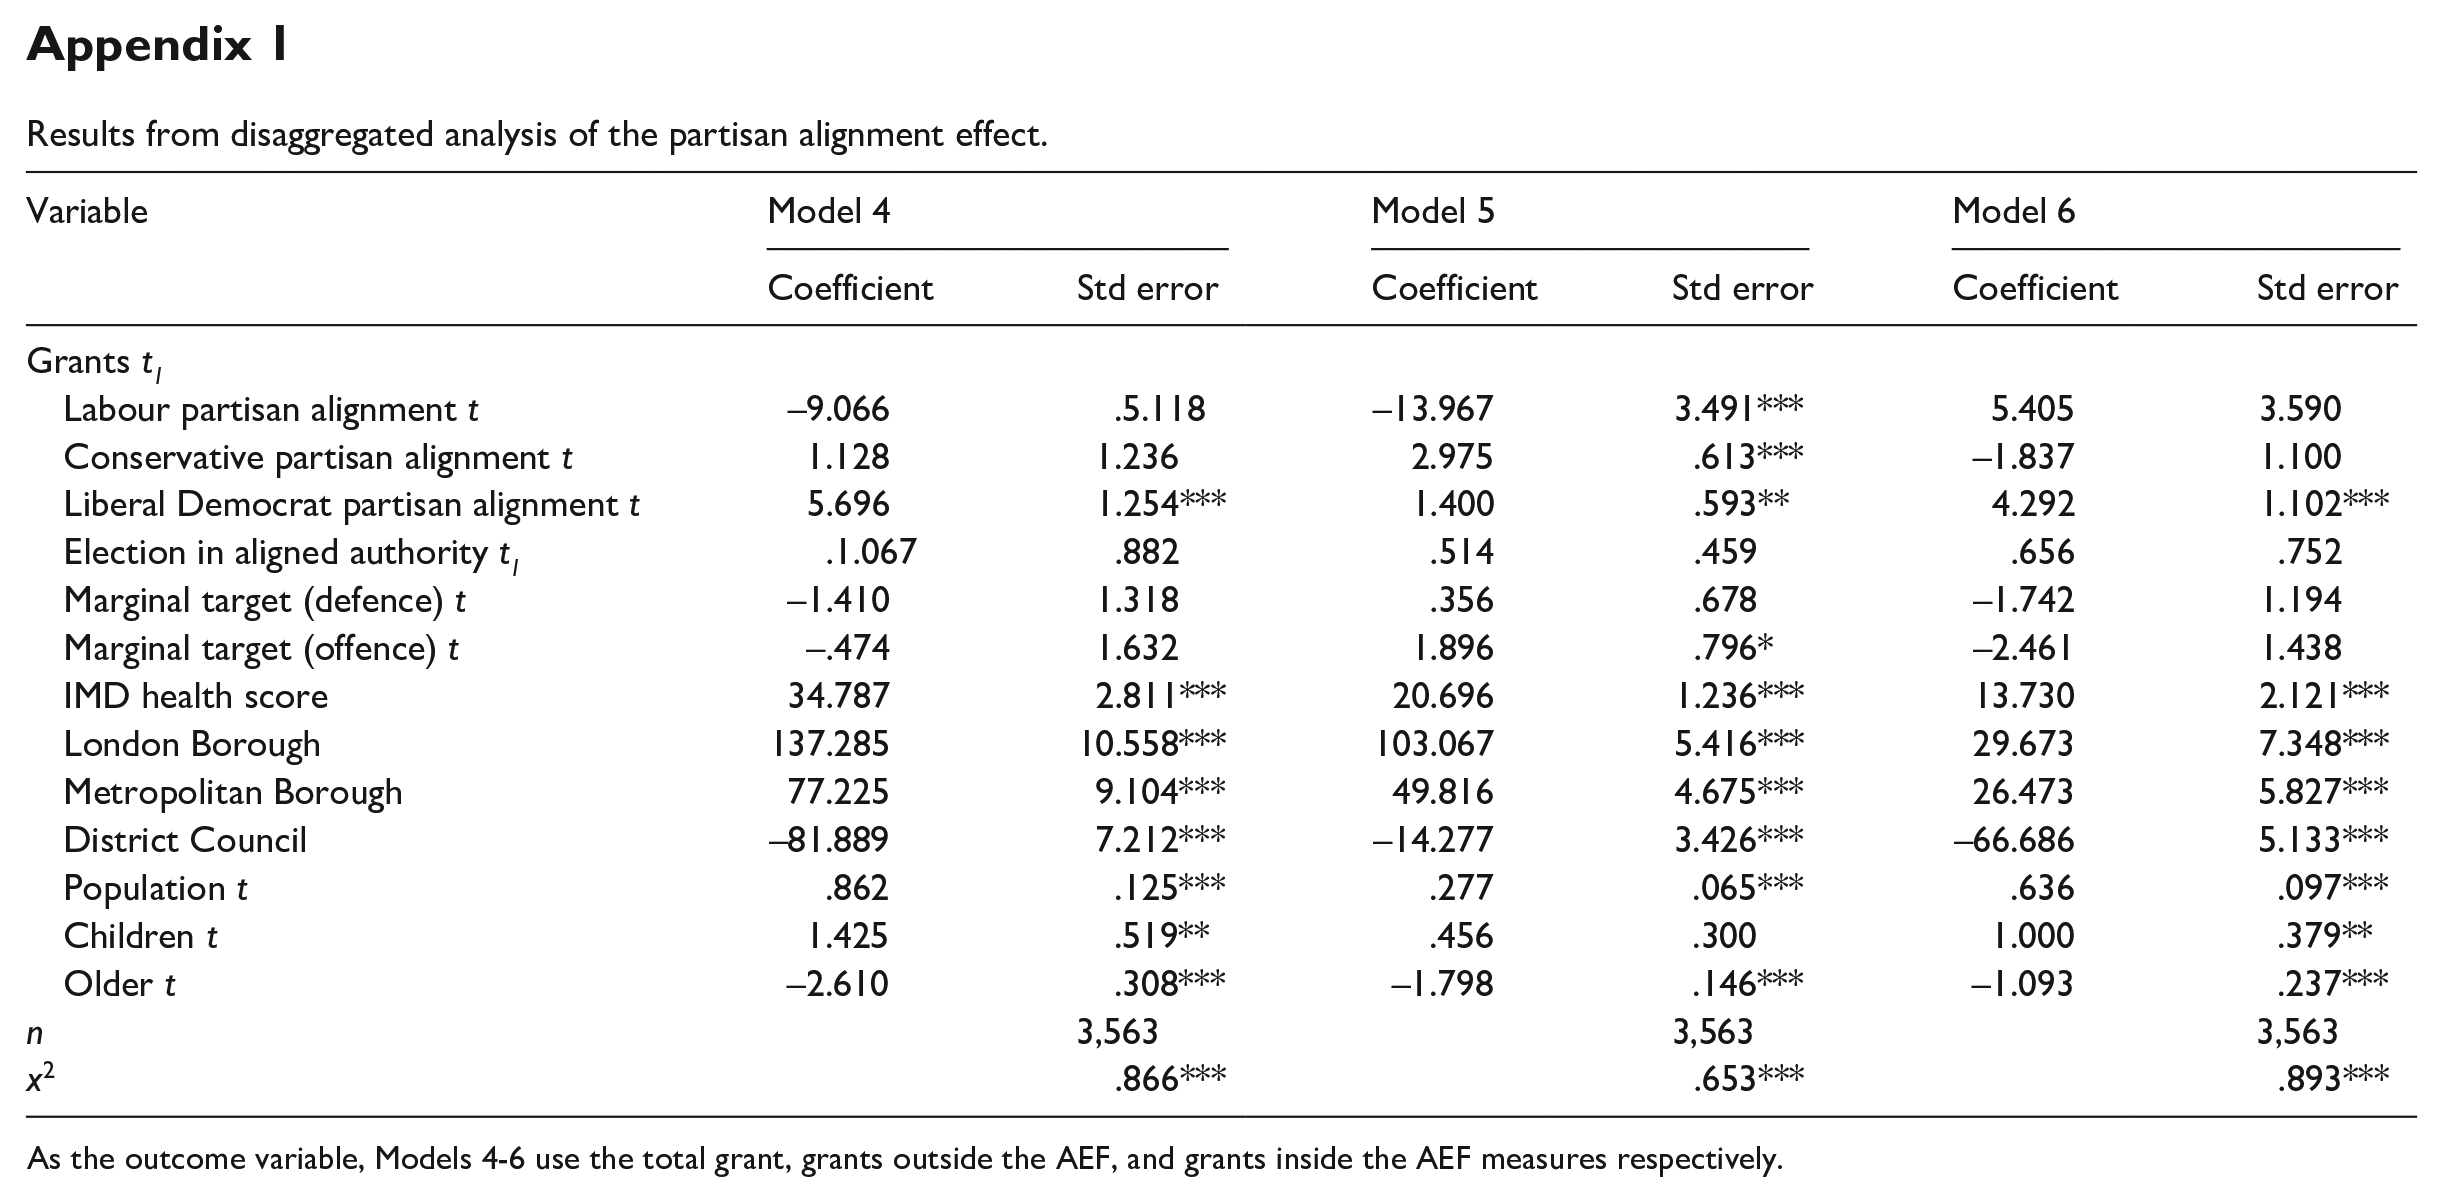
To probe for inter-party variation in partisan alignment effects, we re-ran Models One to Three but with the inclusion of new partisan alignment measures that disaggregated by party. Specifically, in the stead of the previous partisan alignment variable, we included dummies to capture the presence of Labour partisan alignment, Conservative partisan alignment, and Liberal Democrat partisan alignment. We found Liberal Democrat partisan alignment to be significantly and positively related to the total grant flow measure, Labour, Conservative, and Liberal Democrat partisan alignment to be significantly associated with grant flows outside the AEF but with Labour displaying a negative coefficient, and Liberal Democrat partisan alignment to be significantly and positively associated with grant flows within the AEF. 23 This disaggregated analysis of the partisan alignment effect on grant flows introduces the possibility that the positive association observed across the whole cohort may have been driven by the behaviour of Conservative and Liberal Democrat. 24 However, given the low number of cases of Labour and Liberal Democrat partisan alignment across the cohort, 25 we interpret these results from this disaggregation of the partisan alignment with a degree of caution.
Conclusion
Through this study, we have analysed both the drivers of, and electoral impact of, intra-government transfers in England. Our headline finding on the drivers of grant flows is that there is evidence of a partisan alignment effect, with the Westminster government systematically privileging local authorities controlled by the same party. Our headline finding on the electoral impact from grant flows is that these transfers generate ill-gotten gains; higher flows lead to improved performance at the polls, albeit with a very small real-world impact.
In terms of scholarly engagement, these insights confirm existing findings regarding the tendency of central governments to distribute resources to politically aligned sub-national units (e.g. Case, 2001; León-Alfonso, 2007; Levitt and Snyder, 1995; Migueis, 2013). More substantively, we add to the under-developed scholarship on the interaction between politicised intra-government transfers and electoral outcomes (e.g. Bracco et al., 2015). Our results extend John and Ward (2001), who had previously identified a partisan alignment effect on a sub-sample of 107 local authorities during the 1980s and 1990s, particularly through our focus on the electoral impact of politicised flows and through our focus on grants rather than formula funding flows. 26
In terms of policy relevance, through this article, we offer a confirmation of the systemic politicisation of Westminster to local government transfers. It has long been suspected that political considerations shape ‘who gets what’ from central government, and a tendency for Conservative local authorities to have both been protected from the heaviest austerity-era cuts and privileged within funding schemes to ‘level-up’ has recently been noted (Knott, 2021). Here, we add our voices to calls for greater oversight of and transparency within resource distribution processes in UK local government.
Supplemental Material
sj-dta-1-pol-10.1177_02633957241229375 – for Ill-gotten gains: Partisan alignment, politicised grant transfers and English local election outcomes
sj-dta-1-pol-10.1177_02633957241229375 for Ill-gotten gains: Partisan alignment, politicised grant transfers and English local election outcomes by Liam Clegg and Graeme AM Davies in Politics
Footnotes
Appendix
Results from disaggregated analysis of the partisan alignment effect.
| Variable | Model 4 | Model 5 | Model 6 | |||
|---|---|---|---|---|---|---|
| Coefficient | Std error | Coefficient | Std error | Coefficient | Std error | |
| Grants t1 | ||||||
| Labour partisan alignment t | −9.066 | .5.118 | −13.967 | 3.491*** | 5.405 | 3.590 |
| Conservative partisan alignment t | 1.128 | 1.236 | 2.975 | .613*** | −1.837 | 1.100 |
| Liberal Democrat partisan alignment t | 5.696 | 1.254*** | 1.400 | .593** | 4.292 | 1.102*** |
| Election in aligned authority t1 | .1.067 | .882 | .514 | .459 | .656 | .752 |
| Marginal target (defence) t | −1.410 | 1.318 | .356 | .678 | −1.742 | 1.194 |
| Marginal target (offence) t | −.474 | 1.632 | 1.896 | .796* | −2.461 | 1.438 |
| IMD health score | 34.787 | 2.811*** | 20.696 | 1.236*** | 13.730 | 2.121*** |
| London Borough | 137.285 | 10.558*** | 103.067 | 5.416*** | 29.673 | 7.348*** |
| Metropolitan Borough | 77.225 | 9.104*** | 49.816 | 4.675*** | 26.473 | 5.827*** |
| District Council | −81.889 | 7.212*** | −14.277 | 3.426*** | −66.686 | 5.133*** |
| Population t | .862 | .125*** | .277 | .065*** | .636 | .097*** |
| Children t | 1.425 | .519** | .456 | .300 | 1.000 | .379** |
| Older t | −2.610 | .308*** | −1.798 | .146*** | −1.093 | .237*** |
| n | 3,563 | 3,563 | 3,563 | |||
| x 2 | .866*** | .653*** | .893*** | |||
As the outcome variable, Models 4-6 use the total grant, grants outside the AEF, and grants inside the AEF measures respectively.
Funding
The author(s) received no financial support for the research, authorship and/or publication of this article.
Notes
Author Biographies
References
Supplementary Material
Please find the following supplemental material available below.
For Open Access articles published under a Creative Commons License, all supplemental material carries the same license as the article it is associated with.
For non-Open Access articles published, all supplemental material carries a non-exclusive license, and permission requests for re-use of supplemental material or any part of supplemental material shall be sent directly to the copyright owner as specified in the copyright notice associated with the article.