
Abstract
Arend Lijphart uses an average of five standardized variables – the executive-parties dimension (EPD) – to describe patterns of democracy and explain differences in democracies’ performance. The article suggests ways to improve the descriptive part of the project. It argues that the EPD maps different approaches to achieving accountability and representation, rather than differences in consensus. This re-conceptualization leads to a more coherent and valid measurement. It is also argued that more systematic adjustments are needed for differences in constitutional structures (presidentialism and bicameralism). The article presents data on a revised EPD and its components for 36 democracies in the period from 1981 to 2010. As to the explanatory part of the project, we contend that the EPD often hinders adequate causal analysis rather than facilitating it. We show this by re-analysing democracies’ performance with respect to turnout and capital punishment.
Keywords
Introduction
Arend Lijphart’s (2012) Patterns of Democracy is one of the most influential studies in the comparative analysis of democracy. It uses an average of five standardized variables – the so-called executive-parties dimension (EPD) – to (1) describe political process patterns in 36 established democracies and to (2) explain differences in their performance. The core claim of the descriptive project is that the EPD measures the degree of consensus democracy in a country; the core claim of the explanatory project is that consensus democracies perform better. 1 Both projects have been controversially discussed (e.g. Bormann, 2010).
This article contributes three arguments. First, we suggest that a coherent interpretation of the EPD requires that it be re-conceptualized as measuring different visions of how representation and accountability can be achieved and reconciled, rather than different degrees of consensus (cf. Powell, 2000). Lijphart’s two cabinet-related measures – cabinet types and stability – can only be valid, if the underlying concept is not inclusiveness, but ‘clarity of responsibility’. This re-conceptualization leads to a more adequate aggregation of these two variables, it renders impressionistic value adjustments unnecessary (Lijphart, 2012: 97, 118–123), and it provides a new argument for measuring electoral systems in a purely institutional manner.
Second, more attention should be paid to the way in which Lijphart accounts for popularly elected presidents. We highlight the implicit assumption behind this adjustment and argue that consistency requires that it also be applied to directly elected upper houses. When this is done, the overall empirical patterns remain similar, but particular countries change their relative position. Most notably, Switzerland shows a substantially more ‘majoritarian’ profile.
Our third argument concerns the explanatory project: Even if it may be useful to average variables for descriptive purposes, it does not follow that the same is true for causal analysis. Using the EPD for causal explanation might be based on the idea that it captures a ‘latent variable’ which cannot be measured directly but is causally efficacious. We are sceptical about this idea. The causal understanding of democratic performance will often improve, and spurious causal claims are more easily avoided, when we connect a causal effect to one specific component of the EPD. This line of criticism is not new (e.g. Gerring and Thacker, 2008: 190), but it has mainly been spelled out with respect to corporatism (Anderson, 2001; Armingeon, 2002; Giuliani, 2016). Here, we want to develop it further and apply it to two of Lijphart’s performance tests: for turnout and criminal justice (death penalty).
‘The EPD’ section briefly summarizes the construction of the EPD. The ‘Re-conceptualizing the EPD’ section explains our re-conceptualization of the EPD and suggests specific improvements. Section ‘Adjustments for executive-legislative systems’ proposes a systematic adjustment for upper houses. Section ‘A revised EPD’ compares the resulting revised EPD (with and without corporatism) to Lijphart’s version. Section ‘From description to explanation?’ then criticizes the explanatory use of the EPD. Section ‘Final remarks’ is a brief conclusion.
The EPD
The EPD is a standardized average of the following variables (Lijphart, 2012: 243): (1) Laakso and Taagepera’s (1979) effective number of parliamentary parties, (2) Gallagher’s (1991) index of electoral disproportionality, (3) Lijphart (2012: 98–101) own indicator of cabinet types, (4) Dodd’s (1976) indicator of cabinet stability and (5) Siaroff’s (1999) indicator of interest group systems. Its measurement has changed over time. Initially, it included a measure of the number of issue dimensions in the party system but no indicator of the interest group system (Lijphart, 1984: 214). Furthermore, it initially represented the countries’ scores in a factor analysis, so that the component variables were weighted according to their involvement in the factor (Lijphart, 1984: 215).
Many authors believe that the EPD measures a ‘latent variable’ (e.g. Bernauer et al., 2014: 28), but we are sceptical about this idea. It is not clear to us what this latent variable is. A prominent idea is that the EPD measures a country’s consensual culture (e.g. Bormann, 2010: 8), yet this is clearly not the case. Countries such as Belgium or Israel have high values on the EPD (Lijphart, 2012: 244), but ‘they do not have consensual cultures’ (Lijphart, 2012: 302). 2 Also, the idea of a latent variable seems superfluous to us because each of the five above-mentioned indicators is well-understood and the strong correlations between them can largely be explained by straightforward logical and empirical relationships (Lijphart, 2012: 170; Taagepera, 2003) – although some of the empirical relationships maybe temporally and spatially bounded (Croissant and Schächter, 2010; Fortin, 2008; Roberts, 2006).
In our view, the EPD simply does what any average does: it summarizes data and thereby reduces complexity. If we view the EPD in this more pragmatic manner, it becomes important to clearly separate the descriptive from the explanatory project. We start with the former and suggest reconsidering what the EPD summarizes.
Re-conceptualizing the EPD
Our re-conceptualization draws on the work of Powell (2000). We argue that the EPD summarizes different approaches to achieving, and reconciling, the goals of accountability and representation. We start by briefly reviewing the subtle but important differences between the concepts of Powell and Lijphart.
Lijphart focuses on the size of majorities needed to change the status quo. The consensus model aims at including ‘as many people as possible’ and is characterized by ‘inclusiveness, bargaining, and compromise’; in contrast, the majoritarian model is ‘exclusive, competitive and adversarial’ (Lijphart, 2012: 2). The distinction is one between exclusiveness and inclusiveness.
The problem is that many authors have questioned whether these conceptual ideas are coherent and whether all variables within the EPD are valid measures of them (Ganghof, 2010; Gerring and Thacker, 2008: 190; McGann and Latner, 2013; Tsebelis, 2002). Importantly, part of this scepticism is shared by authors who follow Lijphart’s general approach. For example, Adrian Vatter (2009) has changed or replaced the cabinet-related indicators (numbers 3 and 4 in the above list) to achieve a more valid measurement. Here, we adopt the opposite approach: rather than changing the measurement to better match Lijphart’s concepts, we consider the concepts that might coherently justify the measurement.
Powell’s (2000) emphasis is more on the stages of the democratic process at which majorities are formed and on the basic tension between representation and accountability. The normative rationale of the majoritarian vision is not exclusion, but giving voters a certain type of control over policymakers by essentially completing the process of democratic majority formation before the election. Voters should ideally be able to identify competing options for government and clearly recognize who is responsible for the past policies. The polar alternative to the majoritarian vision is a ‘proportional’ vision that shifts majority formation to the post-electoral stages of the democratic process: cabinet formation and legislative coalition-building. Powell’s proportional vision does not aspire to consensus, but – ideally – to giving each party proportional influence on legislation. Furthermore, realizing this ideal does not necessarily require oversized cabinet or minority vetoes. It could also be approximated by minimal-winning coalitions that shift from issue to issue so that every party has the chance of becoming part of the majority some of the time (Powell, 2000: 256, n. 9).
We now apply this Powellian perspective to each indicator of the EPD in turn. In the process, we will also slightly extend this perspective to take account of different conceptions of accountability (Ganghof, 2016).
Cabinet types
We begin with Lijphart’s controversial indicator of cabinet types (Vatter, 2009: 132–134). It measures the frequency of ‘majoritarian’ cabinet types in a country over time. Single-party majority cabinets are considered fully ‘majoritarian’, minimal-winning coalitions, and one-party minority cabinets are considered partly majoritarian and thus receive half the weight in the computations. Oversized cabinets and minority coalitions are deemed ‘consensual’. Lijphart wants this indicator to measure the ‘breadth of participation by the people’s representatives in the executive branch’ (Lijphart, 2012: 79).
Yet, the cabinet type with the narrowest participation in the executive branch is clearly a one-party minority cabinet: it lacks a majority of people’s representatives, and there is no power-sharing between parties (Ganghof, 2010). Furthermore, Lijphart makes rather arbitrary changes to the computed values for selected countries: one-party majority cabinets in Japan are recoded as minority cabinets and minimal-winning cabinets with large seat shares as oversized cabinets (Lijphart, 2012: 97).
We contend that the best way to interpret Lijphart’s measure is to re-conceptualize it as a measure of clarity of responsibility. Indeed, Powell (2000: 53) proposed a ranking of the clarity of responsibility of different cabinet types that is rather similar to Lijphart’s. One-party majority governments are not the most exclusive cabinet type, but they do achieve the highest clarity of responsibility (see Schwindt-Bayer and Tavits, 2016). Viewing the indicator as measuring clarity of responsibility also obviates any need for selective value adjustments.
Cabinet duration
Lijphart (2012: 105, 119) uses cabinet duration as an indicator of ‘executive dominance’. This has been seen as invalid (Tsebelis, 2002: 109–114). Moreover, the measurement does not produce satisfactory results in eight countries, whose values are replaced in an impressionistic manner (Lijphart, 2012: 119–123). To avoid these problems, some authors have substituted Lijphart’s indicator with an institutional measure of executive dominance (Tsebelis, 2002: 109–114; Vatter, 2009: 134–135). We agree with the criticism but propose to re-conceptualize cabinet duration as a subsidiary indicator of clarity of responsibility. Powell (2000: 61) sees cabinet stability as a ‘plausible condition for responsibility’, and it has been used as such in empirical studies (Schwindt-Bayer and Tavits, 2016: 59).
This re-conceptualization also implies that we should multiply the two indicators of clarity of responsibility rather than averaging them. Even one-party majority cabinets would achieve little clarity of responsibility if they changed frequently, and even extremely stable cabinets cannot achieve high clarity of responsibility if they have minority status and contain many parties. To multiply the indicators, we express a cabinet’s actual duration as a share of the legal maximum. 3 This also obviates any need for impressionistic value adjustments. In sum, our proposal is to combine Lijphart’s two cabinet-related indicators into one combined measure of clarity of responsibility.
Electoral systems
Lijphart’s use of the Gallagher (1991) index of disproportionality to measure electoral systems has been rather uncontroversial. This index uses the actual empirical deviations of parties’ vote and seat shares. One downside is that if a majoritarian electoral system deters new parties or candidates from entering the competition, and citizens from voting for them if they enter, the empirically observable disproportionality can be very low (Best and Zhirnov, 2015). The United States are case in point (Lijphart, 2012: 150–152).
Given our conceptual perspective, this is important. A number of authors have criticized the literature’s tendency to equate accountability with clarity of responsibility (Quinn, 2015; Samuels and Hellwig, 2010). One core argument is that low entry barriers for new parties and candidates are an important way to keep existing parties accountable (McGann, 2013). Mechanical proportionality is thus not only about fair representation but also about a form of ‘bottom-up accountability’. An institutional measure of electoral systems better captures the entry barriers for new parties and hence one potential accountability advantage of proportional representation. 4
We therefore propose to use the effective district magnitude as a measure of the electoral system (cf. McGann and Latner, 2013). This measure combines district magnitudes, legal thresholds and upper tier seats into one single institutional indicator of proportionality (Taagepera and Shugart, 1989). We use the formula developed by Lijphart (1994): M = (75/T) − 1, with M being the effective district magnitude and T being the legal threshold. 5
Party systems
The effective number of parties is the least controversial of Lijphart’s indicators. It also systematically connects the other variables of the EPD discussed so far: the effective number of parties is related to the electoral system via Duverger’s mechanical and psychological effects as well as via parties’ self-interested selection of electoral systems (Colomer, 2005), and it is logically and causally connected to cabinet types and cabinet stability (Taagepera, 2003). The use of this indicator is also fully consistent with our re-conceptualization of the EPD. It has been used as a stand-alone indicator of accountability (Carey and Hix, 2011) and as a supplementary indicator of clarity of responsibility (Schwindt-Bayer and Tavits, 2016: 59).
Interest group systems
The inclusion of the interest group system into the EPD has been very controversial. Lijphart (2012: 171) cannot give a clear conceptual reason why two-party systems should go together with a multitude of interest groups (i.e. pluralism), whereas multi-party systems require a two-group interest pattern (i.e. corporatism). Our proposed re-conceptualization might provide a new argument in his favour; in corporatist systems, the state formally shares power and responsibility with interest groups, so that clarity of responsibility (in a wider sense) is reduced.
However, Taagepera (2003) and Lijphart (2012: 170) both highlight the fact that the interest group system is the only variable that is not logically or causally connected to the others. This may be a reason for excluding it from the EPD.
Furthermore, Lijphart’s measurement of the interest group system is problematic. The Siaroff index goes well beyond the concept of corporatism and already incorporates the notion of consensus or consociational democracy into the measurement (Siaroff, 1999: 183, 196). For a country such as Switzerland, this leads to values that depart substantially from other measures of corporatism (Jahn, 2016: 59–61). Moreover, since Siaroff’s study includes only 24 countries, one-third of Lijphart’s 36 countries are assigned impressionistic values based on his reading of the literature (Lijphart, 2012: 164–169).
As far as the descriptive project is concerned, we treat the inclusion of the interest group system as a pragmatic matter. For some purposes, it may be useful, for others not. Yet, to increase measurement validity and reliability, we suggest using Jahn’s (2016) measure, even if this implies a reduction in sample size. Before we re-compute the EPD, however, we have to consider Lijphart’s adjustments for constitutional structures.
Adjustments for executive-legislative systems
Lijphart’s approach has been criticized for not taking executive-legislative systems into account (e.g. Bormann, 2010: 3; Gerring and Thacker, 2008: 190), but this is not entirely true. He does adjust his measurement of electoral systems and cabinet types for the existence of direct (or quasi-direct) elections of a president or prime minister. As to electoral systems, he averages the disproportionality of parliamentary and presidential elections (Lijphart, 2012: 93–94).
As to presidential cabinets, the adjustment is a bit more complex (Lijphart, 2012: 146–147). The cabinet types-indicator is constructed in two steps, both of which are modified. The first step determines the cabinet’s majority status in the lower or only house of parliament. The values for presidential regimes are averaged with a second value that automatically treats them as minimal-winning because ‘with regard to staying in office – they are minimal winning by definition’ (Lijphart, 2012: 94). The second step determines whether a cabinet consists of multiple parties. For presidential cabinets, Lijphart averages these values with a second value that automatically treats them as single party ‘because of the president’s dominant status in the cabinet’ (Lijphart, 2012: 94). Both adjustments have the effect of assigning presidential systems a higher clarity of responsibility.
These adjustments are based on a rather strong implicit assumption. When the ‘majoritarian’ nature of the executive branch is averaged with a ‘consensual’ legislature, presidential systems will tend towards intermediate values on the EPD. This implies the questionable assumption that such systems are similar to parliamentary systems with intermediate levels of proportionality, multipartism and clarity of responsibility. Yet, students of presidentialism have argued that giving voters two elected agents allows democracies to simultaneously achieve high values on goals that conflict in parliamentarism: presidential elections can achieve highly identifiable and responsible executives (partly governing with decree power), whereas parliamentary election can achieve representative, multi-party legislatures (e.g. Cheibub, 2006; Shugart and Carey, 1992: chap. 1). Lijphart’s averaging implicitly rejects this idea.
For the purposes of this article, we adopt Lijphart’s assumption to stay as close as possible to this analysis. 6 However, it needs to be implemented more evenly. Consistency requires that directly elected upper houses receive the same treatment as directly (or quasi-directly) elected presidents. Lijphart (2012: 187–203) measures the ‘strength’ of bicameral systems along his federal-unitary dimension but ignores upper houses in the EPD. In our view, though, when both houses of parliament are directly elected, there is no good reason to ignore them in the measurement. Directly elected upper houses can create a separation of powers similar to popularly elected presidents (Ganghof, 2014).
This is especially true since in Lijphart’s sample all directly elected upper houses also possess strong veto power. They exist in Argentina (since 2001), Australia, Italy, Japan, Switzerland, Uruguay and the United States. In all of these cases except Japan, the upper houses have absolute veto power over legislation, and in Japan, the lower house needs two-thirds majorities to override upper house vetoes. Given this combination of legitimacy and veto power, the character of democratic processes depends on upper houses as much (or almost as much) as on lower houses; and cases exist in which the two houses differ substantially. 7 Hence, when there is a directly elected upper house, our revised measurement of electoral and party systems as well as clarity of responsibility reflects averages of both houses. Since we continue to apply Lijphart’s adjustment for presidential cabinets, country values for electoral systems and clarity of responsibility may be averages of all three branches.
A revised EPD
This section presents a revised EPD for the period from 1981 to 2010. We begin with Lijphart’s entire sample of 36 democracies, which implies the neglect of corporatism due to missing data. In a second step, we include Jahn’s (2016) corporatism index, so that the sample size reduces to 26.
Table 1 presents the values of our three revised indicators for Lijphart’s 36 countries. To compute the effective district magnitude, we revised and complemented the dataset of Best and Zhirnov (2015). 8 The values for the effective number of parties are those of Lijphart, adjusted only for directly elected upper houses. Clarity of responsibility is computed as explained above. The table also includes the values of Jahn’s (2016) corporatism index for 26 democracies. The last two columns show two revised versions of the EPD, one with and one without the corporatism index. 9
The revised EPD and its components (1981–2010).
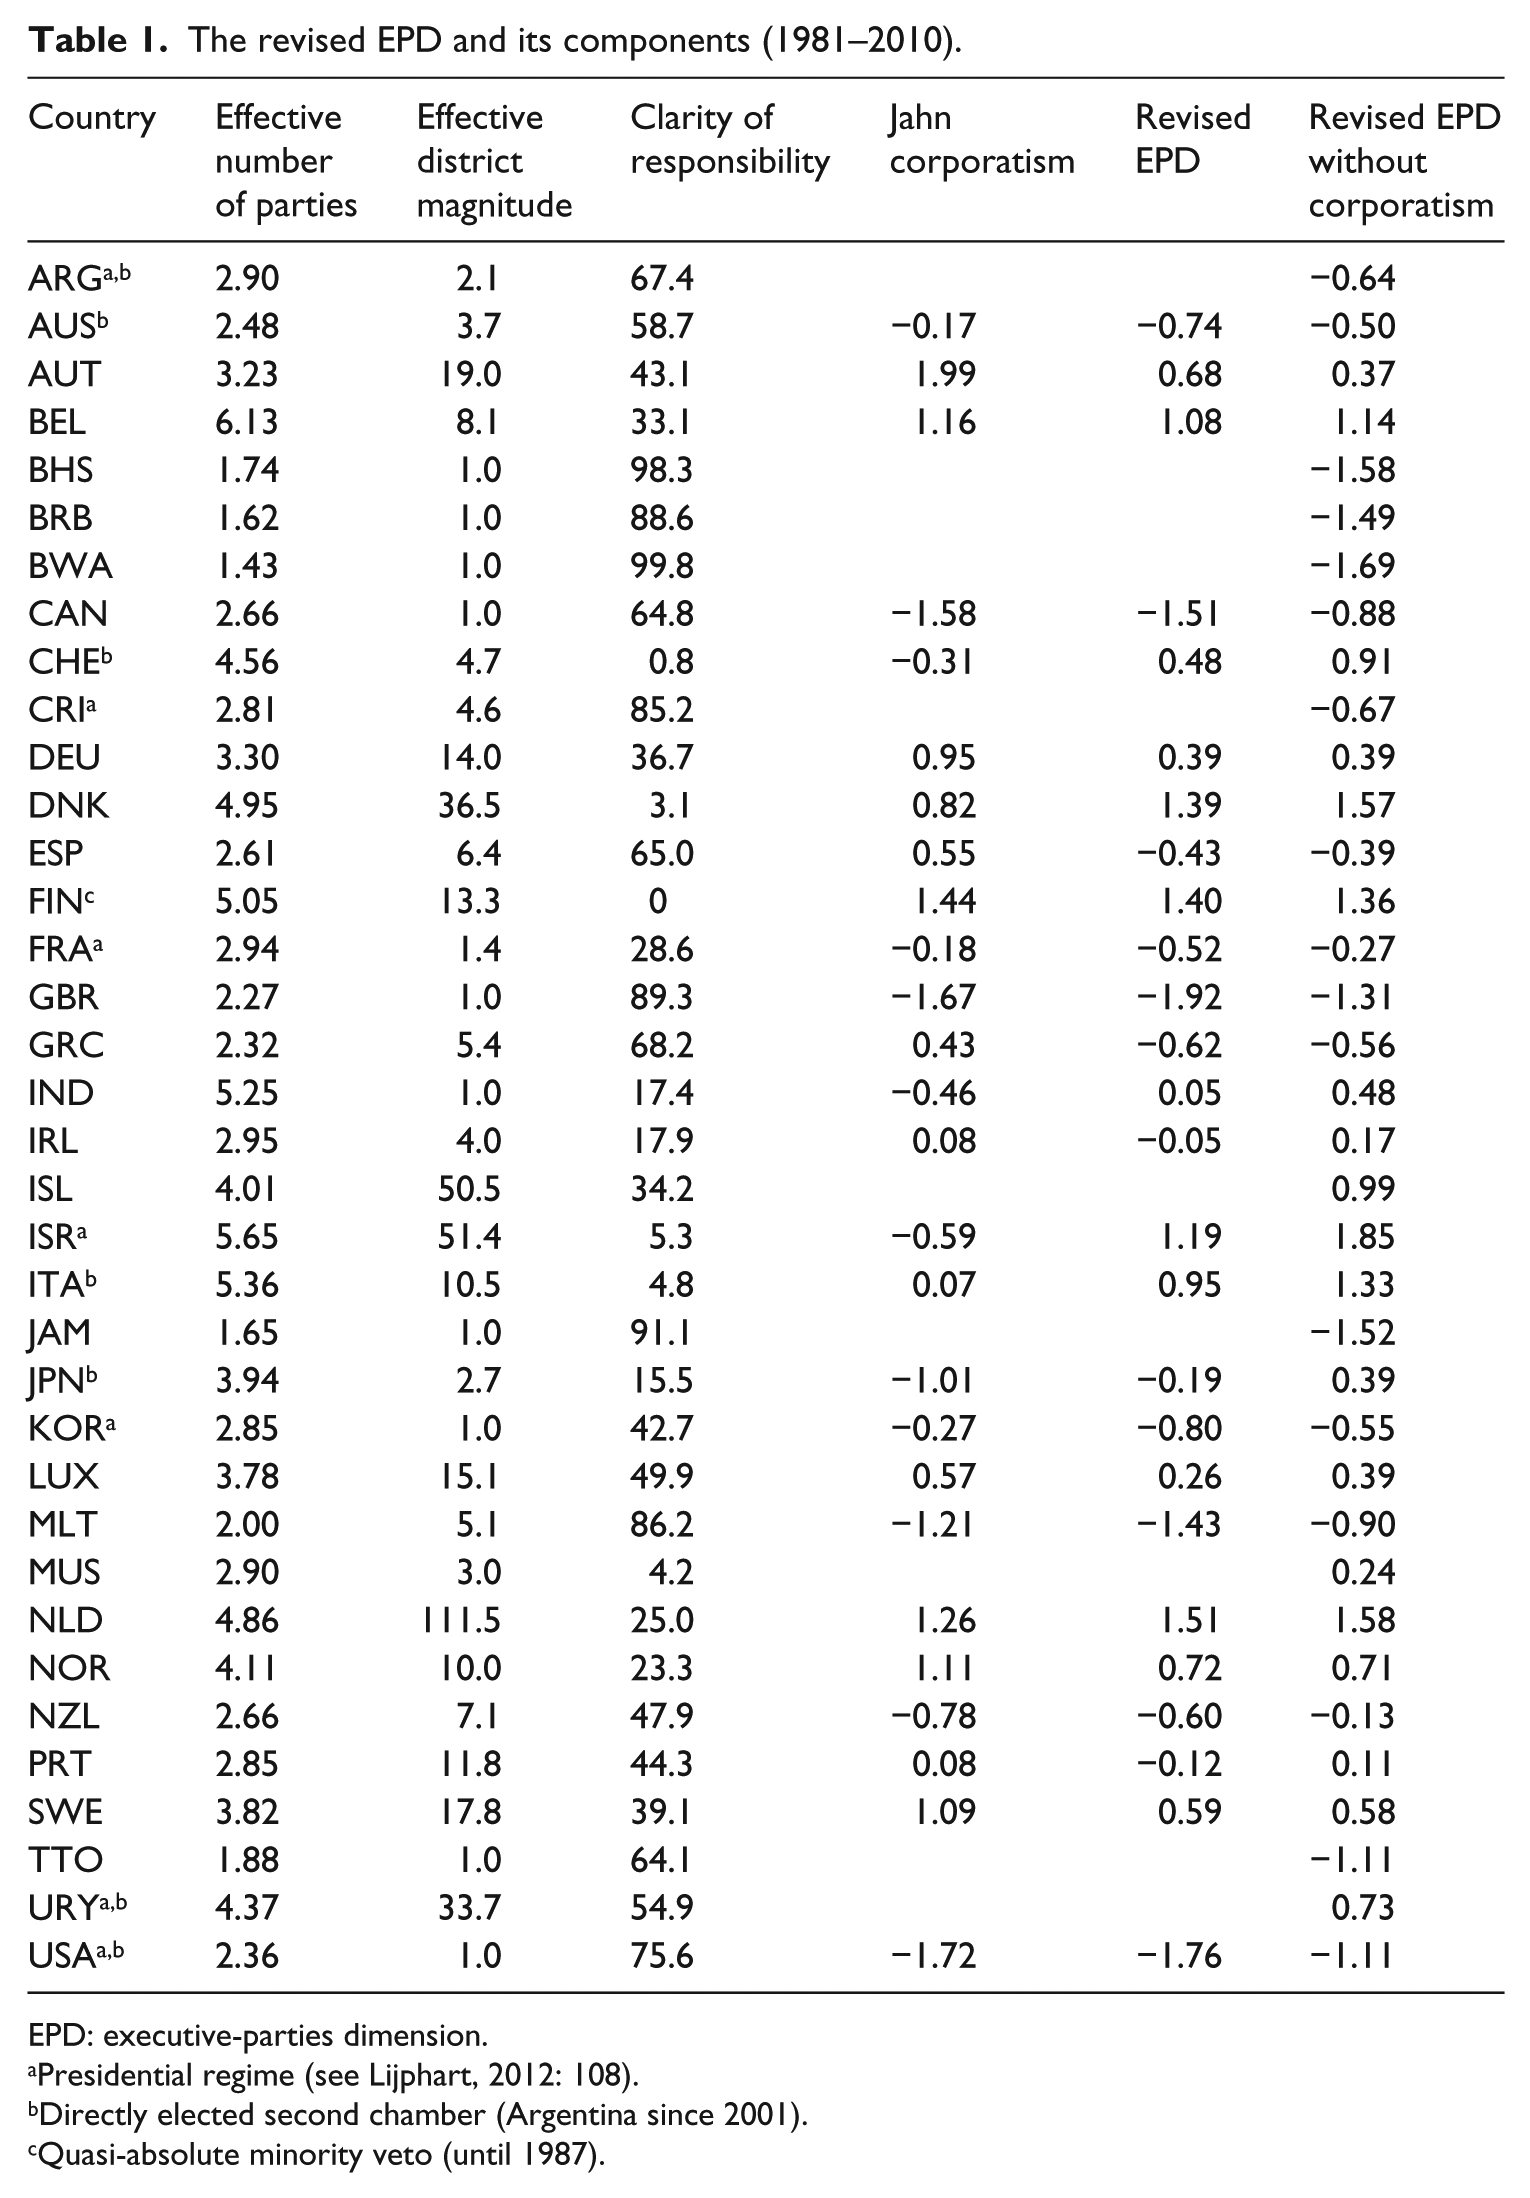
EPD: executive-parties dimension.
Presidential regime (see Lijphart, 2012: 108).
Directly elected second chamber (Argentina since 2001).
Quasi-absolute minority veto (until 1987).
Figures 1 and 2 plot these versions of the EPD against Lijphart’s original data for the 1981–2010 period. Two points are noteworthy. First, the overall patterns are very similar, the correlations with Lijphart’s data very high (.95 and .91, respectively). This is reassuring, since our goal was not to question the empirical patterns. It was rather to show that these patterns can be produced in a way that raises less questions about conceptual coherence or measurement validity and reliability.
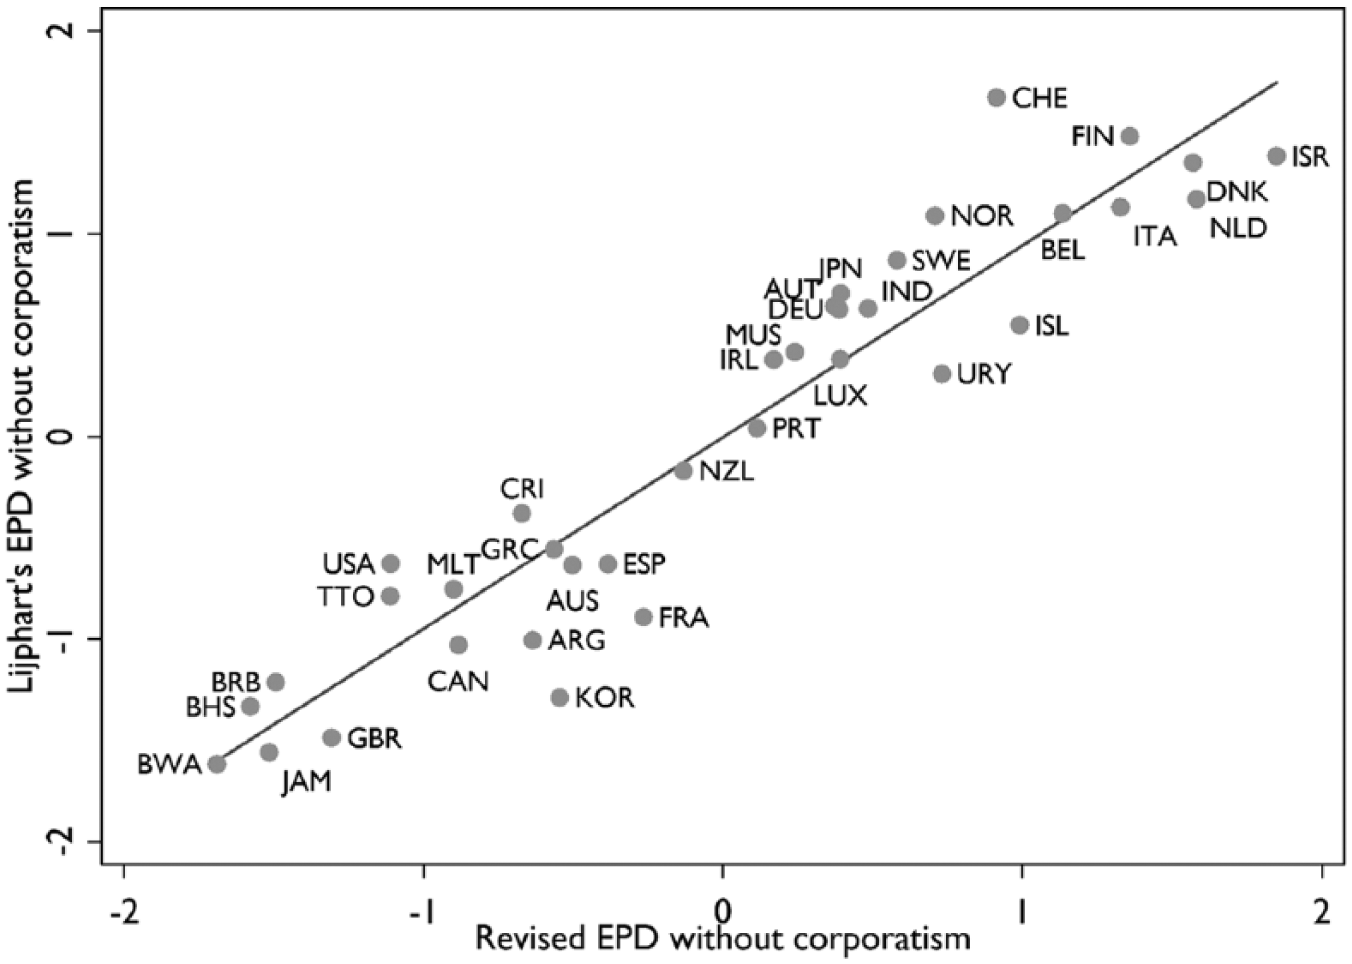
Lijphart’s EPD versus our revised EPD (without corporatism, 1981–2010).
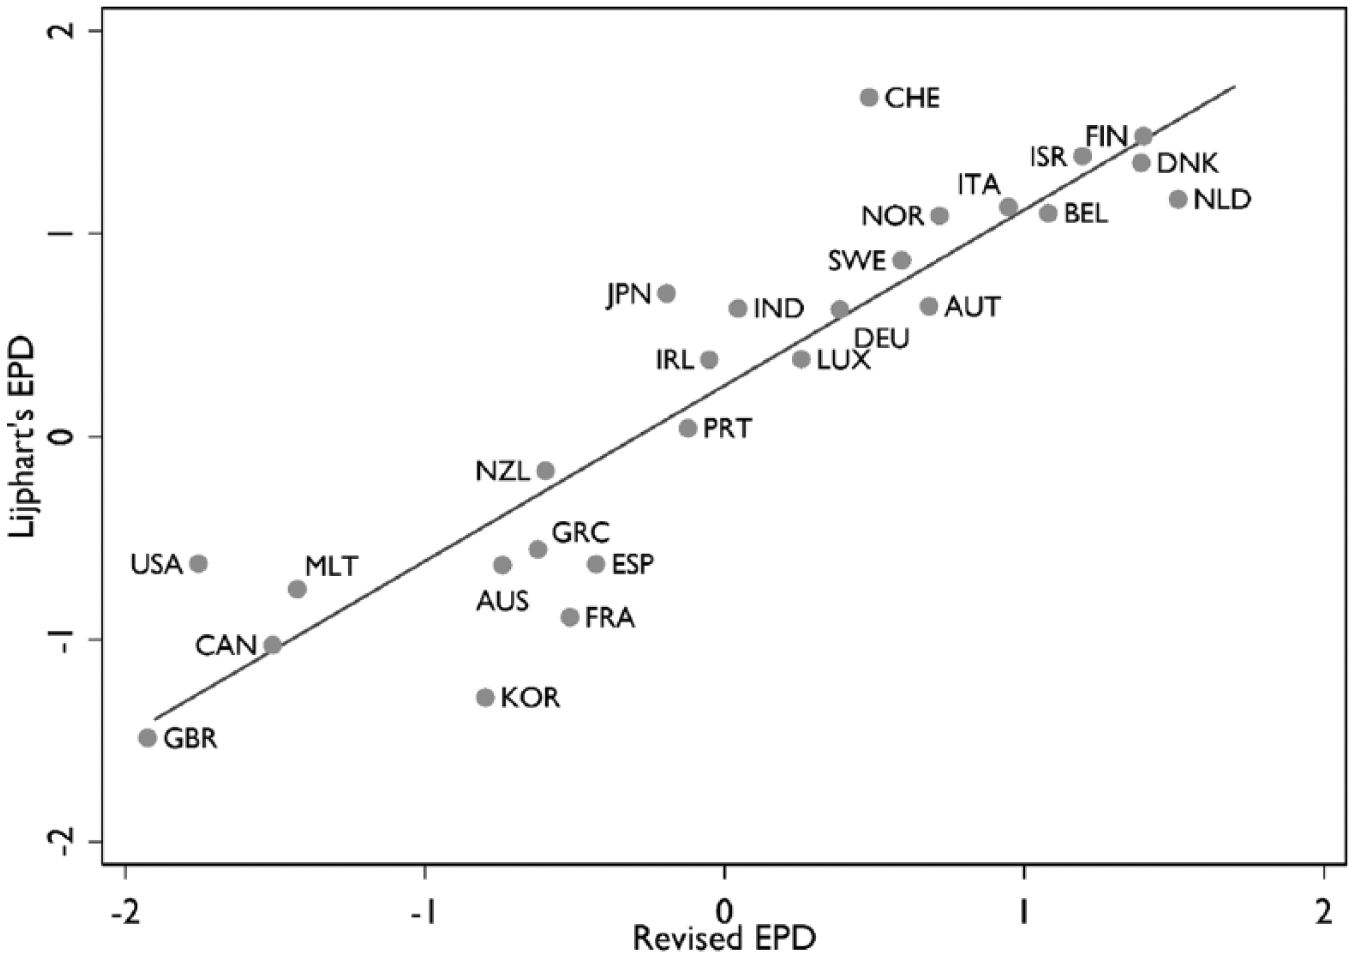
Lijphart’s EPD versus our revised EPD (1981–2010).
Second, however, some democracies do change their place in the distribution quite substantially. Most notably, Switzerland moves from the very top of the distribution towards a more intermediate position, whereas South Korea makes a similar change in the opposite direction. Both of these changes happen regardless of whether or not corporatism is included – in the case of Switzerland, the inclusion of corporatism makes it even more pronounced. This changed relative position of Switzerland is important, given that it is one of the cases from which the notion of ‘consensus democracy’ was derived. It is largely explained by the majoritarian election of upper house members in most Swiss cantons and by the rather pluralist interest group system (see Table 1).
How should we label the continuum expressed by the EPD? There has been some debate about this topic, which we do not aim to enter (e.g. Gerring and Thacker, 2008; Kaiser et al., 2002; Nagel, 1998). Given the multifaceted nature of democratic processes, the perfect label is unlikely to exist. Based on our proposed re-conceptualization, though, we prefer to think of the underlying ideals as ‘simple’ and ‘complex’ majoritarianism (Ganghof, 2015; Ganghof et al., 2015). These labels express that, at the level of the ideal, democracies as different as the United Kingdom and Denmark aim to empower a majority of voters, yet they choose different strategies for how to deal with the unavoidable complexity of forming majorities in pluralist societies. The Westminster model of two-party competition and one-party cabinets aims at simplifying the process (in the public eye) as much as possible, to achieve particular conceptions of representation and accountability. The risk of this strategy is that the coordination on two parties fails, in which case the underlying institutions may empower only a plurality of voters (Nagel, 1998). The opposite model – complex majoritarianism – embraces multiple parties, competing along multiple issue dimensions and leading to multi-party or minority cabinets, to achieve different conceptions of representation and accountability (Ganghof, 2016). The risk of this strategy is to overburden the cooperative capacities of separate political parties as well as the cognitive capacities of citizens.
While the EPD does a good job at expressing this contrast, the inclusion or exclusion of particular variables maybe treated as a pragmatic matter, at least as far as the descriptive project is concerned. The explanatory project raises different issues to which we now turn.
From description to explanation?
This section cautions against making too quick a transition from the descriptive to the explanatory project, that is, against using the EPD for the explanation of democratic performance. The averaging of distinct explanatory variables requires a methodological justification. One justification could be that the average captures a latent variable, which is the actual cause of high or low performance. Yet, it is not clear what this latent variable is or whether it is a causally efficacious aspect of the real world. By contrast, the individual variables that constitute the EPD can all be seen as causes in their own right.
It is also important to recall that most of the variables of the EPD form a causal chain. Electoral systems influence party systems which in turn influence clarity of responsibility (cf. Taagepera, 2003). Based on our revised measures, the correlations along this chain are .64 and −.80, respectively. 10 Hence, if high or low performance in a particular area are caused by a particular link in the causal chain, averaging this variable with others is likely to dilute the empirical picture and reduce our causal understanding. We want to illustrate this problem by re-analysing two of Lijphart’s performance tests: on turnout and the death penalty. We do not claim that our findings on these two performance indicators are representative of or generalizable to his other tests. 11 Our goal is merely to exemplify the danger of averaging distinct causal variables without a clear theoretical and methodological rationale. We argue for both performance indicators that (1) the crucial causal variable is the electoral system and that (2) the effective district magnitude captures the putative cause better than empirical disproportionality. For the death penalty, we also show (3) that locating the putative causal effect more precisely helps us to see the high probability of it being spurious.
Turnout
Lijphart’s (2012: 284–285) causal claim is that ‘[c]onsensus democracy has a significant positive effect on voter turnout … [T]he average consensus democracy has a voter turnout that is more than 7 percentage points higher than the turnout in an average majoritarian democracy’. We find this causal claim problematic because it summarizes distinct and potentially conflicting causal mechanisms.
The literature on turnout explains why averaging the variables in the EPD is problematic. First of all, there is no clear reason why corporatism should affect turnout. More importantly, there is a large literature suggesting that the remaining variables of the EPD have contradictory effects on turnout (see Tillman, 2015: 727 and the literature cited therein). On the one hand, electoral proportionality tends to increase turnout by encouraging the supporters of small parties to vote and by avoiding the creation of uncompetitive districts. On the other hand, multi-party systems have been found to reduce turnout by making elections less decisive and lowering clarity of responsibility (thus reducing the incentive to cast a retrospective vote). ‘In short, citizens are less likely to vote as the number of parties increases’ (Tillman, 2015: 728).
Blais et al. (2014) also corroborate the idea that a potential positive causal effect of a proportional electoral system on turnout does not pass through the effective number or parties. They show that, at the macro level, the causal mechanism is polarization, that is, the ideological differences between parties. At the micro-level, greater ideological differences between (multiple) parties increase the likelihood that a voter can identify an ideologically proximate party and thus feel represented by it – and this feeling of being represented by a party increases a person’s propensity to vote (Blais et al., 2014). Since polarization and the effective number of parties seem to vary independently, the effective number of parties does not capture the relevant causal mechanisms at the macro level (Dalton, 2008). In terms of the causal chain of our revised EPD, then, we would expect that any positive effect on turnout results from the electoral system, while any potential effect of the effective number of parties or (low) clarity of responsibility is more likely to be negative.
Table 2 re-analyses Lijphart’s original turnout data for his 36 countries. Note that since his dependent variable neglects turnout in upper houses (Lijphart, 2012: 283–285), we also disregard (directly elected) upper houses here for the sake of consistency. Models 1 to 6 focus on one variable at a time and take Lijphart’s standard controls into account: the human development index and (logged) population size. Models 1 and 2 show the results for Lijphart’s original EPD as well as for the Gallagher index. 12 Models 3 to 6 present the estimates for our revised EPD (without corporatism) as well as the three individual variables. 13 We see that the positive effect of the EPD on turnout is exclusively the result of the electoral system and that effective district magnitude captures this effect better than the Gallagher index (models 2, 4 and 7). Finally, model 8 shows that the estimated effect of district magnitude is robust to Lijphart’s (2012: 284) more specific control variables (compulsory voting and frequent elections).
Explaining voter turnout 1981–2010 (OLS).
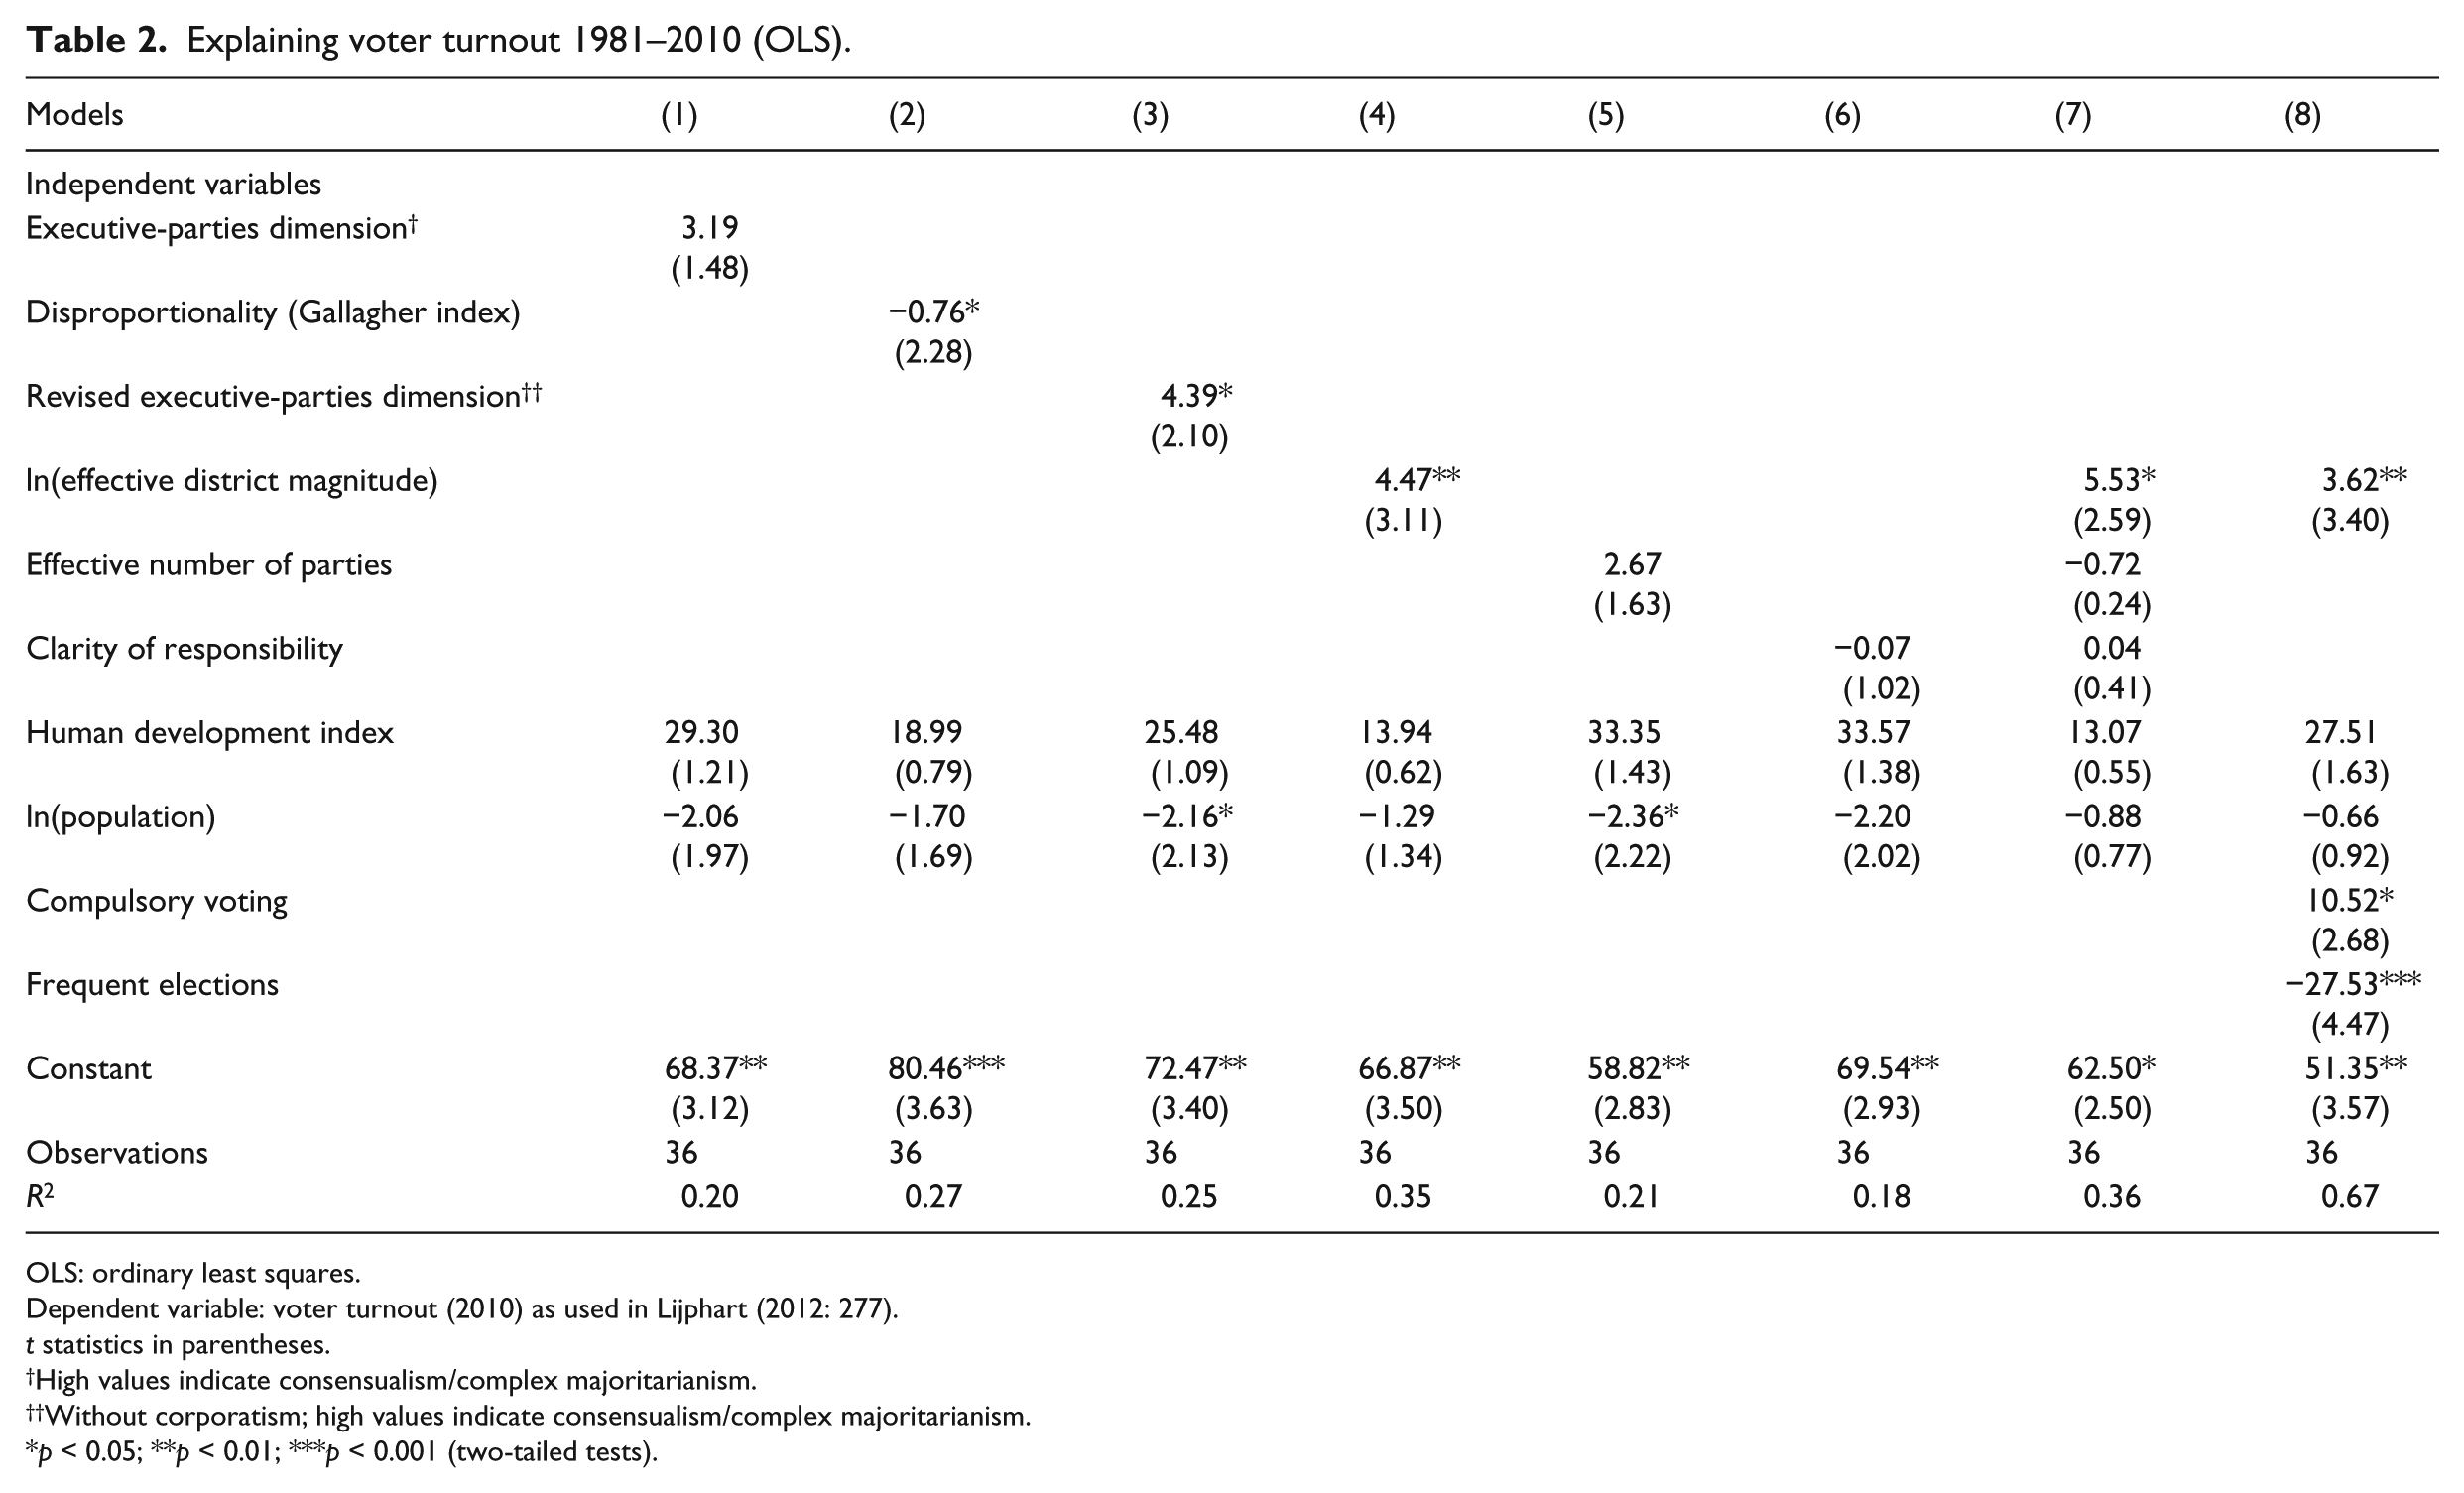
OLS: ordinary least squares.
Dependent variable: voter turnout (2010) as used in Lijphart (2012: 277).
t statistics in parentheses.
High values indicate consensualism/complex majoritarianism.
Without corporatism; high values indicate consensualism/complex majoritarianism.
p < 0.05; **p < 0.01; ***p < 0.001 (two-tailed tests).
While we should always be cautious in drawing causal inferences from cross-sectional observational data, the claim that proportional representation increases turnout is clearly meaningful, and it might well be true. In contrast, the claim that ‘consensus democracy’ increases turnout is highly ambiguous. It can at best be understood as a summary statement about the ‘net result’ of distinct and contradictory causal effects. Maybe Lijphart’s (2012) statistical ‘explanations’ based on the EPD are useful in this way, for example, by simplifying communication with practitioners. Yet, their adequate interpretation then depends on a deeper causal understanding that they cannot themselves provide. Without this deeper understanding, we may even make spurious causal claims, as our second example suggests.
Death penalty
Lijphart (2012: 292) states that ‘[t]he effect of consensus democracy on the use of capital punishment is strongly negative and significant at the 5 percent level’. His dependent variable is a three-point index. 14 Other authors make similar arguments. Van Koppen et al. (2002: 86) suggest that multi-party systems lead to ‘more nuanced discussions of the death penalty’. McGann and Sandholtz (2012: 279) develop a similar argument for parliamentary systems only. They argue that two-party systems are more likely to keep abolition off the political agenda. Since both parties must appeal to the median voter, neither of them will propose abolition, if a popular majority prefers retention. And even if there were a narrow public majority in favour of abolition, it maybe rational for both parties to avoid taking a position on a divisive issue. Since parties in multi-party systems do not have to appeal to the median voter, abolition can be on the agenda and debated, support for it can grow, and negotiated coalition agreements can lead to abolition even when a majority of voters is against it.
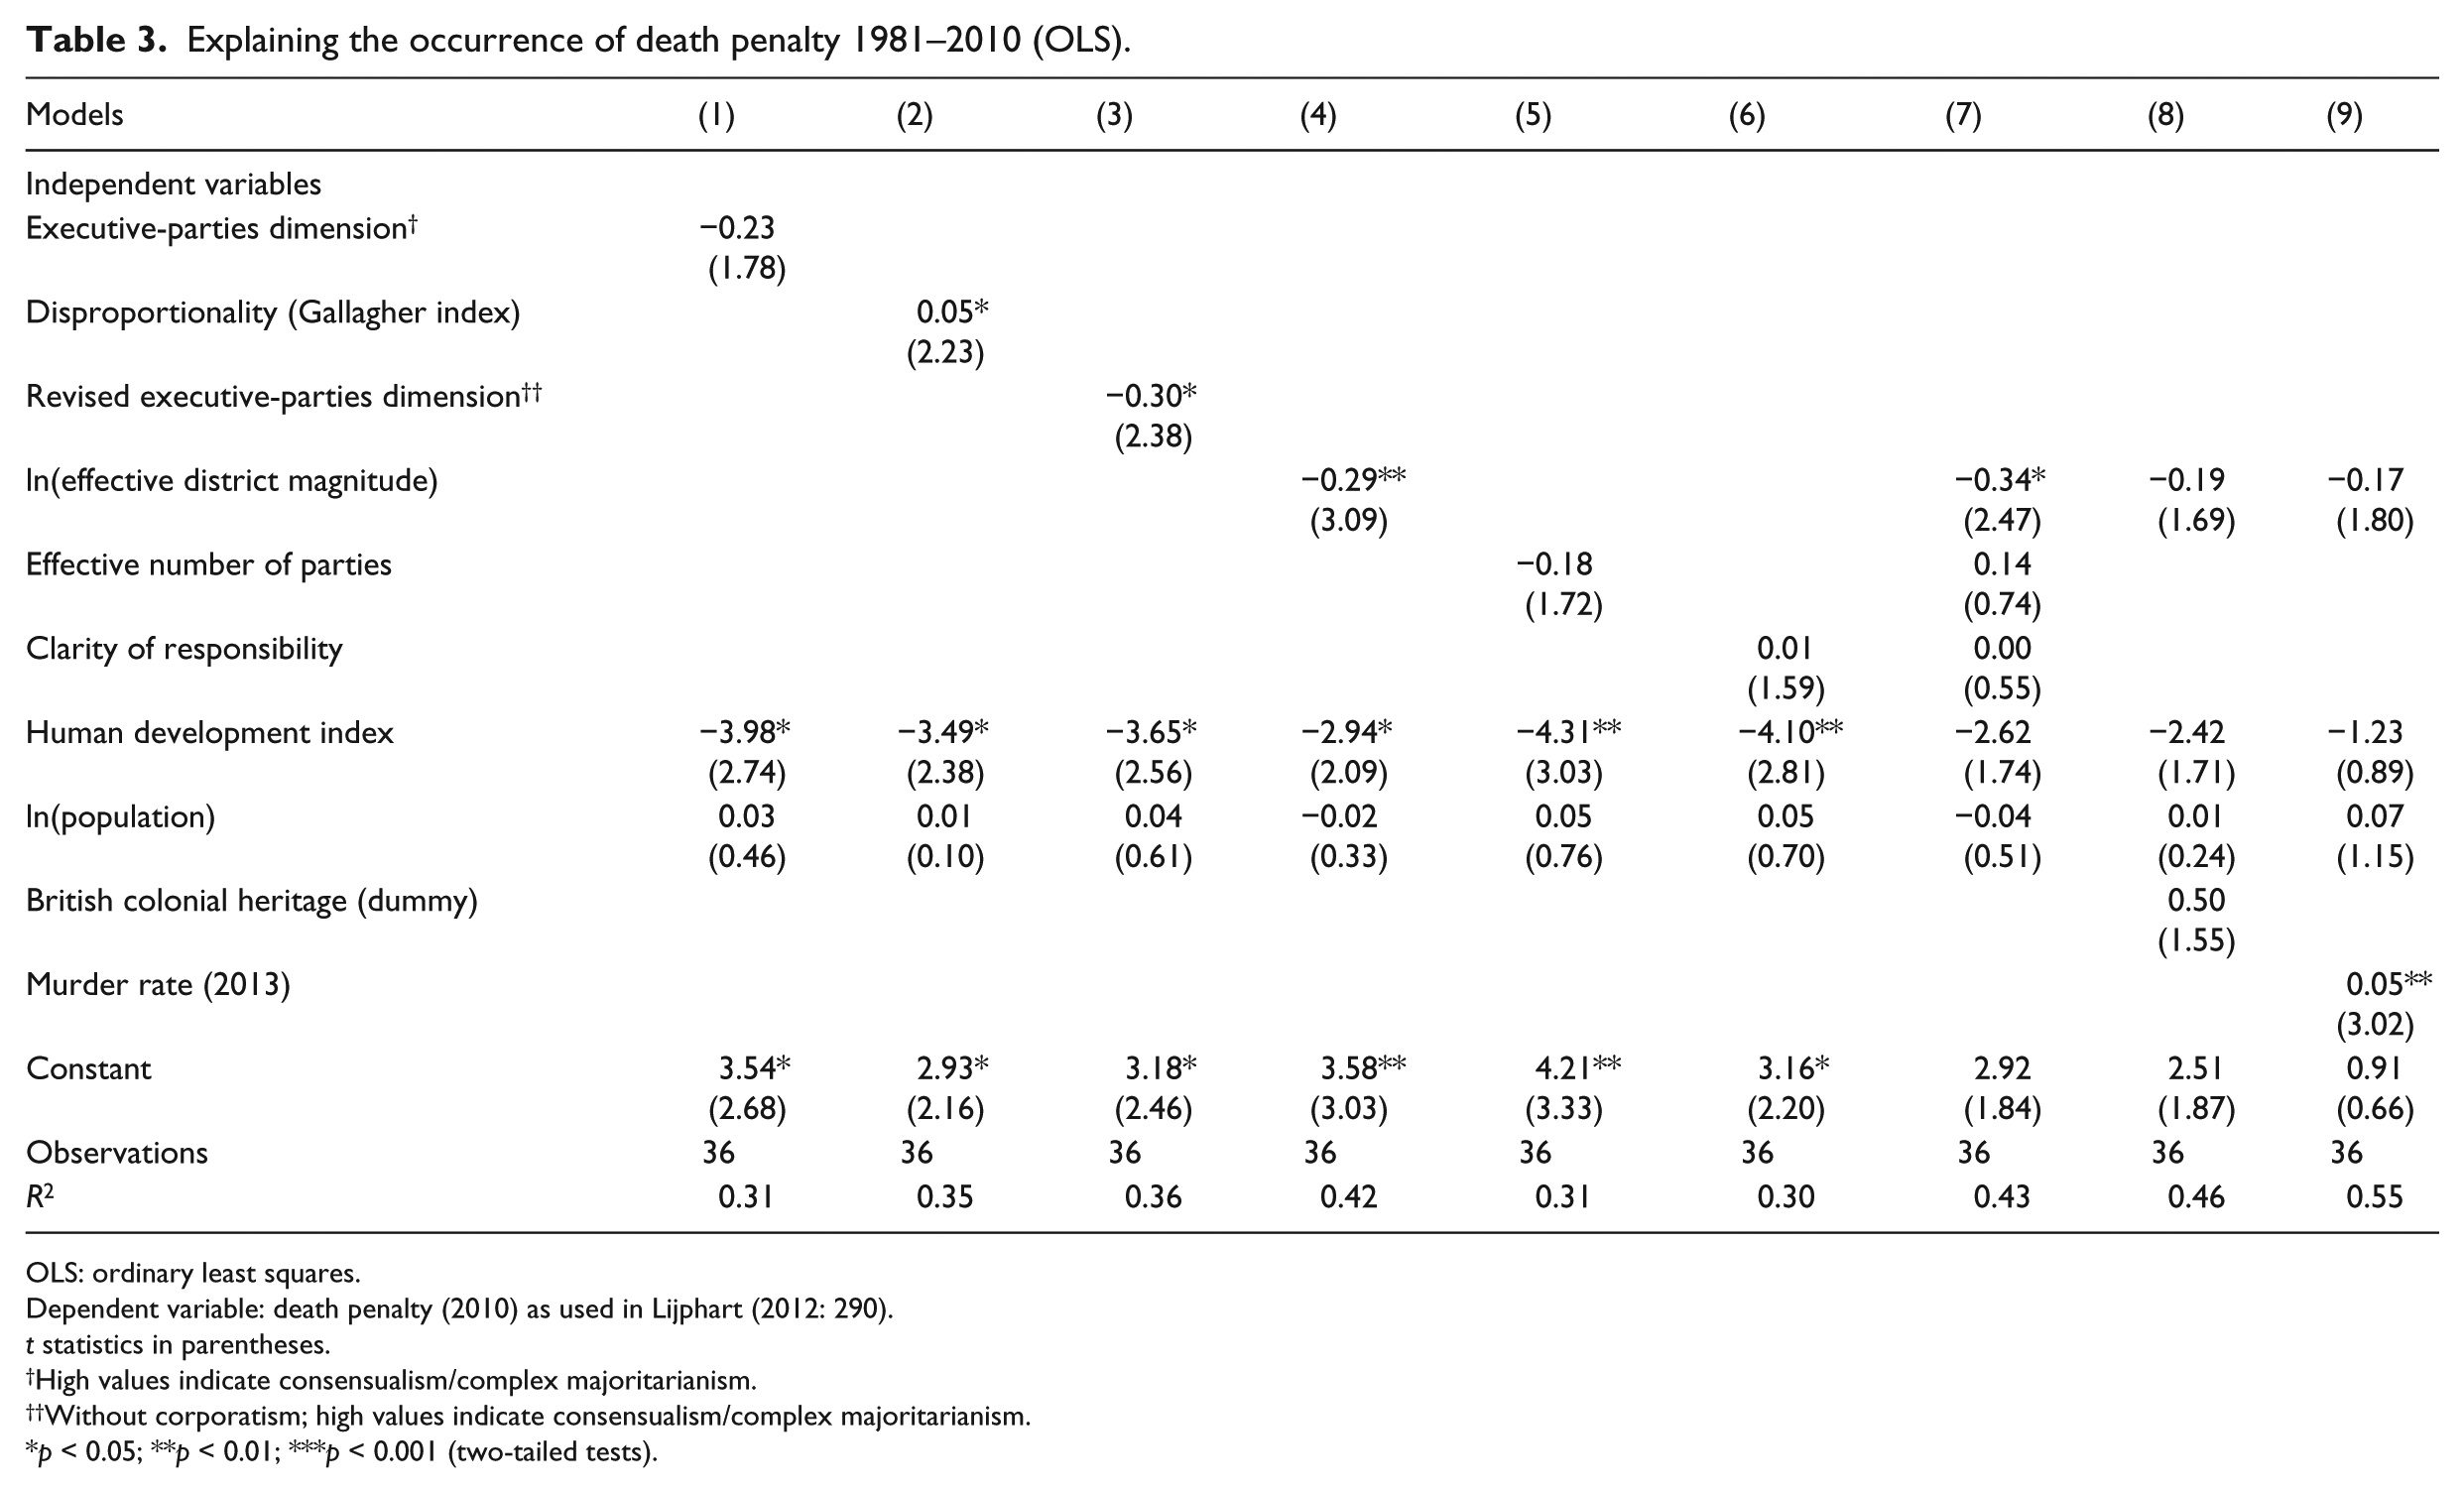
While these causal mechanisms are plausible, a re-analysis of Lijphart’s (2012) data does not support them (Table 3). 15 First, the relevant variable seems to be the electoral system, not the party system (models 5 and 7). Second, as for turnout, the putative causal effect of the electoral system seems to be better captured by the effective district magnitude (models 2 and 4). Third, though, this fact highlights the possibility of spurious causality. One reason is that British colonialism was a common historical cause of the introduction of single-member districts and capital punishment (e.g. Hood and Hoyle, 2015: 103–110; Knowles, 2015: 61). When we control for British colonial heritage, the putative effect of district magnitude is substantially reduced and becomes statistically insignificant (model 8). 16
Explaining the occurrence of death penalty 1981–2010 (OLS).
OLS: ordinary least squares.
Dependent variable: death penalty (2010) as used in Lijphart (2012: 290).
t statistics in parentheses.
High values indicate consensualism/complex majoritarianism.
Without corporatism; high values indicate consensualism/complex majoritarianism.
p < 0.05; **p < 0.01; ***p < 0.001 (two-tailed tests).
One may object that the above-sketched causal mechanisms focus on the retention of the death penalty, not its introduction. This objection faces two problems, though. First, while these causal mechanisms are centred on the party system, it does not matter in the statistical analysis. Second, when we focus on the retention of the death penalty, societal control variables such as murder rates have to be taken into account (e.g. Hood and Hoyle, 2015: 103–110; United Nations Office on Drugs and Crime (UNODC), 2014). 17 Controlling for murder rates clearly improves the fit of the statistical model and renders the effect of district magnitude statistically insignificant (model 9). 18
We are hesitant to draw firm conclusions from our limited analysis. Our main aim was to show that, based on Lijphart’s data, no causal claims about any of the components of the EPD are justified. It seems to us that we lack a firm causal understanding of how democratic institutions affect the death penalty, so that Lijphart’s causal claim about the EPD cannot even be justified as a summary of the relevant causal effects.
Summary
As noted before, these two re-analyses of Lijphart’s performance tests are not representative. Yet, arguments similar to ours have been made for other aspects of democratic performances such as economic outcomes and satisfaction with democracy (e.g. Anderson, 2001; Armingeon, 2002; Donovan and Karp, 2017; Giuliani, 2016). With respect to other performance indicators, such as corruption, the controversy not only concerns the most relevant causal variable or the size of the casual effect but also whether this effect is positive or negative. While Lijphart (2012: 264) claims that ‘[c]onsensus democracy has a favorable effect’ on corruption, a recent in-depth study by Schwindt-Bayer and Tavits (2016) argues that higher clarity of responsibility reduces corruption. Since two of Lijphart’s variables are best understood as measures of clarity of responsibility, and very close to the measures used by Schwindt-Bayer and Tavits, their results contradict his. We do not want to position ourselves in this and other debates, but believe that the averaging of distinct causal factors – that is, the EPD – will not be useful in resolving them. To the contrary, only if it is possible to resolve them through more focused causal analysis, might the EPD be used to summarize our causal knowledge.
Final remarks
While we have been sceptical about Lijphart’s explanatory project, we believe that the descriptive project is viable. We see the EPD not as a measure of some latent causal factor, but as a pragmatic approach to summarizing patterns of accountability and representation in democracies. It is an average, no less, no more. This average works best for pure parliamentary systems, while stronger assumptions are needed for systems with separate presidential elections and/or directly elected upper houses. One interesting question for further discussion is if and how Lijphart’s assumptions can be changed to better reflect the reality of systems with two or three directly elected branches of government.
We want to conclude by suggesting two indicators that might be included into the EPD to paint a fuller picture. The first is dimensionality, that is, the (effective) number of salient competitive dimensions in party systems. As noted above, Lijphart (1984) had originally included an estimate of dimensionality but later decided to drop it because ‘it is not an institutional variable’ (Lijphart, 2012: 78). Strictly speaking, though, none of the variables in his EPD is purely institutional, and we see two reasons for including dimensionality. First, proponents of a proportional or ‘complex’ vision of democratic majority formation consider it an important goal that the dimensionality of democratic representation and deliberation is not constrained, partly because parties’ stances educate voters about how issues are linked. A more multidimensional party system may also increase voters’ feelings of being represented (cf. Blais et al., 2014; Wagner et al., 2014) as well as their satisfaction with the democratic process (cf. Stecker and Tausendpfund, 2016). Second, while dimensionality is correlated with the effective number of parties, this correlation is not perfect (Ganghof et al., 2015: 68). For example, expert surveys suggest that the Swiss party system, despite its high number of parties, is rather one-dimensional (Benoit and Laver, 2006: Chap. 5). Including dimensionality may help better distinguish the ‘quality’ from the ‘quantity’ of party systems (cf. Dalton, 2008).
Another important variable is identifiability, that is, the ability of voters to identify competing options for government before the election (Strøm, 1990). This variable is the mirror image of clarity of responsibility (Powell, 2000). While clarity of responsibility focuses on voters’ retrospective evaluations, identifiability focuses on their prospective reasoning. Based on our re-conceptualization of the EPD, there is little reason to include one but not the other. In parliamentary systems, identifiability is systematically related to the effective number of parties, but it would also add new information on the ability of separate parties to group into competing pre-electoral coalitions (Ganghof et al., 2015: 56–57; Shugart, 2001). As noted above, presidential systems can achieve identifiability independently of the party system, so that this variable might help better account for presidential constitutions. It has also been argued that identifiability increases democratic performance, everything else being equal, for example, with respect to public budgets and turnout (Cheibub, 2006; Tillman, 2015).
If the EPD is a descriptive tool for summarizing certain features of democracies, as we contend it is, the inclusion or exclusion of particular variables can be decided pragmatically, depending on descriptive goals, sample size and data availability.
Footnotes
Acknowledgements
We thank Leon Gärtner and Fabio Ellger for research assistance as well as two anonymous reviewers for their helpful comments.
Funding
The author(s) disclosed receipt of the following financial support for the research, authorship, and/or publication of this article: Funding from the German Research Foundation (DFG) is gratefully acknowledged (grant number GA 1696/2-1).