
Abstract
A survey of ordinary members of the United Kingdom’s Conservative Party carried out in 2013 revealed that nearly 30% of them would seriously consider voting for the country’s radical right wing populist party (United Kingdom Independence Party (UKIP)). However, we show that at the general election in 2015, only a very small proportion of them – around 5% of Tory grassroots members – actually did so, driven it seems mainly by alienation from the leadership and David Cameron in particular, as well as, perhaps, by concerns about the Conservative-led government’s austerity policies. However, those party members who did eventually vote for UKIP were still much more likely to have expressed a propensity to vote for it in 2013 than those who did not. Since the Conservative Party has not experienced the same increase in membership as some of its competitors, and since members are an important part of parties’ electoral campaigning, they should avoid alienating those members they do have – something of which Theresa May appears to be aware.
The 2015 general election saw the United Kingdom Independence Party (UKIP), then led by Nigel Farage, win over 4 million votes, although that impressive total secured it only one seat in the Commons – that of Douglas Carswell, the MP for Clacton in Essex who had defected from the Tories to UKIP just 7 months previously. Carswell, of course, was not the only Conservative to have jumped ship. The most high profile may have been Mark Reckless, MP for Rochester and Strood in Kent, who joined UKIP in the following month, but there had already been lower level defections at local council level, as well as tales of grassroots Tories either leaving their party to join Farage’s ‘People’s Army’ or at least backing it at the ballot box in what for Conservative Campaign Headquarters (CCHQ) were worrying numbers – especially in the wake of UKIP finishing first on 27% of the vote in elections to the European Parliament in May 2014. This anecdotal evidence was reinforced by an academic, survey-based study of Conservative Party members carried out in the summer of 2013, which suggested that well over a quarter of them were seriously considering voting for UKIP (Webb and Bale, 2014). More precisely, the study found 28.9% of grassroots Tories surveyed scored UKIP between 7 and 10 on a standard 10-point ‘propensity to vote’ (PTV) scale running from 0 (never) to 10 (very likely). 1 Significantly, this was after, not before, Conservative Prime Minister David Cameron made his ‘Bloomberg speech’ in January 2013 in which he promised the country an in-out referendum on the United Kingdom’s membership of the European Union (EU) – a promise made at least partly in response to concerns that, unless it were made, his party risked losing support to UKIP and becoming unmanageable, both at Westminster and out in the country (Bale, 2016; Seldon and Snowdon, 2016).
For Cameron, at least, that promise proved a fateful one: on 24 June 2016, in the immediate wake of the defeat of his campaign to persuade voters to keep the country in the EU, he announced his intention to step down as Tory leader and Prime Minister. But for the Conservative Party, the promise to hold a referendum may have been a wise move – at least in electoral and organisational terms. True, government whips at Westminster could rarely afford to relax completely after the Bloomberg speech as Conservative Eurosceptics put parliamentary pressure on Cameron to firm up his referendum pledge. But the party in the country held together (at least until the election) and (along with some well-targeted spending, a poorly regarded opposition, surging Scottish nationalism, an economic recovery, and a Liberal Democrat collapse) helped the Tories to win an unexpected overall majority in May 2015. This occurred notwithstanding the fact that UKIP – the populist insurgency that initially looked like it would hurt them much more than it would hurt Labour – did so well (Clarke et al., 2016; Cowley and Kavanagh, 2015; Geddes and Tonge, 2015; Mellon and Evans, 2016). That was at least partly because, as we go on to show, only a minority even of those ordinary Conservative Party members who were sorely tempted to switch to UKIP eventually succumbed to its charms.
Survey research on party members is a growing, international field, with a European network of scholars coordinated by the MAPP (Members and Activists of Political Parties) project, hosted by the Université Libre de Bruxelles and convened by one of the authors of a recent edited volume on the subject (see Van Haute and Gauja, 2017). 2 But the pioneering studies were carried out in the United Kingdom by Patrick Seyd and Paul Whiteley and their various collaborators. Indeed, one of the earliest studies, which focused primarily on trying to understand what led people to join the organisation, was of the Conservative Party (Whiteley et al., 1994). Hopes that follow-up surveys could be conducted foundered on the reluctance of the party to co-operate until, with the advent of a commercial pollster who had assembled an internet panel of sufficient size to enable researchers to survey the requisite number of respondents, work was able to begin again without the need to involve the party directly – an approach which led to a study which focused on members’ attitudes to the role of women among Tory members (Childs and Webb, 2011). The same approach was used more recently to study Conservative Party members’ attitudes to coalition (Bale and Webb, 2016) and the probability that some of them would support UKIP rather than their own party in 2015 (Webb and Bale, 2014) – a study which not only revealed (as we have seen above) that the latter represented a significant minority but also that those members most tempted to do so were (a) particularly concerned about immigration and Europe, (b) felt under-valued or even disrespected by their own leadership, and (c) regarded that leadership as ideologically more remote from them than UKIP.
One of the advantages of commissioning that commercial pollster to conduct a survey of party members in the summer of 2013 was that we are now effectively able to revisit our sample in order to compare how those party members were tempted to vote just under 2 years from a general election with how they actually voted (or at least recalled voting) when the general election was eventually held in the late spring of 2015. Conducting this comparison also allows us to explore what best predicts their decision to do so. Did those ordinary party members who were in effect threatening to vote for another party actually carry out that threat? Or did most of them stick with their party when it came to the crunch? And what was the difference between those who did and those who didn’t? Clearly any such defections at the ballot box can have had only the most marginal effect – at least in terms of members’ individual votes – even in constituencies where the race between the parties was closest. But they are nonetheless of considerable interest to scholars of political parties and their members: the latter are, after all, generally supposed to be both a source of guaranteed votes and act as ‘ambassadors to the community’ boosting support for the party among rather less engaged citizens (Scarrow, 1996: 43).
Data and method
YouGov conducted an Internet survey of 852 Conservative Party members between 31 May and 11 June 2013 and were then able to return to the sample post-election to find out how these respondents actually voted. Note that, because this is not a random probability sample one cannot, strictly speaking, compute a margin of error for our data but given the size of our sample and the estimated membership of the Conservative Party, a standard calculator would put it at around 4% (with a 95% confidence level). Note, too, that the data are not weighted in any way. We decided to work with the raw data for two reasons: first, there are no known population parameters that could be used for the Conservative Party membership’s demographic profile; second, a previous YouGov survey of the party’s members conducted at the time of the leadership election in December 2005 produced an extremely accurate prediction of the final result on the basis of raw data (i.e. to within 1 percentage point of the actual result). 3 Attempts to weight that data on that occasion made no appreciable difference to the outcome. In this respect, we follow previous practice regarding recent academic surveys of the Conservative Party membership (see Childs and Webb, 2012; Webb and Bale, 2014). Note too that previous research suggests that in the United Kingdom results from national internet samples compare well with probability samples (Sanders et al., 2007). Drawing on this dataset, we compare members’ declared PTV for UKIP at the next general election to their actual, self-reported vote in 2015. We first look at the extent to which those who seemed most likely to vote for UKIP in 2013 actually turned out to vote for the party in 2015. We then look at whether those who voted Conservative and those who voted UKIP present significant differences in demographic and ideological characteristics. Finally, we model the choice to vote UKIP as opposed to Conservative with three binary logistic regressions. It is of course only right to express a degree of caution in interpreting our findings because of the low N of UKIP-inclined Tory party members on which part of our analysis is inevitably based. It is worth noting, however, that the percentage of Conservative Party members who voted for UKIP in our dataset is similar to that found among both Conservative Party members and strong supporters in the British Election Study (BES) internet panel dataset and that our findings are encouragingly consistent with those on the attitudinal drivers of UKIP voters in the electorate more generally (Ford and Goodwin, 2014). 4
Results
The first thing to note is that the individuals who comprised the sample of Conservative Party members in 2013 proved overwhelmingly likely to have actually voted in 2015; some 99% reported having done so and there was almost no difference in participation rates between those who voted for Conservative candidates and those who eventually voted for candidates from other parties. 5
Of greater interest is the question of which party Tory grassroots members actually voted for in 2015. Table 1 reports the results and does reveal an effect of some interest. There is no denying that, when it came to the crunch, Conservative Party members proved overwhelmingly loyal to their party, with 93% voting for Tory candidates in 2015. However, it is also quite clear that those party members most likely to indicate that they might opt for UKIP in 2013 were indeed the members most likely to actually vote for Nigel Farage’s party in 2015. Of those who scored 0−3 on the ‘likelihood to vote UKIP’ scale in 2013, just 3 (0.9%) actually voted UKIP in 2015. Of those who scored 4−6, only 1 (0.7%) voted UKIP. But of those who scored 7−10, some 16.2% (28) voted UKIP.
Declared likelihood to vote for UKIP 2013 and actual vote 2015.
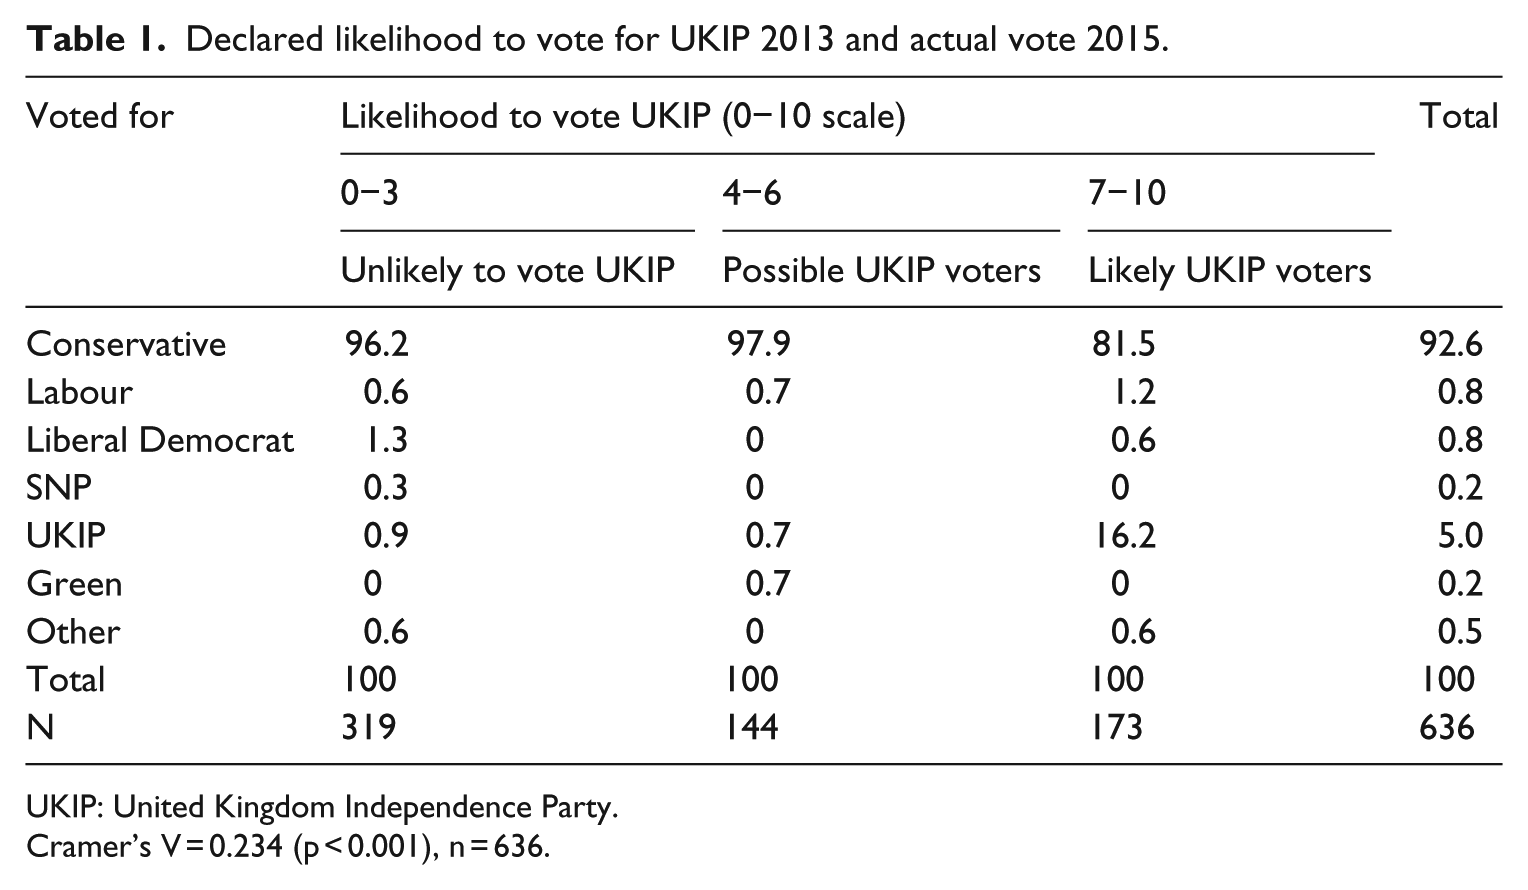
UKIP: United Kingdom Independence Party.
Cramer’s V = 0.234 (p < 0.001), n = 636.
One way of looking at this is to conclude that the Tories did well overall at holding on to the electoral support of their members. On the other hand, those in the 7−10 category constituted getting on for 30% of the membership sample, so constitute a non-trivial number. A comparison between Conservative members and voters certainly confirms as much. Overall, about 5% of our 2013 Tory members voted for UKIP in 2015 (and – interestingly although this is not our focus here − 2.5% for other non-Conservative parties), compared to 4.7% of voters who told the BES they strongly identified with the Conservative Party and 12.1% of those who told the BES they voted Tory in 2010. 6 So, being a party member certainly increases the prospect of voter loyalty (unsurprisingly), but it by no means absolutely guarantees it. Translated to the 150,000 members that the Tories claimed to have in 2015, we can infer that about 7300 party members might have defected to UKIP at the polls. We cannot rule out the possibility, of course, that some of this switching might have been down to tactical voting by members who, for example, happened to live in a safe Labour seat. Although the size of this group in our data does not allow us to statistically test the influence of seat marginality, it is unlikely that this would account for the whole of the difference between those in the lower and higher ‘likelihood to defect’ categories: since, as we go on to show below, we have found that a number of key explanatory variables are significant (and in the expected direction), if tactical voting is an important factor, it is also significantly related to these variables. It therefore seems a reasonable inference that a significant number of those most attracted to UKIP ended up voting for Nigel Farage’s party for non-tactical reasons.
So what might these reasons be? In a previous paper, Webb and Bale (2014), pointed to a number of factors that were associated with a Conservative party member expressing the possibility that he or she might vote for UKIP. Most prominent were general ideological orientations (in both left–right and social liberalism/authoritarianism terms), hostility to the EU and immigration, and a sense of alienation from the party leadership. Have these factors been important in moving the minority of members who actually voted for UKIP? Table 2 provides some insights, showing when differences between groups are statistically significant. Compared to Tory members who stayed loyal to their party at the polls in 2015, those who voted for UKIP were significantly more likely to be male and from a lower socio-economic class. They are also slightly younger and less likely to be educated to graduate level, though not significantly so. In terms of general ideological orientation, Tory members who voted for UKIP are (arguably like UKIP itself) significantly less right-wing – relatively speaking at least – on the traditional left–right dimension, covering matters like the distribution and ownership of wealth and business and workers. But they are no different from their fellow Tory members in terms of their social or cultural conservatism, namely, their attitudes on matters such as respect for traditional values, authority and the law, stiffer sentences for wrong-doing, and the need for censorship. 7 They also see themselves as significantly further away from their then leader, David Cameron, in left–right terms (in both directions) than those who voted Tory, and somewhat less distant from UKIP, though not significantly so.
Differences between Tory members who voted Conservative and those who voted UKIP in 2015.
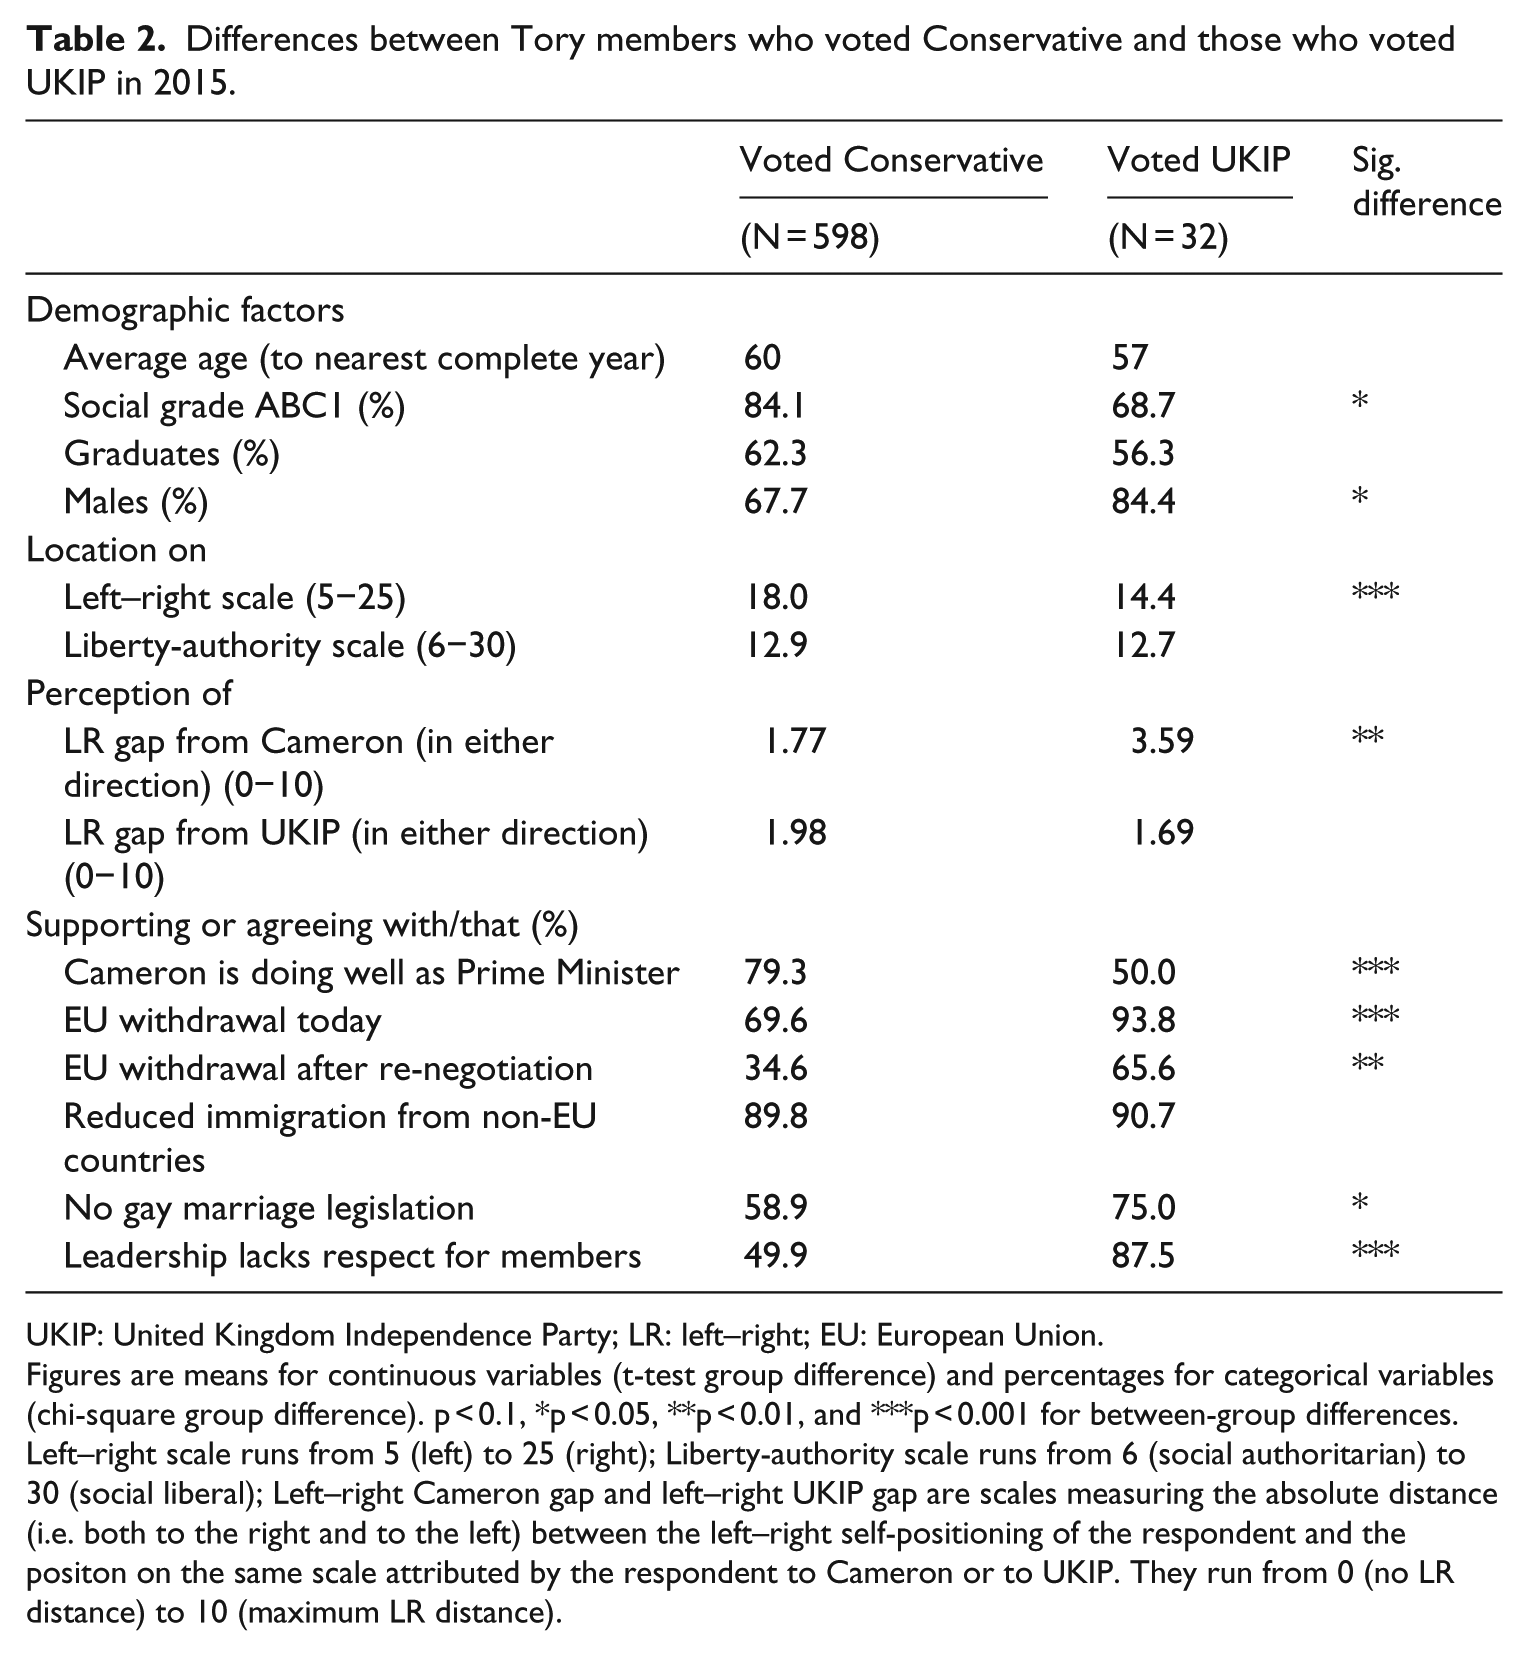
UKIP: United Kingdom Independence Party; LR: left–right; EU: European Union.
Figures are means for continuous variables (t-test group difference) and percentages for categorical variables (chi-square group difference). p < 0.1, *p < 0.05, **p < 0.01, and ***p < 0.001 for between-group differences.
Left–right scale runs from 5 (left) to 25 (right); Liberty-authority scale runs from 6 (social authoritarian) to 30 (social liberal); Left–right Cameron gap and left–right UKIP gap are scales measuring the absolute distance (i.e. both to the right and to the left) between the left–right self-positioning of the respondent and the positon on the same scale attributed by the respondent to Cameron or to UKIP. They run from 0 (no LR distance) to 10 (maximum LR distance).
In terms of the current issue and leadership evaluations which might impact voting behaviour in this context, we can see that attitude to non-EU immigration does not significantly differentiate the two groups of party members, but several others do. First, feelings about the EU are an evident point of difference, with significantly more of the Conservative Party members who plumped for UKIP indicating that they would vote for British withdrawal from the EU immediately or, indeed, even after re-negotiation. Second, they are also significantly less likely to feel that David Cameron is doing a good job as prime minister, or that the party leadership really respects the membership. Third, there is even a hint (although with a lower level of significance) that they are more opposed to gay marriage than those members who did not vote for UKIP. What happens when we examine the impact of these factors in a multivariate model?
Table 3 reports the results of three binary logistic regressions, with UKIP versus Conservative voting preference as the dependent variable. 8 In order to correct for the potential bias that can be introduced into the models when there is a small number of cases on the rarer of the two outcomes – which, in this instance, is voting for UKIP (N = 32) rather than the Conservatives (N = 598) – logistic regression models are run using the bias-correction method proposed by King and Zeng (2001), implemented in the Stata command relogit. 9 Model 1 consists of demographics only, while Model 2 adds in general ideological orientations, and Model 3 augments this with various issue and leadership evaluations that might be relevant (the full model). The only demographic variables reported in Model 1 that show any significant effects are class and gender. Social grade ‘AB’ members (i.e. professionals and managers) are significantly less likely to vote UKIP than social grade ‘DE’ members (i.e. semi-skilled, unskilled, and casual manual workers), while men are significantly more likely than women to do so. Education and age make no difference. When the ideological scales are added into the equation (Model 2), social class and gender retain their significance, although only at the 10% level; in addition, we see that left–right orientation matters, but liberty-authority does not; that is, the more (distributionally) left-wing a Conservative member is, the greater the chance that she or he (but more likely he) will vote UKIP.
Modelling vote for UKIP versus vote for Conservatives, 2015.
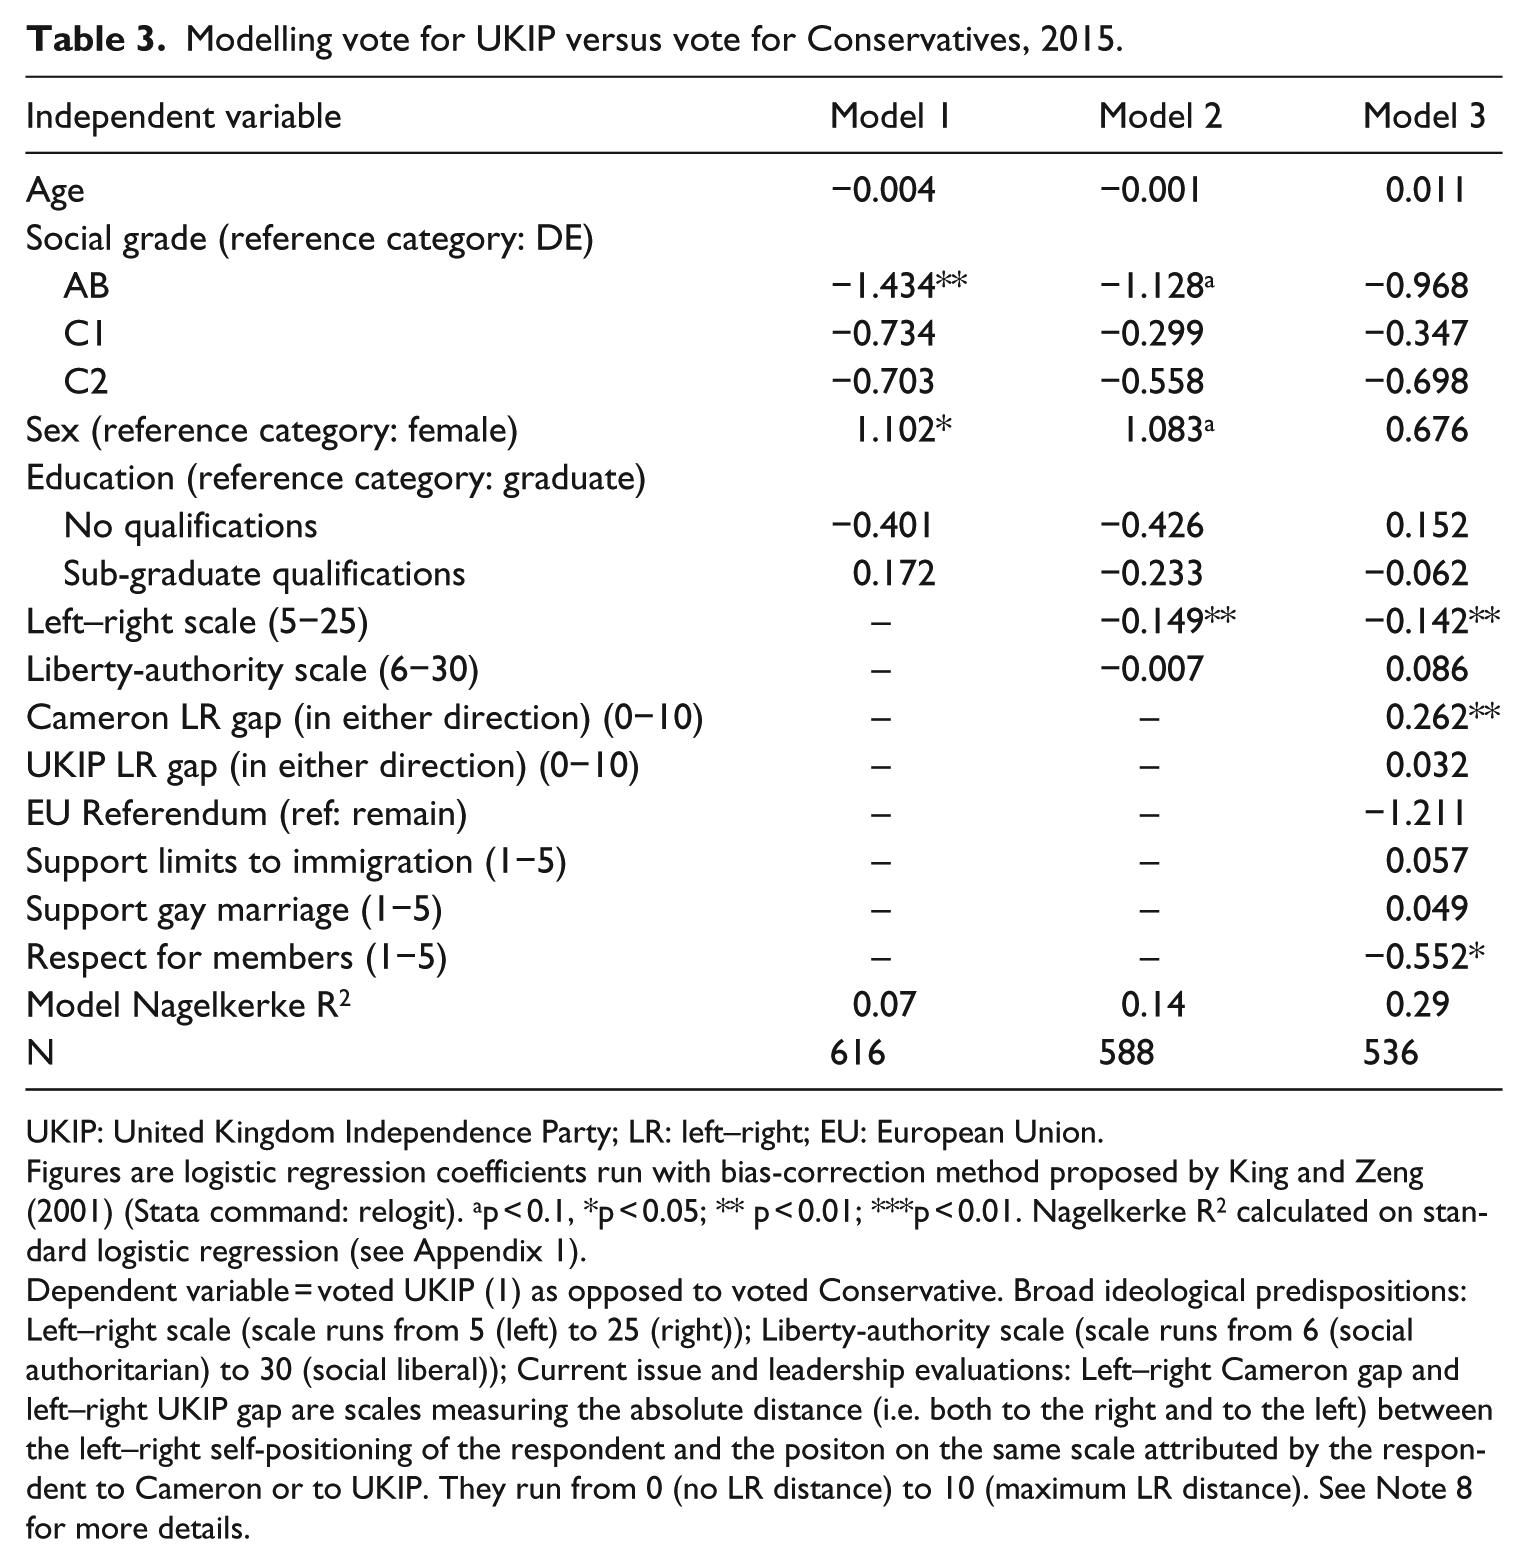
UKIP: United Kingdom Independence Party; LR: left–right; EU: European Union.
Figures are logistic regression coefficients run with bias-correction method proposed by King and Zeng (2001) (Stata command: relogit). ap < 0.1, *p < 0.05; ** p < 0.01; ***p < 0.01. Nagelkerke R2 calculated on standard logistic regression (see Appendix 1).
Dependent variable = voted UKIP (1) as opposed to voted Conservative. Broad ideological predispositions: Left–right scale (scale runs from 5 (left) to 25 (right)); Liberty-authority scale (scale runs from 6 (social authoritarian) to 30 (social liberal)); Current issue and leadership evaluations: Left–right Cameron gap and left–right UKIP gap are scales measuring the absolute distance (i.e. both to the right and to the left) between the left–right self-positioning of the respondent and the positon on the same scale attributed by the respondent to Cameron or to UKIP. They run from 0 (no LR distance) to 10 (maximum LR distance). See Note 8 for more details.
Finally, once the issue and leadership evaluations are added (Model 3), social class and gender lose their significance, although left–right orientation remains significant. Only two of the issue/leadership evaluations prove significant in the context of this full model: perceived ideological distance from Cameron and perceived respect for members shown by the leadership. The former means that the greater the perceived left–right distance from Cameron (in either direction), the more likely the member is to have voted for UKIP in the general election. The latter means that the less a respondent feels the leadership respects the membership, the more likely he or she is to have voted for UKIP in the general election.
Thus, in the final analysis, only three factors appear to have significantly influenced the decision to vote for UKIP once other considerations are controlled for: being less right-wing on distributional issues, the perception that one is ideologically distant from Cameron, and a sense of being afforded insufficient respect by the leadership. By contrast, the parallel model of likelihood to vote UKIP that was reported in advance of the general election (Webb and Bale, 2014) also found significant effects for the liberty-authority scale and attitudes to non-EU immigration and the EU referendum. These three effects have been washed out when it comes to actual, as opposed to projected, voting behaviour in the general election.
Clearly, then, a number of factors rendered Tory members susceptible to the lure of UKIP, but in the event most people remained loyal to their party; those who went the whole way and actually voted for UKIP at the 2015 general election did so because they felt seriously under-valued by the leadership, and because they felt their ideological differences with Cameron were too great. The latter perception may indeed be rooted in the fact that their underlying ideological orientation was not entirely in tune with that of the government. On one hand, in the context of the politics of the 2010−15 period, it may be that this reflects doubts about the government’s austerity agenda. Some support for this interpretation is offered by responses to questions about how strongly members supported certain actions by that government: thus, while 82% of those members who voted loyally for the Conservatives strongly supported the attempts to reduce the national debt and public sector deficit, only 56% of those Tory members who voted for UKIP did so, and while 70% of the former strongly supported the government cap on housing benefit payments, only 59% of the latter did. This is broadly consistent with something we know about UKIP voters in general – that, despite the right-wing label routinely attached to the party, its supporters are not notably keen on what some would call neo-liberal policies (Ford and Goodwin, 2014). On the other hand, party members who voted for UKIP do prove to have been more socially conservative than those who stuck with the Conservative Party in 2015. Some confirmation of this interpretation is offered by the difference between the two groups shown in Table 1 with the former group being more Eurosceptic and against gay marriage than the latter group. Thus, UKIP picked up some support from dissatisfied Tories both on the right with its cultural conservatism and on the left by being critical of the coalition government’s economic agenda.
Conclusion
In 2013, getting on for 30% of Conservative Party members suggested that they would seriously consider voting for UKIP – a level of disillusion and alienation that, had it continued into 2015, could have represented a loss of valuable campaign effort at the general election of that year, not least because work in progress clearly shows that a party’s members are much more likely than its supporters to carry out ‘high-intensity’ activities like canvassing (Webb et al., 2017). In the event, the proportion of Tory members who actually voted for UKIP when it came to the crunch appears to have been much smaller, at just 5%. Many, in other words, might have been tempted by the fruit of another, but when it came to it most decided not to take a bite. That said, those members who did ‘defect’ were considerably more likely to have signalled in 2013 that they might do so than were those members who remained loyal, perhaps reinforcing the contention that PTV scores are a useful indicator for survey researchers. When it came to members’ motives for their actions, those who eventually plumped for UKIP were more likely than those who voted Tory to feel that they were a long way away, ideologically speaking, from their party’s then-leader, David Cameron. They were also more likely to feel that the leadership had little respect for grassroots members. Those voting for UKIP were also a little less ‘right-wing’ (in the sense of favouring business and the market over government) on economic issues than their fellow members.
Academic observers may have found Cameron’s attempt to modernise the Conservative Party from 2005 onwards less than wholehearted or impressive (see Hayton, 2015; Peele and Francis, 2016). Yet that effort nevertheless appears to have alienated a sizeable chunk of his grassroots supporters from Cameron himself. Research suggests that voters more generally ‘respond negatively to increasing sociodemographic distance from party leaders’ (Cutler, 2002). But it was not the fact that, relative to every other Tory leader since 1965, Cameron enjoyed such a privileged upbringing that saw him run into trouble with at least some of his party’s members. Rather, it was the fact that he took it upon himself to embody and drive the changes he claimed the Tories simply had to make, including, most controversially perhaps, equal marriage (Bale, 2016: 236–359). Indeed, the passage of the Marriage (Same Sex Couples) Bill, which passed through the House in 2013 and the remarks made in May 2013, supposedly by someone very close to Cameron, about Tory activists being ‘swivel-eyed loons’ constituted something of a perfect storm, the impact of which was still being felt (at least by some grassroots Tories) 2 years later. The same, of course, could be said for austerity and the marked failure of the coalition government to live up to its repeated promises to do something about what many (including many ordinary Conservatives) saw as the excessive rewards beginning to flow again to the very same business people whose earlier recklessness had, at least in part, made that austerity necessary in the first place.
Turning around the telescope, our research suggests not only that party members are much more likely to turn out to vote than non-members but that they are, as one would expect, overwhelmingly likely to vote for the party to which they belong. Although far more members than one might think are apparently willing to consider voting for other parties, most of them do not end up doing so. Whether hints that they might do so reflect genuine indecision, temporary dissatisfaction, a desire to signal to the party’s leadership that something has to change, or, indeed, a mix of all three motives remains a moot point. 10 However, given how low (although not negligible) the risk that members who suggest they might vote for other parties will actually do so, their leaders should probably trouble themselves less about that and more about ensuring that they maintain their membership levels. While the latter is not something that a number of UK parties, in stunning contrast to their European counterparts, would appear to need to worry about right now, they need to remind themselves that the surges they have experienced in recent years may turn out to be temporary. If that is the case, then the Conservative Party, whose post-Brexit bounce has been much less marked than the post-Scottish Independence Referendum and Corbyn booms experienced by the SNP and by Labour, will need to think even harder than its competitors about how to respond. Given how many of its current members have thought seriously about UKIP, Theresa May’s fairly transparent attempt to airbrush David Cameron out of Tory history and colonise some of Nigel Farage’s territory may be a very smart move.
Footnotes
Appendix
Robustness test: results of standard binomial logistic regression.
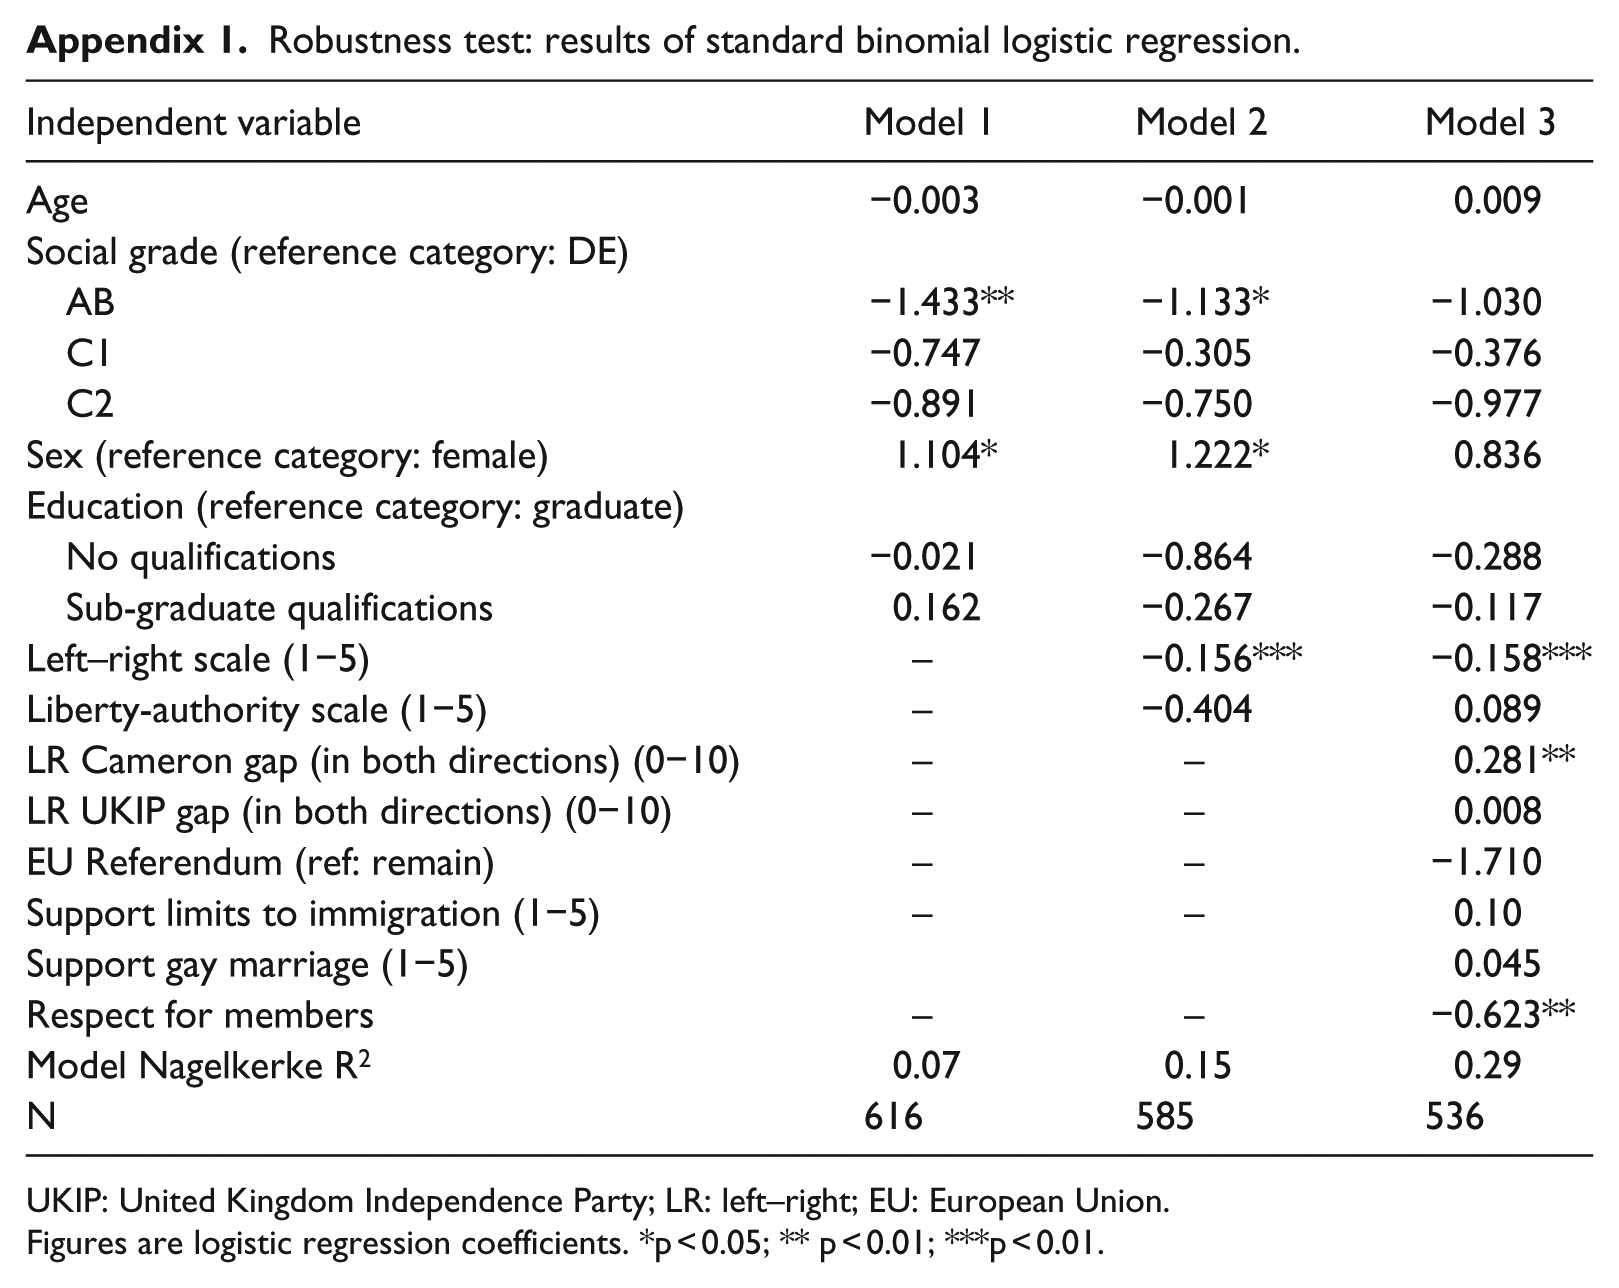
| Independent variable | Model 1 | Model 2 | Model 3 |
|---|---|---|---|
| Age | −0.003 | −0.001 | 0.009 |
| Social grade (reference category: DE) | |||
| AB | −1.433** | −1.133* | −1.030 |
| C1 | −0.747 | −0.305 | −0.376 |
| C2 | −0.891 | −0.750 | −0.977 |
| Sex (reference category: female) | 1.104* | 1.222* | 0.836 |
| Education (reference category: graduate) | |||
| No qualifications | −0.021 | −0.864 | −0.288 |
| Sub-graduate qualifications | 0.162 | −0.267 | −0.117 |
| Left–right scale (1−5) | – | −0.156*** | −0.158*** |
| Liberty-authority scale (1−5) | – | −0.404 | 0.089 |
| LR Cameron gap (in both directions) (0−10) | – | – | 0.281** |
| LR UKIP gap (in both directions) (0−10) | – | – | 0.008 |
| EU Referendum (ref: remain) | – | – | −1.710 |
| Support limits to immigration (1−5) | – | – | 0.10 |
| Support gay marriage (1−5) | 0.045 | ||
| Respect for members | – | – | −0.623** |
| Model Nagelkerke R2 | 0.07 | 0.15 | 0.29 |
| N | 616 | 585 | 536 |
UKIP: United Kingdom Independence Party; LR: left–right; EU: European Union.
Figures are logistic regression coefficients. *p < 0.05; ** p < 0.01; ***p < 0.01.
Acknowledgements
The authors would like to thank staff at YouGov (including Joe Twyman, Anthony Wells, Laurence Janta-Lipinski, and Chris Curtis) and the British Election Survey (BES).
Funding
The author(s) disclosed receipt of the following financial support for the research, authorship, and/or publication of this article: Funding for this research was provided by the Economic and Social Research Council (Award ES/M007437/1).