
Abstract
Models of varying degree of sophistication are used in vehicle dynamic studies. For ride comfort, Kelvin–Voigt arrangement is preferred and for impact harshness analysis, a relaxation-type suspension model, Zener or Maxwell type is used. The nonconsideration of relaxation-type models in ride comfort studies can result in significant errors for frequencies below ∼30 Hz. The object of the paper is to show the influence of the series stiffness on the effective suspension damping both experimentally and numerically. A frequency domain analysis of two-degree of freedom Zener quarter car model is performed to find the complex relation between effective damping coefficient and the limiting value of damping ratio for a given series stiffness. The nonlinear relation between shock absorber damping and the natural frequencies is clearly illustrated. A novel four-post rig set-up is used to validate the results by measuring transmissibilities, giving damping ratios for varying shock absorber settings. A closed form solution, based on a simplified partial model, of optimal damping coefficient, which is a nonlinear function of stiffnesses, shows good agreement with numerical simulations of the complete system. The nonlinearities in shock absorbers also influence the outcome. These findings can be a great value at early design stage.
Keywords
Introduction
Vehicle suspension dynamic performance of handling and ride comfort is widely recognised to have contradicting requirements. 1 In the industry numerical models are often used to optimise the performance; in most cases a simple quarter car model is used. For ride comfort studies Kelvin–Voigt arrangement is used for connecting spring and shock absorber. In vehicle transient response studies, for example impact harshness analysis,2–5 a further compliance connected in series with the shock absorber is incorporated to include the effect of additional flexibility of components such as top mount The series stiffness results in ‘relaxation-type’ suspension system which is basically either a Zener model or a Maxwell model with two degrees of freedoms (DOFs). In relaxation-type vibrating systems, based on 1-DOF system study, 6 the effective damping is controlled by the series stiffness. Similar variations may occur in 2-DOF Zener quarter car model. However, the relaxation-type multi-DOF models have not been considered when analysing ride comfort in the frequency domain. In particular, the results of effective and optimum damping in 2-DOF relaxation-type quarter car model are not available. Furthermore, there is a lack of experimentally validated results that show the effect of suspension damping on the natural frequencies. This study aims to provide a simple, closed form solution to illustrate the influence of series stiffness on the effective damping. An expression of optimal damping in a 2-DOF Zener model, representing a quarter car, is developed and validated using experimental results. A novel experimental set-up proposed in the study allows the generation of the results for varying damping, which is achieved by an adjustable shock absorber. The proposed optimal damping expression is meant to provide a basis which can be useful in the initial design stage.
Vehicle ride comfort is one of the important performance parameters determining the desirability and marketability of an automobile. The ride comfort analysis and prediction is an active research area; there has been considerable work (for example, see the literature7–14) towards understanding ride comfort in terms of vibration perception, road inputs, dynamic behaviour of vehicle suspension components and also the human body dynamics. The aim has been to develop reliable virtual prototypes so as to reduce reliance of expensive physical prototype trials.
Currently, in the industry and academia, both numerical and experimental models of varying degree of sophistication are used to optimise vehicle handling and ride comfort performance. Various optimisation tools (for example, see the literature11–14) have been used to arrive at suspension component parameters that give good ride comfort and road holding. These use analyses instead of studies are based on models where the effect of top mount is ignored. There also have been studies where suspension component complexities were included to refine the models. In general, these studies have focused on the effect of a particular component on the vehicle dynamic performance. The shock absorbers have been modelled with varying complexity to represent hydromechanical behaviour, (for example Duym 15 and Simms and Crolla). 16 In passive simplified models used for vehicle ride comfort analysis, however, the shock absorber is treated as a viscous damper – the simplest being a linear model.17–19
The influence of series stiffness, i.e. top mount of a suspension system on the transient response2–5 affecting the impact harshness is an active research field. The focus has been on the design of top mount giving good ride comfort and better isolation at higher frequencies. In all these studies the shock absorber element was not varied to investigate the achievable, effective damping and also effect on the natural frequencies. The models of limited size have also been used to explore the series stiffness effect for varied inputs. The response due to a random input and variable damping was estimated for a 1-DOF relaxation-type damping model in Gallagher and Volterra 20 and Derby and Calcaterra 21 ; further, the influence of damping coefficient and achievable effective damping were analysed. Other vibration isolation applications have also encountered and analysed the effect of series stiffness. For a locomotive application, the influence of damper mounting stiffness on the response to a periodic input was analysed, for a given damping coefficient, in Batchelor and Stride Batchelor. 22
In the recent past, the frequency-dependent damping of top mounts that affects higher frequency behaviour has been analysed using fractional calculus.23,24 Again the focus of the study has been the top mount while not varying the suspension damping value. Furthermore, the calculations based on fractional calculus are numerically intensive and it is difficult to obtain simple relations to express practically important behaviour. In this study, for this reason, a simple top mount model is used which is frequency independent. For the frequency range of interest to this study, as shown in Kaldas et al., 5 the dynamic stiffness of the top mount does not vary significantly below ∼25 Hz, hence the errors ensuing may not be large.
The Zener model concerning quarter car differs significantly from 1-DOF Zener model developed previously.20,21 The series stiffness, as in the 1-DOF Zener model, is anticipated to influence effective damping, but there are two modes and hence two modal damping ratios; these ratios can differ significantly from those based on the Kelvin–Voigt model and the variations can be a complex function of the suspension damping coefficient and stiffness elements. The effect of series stiffness, in terms of effective damping and stiffness, may not be equal on the modes of vibration 25 ; the wheel hub mode is expected to be more sensitive compared with the vehicle body mode. Furthermore, the resonance frequencies are expected to be dependent on the damping coefficient influencing the peak values. For good vehicle dynamic behaviour, the objective is to have sufficient damping for both modes. In this context, it is desirable to find a combination of parameters resulting in large damping ratios and a small shift in resonance frequency, without having to perform numerous forced vibration analyses. The availability of an explicit formula for effective damping can minimise the optimisation effort and provide critical information during the initial design stage. In this study, state-space and frequency domain mathematical models of quarter car model are used to establish a simple relation for optimal damping coefficient that can be achieved for a given top mount design. The results are validated using a novel four-post rig set-up where displacement transmissibilities are measured, giving damping ratios for varying shock absorber settings.
The work of the current paper is based on a configuration where, for ease of experimentation, the vehicle body mass is fixed; it is called as the constrained model in this study. A detailed steady-state harmonic analysis is used as the basis and validated by experimental work. The results are then extended to unconstrained quarter car model. In what follows, a number of experiments are used to gain insight into the complex frequency domain behaviour due to the presence of series stiffness. For harmonic input, the equations of motion are rearranged to calculate effective stiffnesses, damping value and damping ratio. The effects of the combination of suspension damping coefficient and series stiffness are numerically analysed, showing the regions of reduced vibration response; an expression is developed for optimal suspension damping based on the maximum damping ratio for the wheel hub mode. The estimates based on the constrained quarter car model are then compared with exact results from the full quarter car model; the results agree well within 4%. The model clearly shows the influence of series stiffness on the modal damping ratios, the natural frequencies and eventually the steady-state behaviour.
Application of Zener model to represent constrained quarter car dynamics
The model considered is a constrained quarter car with vehicle body mass fixed rigidly. This arrangement allows comparison with the experimental work carried out and described later in the paper. Furthermore, the model allows in-depth development of an analytical model leading to an expression to estimate the optimal damping ratio. The results of constrained model will be later compared with numerically obtained values of unconstrained model to show the negligible impact of the simplification. Figure 1(a) shows schematic of Zener model representing the constrained corner of a vehicle. Note that the model shown is not a classical 1-DOF Zener system; Figure 1(b) shows the classical 1-DOF Zener quarter car model. As the damping present in the top mount is small compared with the suspension damping coefficient, it is neglected to simplify the analysis. The model only considers vertical motion, ignoring lateral and longitudinal motions. The effect of these additional DOFs on the steady-state response is also small. The kinematics of suspension linkage influences the stiffness and damping to some extent; in the lumped parameter modelling, this effect is captured by the use of equivalent stiffness and damping parameters in the model.
(a) Schematic of a quarter car model with vehicle body constrained; Zener model is used to represent the suspension dynamics, (b) a standard Zener model with base excitation and (c) test set-up mounted on the four-post rig at Oxford Brookes University.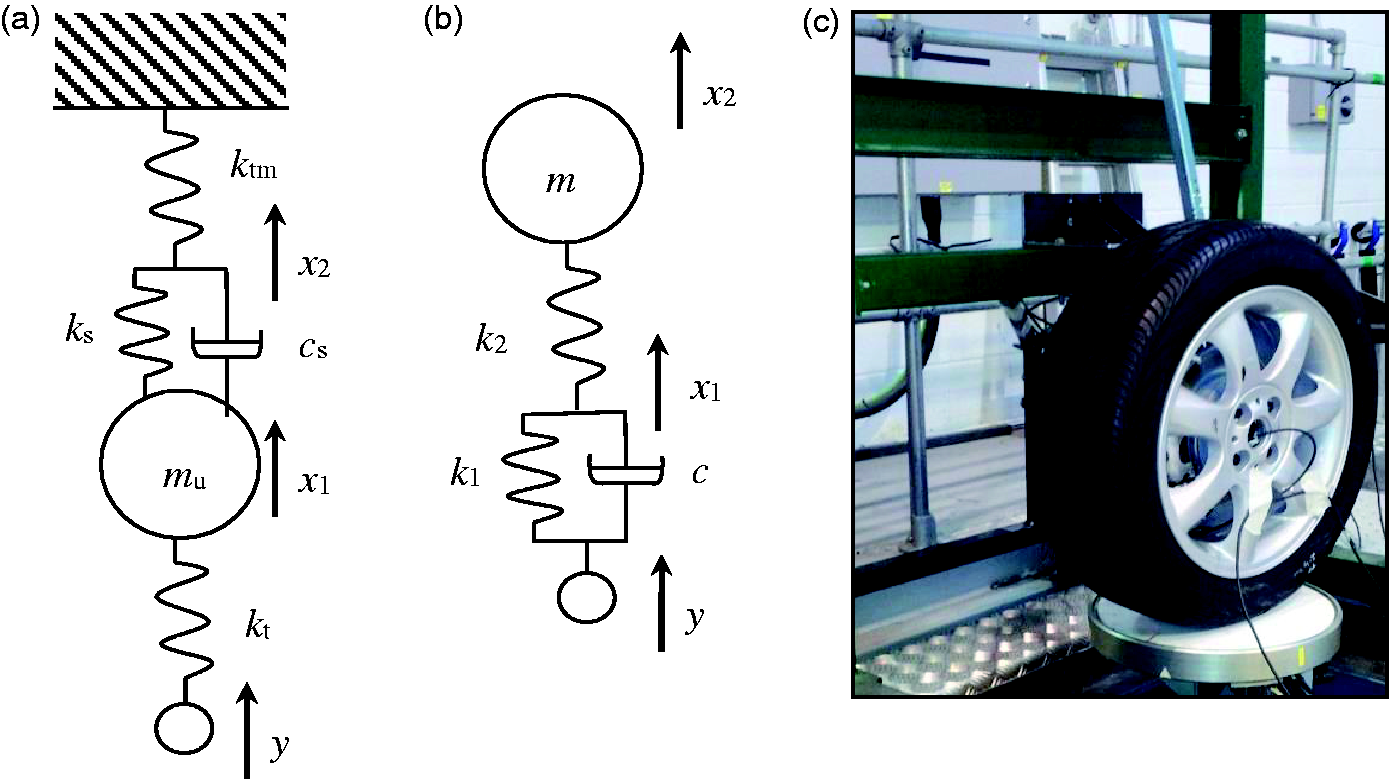
In the state-space form, the equations of motion for the constrained quarter car model are written as

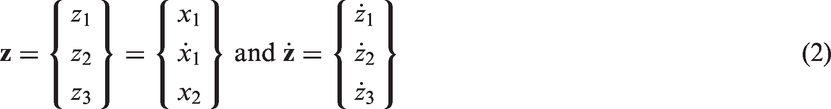
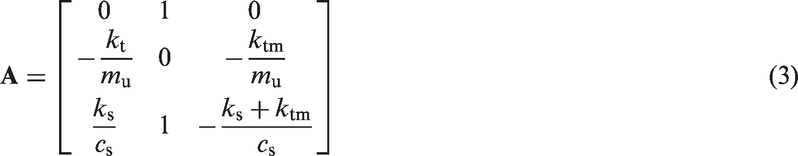
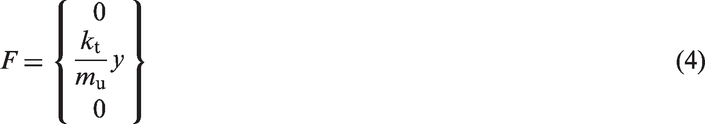
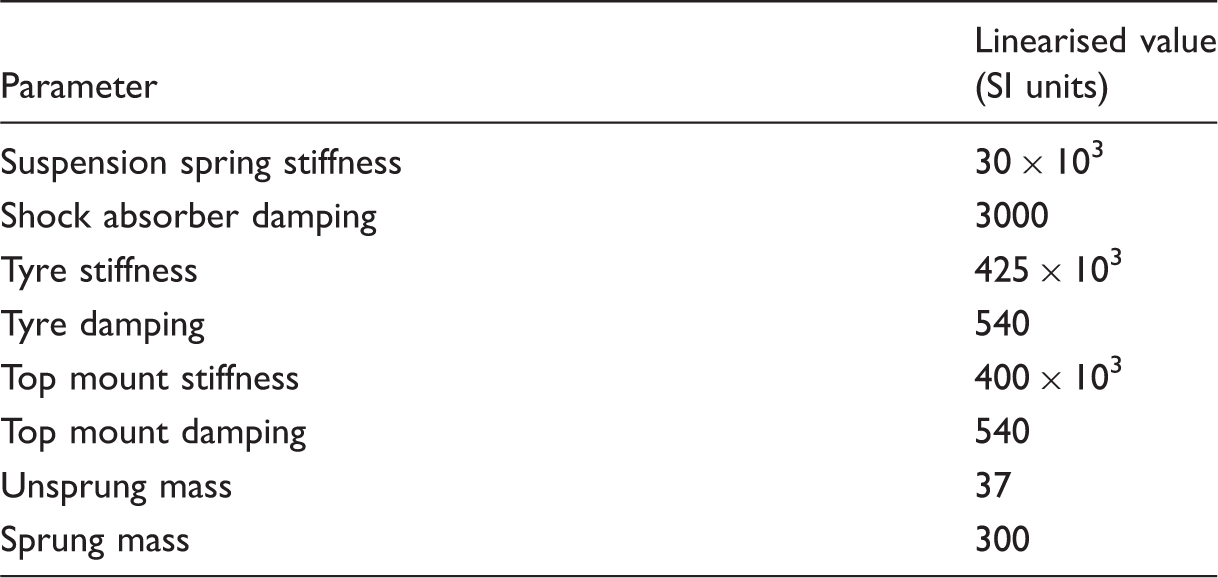
The elements of equation of motion are as follows: mu is the effective mass of wheel hub, cs is the suspension damping coefficient, ks is the suspension stiffness, kt is the tyre stiffness and ktm is the series stiffness. The response variables are as follows: x1 is the displacement of the wheel hub, x2 is the displacement of connection point (Figure 1(a)) between the suspension spring–damper combination and the series stiffness and y is the input due to the road profile.
The transient analysis can be carried out for a given input y to show the effect of series stiffness in limiting the peak amplitude of vibration. By letting the road input y equal to zero, free vibration analysis can be carried out. The objective here is to carry out steady-state response calculations and analyses so as to find key performance parameters such as effective damping. The damping and stiffness terms cannot be separated in equation (3). However, by performing frequency domain analysis the separation can be achieved helping identify effective damping.
Effective damping and stiffness
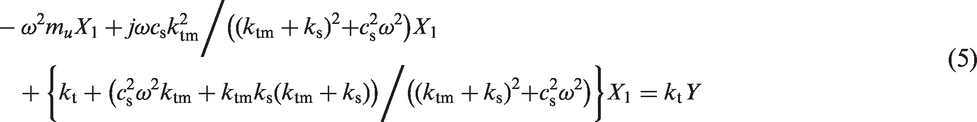
The effect of series stiffness can be explored for a given suspension damping coefficient and for comparison, transmissibility from wheel input to the hub mass motion can be calculated. For forced vibration analysis using the complex exponential form of response representation, we have
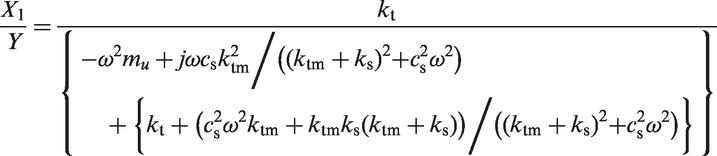


The stiffness is now dependent on the damping coefficient and excitation frequency. In vehicle suspension systems, for effective isolation at higher frequencies, the series spring stiffness is likely to be of the order of tyre stiffness 26 for a range of displacements; the effect on the wheel hub or hop frequency is expected to be significant. The relative values of stiffnesses and the damping coefficient determine the resonance frequency. If the series stiffness is relatively large, the system would act as an ordinary single DOF model and the spring and the damper being connected in parallel, irrespective of damping in the system.
The effective damping (equation (6)) is also now a function of series stiffness, suspension damping coefficient and the excitation frequency. For large series stiffness values, it tends to the suspension damping coefficient. On the other hand, for small values, the damping is a complex function of series stiffness and the excitation frequency; smaller values are important for impact harshness and higher frequency vibration transfer targets. In view of these complexities and involvement of multivariables, it is desirable to have an estimate of the optimal value of the suspension damping coefficient at an early design stage of vehicle suspension design process; we can use modal damping ratios to find the optimal damping coefficient.
Natural frequencies and modal damping ratios
In this section the optimal damping ratio and associated resonance frequency are found analytically, without having to perform numerous complex forced vibration analyses. In the process the stiffnesses are held constant allowing assessment of the effect of variation of damping, due to the shock absorber, on the dynamics of the system.
Optimal damping coefficient
The analysis to find the optimal damping coefficient is performed in the frequency domain as human perception of vibration is frequency dependent; the discomfort weighting curves, used in the ride comfort studies, are only available in the frequency domain. The frequency response of a quarter car model is dominated by two modes: wheel hub or hop mode and vehicle body mode. The peak amplitudes in the frequency response are controlled by the damping ratios, the larger a damping ratio smaller is the peak. The top mount primarily influences the hub mode as discussed in ‘Introduction’ section. The aim of the optimisation, therefore, is to find a shock absorber damping coefficient that results in the largest hub modal damping ratio. Note that the harmonic response has been used to find the effective damping and stiffness (equations (6) and (7)), which will continue to be the basis in this section. Although, the vehicles experience random, broadband frequency input from the road, the dominant contribution is from the two resonant modes. Hence the results of optimum damping coefficient obtained using harmonic analysis will be valid under these operational loads.
Using equations (5) to (7), the expression of effective damping ratio can be written as

The maximum effective damping coefficient leading to an optimal modal damping ratio can be obtained by finding the maxima of effective damping ratio with respect to the damping coefficient. The optimal value so obtained is given by


As response around the resonance is of interest, the frequency in equation (9) can be chosen accordingly. This frequency is related to stiffness, mass and the damping coefficient. As a first step, effective stiffness can be calculated by substituting the above optimal damping coefficient in equation (7). Therefore, we have
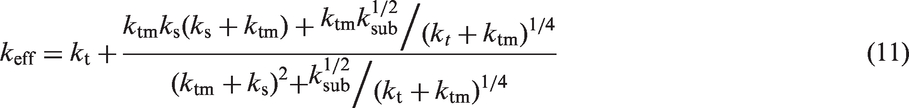
Note that the stiffness equation is now free of the frequency term. Now in turn, using the effective series stiffness, the natural frequency can be found as

If the natural frequency in equation (9) is used instead of resonance frequency an estimate of optimal damping can be obtained. This approximation introduces a negligible error as vehicle suspension systems typically operate with damping ratios around 0.3. For this range of damping ratios, the difference between the natural and damped natural frequencies is much smaller compared with the natural frequency. In any case, the results based on the expression being developed will be compared against the numerical results of the model in ‘Optimal suspension damping coefficient’ section to show validity of this assumption. The estimate of the optimal damping coefficient is, therefore, given by

The optimum damping coefficient of equation (13) is based on the simplified model where vehicle body mass is constrained. It was argued that the absence of vehicle body mass would not introduce significant errors in the wheel hub modal damping value. The results based on equation (13) now can be validated by comparing with numerically simulated results for the unconstrained quarter car model, where the influence of vehicle body mass is included. The state-space formulation of the quarter car model is used to obtain the damping ratios numerically by solving eigenvalue problem. The eigenvalues, for the wheel hub mode, will be of the form, for example

Test set-up for measurement of vibration transmissibility
The Multimatic four-post rig was used in conjunction with a bespoke test rig, to which the rear corner of a car was mounted (Figure 1(c)). The test rig was designed with two mounting plates to simulate the vehicle’s body in white; one was used for the shock absorber mounting location and the other to mount the trailing arm. In addition, steel bars were used to mount the suspension multi-links inboard of the wheel. Care was taken to ensure that the rig was as stiff as possible in order not to allow deflections to affect the measurements. The shock absorber used was adjustable so that the effect of change in damping coefficient could be explored.
Vibration responses were measured using SD Silicon Design 2210 accelerometers with a sensitivity differential of 400 mV/g and a range of ± 10 g. The force inputs were measured using three load cells mounted on the pan on which the tyre is located. In the experiment, an accelerometer was mounted on each of the wheel pan, wheel hub, base of the top mount and on the frame itself. The frame vibration was measured so that corrections could be applied to the outcomes of the experiments.
To identify the component parameters to assist with numerical simulations, a series of measurements were carried out with a swept sine wave as an input. The explored frequency range varied between 1 and 26 Hz. To assess nonlinearity, three constant velocity amplitudes in the range of 0.02–0.1 m/s were used in increments of 0.04 m/s.
Frequency response functions for varying set-ups were obtained using constant velocity swept sine input waves over a frequency range up to 50 Hz. The sweep time 60 s, which was observed to provide suitable resolution, was used. In the experiment a fade period of 1 s was introduced at the start and end of each test run to avoid large transient effects. As only steady-state measurements are of interest, data points within this time period were ignored. To remove measurement noise, filtering was applied with use of a pass band Butterworth filter. The sampling rate of 2000 Hz was used throughout.
Results and discussion
Theoretical frequency response function
Parameters of the model.
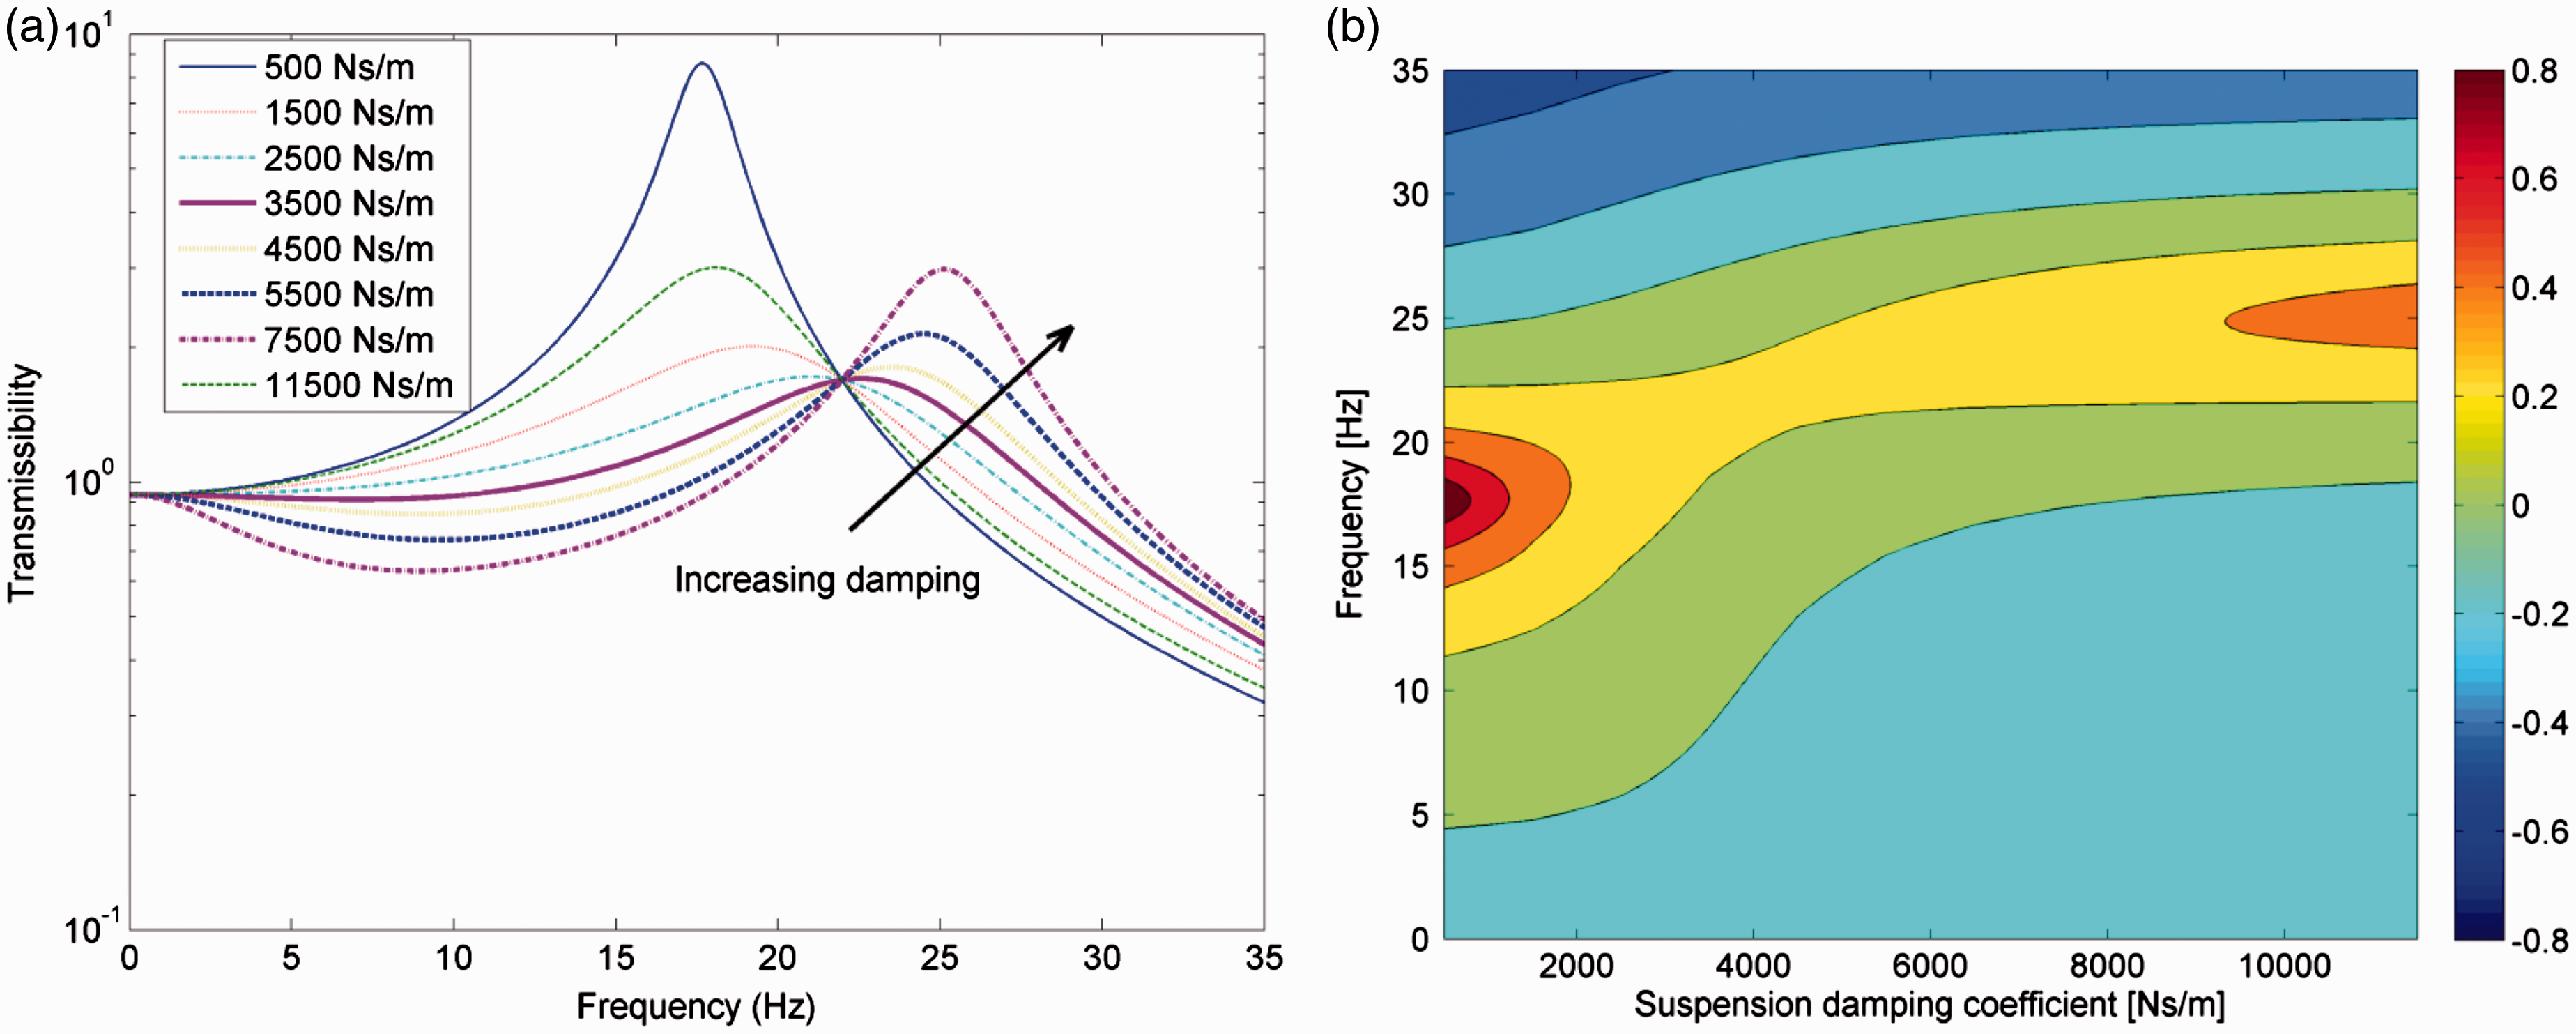
Variation of transmissibility (the tyre input and wheel hub response) as a function of frequency and suspension damping coefficient: (a) shown for a few damping ratios and (b) complete variation against damping ratio.
Experimental validation
The mono-tube shock absorber used in the tests is an adjustable type with 22 different damping coefficient settings. The ‘0’ setting results in the smallest damping coefficient with setting ‘22’ resulting in the largest possible damping coefficient. Experiments were performed for five settings. For baseline measurements, the input to the wheel had a constant velocity amplitude of 0.1 m/s. Figure 3(a) shows the transmissibility variation as a function of frequency and the damping coefficient. The variations are similar to the numerical simulation results of Figure 2(a); as the damping coefficient increases, the transmissibility peak shifts to the right, i.e. the resonance frequency increases. The cross-over point is well defined and occurs at ∼20 Hz. A small peak is seen at about 14 Hz due to a resonance related to lateral motion which cannot be avoided in the test set-up due to the suspension linkage configuration and stability concerns. The presence of this small peak should not, however, affect general variations observed. Overall, the experiments confirm the validity of the theoretical model.
Experimental transmissibility measured at various damper settings (given in figure legend) using constant velocity inputs: (a) 0.1 m/s and (b) 0.06 m/s.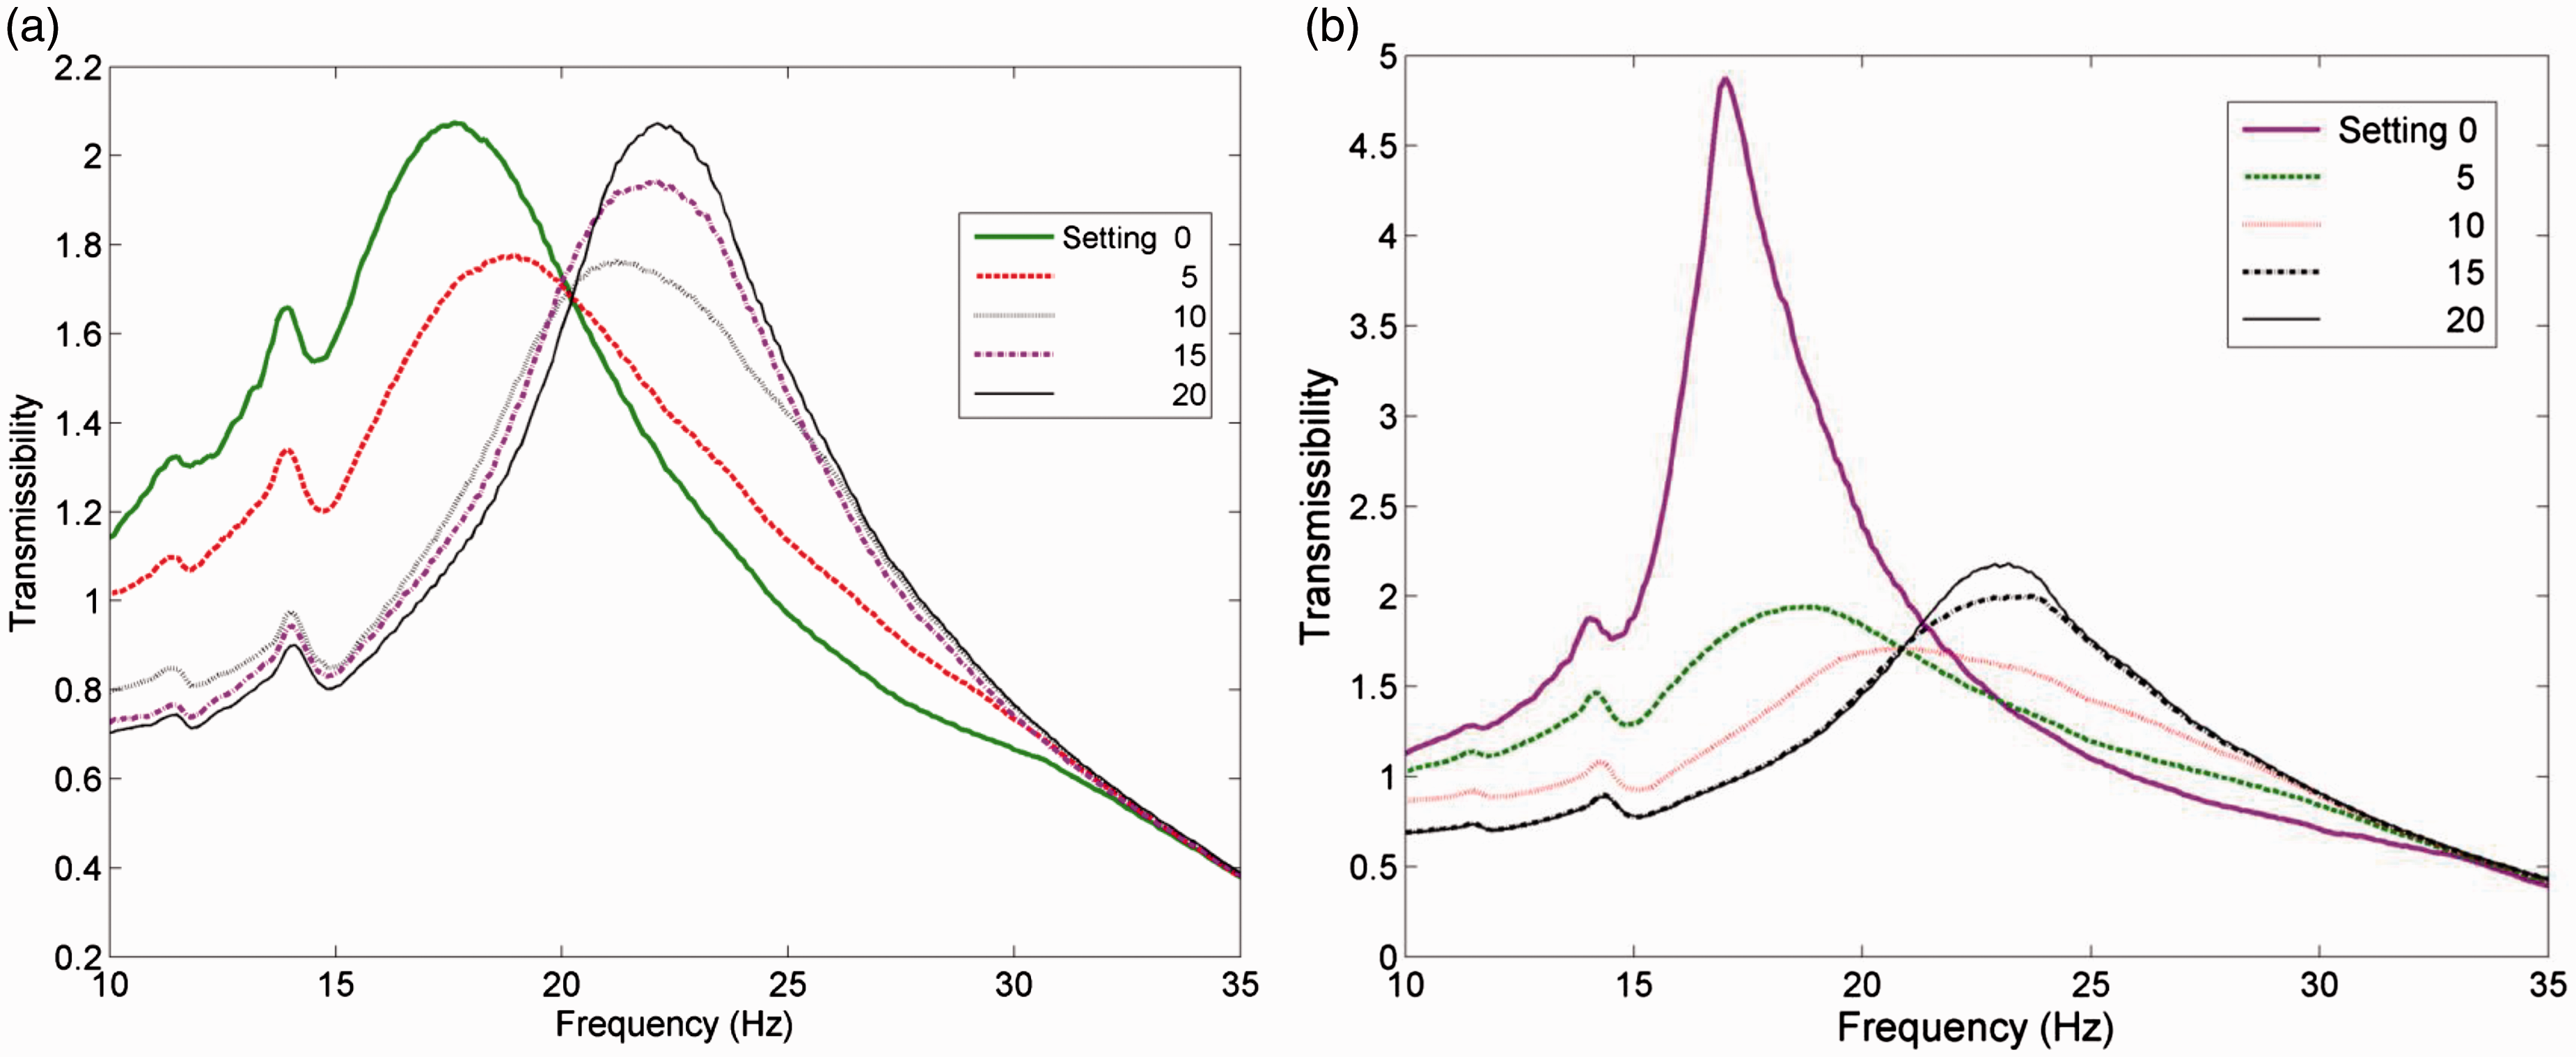
The damping curve of the shock absorber is inherently nonlinear and other components of the suspension can also contribute to the nonlinearity to a varying degree. Generally, the damping curve can be approximated by a bilinear function. Therefore, depending on the input amplitude, the transmissibility curves can vary. Figure 3(b) shows transmissibility curves for the constant velocity input of 0.06 m/s. It appears that more of the initial region in the nonlinear damper characteristic curve dominated by smaller coefficients is used, and hence the peak values are slightly different and so are the resonant frequencies. There is a reasonably well-defined cross-over which happens to be slightly higher frequency than the one for the larger input found in Figure 3(a). However small the nonlinearities, there is a noticeable effect on the dynamic performance, in particular on the natural frequencies, because of the series stiffness arrangement; the arrangement appears to amplify the influence of nonlinearities in damping. The reason for large variation is due to sensitivity of natural frequencies to change in damping near the cross-over point (Figure 2(b)). A closer look at the Figure 3(a) and (b) shows that the transmissibility values at cross-over point are similar. The effect of nonlinearities on the damping ratio around the cross-over frequency, therefore, may not be that significant.
Natural frequency and damping ratio
Figure 4(a) shows variation in natural frequency for varying series stiffness values. The natural frequencies, apart from being dependent on the damping coefficient, also are dependent on the tyre and top mount stiffness with an increased top mount stiffness resulting in larger natural frequencies. The change in natural frequencies is very sharp for middle range of damping values whereas for very large and very small damping values the change in natural frequencies is gradual. As mass is not changing, the extreme values are dependent on effective stiffness (equation (7)) and are given by Natural frequency variation as a function of suspension damping coefficient: (a) based on numerical simulation at given stiffness ratio (ktm/kt values are given in figure legend) and (b) experimental values (legend provides more detail).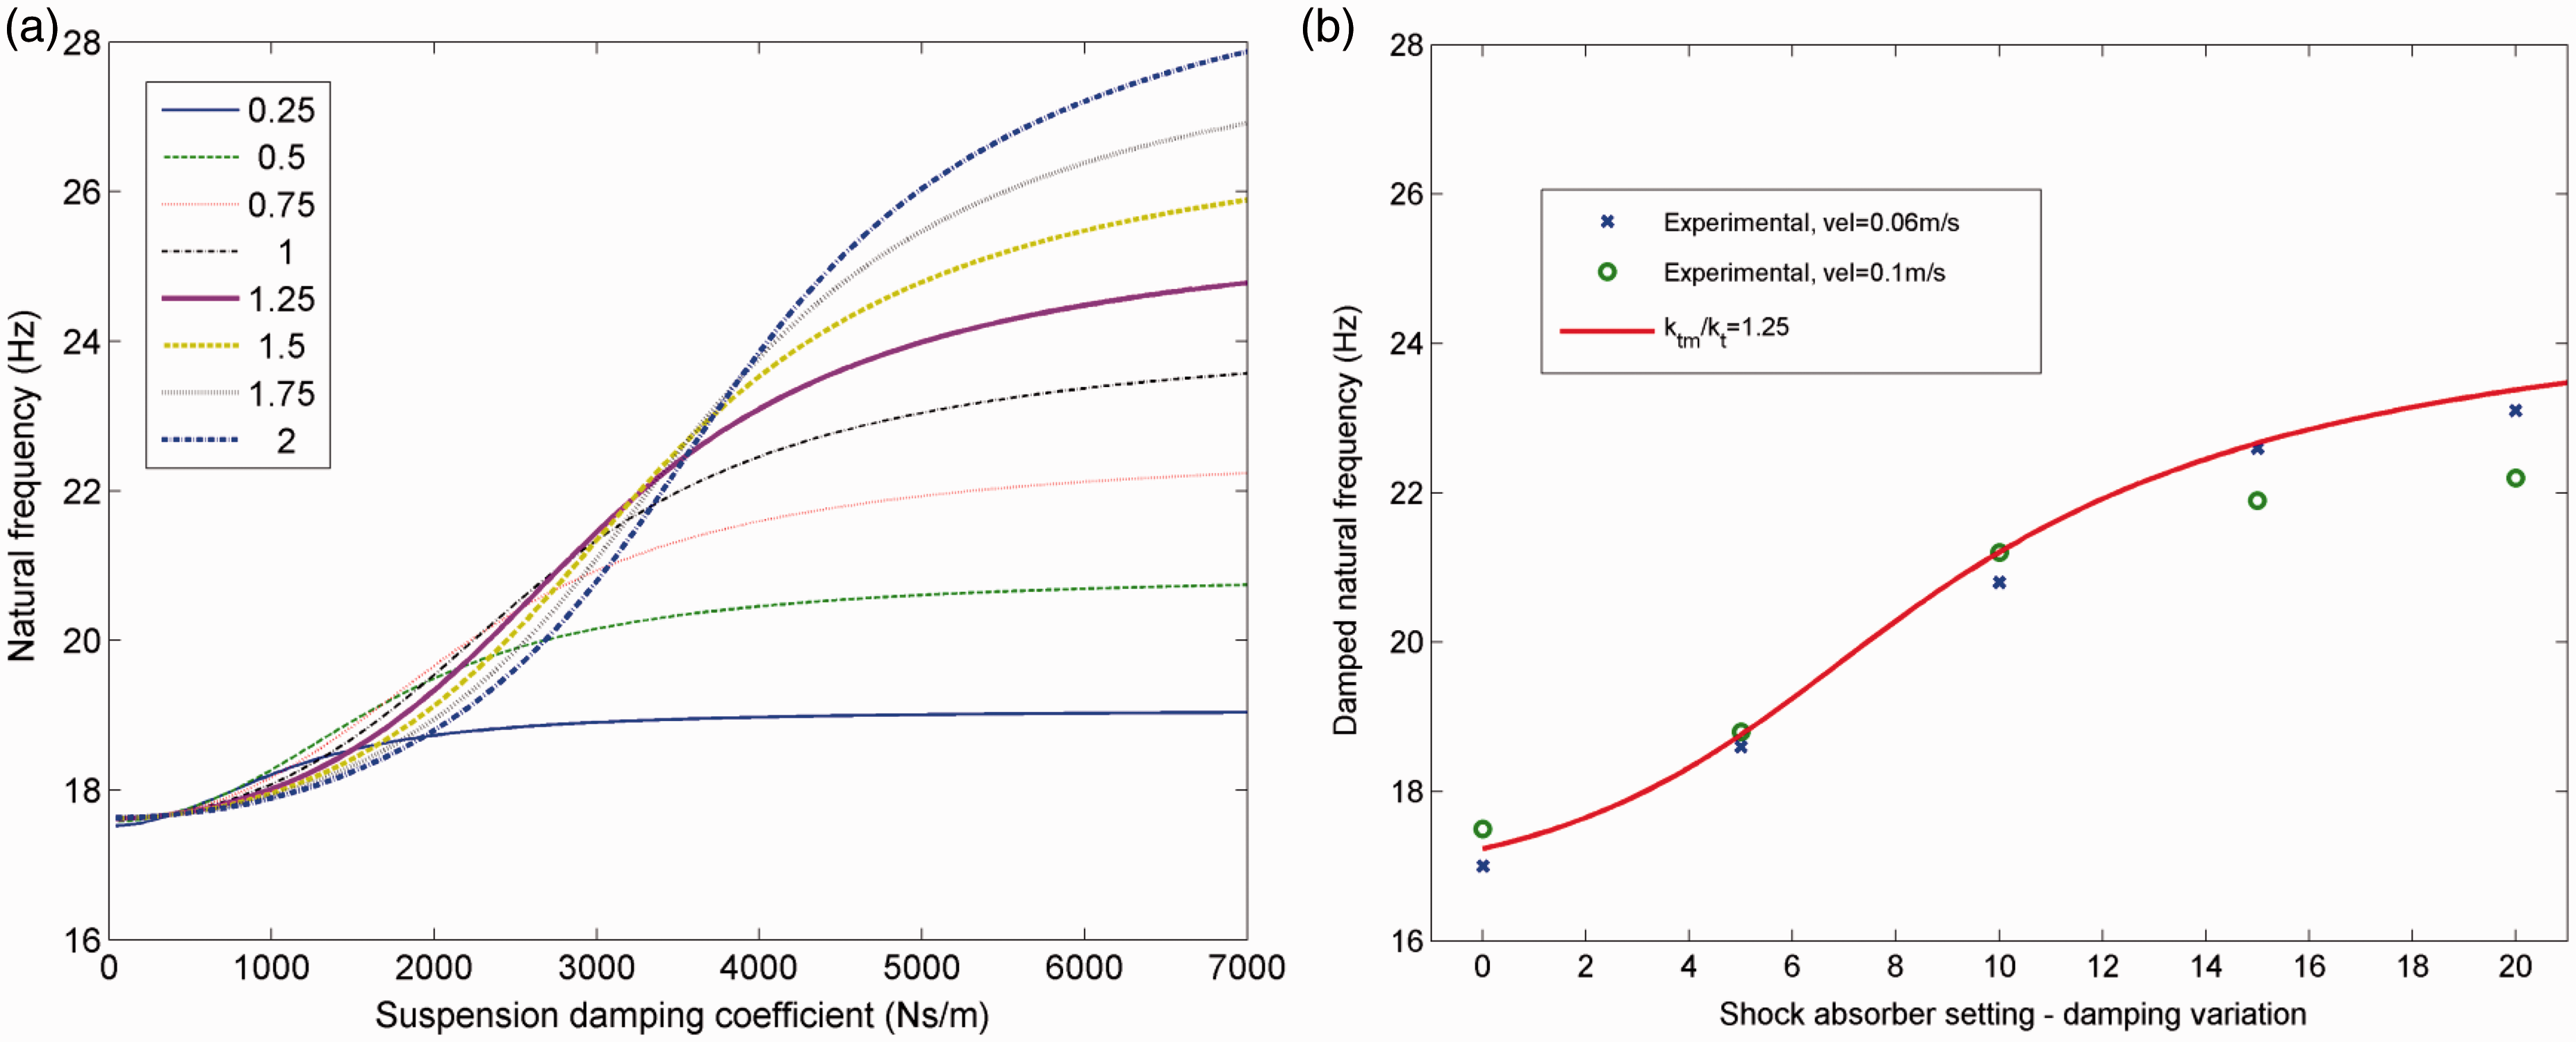
The transmissibility peak values are dependent on the damping ratio. The ratio, in turn, is dependent on stiffness values and the damping coefficient. Figure 5(a) shows damping ratio variation as a function of stiffnesses and the damping coefficient. For given stiffness values, the damping ratio increases as the suspension damping coefficient increases until a maximum value and then the damping ratio decreases for any further increase in the damping coefficient. The maximum damping ratio achievable is dependent on the top mount stiffness for a given tyre stiffness. Figure 5(b) shows experimental damping ratios obtained using transmissibilities by applying half power bandwidth method. A curve, numerically calculated using equation (1) for stiffness ratio 1.25 is also shown for comparison. The correlation is good for the most part; the errors at lower damping values could be the result of nonlinearities associated with larger shock absorber stroke. There is well-defined broad peak in both experimentally and numerically obtained damping ratio. Note that the nonlinearities do not appear to influence the broad peak in the experimental results; as discussed in ‘Experimental validation’ section, the limiting damping ratio appears less sensitive to nonlinearities. The damping ratio curves of Figure 5(b) provide an insight into the dynamics, but the curves themselves have been generated using a series of calculations of eigenvalue solutions for every damping coefficient and stiffness.
Damping ratio variation as a function of damping coefficient: (a) based on numerical simulation at given stiffness ratio (ktm/kt values are given in figure legend) and (b) experimental values (legend provides more details).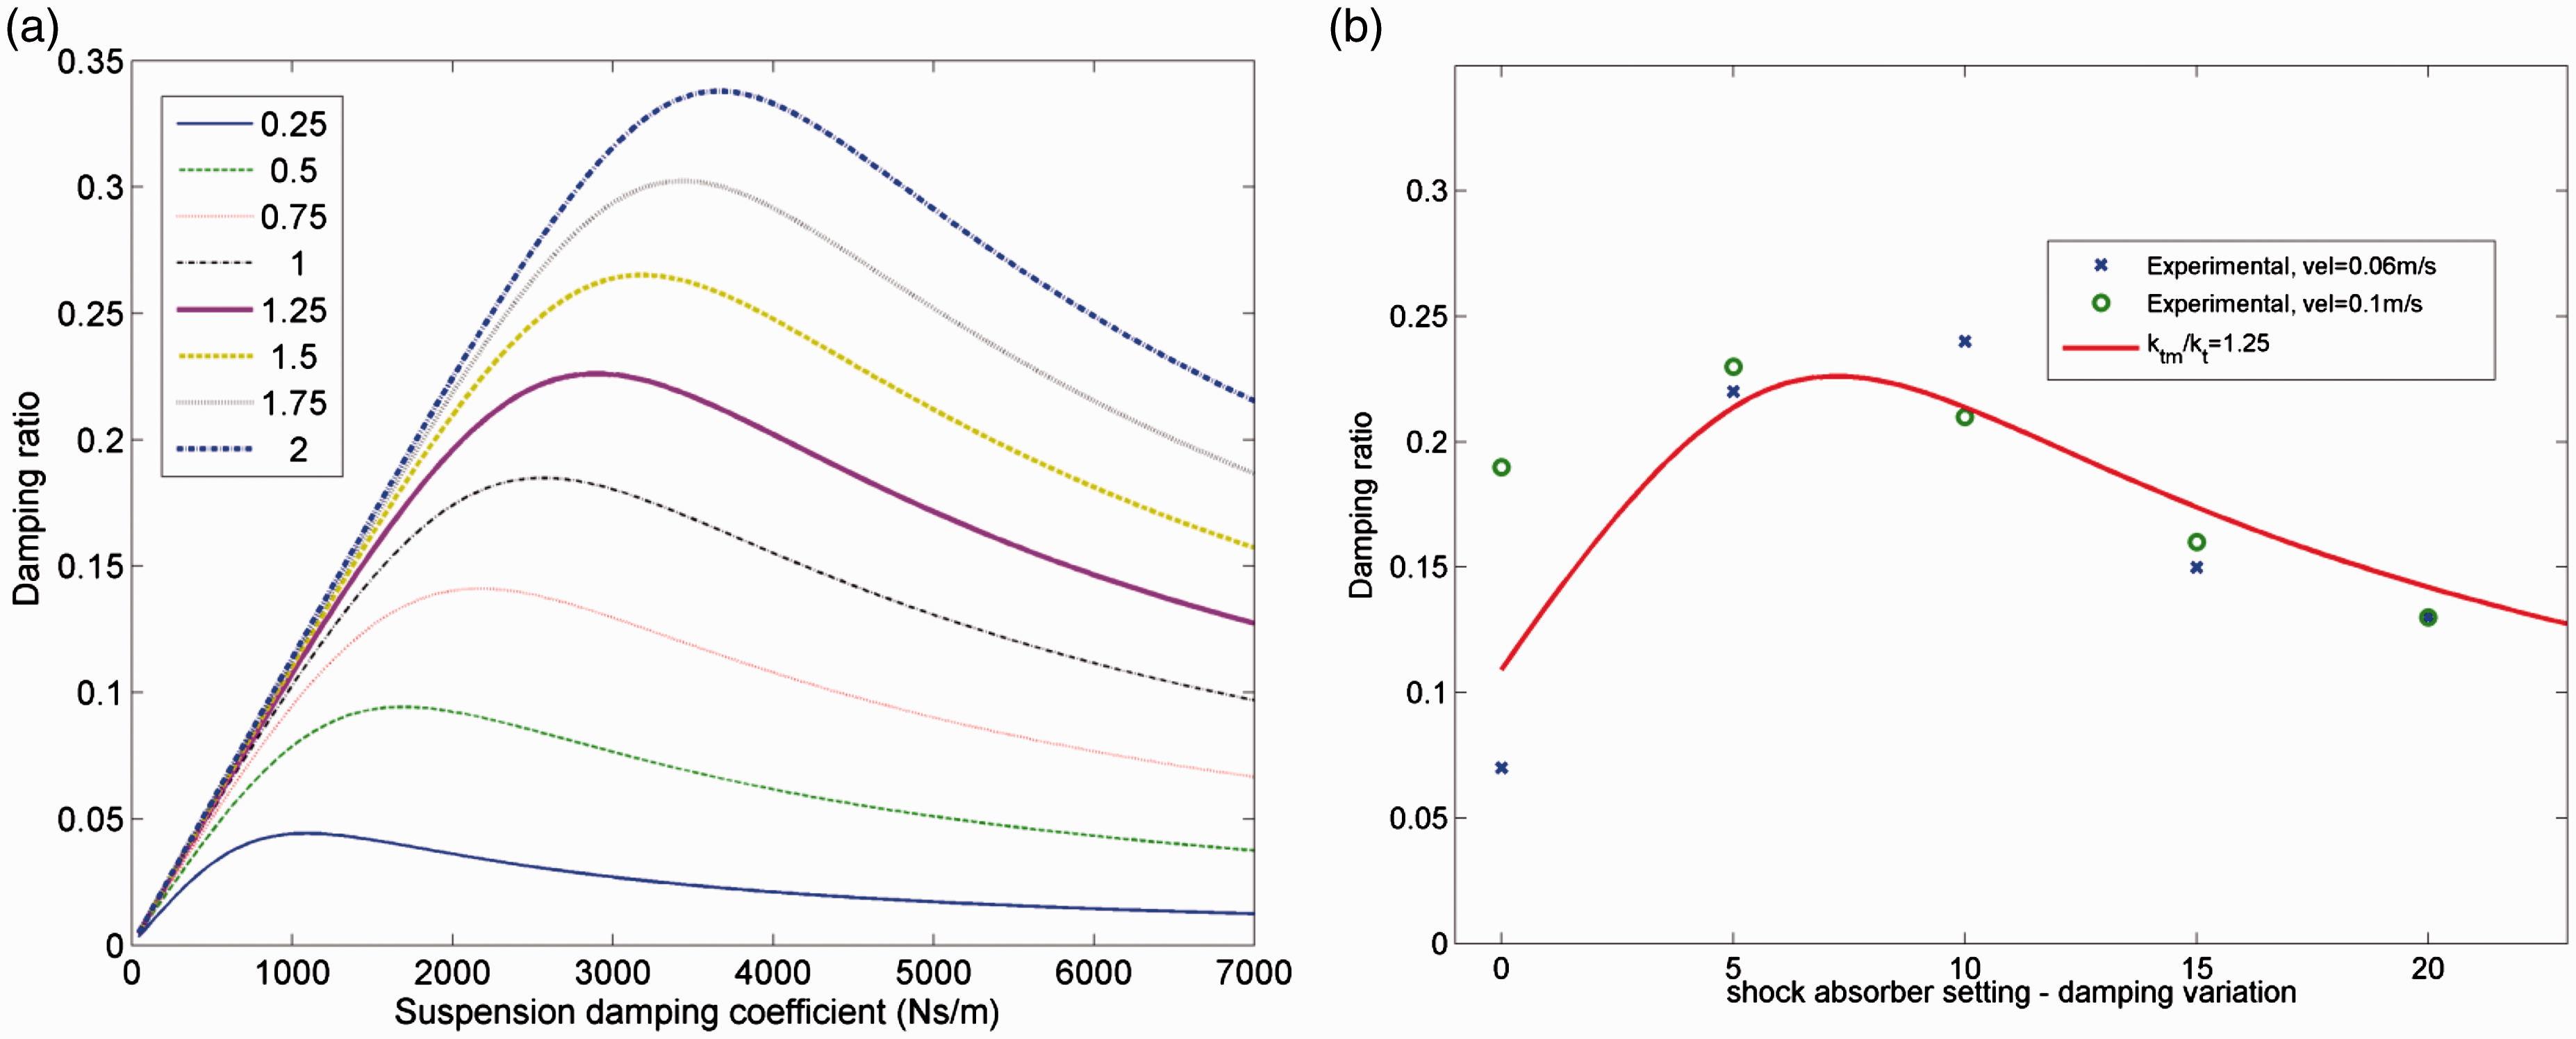
Based on the experimental verification, overall, the linear simplified vehicle body constrained model shows good correlation with corresponding experiments. The damping ratio and natural frequency variation obtained from numerical simulations, therefore, can be treated with confidence.
Optimal suspension damping coefficient
The damping coefficient that results in the maximum damping ratio for given stiffness values can be calculated using equation (13). Figure 6(a) shows the optimal damping coefficient varying as a function of the stiffness ratio; two curves are for different top mount stiffnesses. Also shown are the estimates based on maximum attainable values, for example as shown in Figure 5(a). The agreement between the two calculations is very good. The damping coefficient resulting in the maximum damping ratio increases as the stiffness ratio increases, i.e. as the top mount stiffness increases. The tyre stiffness also has significant influence on the achievable damping ratio.
Variation of optimal damping coefficient as a function of stiffness ratio. (a)  and
and  are numerical estimations, and - - - - - - - and ___________ are based on equation (13) and (b) constrained quarter car model: and , and unconstrained quarter car model using numerical calculations
  and
and  .
.
Comparison with results from quarter car model
The optimal damping calculations from earlier sections are entirely based upon a model that has the vehicle body constrained from moving. Any realistic model is required to include the effect of the vehicle body mass and therefore the validity of equation (13) needs investigation.
Figure 6(b) shows a comparison between the optimal damping coefficient calculated from the use of proposed equation and that of the estimate based upon the eigenvalue solution of the unconstrained quarter car model of ‘Application of Zener model to represent constrained quarter car dynamics’ section; two values are used for top mount stiffness. The proposed equation results are in good agreement with the exact numerical model. At higher stiffness ratios, there is a maximum deviation of 4%. For a typical stiffness ratio seen in the real systems, 26 however, the error is less than 1%. These deviations may be because of the use of undamped natural frequency in equation (9) rather than the damped natural frequency. These results, therefore, confirm that a simplified, partial model used in this study can give reliable results of optimum damping coefficient.
Conclusions
A constrained quarter car relaxation-type suspension was modelled and experimentally validated to show the effect of series stiffness on effective damping and stiffness. The experimental results are unique and provide additional information on the combined effect of top mount and variable shock absorber damping. An expression of damping ratio is developed which is a nonlinear function of the suspension damping coefficient and stiffnesses. As expected, in extreme cases, for larger suspension damping coefficients, the resulting damping ratio could be negligibly small.
The experimental results also clearly show the amplification effect of nonlinearities inherent in shock absorbers. There is a significant effect on the cross-over frequency, but the transmissibility amplitudes are similar around the cross-over frequency for varying input velocity amplitude. The damping ratio curve is also found to have a broader peak. Due to broader peak and similarity in the transmissibilities around the cross-over frequency, the effect of nonlinearities on the optimal damping coefficient may not be that significant.
An expression for the optimal suspension damping coefficient was developed using the effective damping ratio obtained from harmonic analysis. This eliminates the need for trial simulations for the constrained quarter car model. The proposed approximation is compared with the numerical results from the unconstrained model to show the validity. The estimations agree well to within 4%. Overall, the model clearly shows the influence of series stiffness on the modal damping ratios, the natural frequencies and hence the steady-state dynamic response. The expression of optimal damping coefficient can be invaluable to designers at an early stage of the vehicle design process making response calculations straightforward.
Footnotes
Declaration of conflicting interests
The author(s) declared no potential conflicts of interest with respect to the research, authorship, and/or publication of this article.
Funding
The author(s) received no financial support for the research, authorship, and/or publication of this article.