
Abstract
Range-extended electric vehicles have the most complex noise and vibration problems since certain control strategies often make range extenders (REs) shut down or restart for the sake of better fuel consumption. This paper deals with this uncomfortable riding experience, especially during the range extender start phase. A control-oriented nonlinear model for the start–stop vibration analysis, including range extender mount system, engine–clutch–motor shaft system, engine inertia torque and force, engine friction torque, engine gas torque, engine manifold pressure, electric motor torque, and range extender controller, is thus built. In the developed model, a new estimation method for gas torque is proposed, where the initial crank angle is considered and the relevant equations are simplified. The method has proven to predict gas torque accurately without using a complex calculation process. According to the developed model, the active control method, crankshaft stop position control (CSPC) has been proposed. The crankshaft stop position is analyzed as well as the crankshaft movement with different speeds at top dead center is discussed, which lead to the design of the target curves for crankshaft movement during the stop phase. Based on the set-up model, CSPC is finally applied through the cascade control of the motor to evaluate the control effectiveness. The simulation outcomes demonstrate that CSPC can help the crankshaft to finally stop at the optimal initial crank angle, which effectively lessens the vibration in the next start phase.
Keywords
Introduction
In order to achieve low emissions and improve fuel economy, electro-mobility is seen by many to be at the core of future mobility patterns.1,2 However, compared with conventional vehicles the driving range of electric vehicles (EVs) are still limited due to the low capacity and the long charging times of today’s batteries.3–5 The range-extended electric vehicle (ReEV) is a clever solution due to its combination of a combustion engine and an electric generator, since both the application range and user acceptance are much greater. 6 However, it is faced with the challenge of more complex noise, vibration and harshness (NVH) behaviors at the same time.7,8 Especially during the engine start–stop phase, the driver and passengers without preparation and precognition are more sensitive to the accompanying vibration. 9 Thus, the control designs for start–stop NVH refinement are essential to ReEV research and development (R&D).
In the literature, a number of engine start–stop vibration studies can be found. Guo et al. performed a subjective evaluation of the NVH problem in a ReEV and thus the corresponding counter measures from excitation source and transfer path aspects were proposed. 10 Tomura et al. utilized a controller to compensate the engine torque pulsation for a Toyota rear–wheel–drive hybrid vehicle to reduce the vibration of engine start–stop. The ideal crankshaft stop position could be reached by keeping the top dead center (TDC) speed as constant.11,12 Canova et al. made use of an electric motor (EM) to make engine start–stop transitions run more smoothly in a belted starter/alternator (BSA) mild hybrid system.13–15 Kuang introduced countermeasures for the vibration during engine start–stop, in which engine pre-positioning, smooth engine torque rise in initial combustion phase, proper motor torque compensation as well as improved mount design changes were mentioned. 16 Park proposed a method of controlling engine stop position in a series hybrid vehicle to suppress the engine start–stop vibration and the speed curve of the crankshaft during the entire stop process were predicted. 17 Hwang et al. designed a pulse cancellation algorithm with the combination of a damper bypass clutch to reduce the fluctuation of the reaction torque acting on the engine block and vibration of the seat track during automatic start–stop transitions.18,19
However, the literatures reviewed above do not give great insights for the crankshaft stop position. The crankshaft stop position actually decides the initial crank angle (ICA) for the next start phase, which determines the gas mass in high-pressure cylinders. Therefore the stop position of crankshaft plays a significant role for the vibration during the cranking phase. In a ReEV, the crankshaft is generally coupled with the motor rotor, thus its stop position can be controlled. Moreover, ReEVs can be regarded as series ones, in which the vibration from the shaft system cannot be directly transmitted to the car body but rather mainly through the mounts. Hence, the main objective of this study aims at providing crankshaft stop position control (CSPC) to better address the vibration issue during the start phase of the range extender (RE) mount system. To develop the method, a comprehensive model for the RE start–stop vibration analysis is firstly built, in which a new gas torque (GT) estimation method is proposed with the consideration of the ICA as well as the calculation simplification. The crankshaft stop position is next discussed. Furthermore, the crankshaft movement with different speed TDC is analyzed and the target curves for crankshaft movement are accordingly designed afterwards. Based on the developed RE start–stop vibration analysis model, CSPC is finally applied through the control of motor during the stop phase to prove vibration control effectiveness.
Model development
Due to the need for understanding the transient behavior of the RE during start–stop operations and providing support for control designs, a model is thus required to characterize the relevant system dynamics. As shown in Figure 1, the analysis model can fall into eight parts: RE mount system, engine–clutch–motor shaft system, engine inertia torque and force, engine GT, engine manifold pressure, EM torque, and RE controller.
Schematic of the developed model.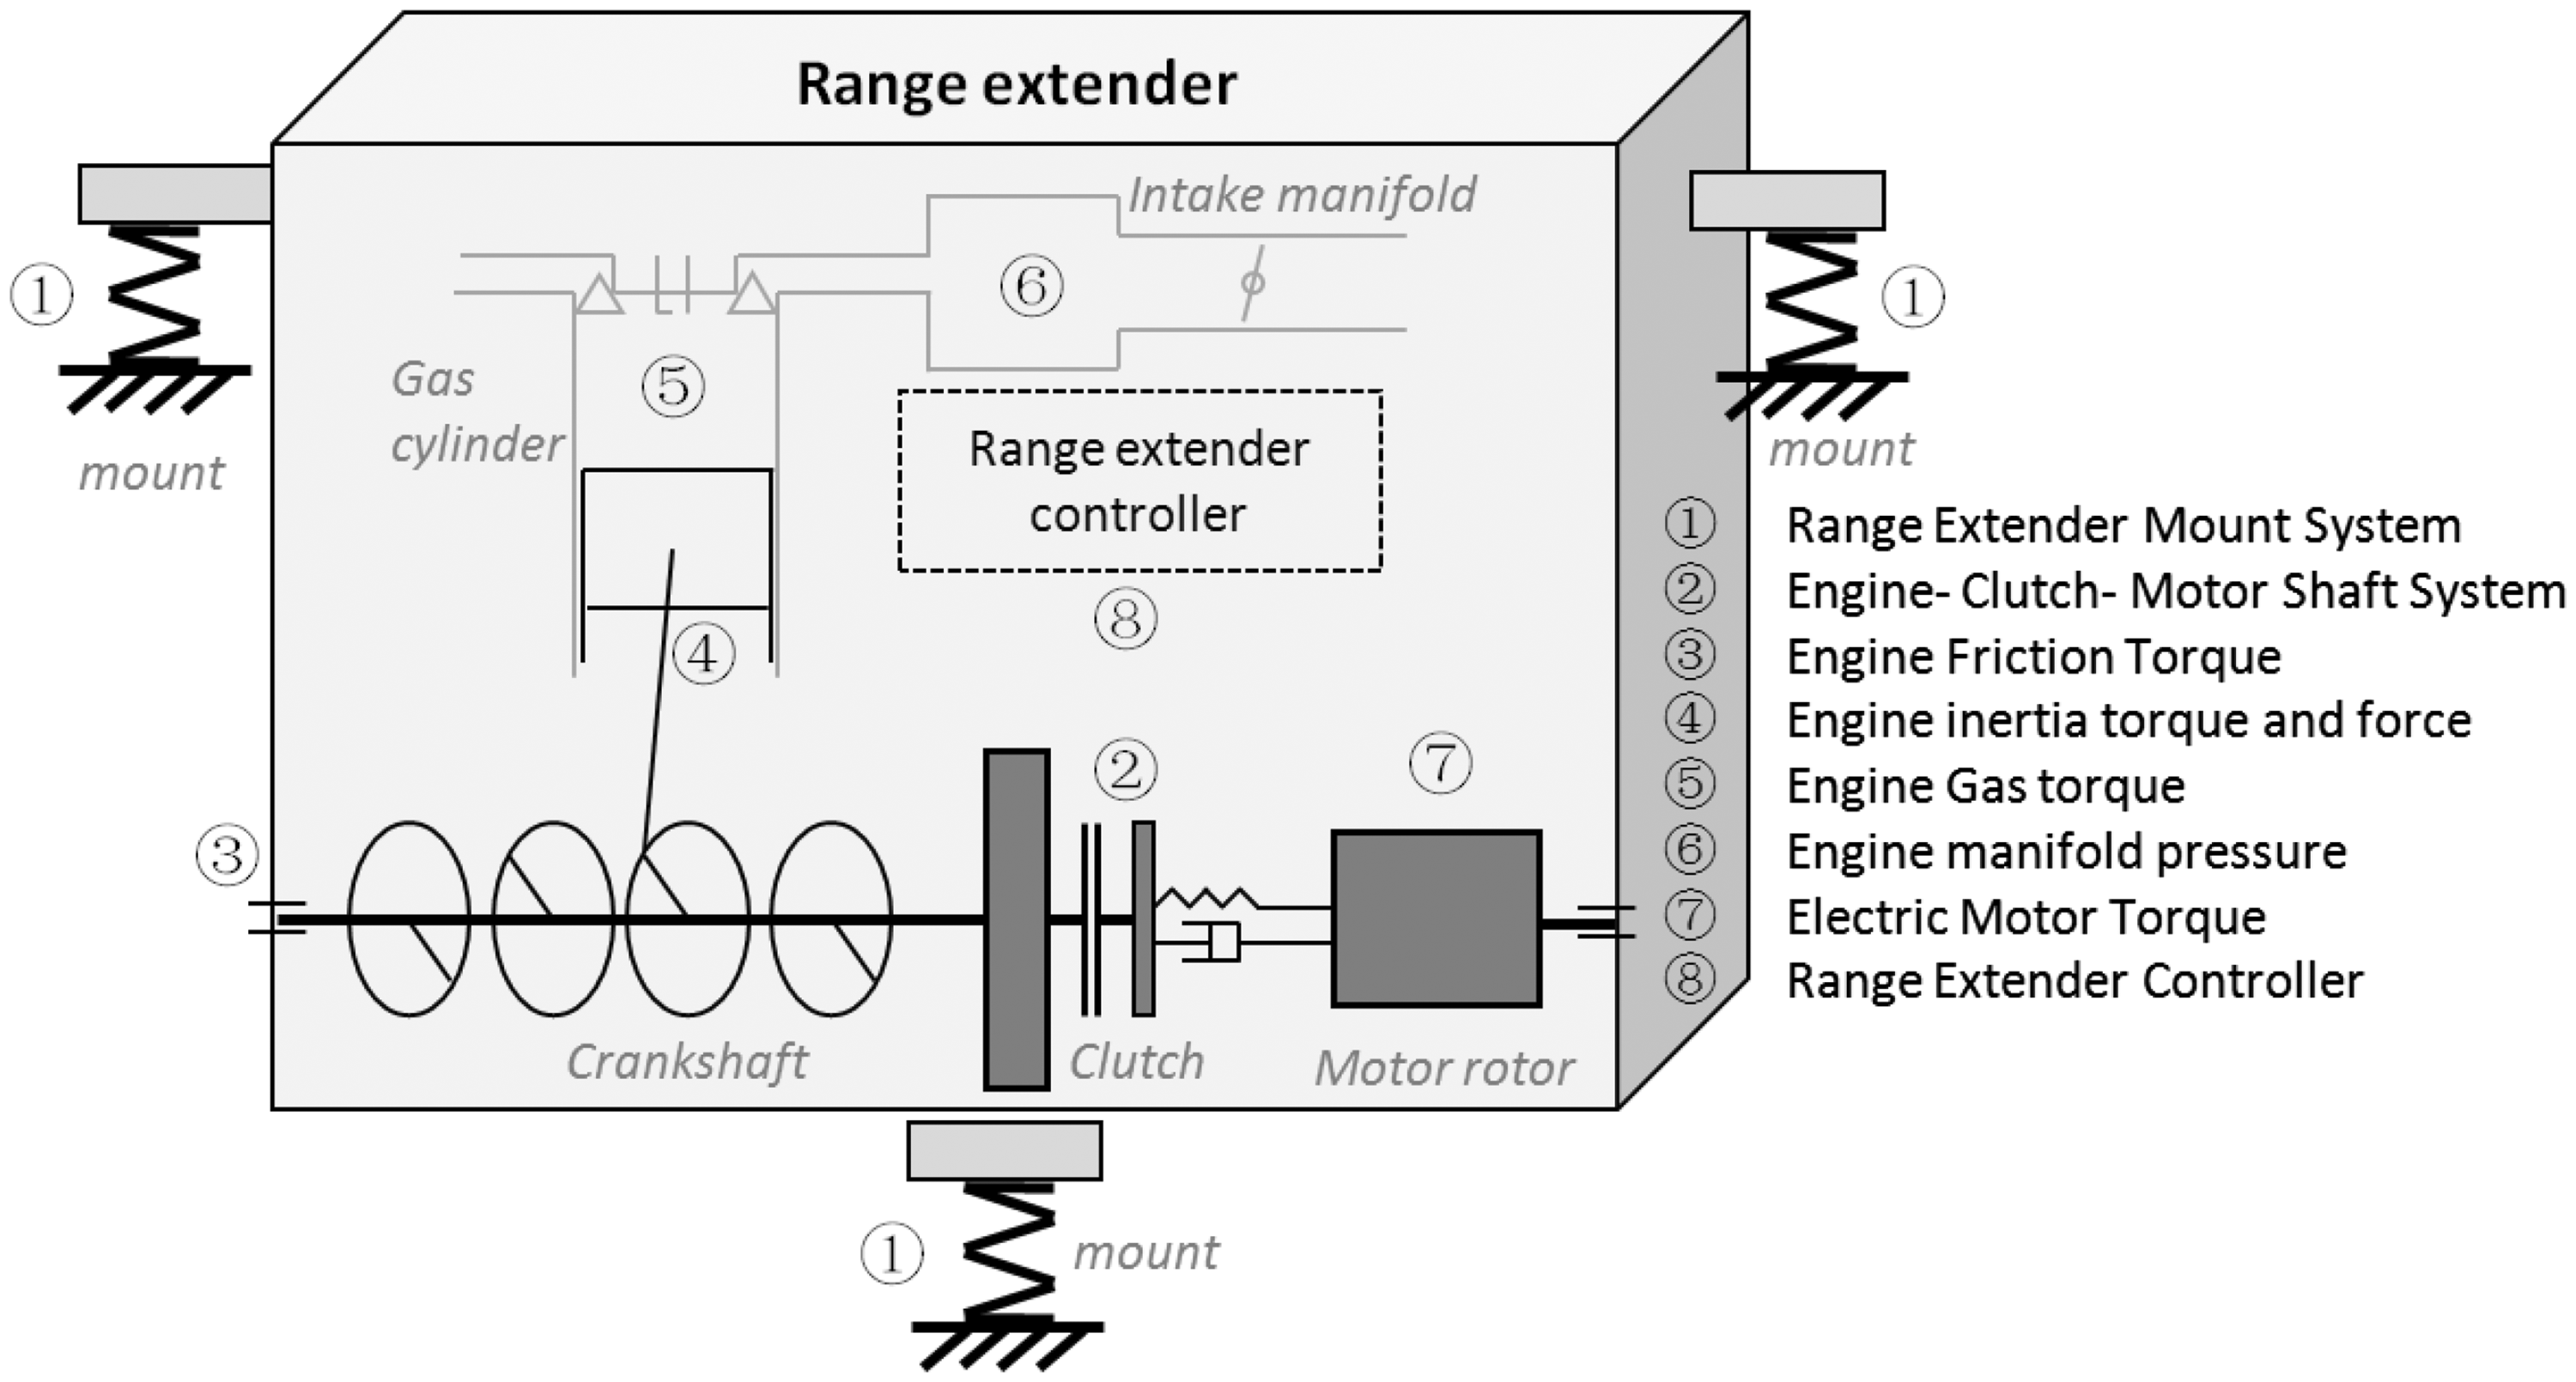
Figure 2 gives a clear view of the correlation among the eight parts. The excitation, including the engine friction torque, engine inertia torque and force, engine GT, and EM torque, acts on both the crankshaft and the RE block. Based on the engine–clutch–motor shaft system and the RE mount system, the dynamics behaviors of the RE block as well as the torsional vibration of the shaft system can be reflected with the excitation. According to the shaft system, the crank angle and the crankshaft speed profile can be obtained. They are the input for the excitation and adjust the manifold pressure for RE controller, which determines the GT with the crank angle.
Block diagram of the developed model.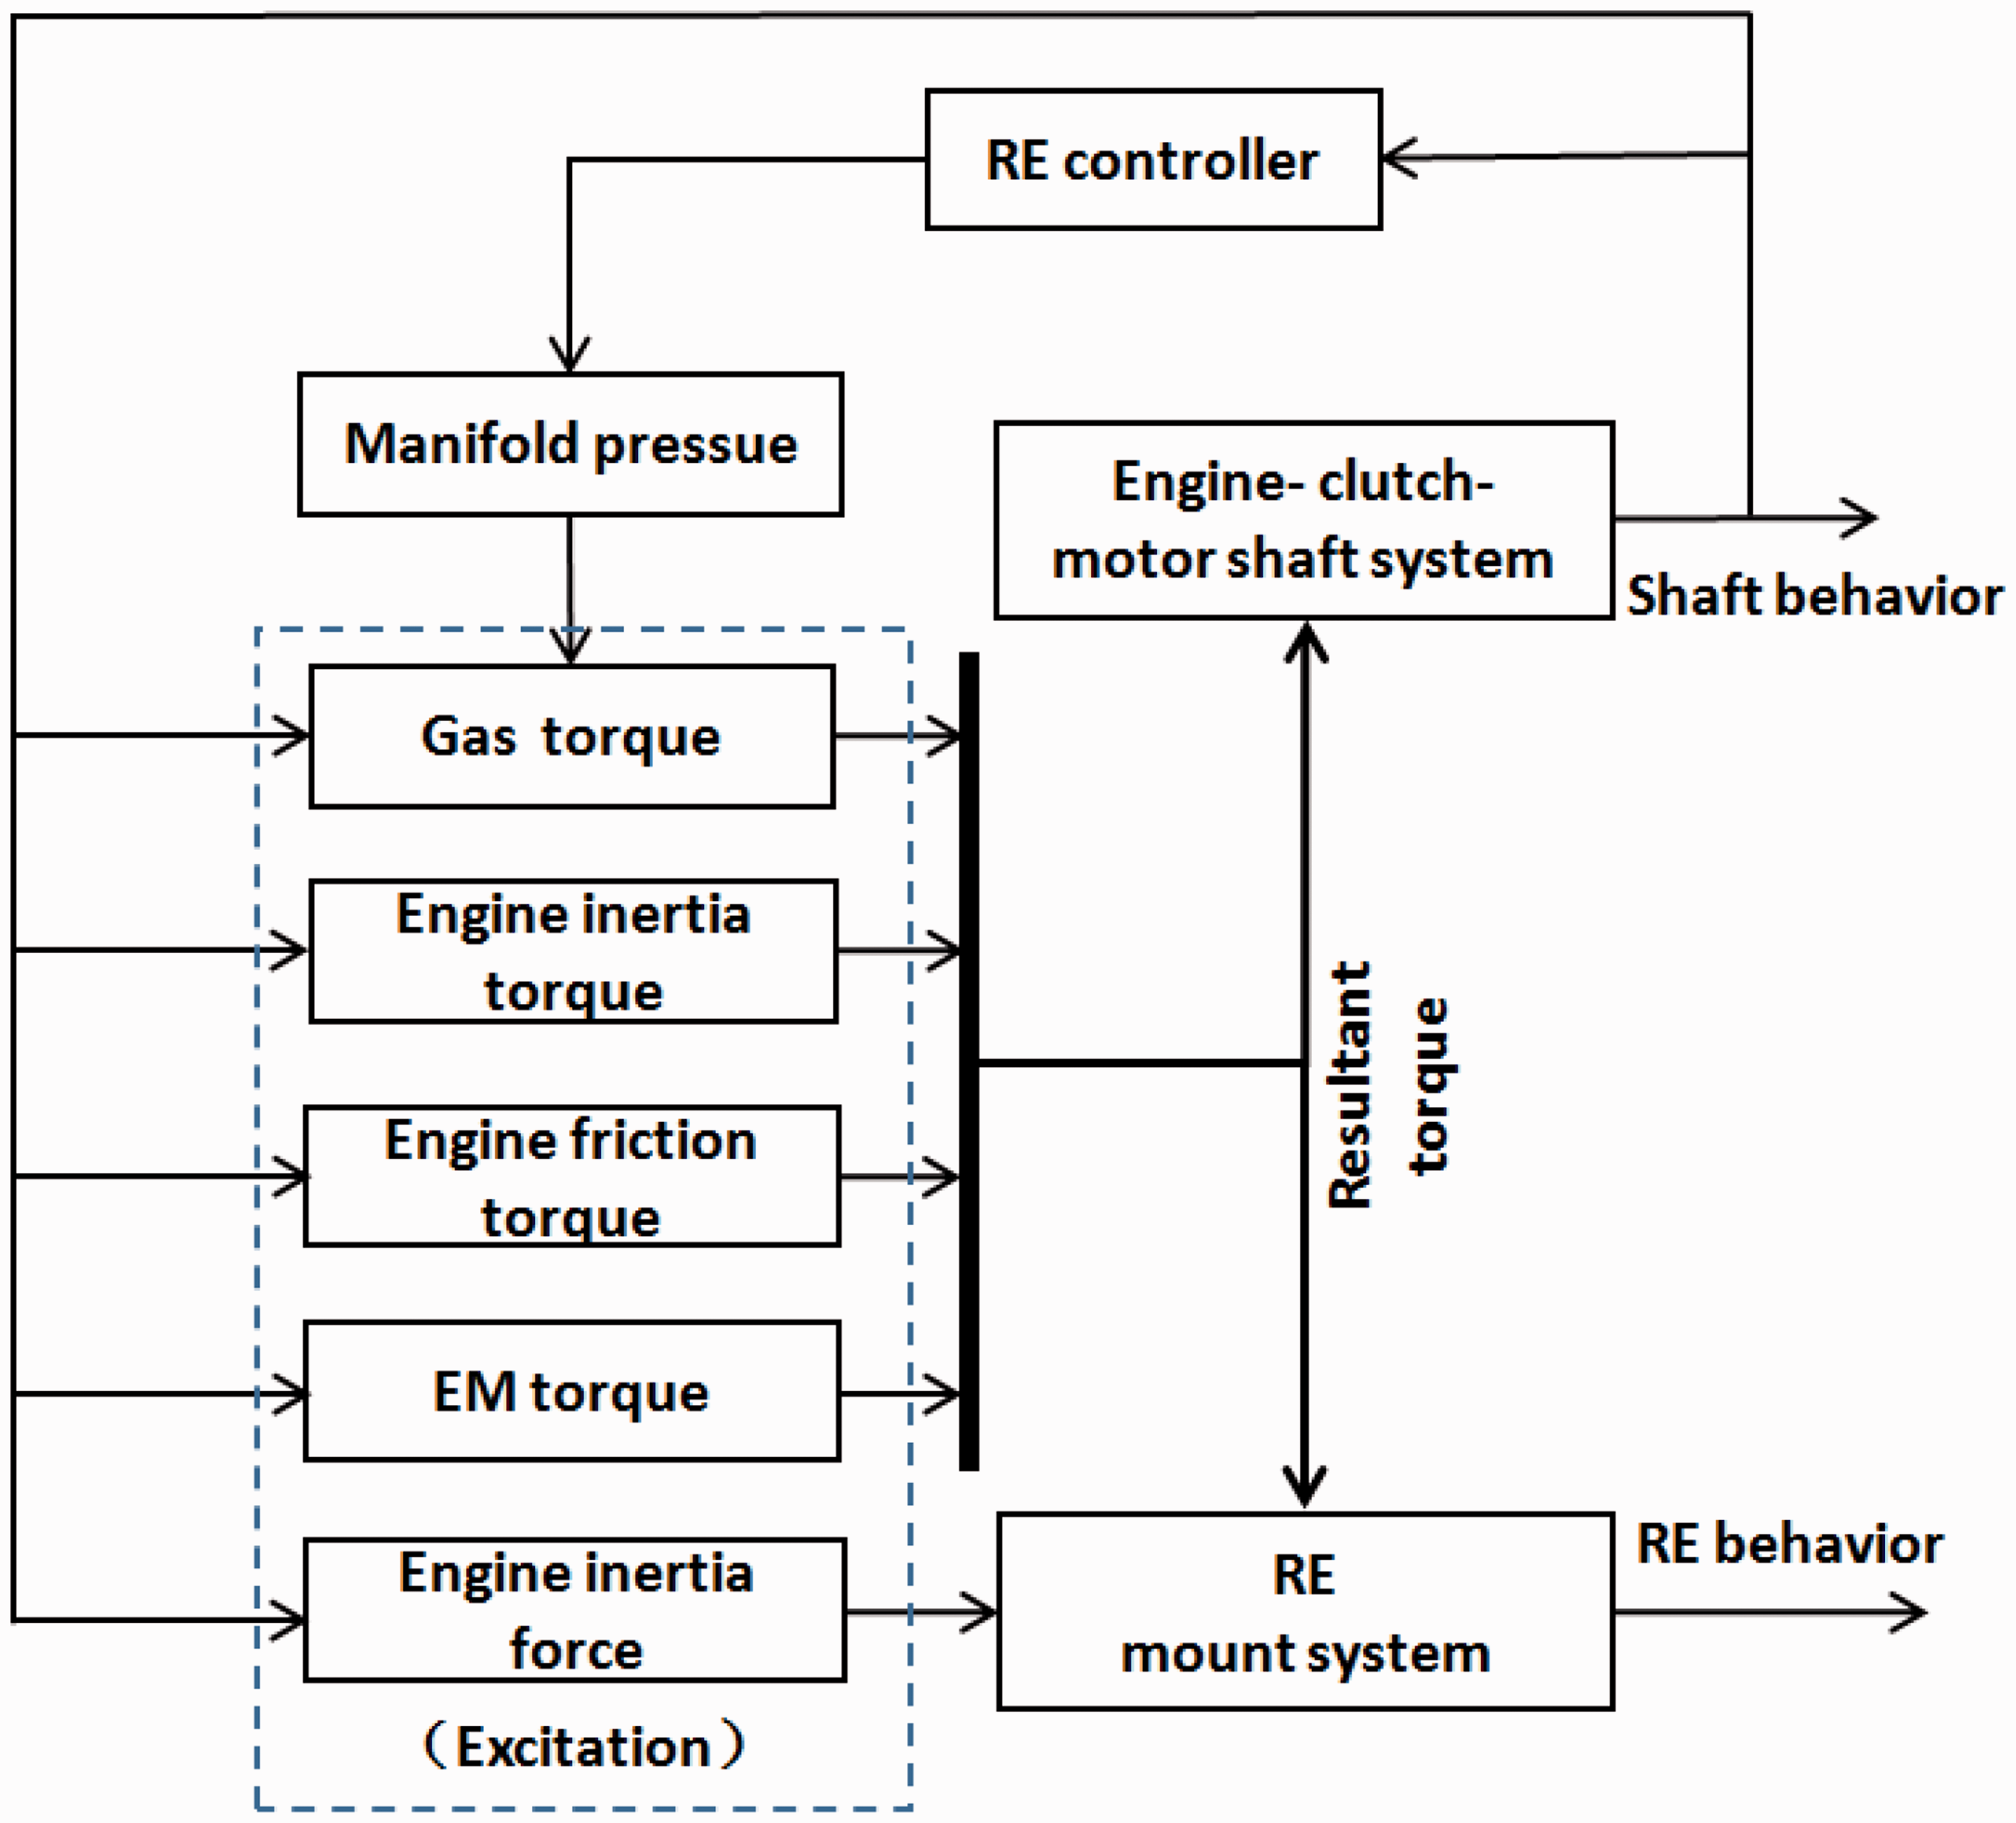
Sections “Range extender mount system” to “Range extender controller” describe in detail the characterization of the system components and the relevant model equations with the corresponding parameter presented in Appendix 1.
Range extender mount system
Generally, the mounted RE block can be considered as a rigid body with six degrees of freedom (DOFs) as shown in Figure 3. Its generalized coordinates are expressed as Schematic of the RE mount system.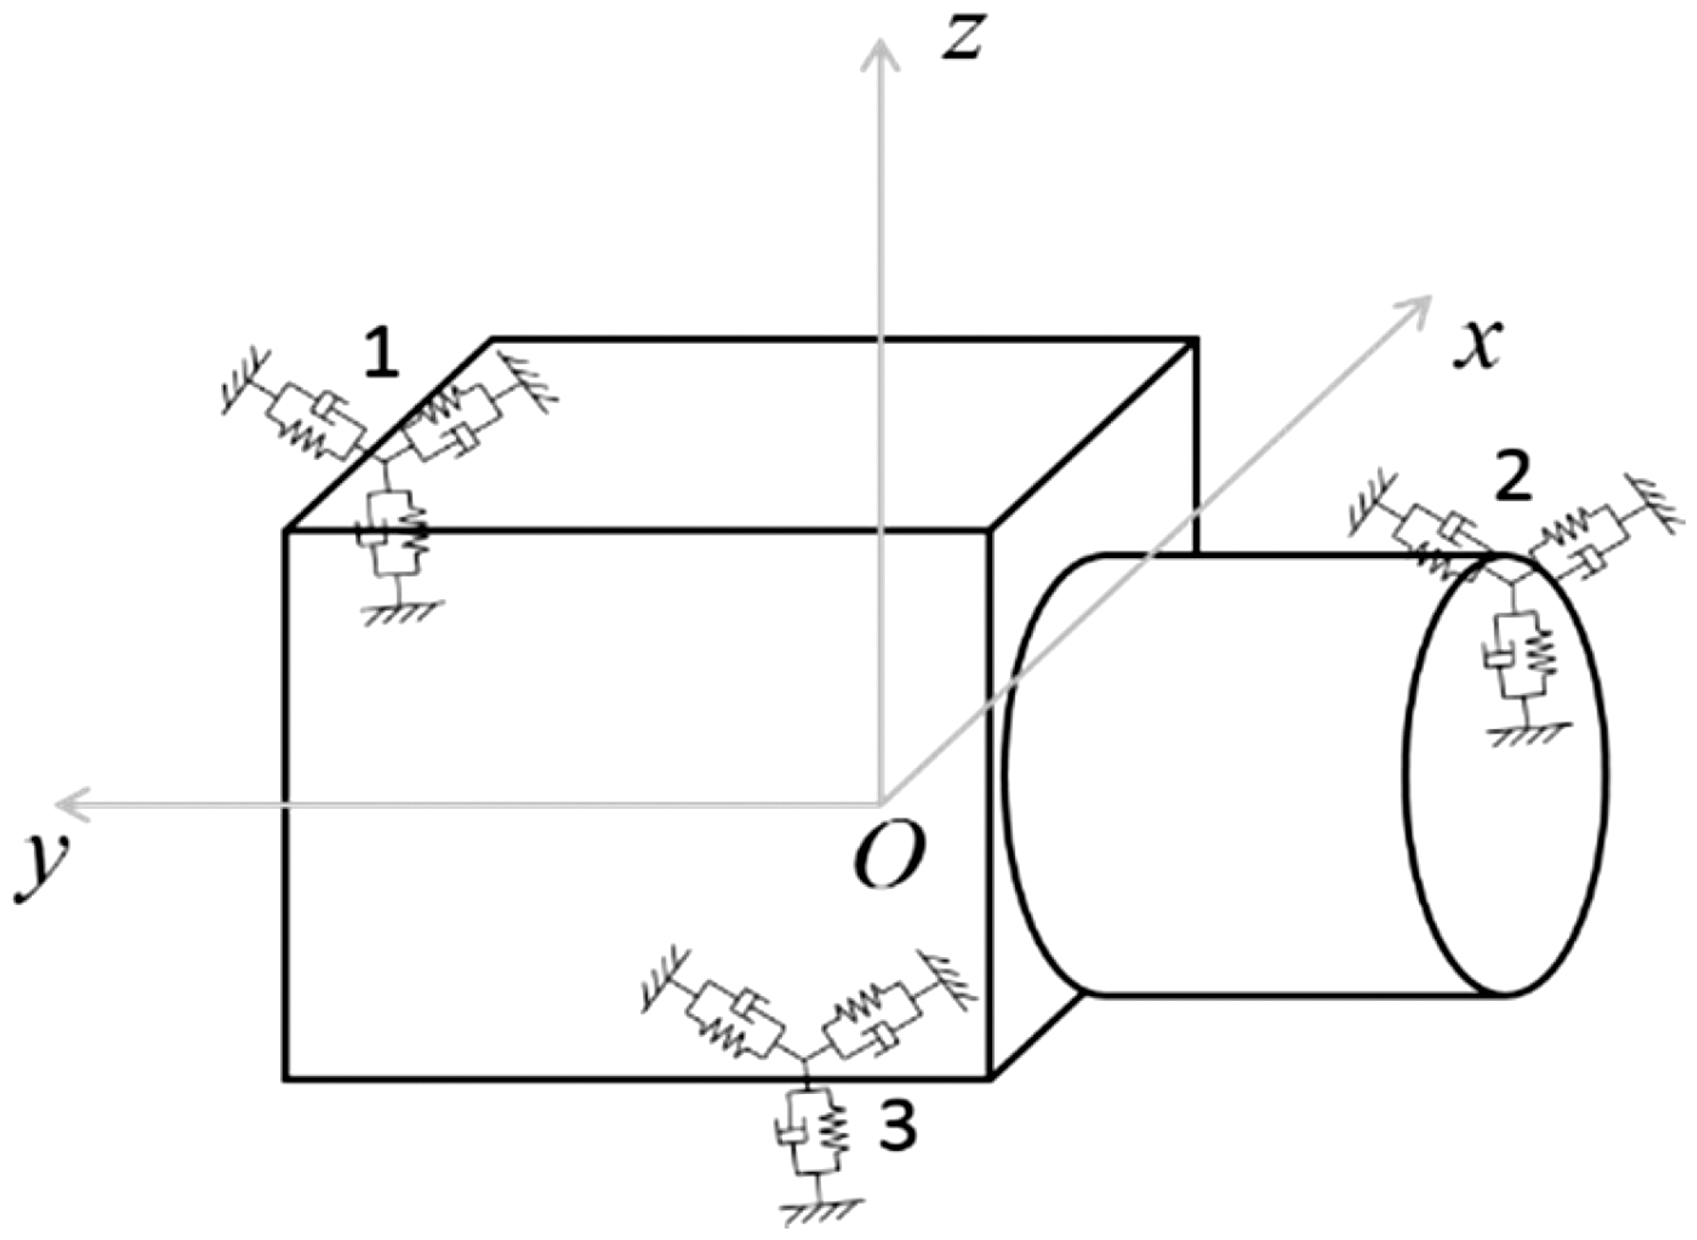
According to Lagrangian mechanics the equilibrium equation of mount motion can be written in the matrix form

Engine–clutch–motor shaft system
The engine–clutch–motor shaft system shown in Figure 4 has three DOFs, including rotational motion of the crankshaft, clutch, and EM rotor, where the clutch is often in the engaged state. Here Coulomb’s Friction is applied for the friction discs.
Schematic of the engine–clutch–shaft system.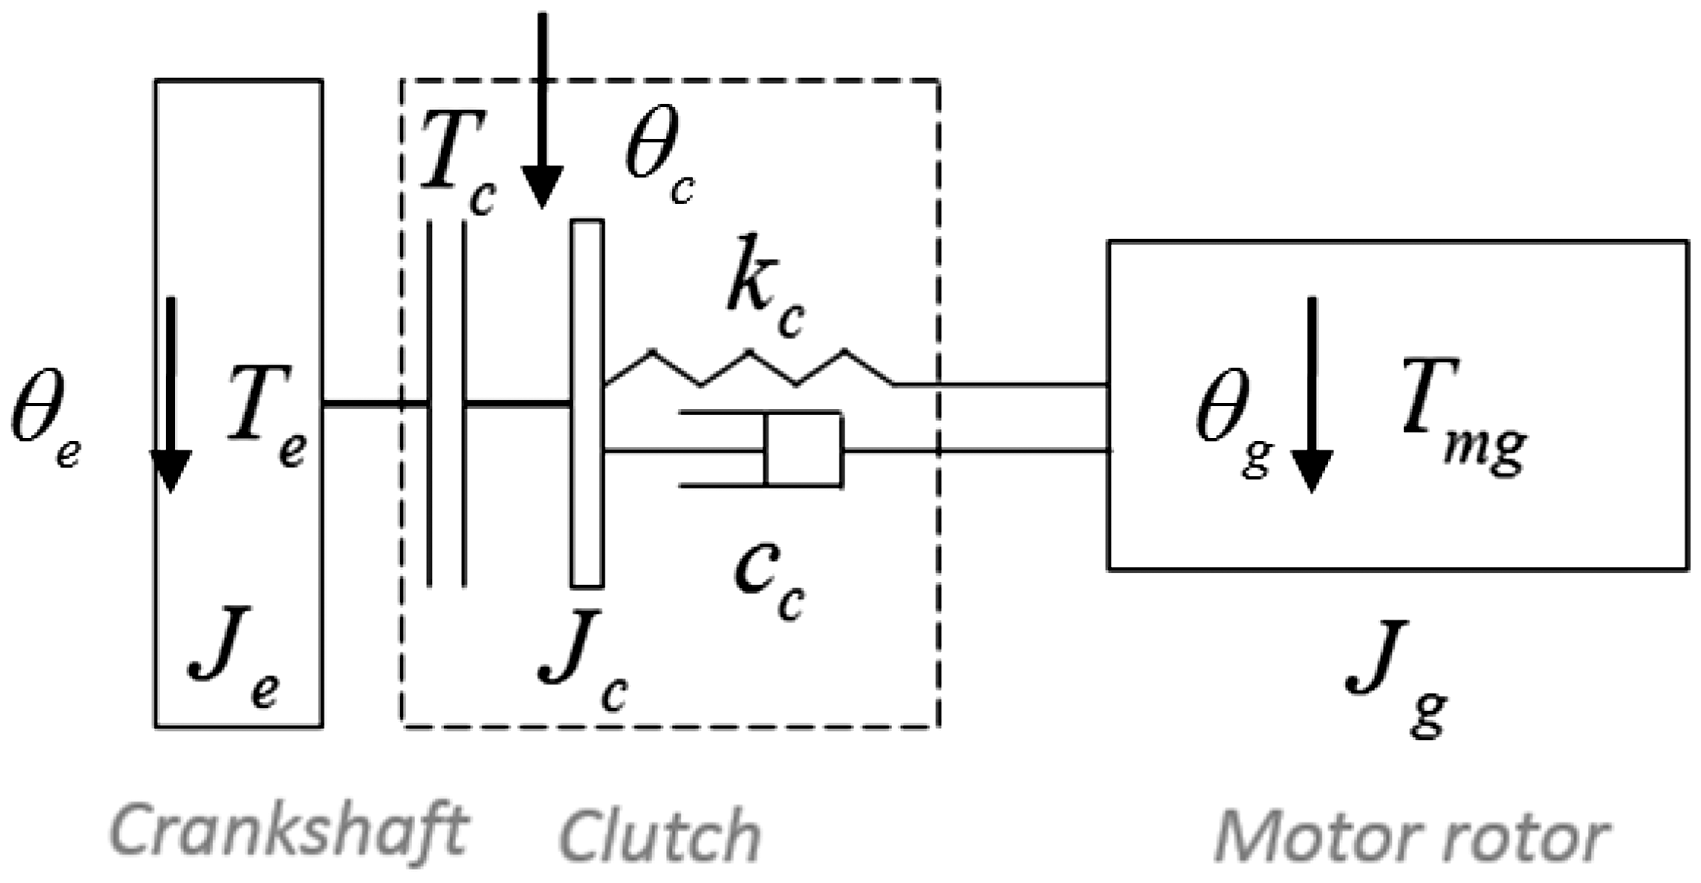
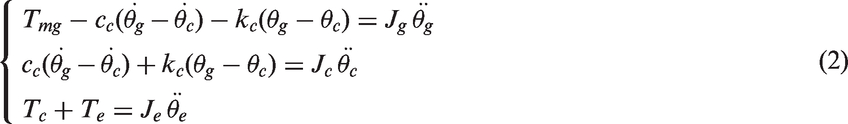
The differential equations governing torsional vibrations of above system are as follows
Engine inertia torque and force
With reference to the symbols in Figure 5, the piston position x for a piston–rod–crankshaft system can be calculated as a function of the angular position θ
Schematic of a piston–rod–crankshaft system.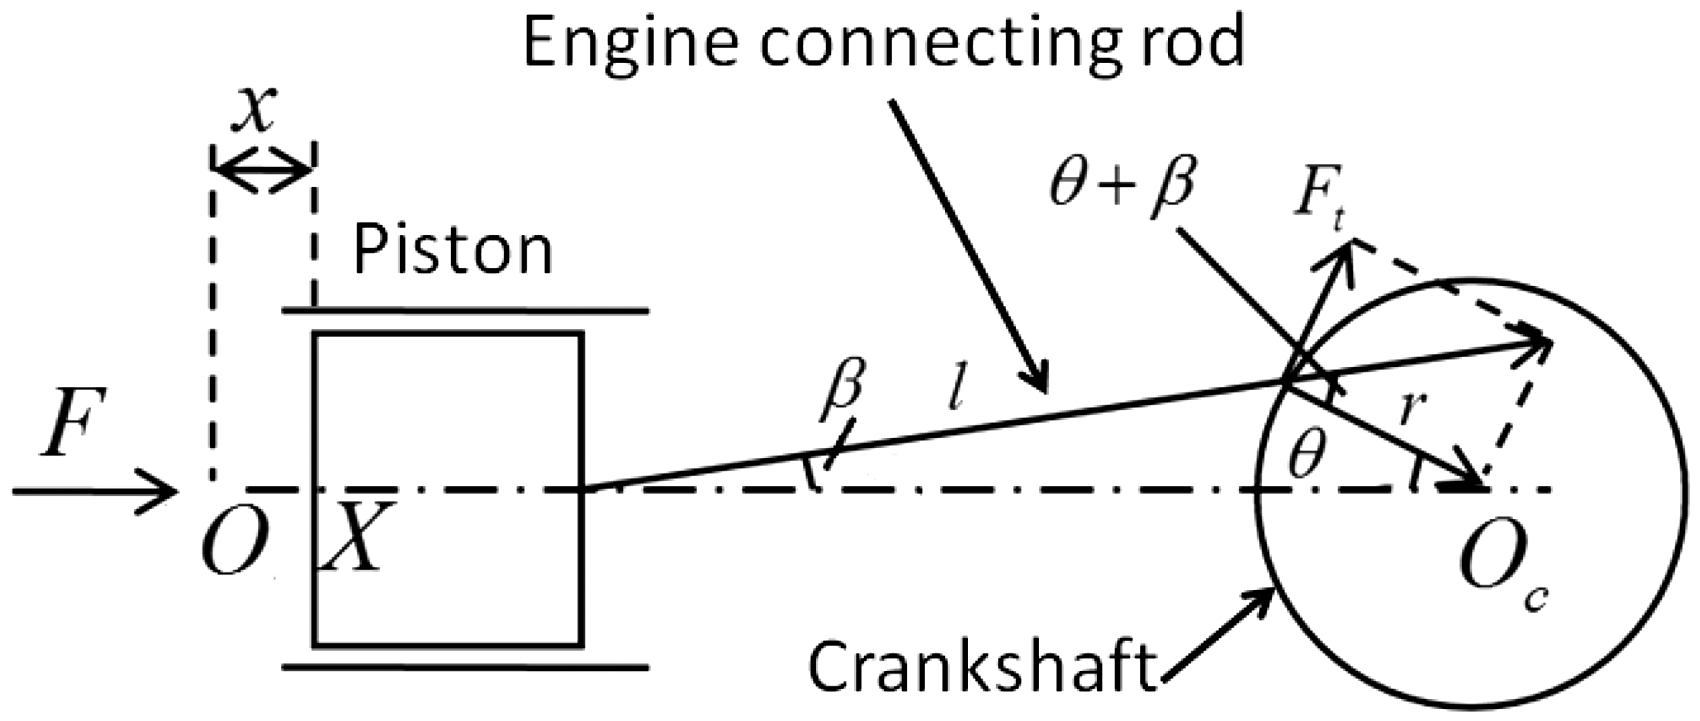

The inertia torque Ti approximates the inertia forces Fi generated by the masses in reciprocating motion, namely, piston, and connecting rod eye


Engine friction torque
The friction torque for an engine tends to fall into three groups: those parts approximately invariable with speed, those varying directly with the speed, and those varying with the square of the speed. 20 Here the influence of the temperature on friction torque is not considered.
When neglecting the minor fluctuation of the friction torque, the model of friction torque for engine can be expressed by Coulomb’s friction (those parts invariable with speed) and viscous friction (those parts varying directly with speed). Moreover, in order to approximately simulate friction characteristics of crankshaft at low speed or a standstill, the static friction and Stribeck curve are considered. Therefore, the friction torque 
Engine GT
The GT is calculated with the cylinder pressure, which concerns not only the current crank angle but also the ICA, manifold pressure, ignition time and so on, all of which are instantaneous variables during RE start–stop, thus making the experimental data of steady-state conditions inadequate. A model for instantaneous cylinder pressure (hence the GT torque) is required. Here it is assumed that the cylinder can be considered as a lumped parameter process, such that the gas states are not space dependent, and that the laws for ideal gases can be applied. This is also called zero-dimensional or single-zone-modeling. These assumptions above
21
allow calculating the pressure p in the cylinder

By integrating equation (7), the cylinder pressure is estimated from intake valve closing (IVC) to exhaust valve opening (EVO). The engine speed during start–stop is low enough to neglect the volumetric efficiency, and the initial value of cylinder pressure for integration is set as the intake manifold pressure.
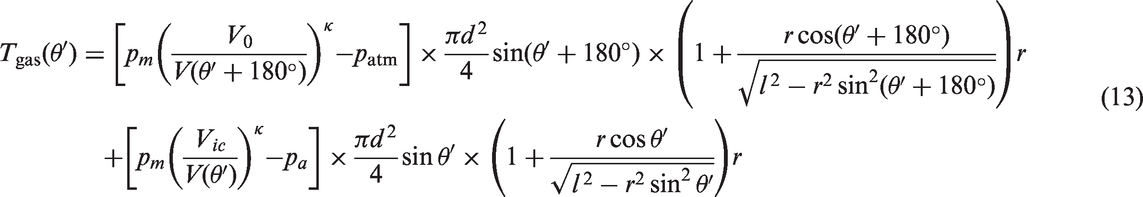
With reference to equation (4) and equation (7), the GT

However, prominent differences of the GT curves with different ICA can be observed during the first fluctuation as seen in Figure 6. In addition, it can be drawn that until passing through the second compression TDC, the GT pulsation is almost the same. Here we define the circle that the crankshaft rotates before the second compression TDC as the initial start circle (ISC) and the circle that the crankshaft rotates from Nth (N ≥ 2) compression TDC to (N + 1)th compression TDC as the regular circle (RC).
GT curves with different ICA.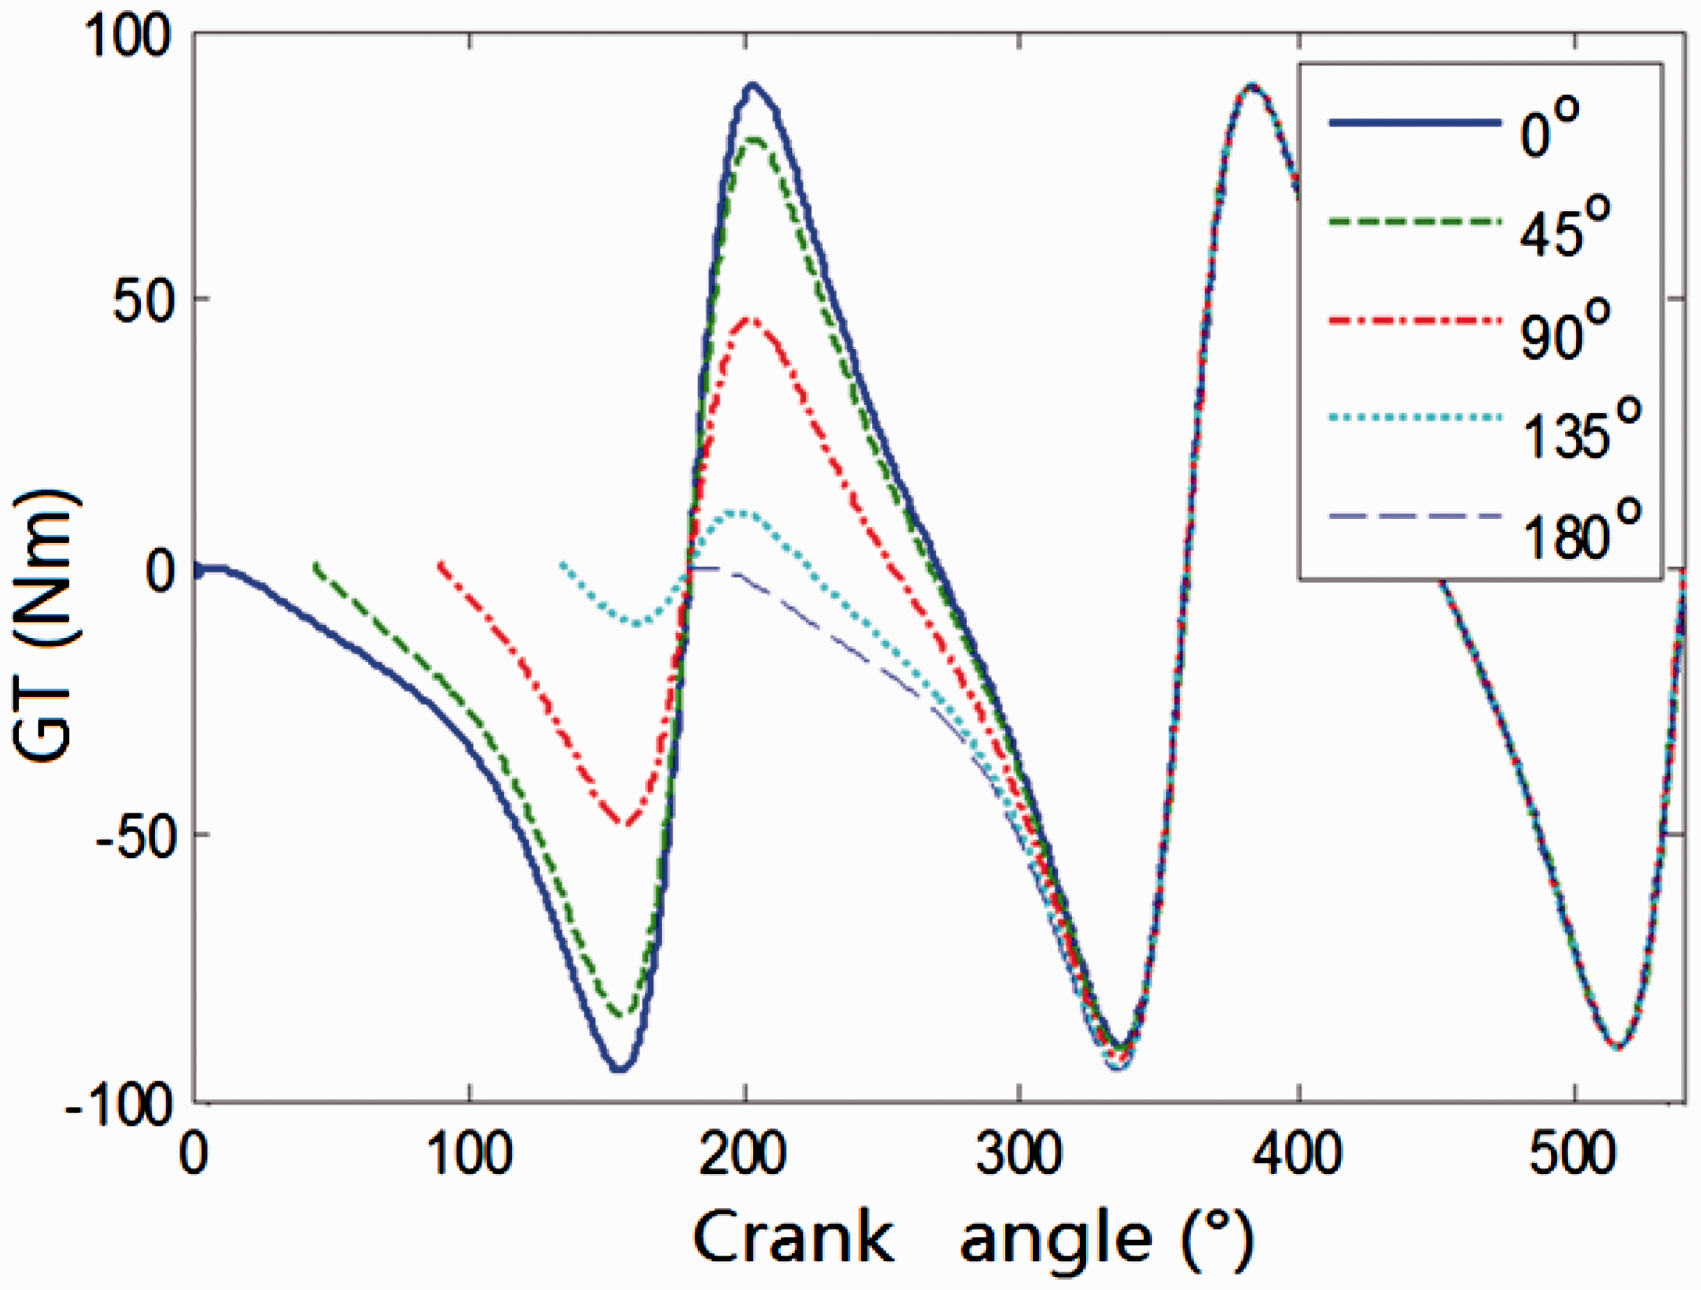
Thus, for more accurate GT prediction for control, the calculation should fall into two parts: the one in ISC and the other in RC. For obvious reasons, ISC ends and RC begins when the crankshaft rotates 360°.
The calculation of GT mentioned above involves many integral operations. After neglecting the combustion energy of fuel and heat transfer losses during motoring, the computational time reduces more than 20 s for the overall simulation condition.
Since the system response speed is quite critical to the control effectiveness, a simplification for GT estimation is recommended here.
Hence this process is approximated as an adiabatic compression, which can simplify equation (7) into the following expression


For a transverse engine with four cylinders in a line and a four-stroke cycle, the ICA

Here the intake lag angle is denoted by

When
When
Here the initial compression volume is that when the intake valve is closed and the initial pressure is equivalent to the manifold pressure.
With the considerations mentioned above to calculate GT, the original simulation value of GT can be well predicted by the estimated one after simplification as shown in Figure 7.
Comparison of GT with different ICA before and after simplification: (a) ICA = 45o diagram; (b) ICA = 135o; (c) ICA = 90o.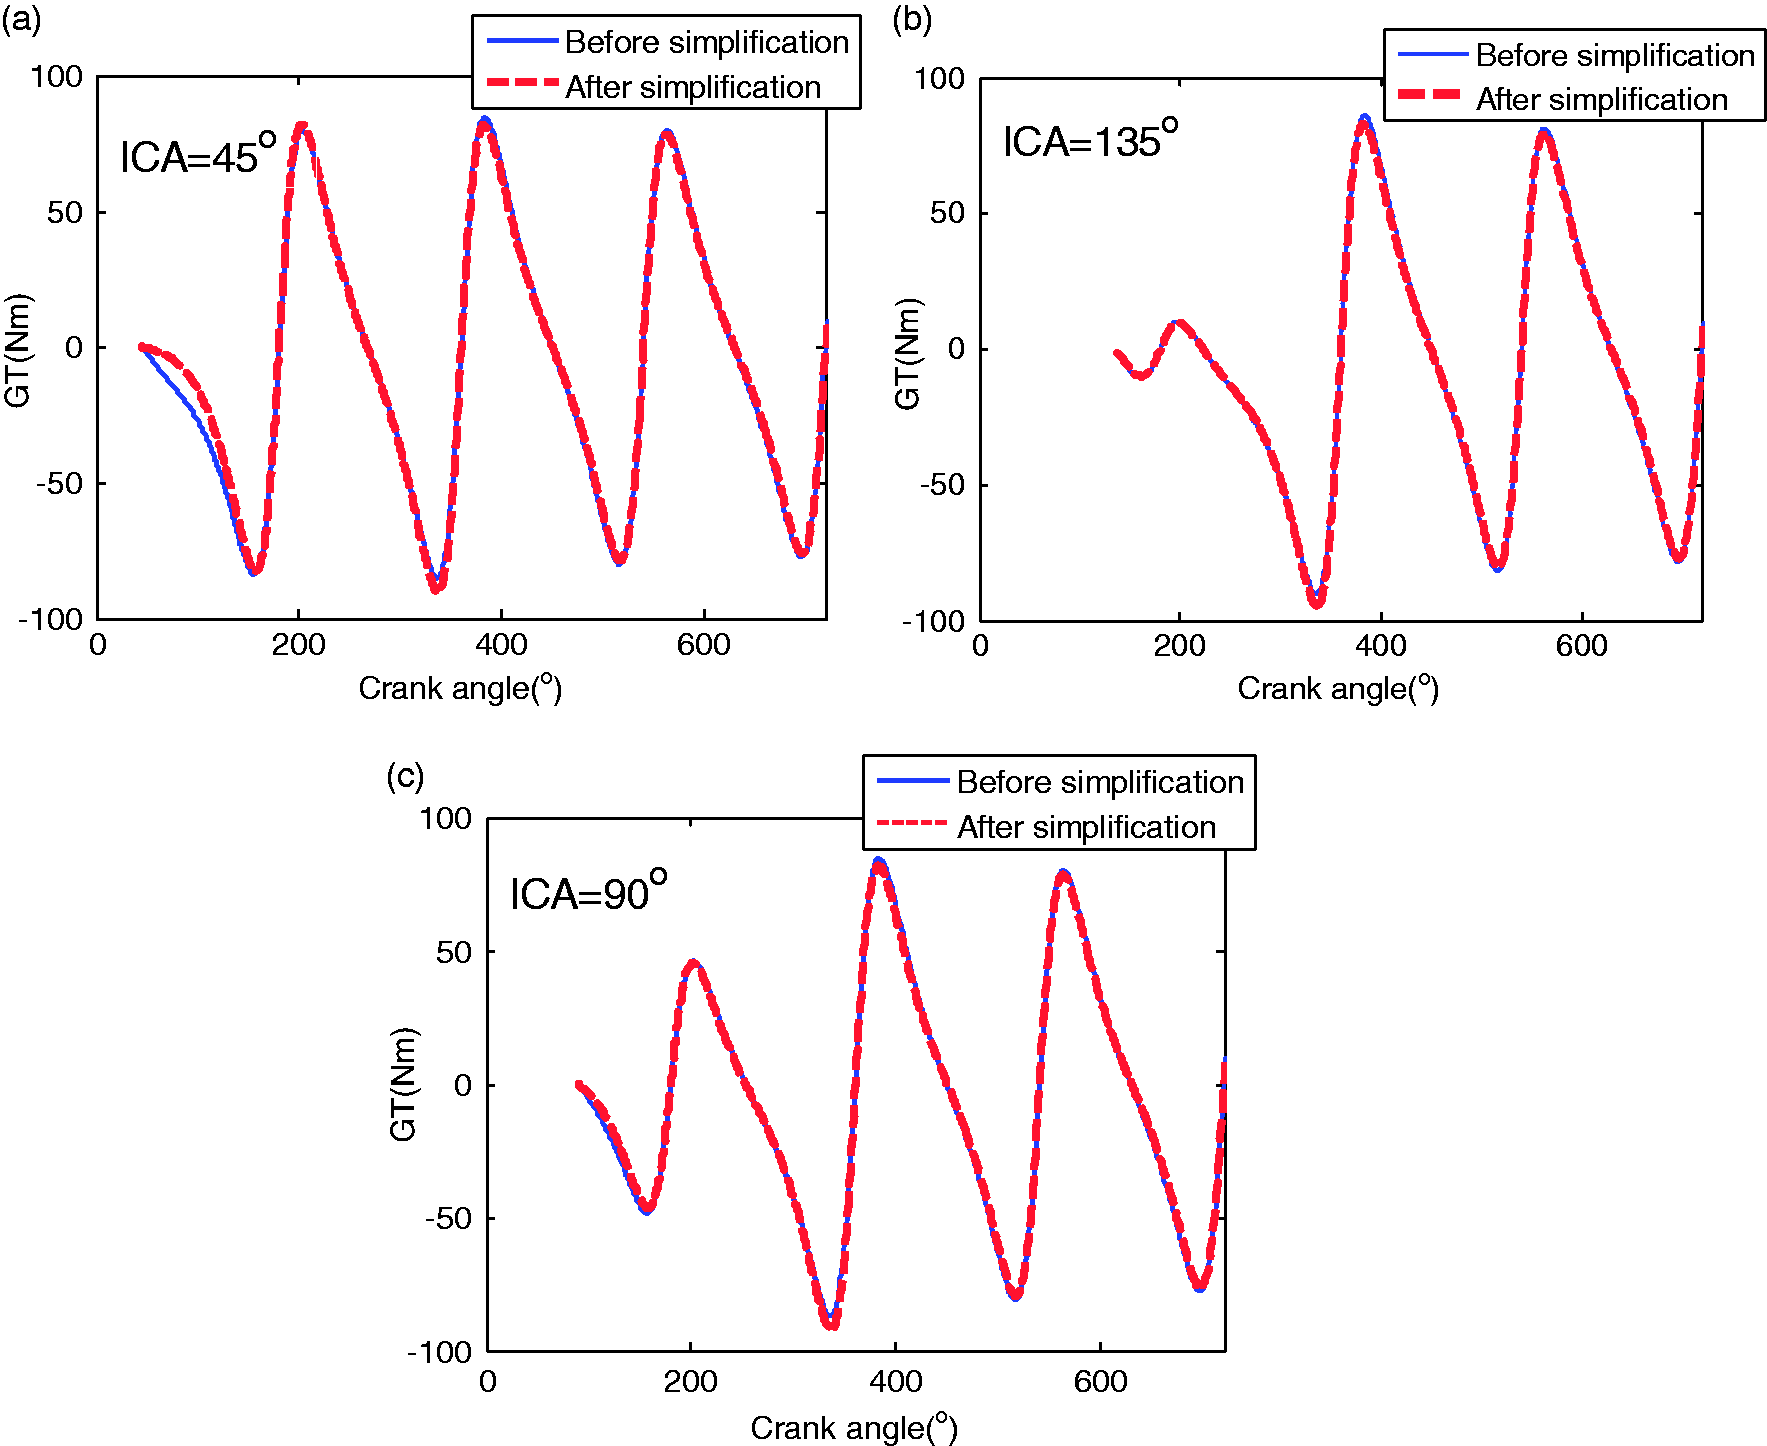
Engine manifold pressure
Regarding the air intake system, the engine itself can be approximated as a volumetric pump, in other words, a device that enforces a volume flow approximately proportional to its speed (as shown in Figure 8),
22
where Ta is the atmospheric temperature, Flow model of air intake system.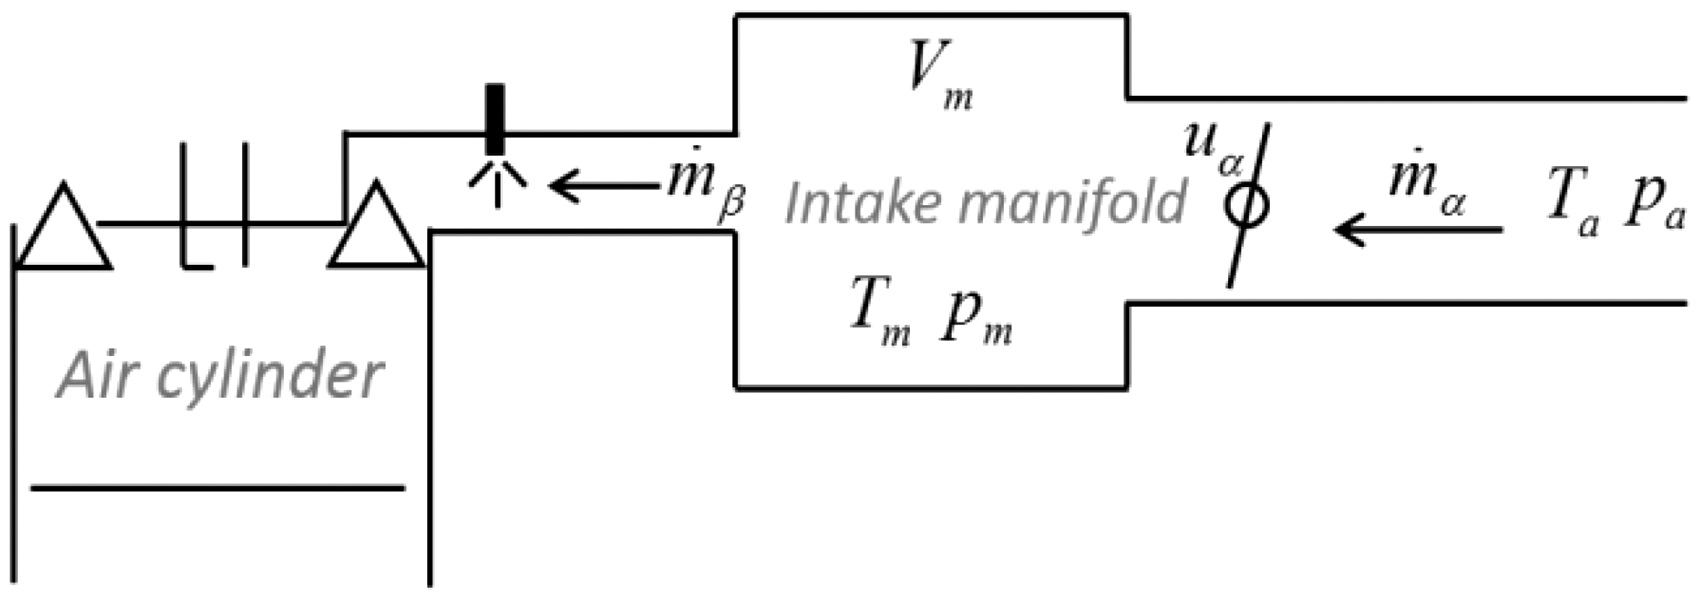
It is assumed that the manifold can be considered as a one-dimensional lumped parameter process, such that the gas states are not space dependent, and that the laws for ideal gases can be applied.
The mean value model for the manifold dynamics can be described by the following equations (no exhaust gas recirculation is considered here)

This equation must be integrated over the time interval of one engine segment to yield the manifold pressure. Here, initial value for integration is set as standard atmosphere.
Here, according to the temperature and pressure upstream and downstream, the air mass flow through the throttle can be found with 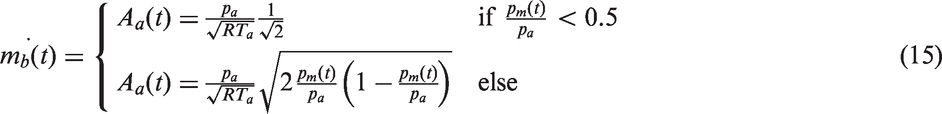

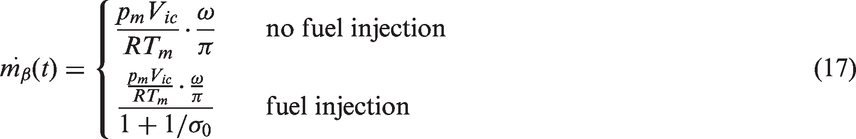
The pressure and temperature of intake gas are approximated as the ones in manifold when volumetric efficiency is neglected. With the engine speed, the air mass flow through intake valve can be expressed as
EM torque
In order to effectively control the EM torque, a model of EM must be defined. The EM dynamics response is generally very fast compared to the duration of a start–stop event, so the EM output can be regarded as instantaneous. In order to simplify the model, the EM is treated as a desired motor with upper and lower torque limits that can realize a high torque-response.
Range extender controller
In order to correctly capture the dynamics during RE start and stop, the motor outputs a constant torque during cranking, while a simple cascaded control system is implemented to simulate the idle speed control, maintaining the engine speed at the reference value from 990 r/min to 1420 r/min. During the stop phase, the motor does not produce an output torque. The parameters are found to match the engine speed profile.
As shown in Figure 9, the inner loop of the cascaded control system is a feedback control of the manifold pressure, which can directly calculate the throttle opening, while the outer loop provides the required torque for the desired engine speed and also for the feedback of the inner loop. Furthermore, a feed-forward is added to directly offset the disturbance of motor torque change for the sake of a steady engine speed.
Schematic of engine steady speed control.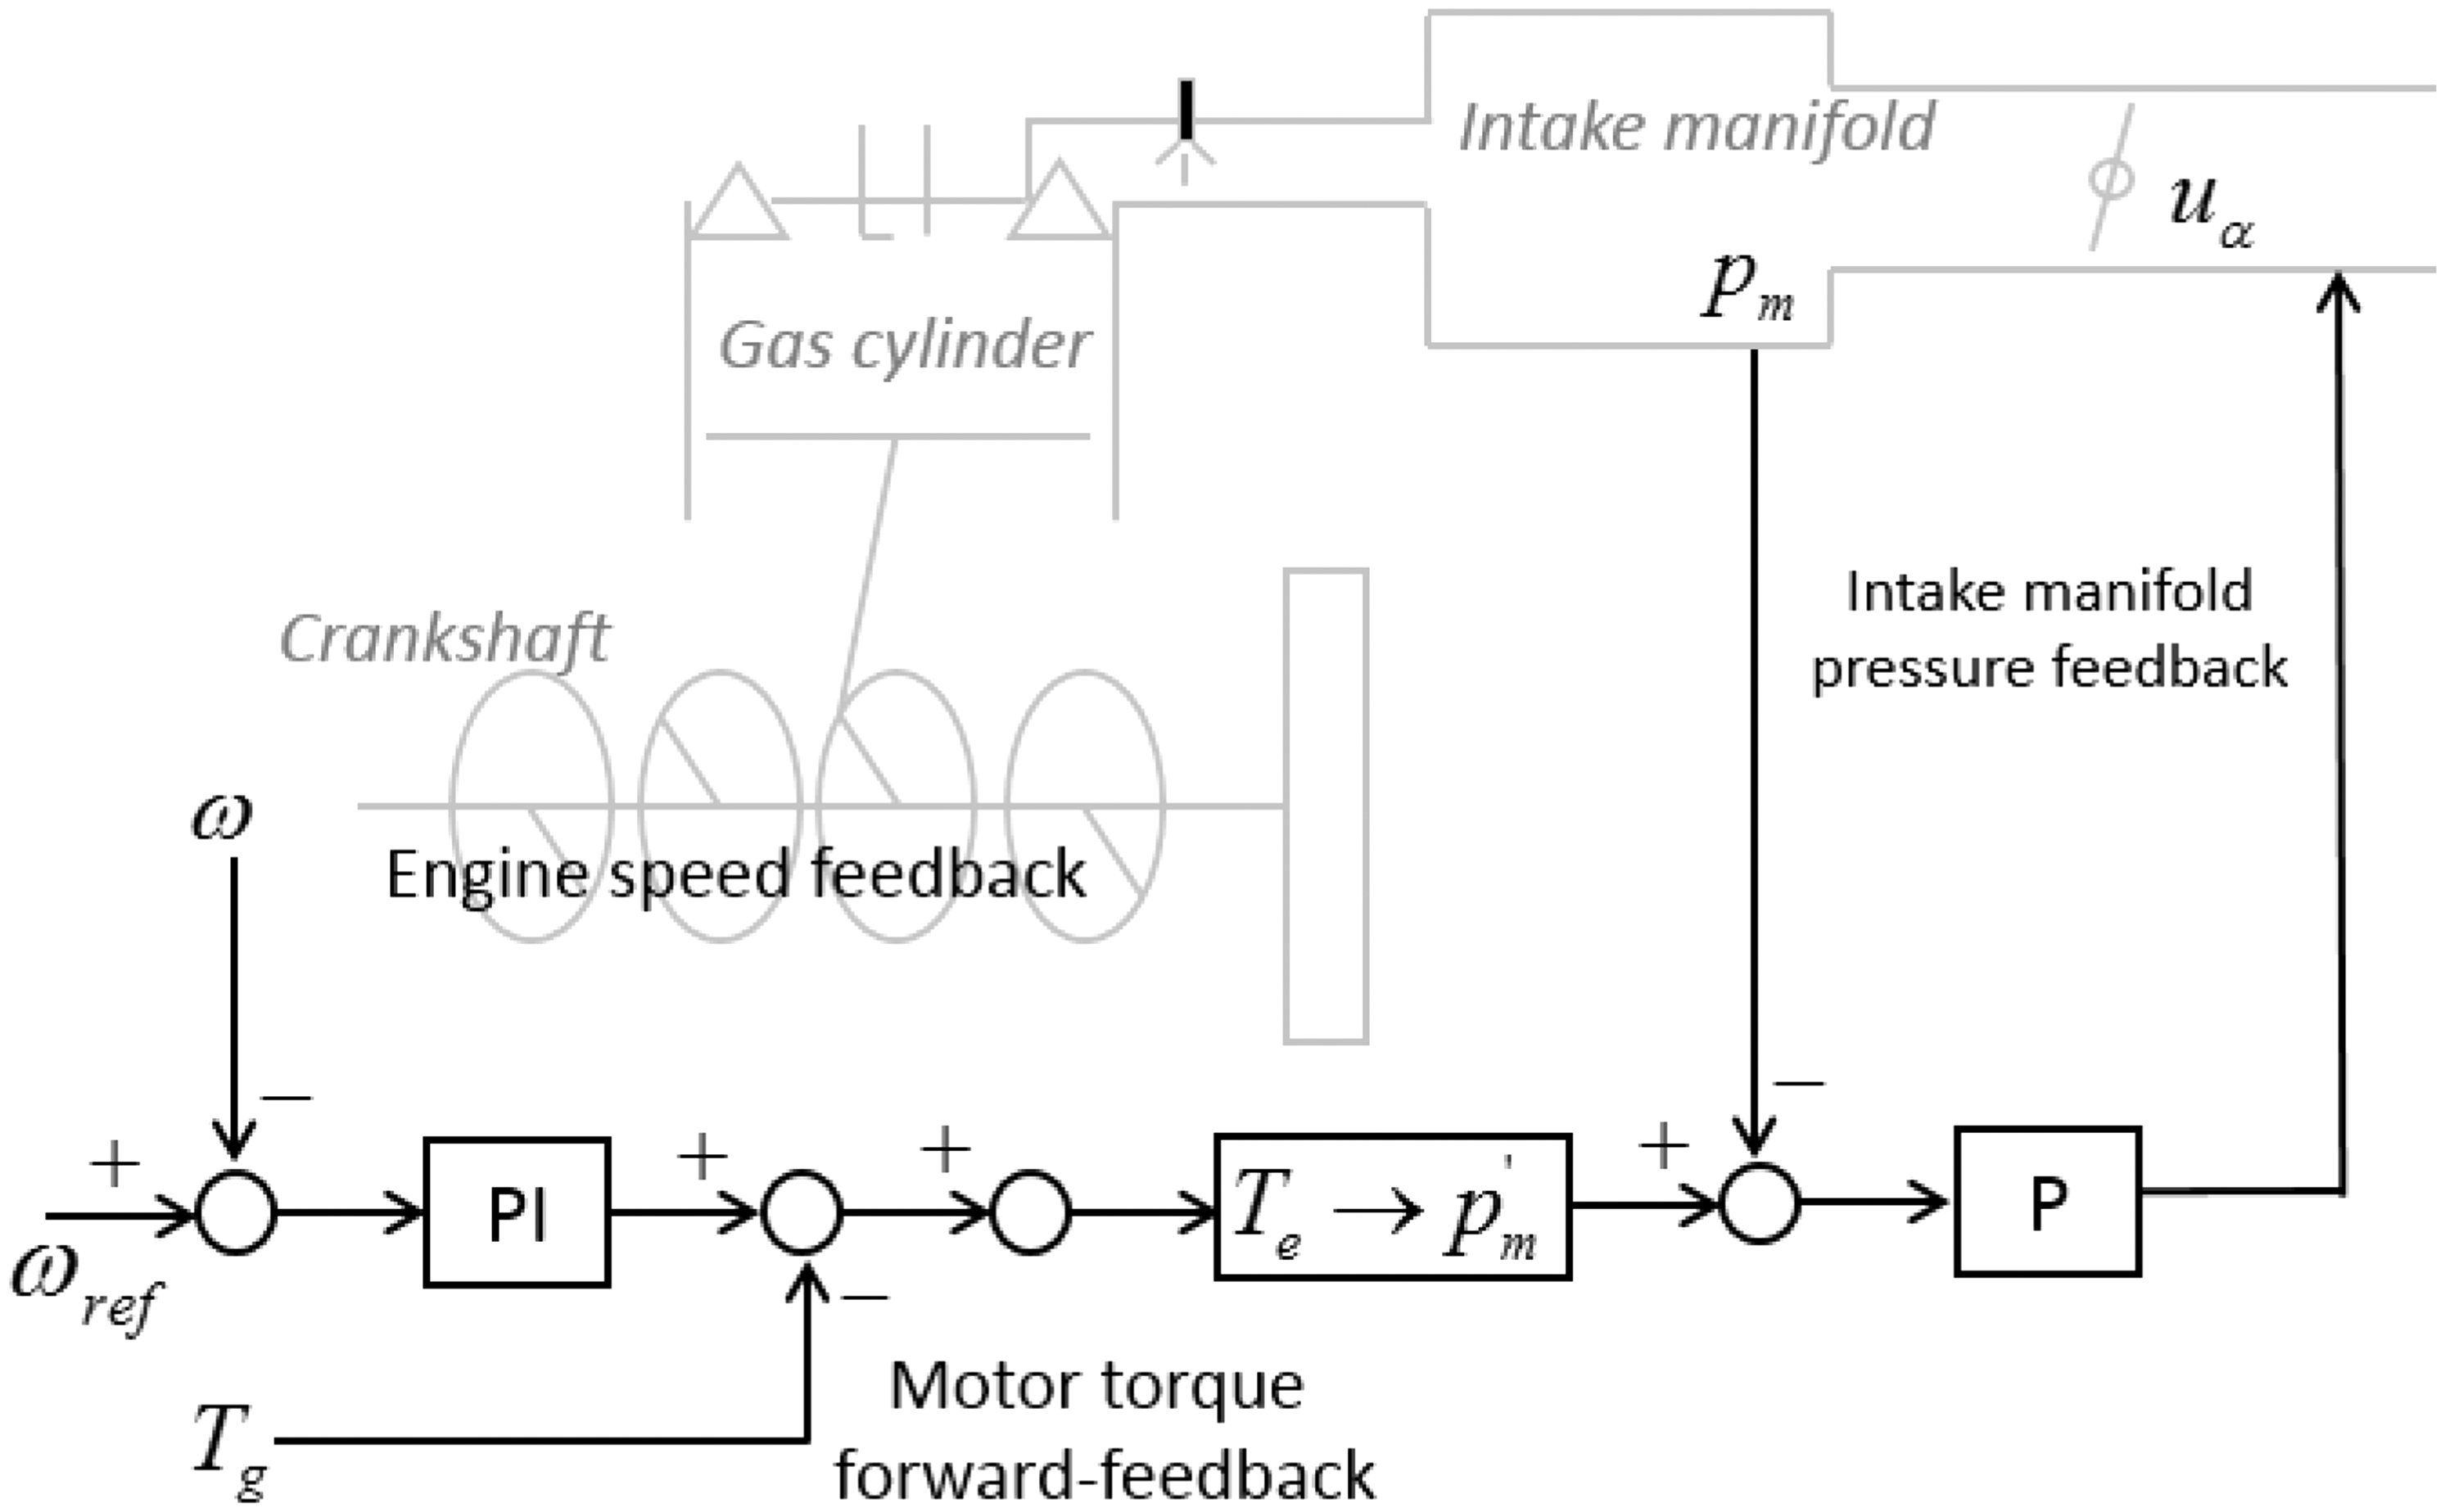
Crankshaft stop position control
In the ReEV, the shaft system is not coupled with the driveline; thus, the vibration from the shaft system can not be directly transferred to the car body. Here it is assumed that the vibration in the shaft system is relatively small compared to the one in the mount system, and in the following text the active control method, CSPC, will be thus focused on to suppress the vibration for the mount system.
Based on the RE start–stop vibration analysis model built in “Model development” section, a detailed design for CSPC to achieve the optimal stop position is carried out in “Crankshaft stop position analysis” to “EM-based control design” sections.
Crankshaft stop position analysis
The crankshaft stop position decides the ICA for RE start, however, as shown in Figure 6, ICA has a significant influence on the main excitation, GT, since it decides the completeness of the first compression and power stroke.
For a transverse engine, the excitation rotating around the y-direction is mostly coupled with the x-direction (as shown in Appendix 2 Table 2), which leads to the longitudinal vehicular vibration. Therefore, the excitation force of the RE block acting on the vehicle body in x-direction is taken as an important index to reflect the vibration event.
Based on the RE mount system built in “Range extender mount system” section, vibration of the RE block under different conditions, in other words, different ICA, can be thus reflected with the corresponding excitation. Figure 10 presents the relationship between ICA and peak-to-peak force on the mount system in the x-direction during the cranking phase. It can be seen that the mount system vibrates most severely when the ICA is about 22°. The peak-to-peak excitation force is over 950 N, while the minimum vibration occurs when ICA is 91°. At this time, the peak-to-peak force is about 481 N, only about half of the maximum one. Thus it can be concluded that the crankshaft stop position is critical to the vibration during the next RE start phase. Here the optimal ICA for start–stop vibration in this study is defined as 91°.
Peak-to-peak force on the mount system in the x-direction with different ICA.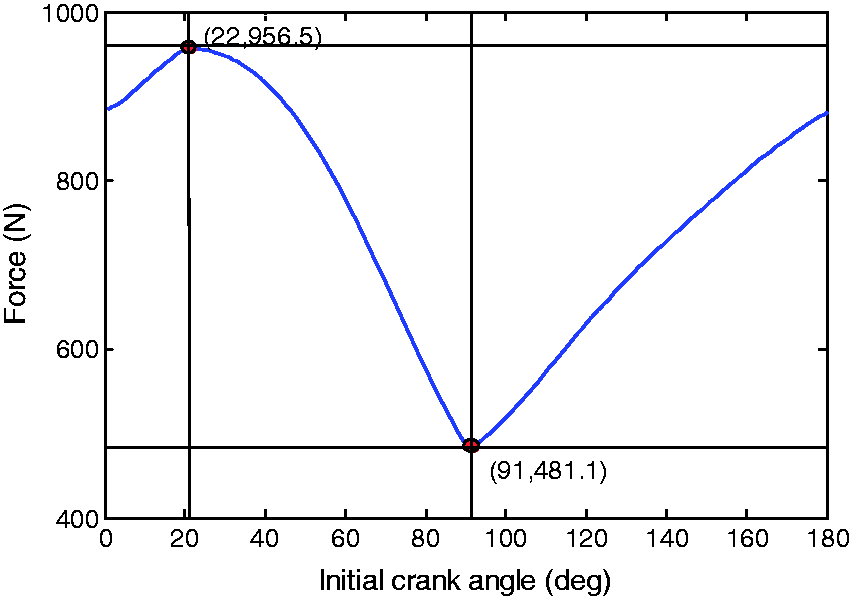
It is worth noting that achieving the optimal ICA should be possible for the crankshaft stop in this position even when CSPC is not applied. Otherwise, the crankshaft will rotate to another position when the motor output torque for CSPC is removed. Therefore that should be proven whether or not the optimal ICA is achievable.
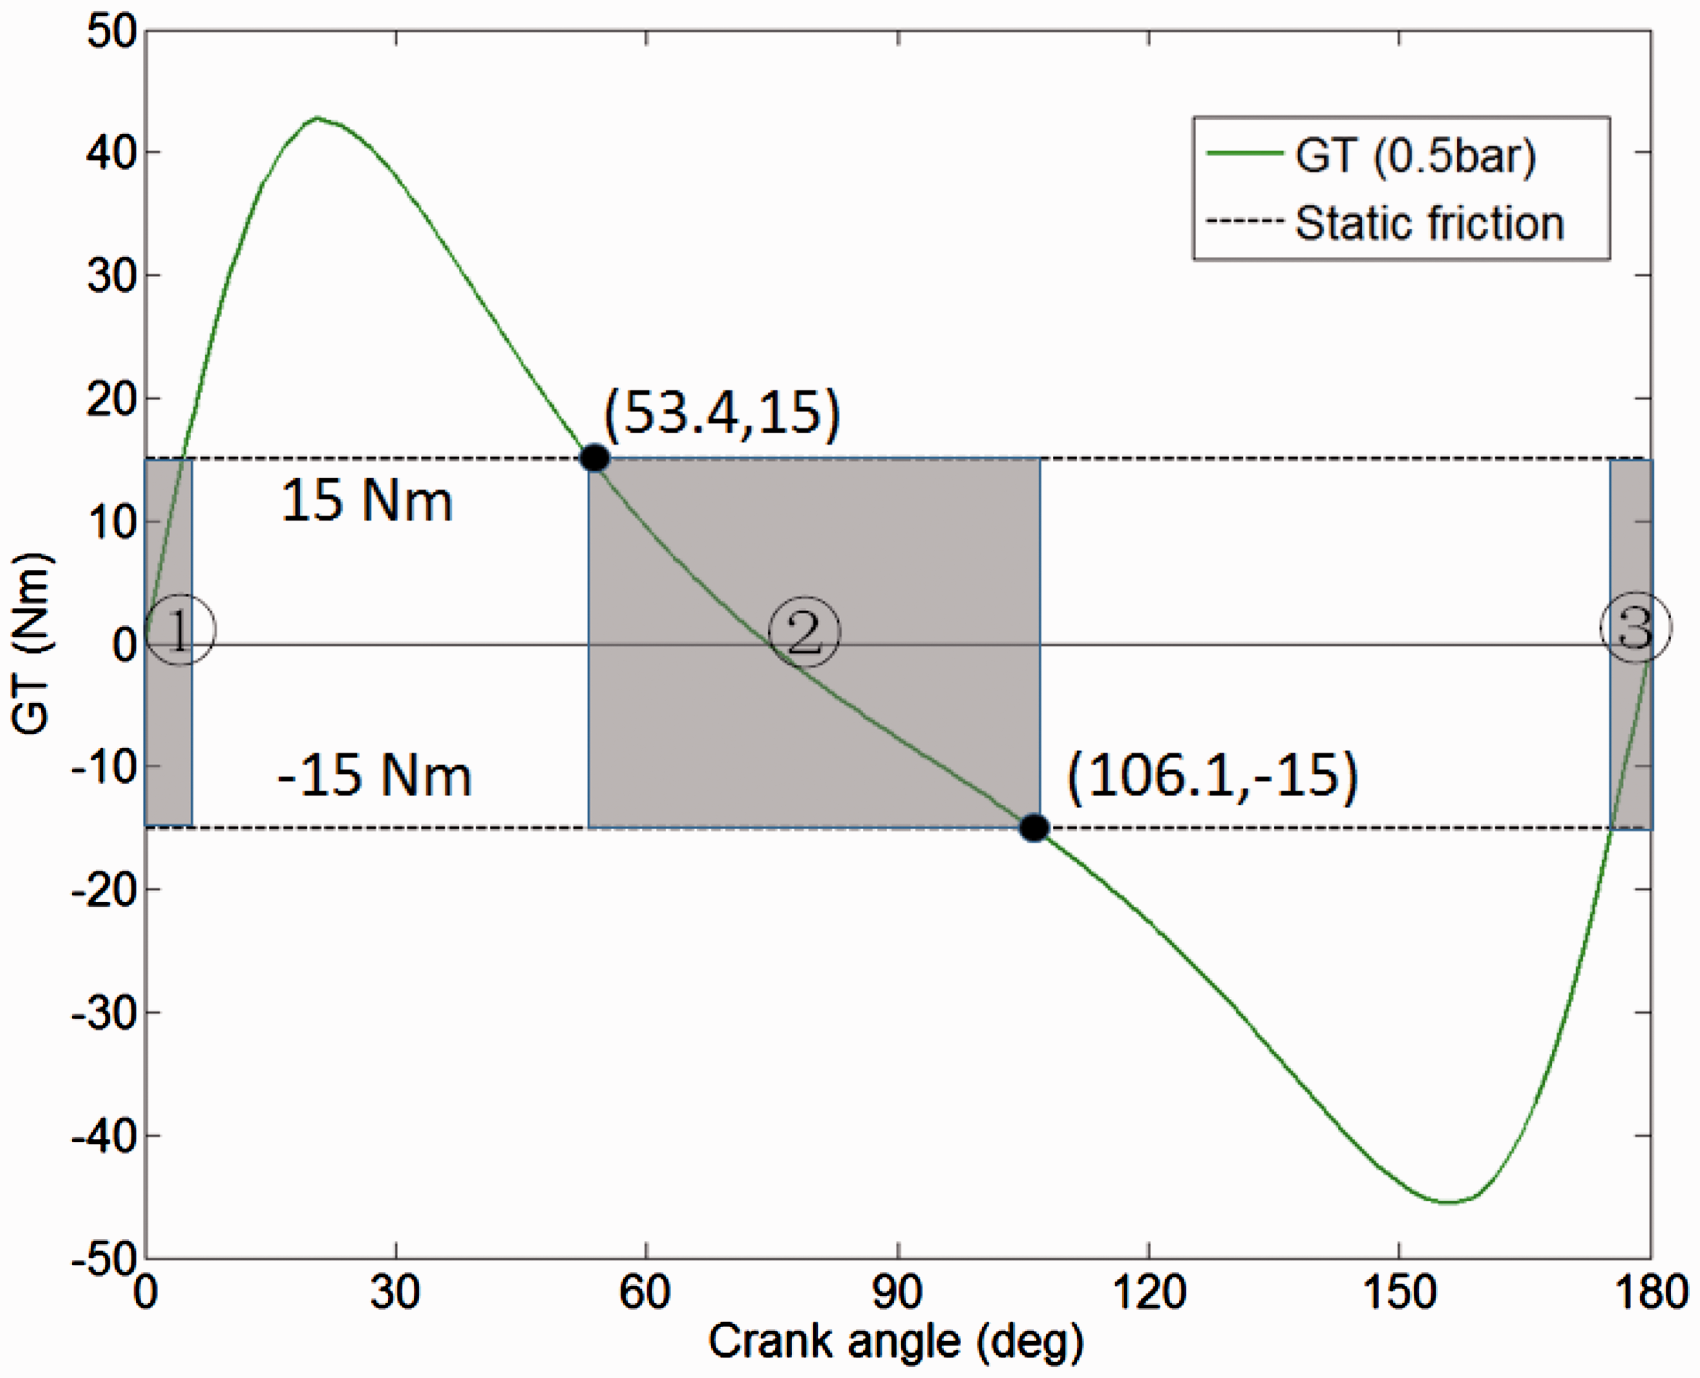
Here the maximum static friction is defined as 15 Nm (see Table 5 in Appendix 2) and the manifold pressure can be calculated with equation (14). As shown in Figure 11, it is about 0.5 bar at the beginning of the stop phase. The relation between GT and crank angle can thus be found with equation (12) and equation (13) under the steady manifold pressure. In a balance state, the crankshaft will finally stop (as the grey area shown in Figure 12) where GT is equivalent to the static friction. However, the two stop positions area ① and area ② that are located around 0° and 180° are unstable since the piston tends to leave the equilibrium position due to a larger GT afterwards. Hence, it is more likely to stop in area ③ where the crank angle is in the range of 53.4 ≤ θ ≤ 106.1. This range covers the opitimal ICA with an error of ±10°; therefore, it is possible for the crankshaft to stop at the optimal ICA.
Manifold pressure during the stop phase. Analysis of the crankshaft balance position.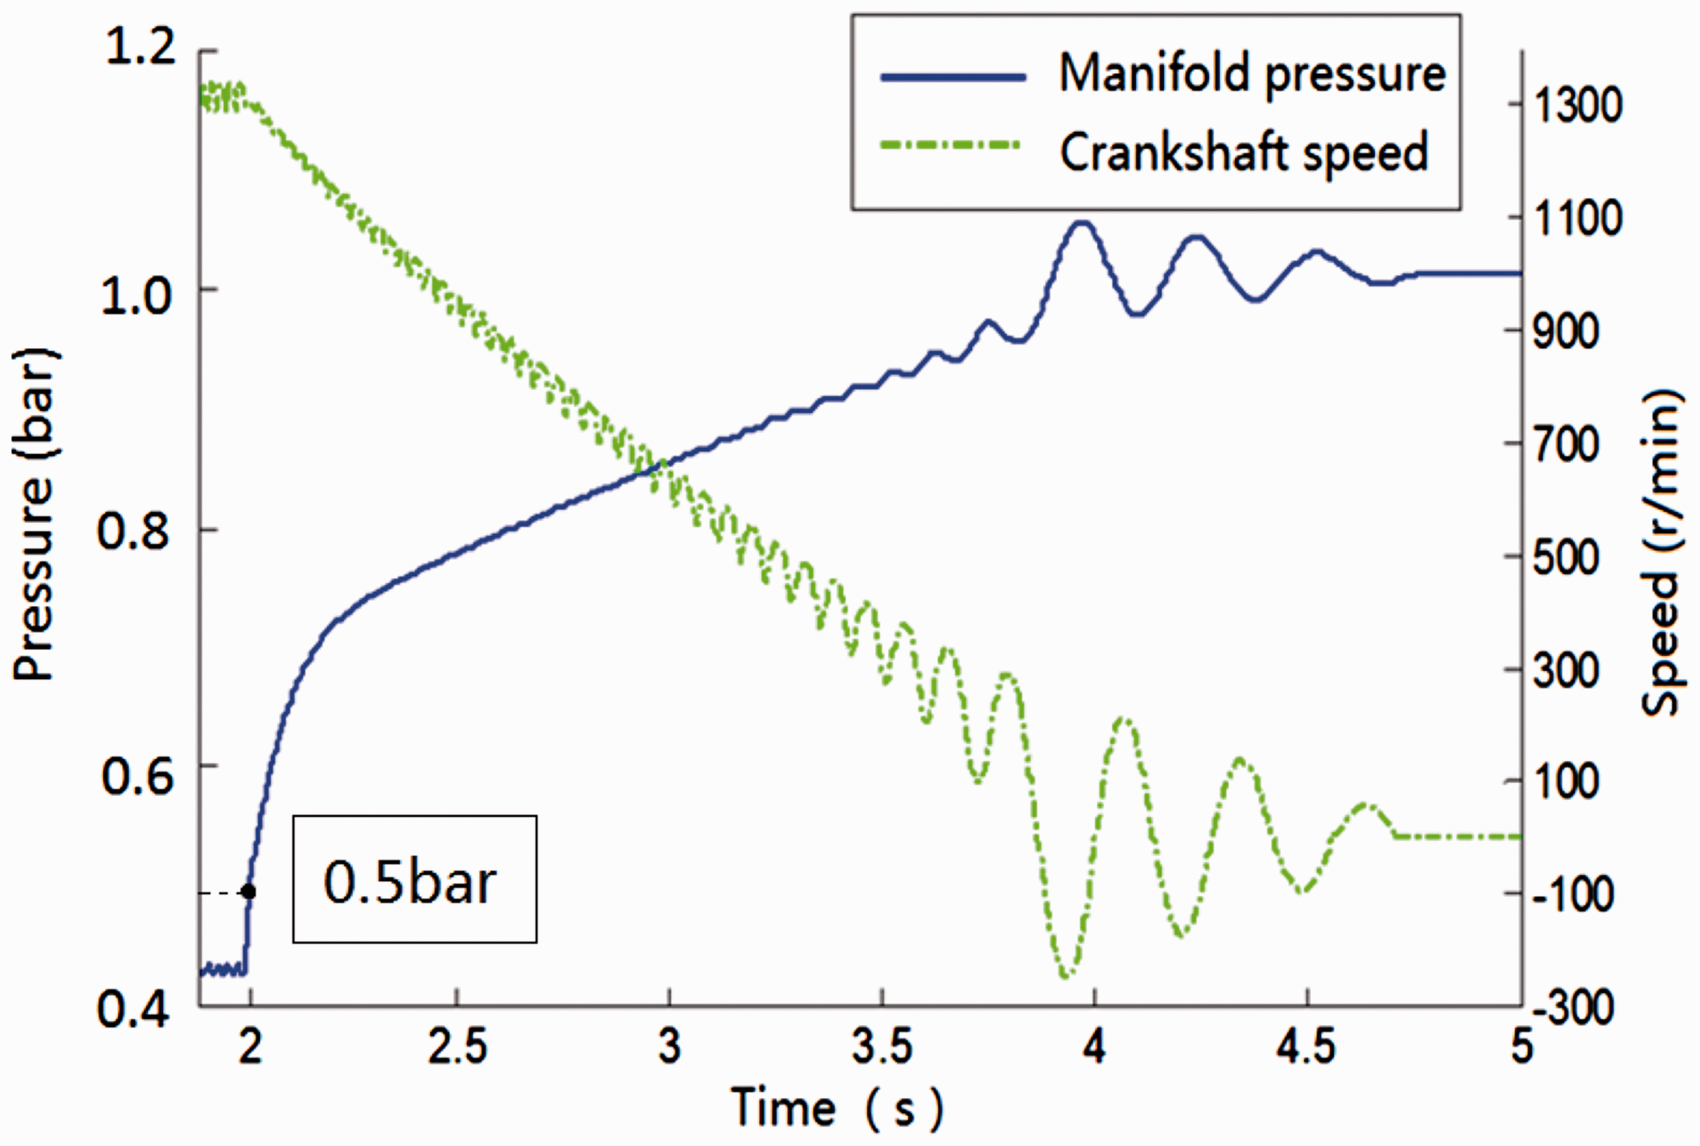
Target curve design for crankshaft movement during stop phase
In “Crankshaft stop position analysis” section, the optimal ICA has been found. Hence in this section, the target curves for crankshaft movement during the stop phase will be designed to realize this desired stop position.
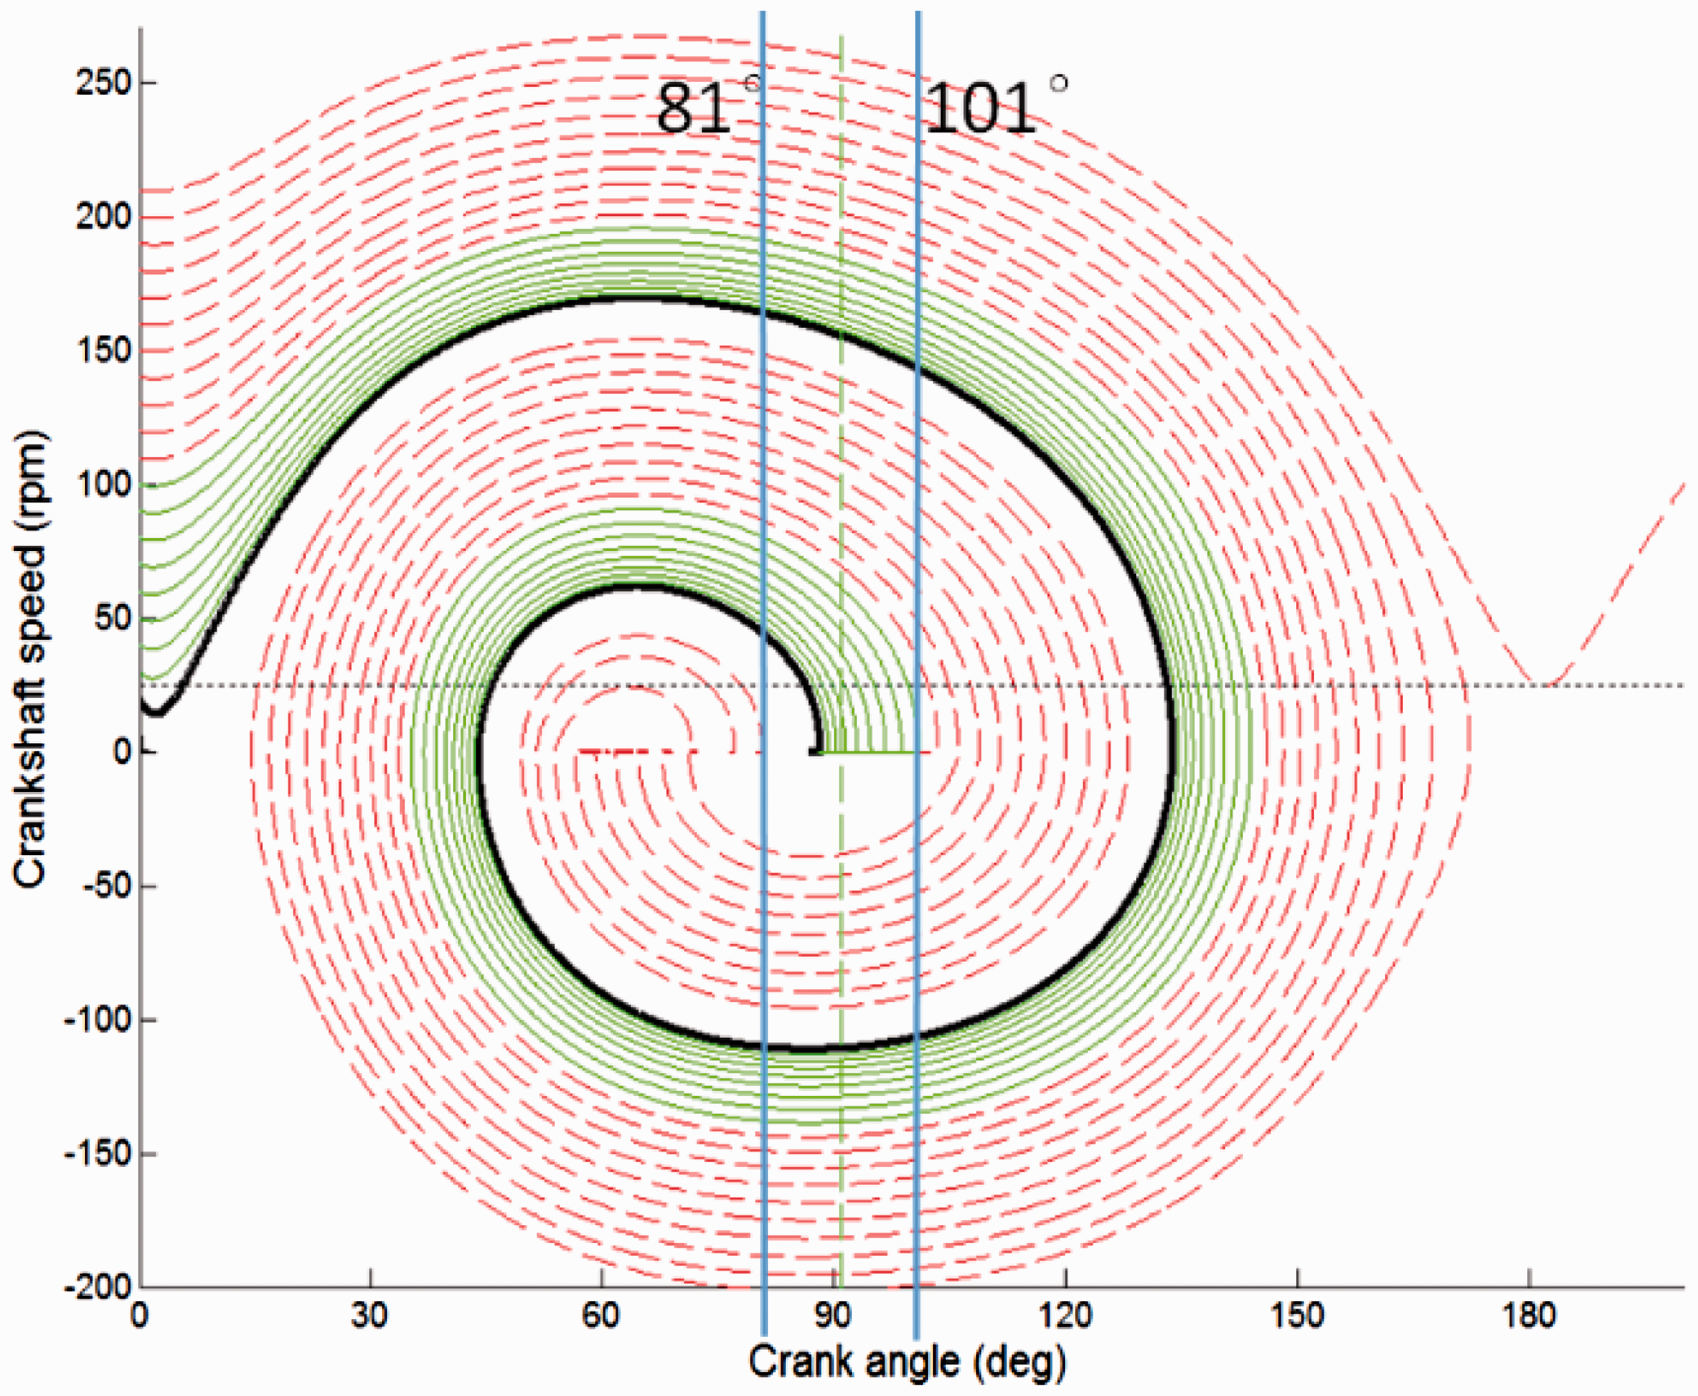
Obviously, the crankshaft speed is critical to its movement during the stop phase. Figure 13 describes the crankshaft movement with a different speed at TDC under the given condition, where the manifold pressure is 0.5 bar and the maximum static friction is 15 Nm. Here, assume that an error ±10° of the optimal ICA is allowed, in other words, the expected stop position is in the range of 81° and 101°. It can be drawn from Figure 13 that:
When the crankshaft speed at TDC is higher than 200 r/min, the crankshaft will not rotate in reverse within the range of 180° and the initial speed for the next rotating circle will be higher than zero with the same rotating direction (shown by the thick, black solid curve). Thus, its movement can be converted to the speed within 200 r/min at TDC in the next rotating circle. The stop position is expected when the crankshaft speed at TDC is within the range from 30 r/min to 100 r/min (shown by the thin, green curve). When the crankshaft speed at TDC is in the range from 110 r/min to 200 r/min, its stop position is not expected (shown by the red, dashed curve). Crankshaft movement with different speed at top dead center (TDC) under the given condition (manifold pressure 0.5 bar and maximum static friction 15 Nm).
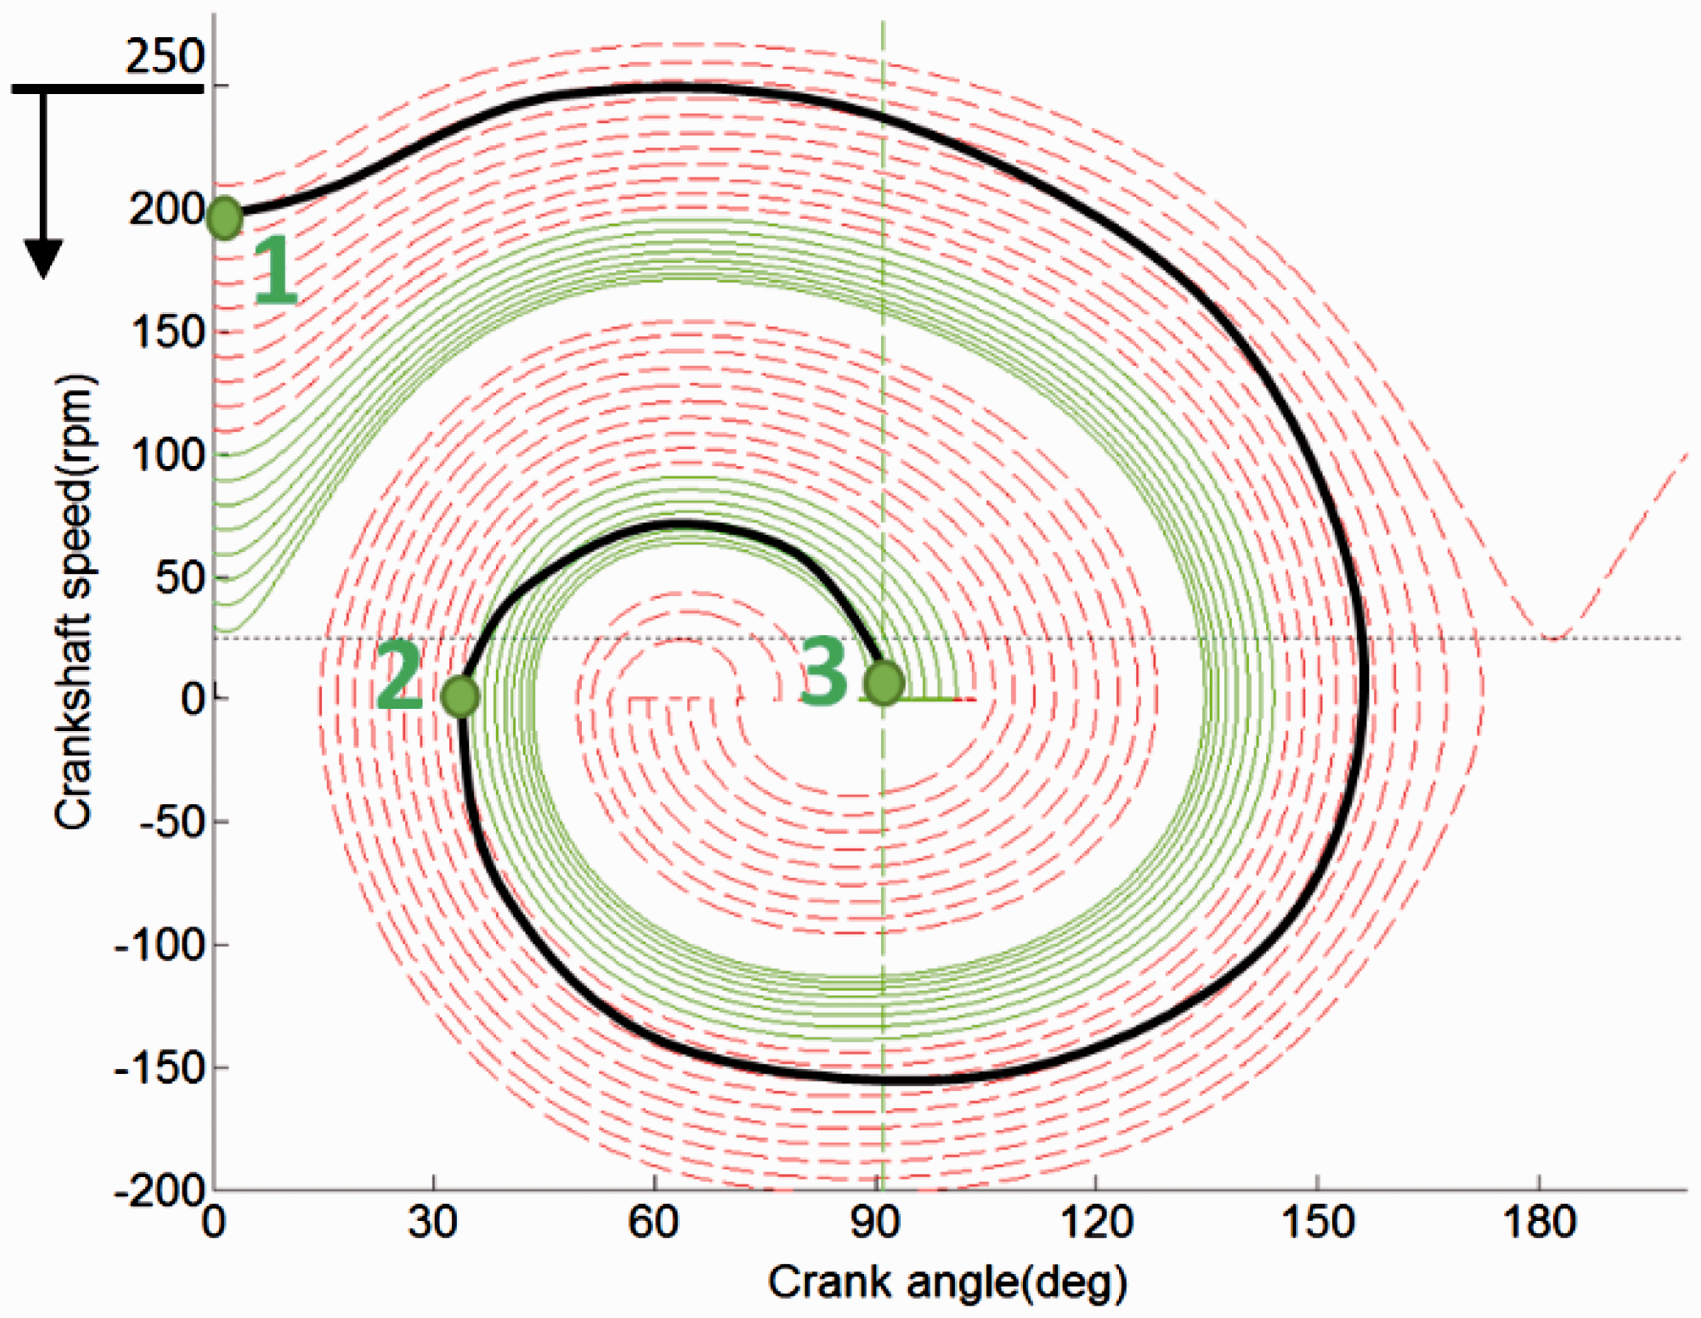
According to the crankshaft movement analyzed above, the target curves during the stop phase are thus designed with the following rules (as shown in Figure 14):
According to the crankshaft movement circle shown in Figure 13, the CSPC threshold should be higher than 200 r/min. However, for the sake of the control reliability, a higher threshold is required to ensure that CSPC can be triggered. Here it is define as 250 r/min. No matter how high the initial crankshaft speed at TDC is, in other words, no matter where point 1 (as shown in Figure 14) is located, the target curves are designed to be gradually closer to the segment from point 1 to point 2 with the initial speed 100 r/min and should intersect point 2 (35.2,0). The target curves, designed to be gradually closer to the segment from point 2 to point 3 with the initial speed 50 r/min, should finally end at point 3 (the optimal stop position).
Schematic of the target curve for crankshaft movement during the stop phase.
According to the design rules presented above, the target curves with various crankshaft speed (50 r/min, 100 r/min, 150 r/min, 200 r/min, and 250 r/min) at TDC are shown respectively in Figure 15(a) (see the thick, blue solid curves). By integration the curves can be transformed to time-domain ones as shown in Figure 15(b). The target curves with other initial speeds at TDC can be obtained by interpolation according to Figure 15(b). Moreover, it is regarded as the one with initial speed 50 r/min when the initial speed is lower than 50 r/min. During the RE stop phase, the crankshaft rotates in the manner of the target curve through the control of the motor to stop in the final expected position.
Target curves of different cranshaft speed at TDC during the stop phase: (a) speed-angle diagram; (b) angle-time diagram.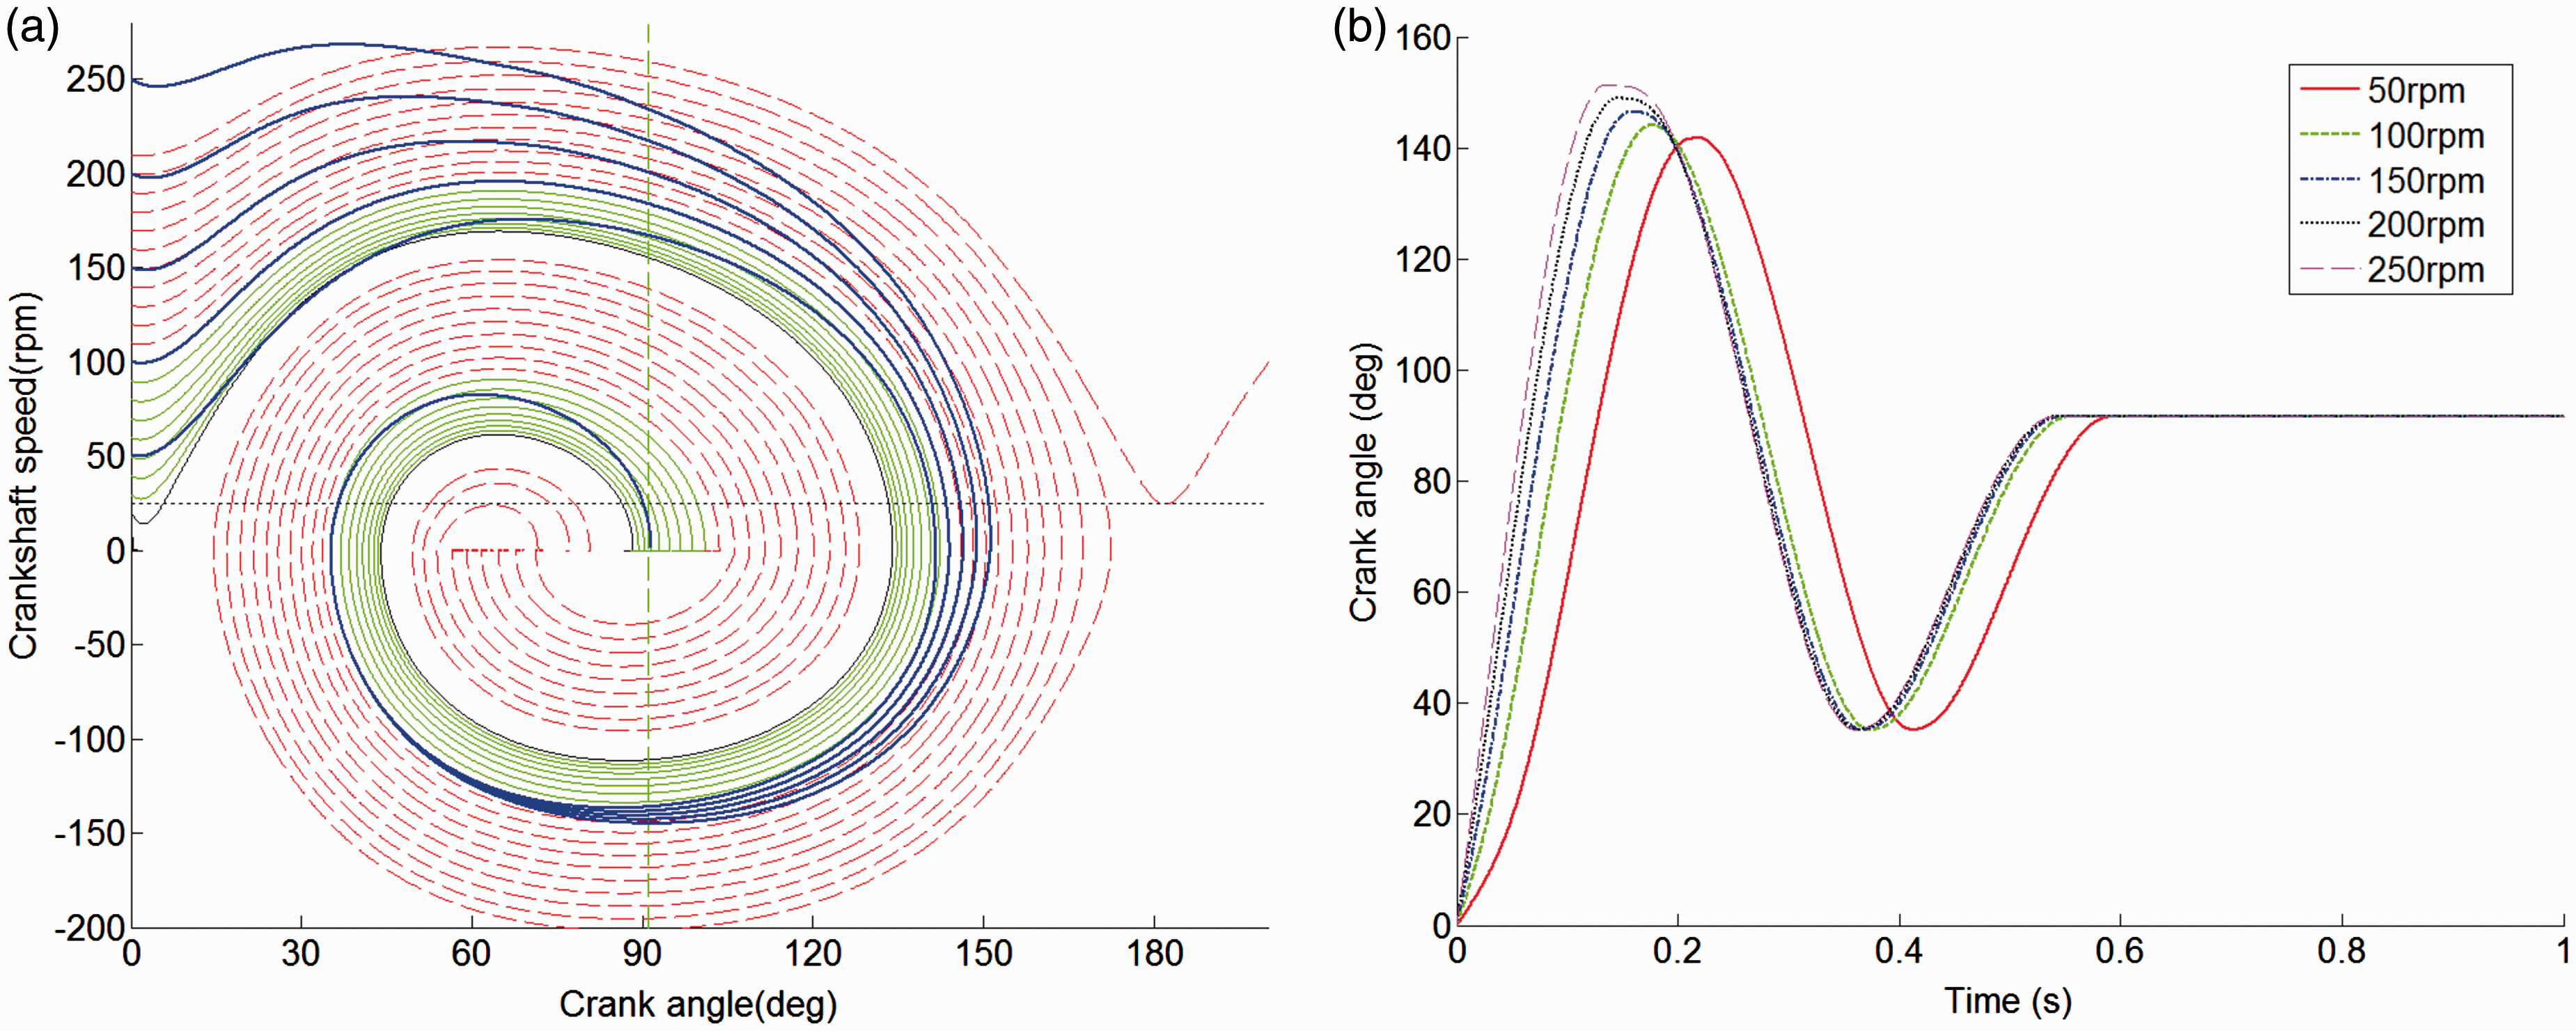
EM-based control design
The crankshaft movement is hard to predict due to the torsional damper between the motor rotor and crankshaft. Through the simulation it is found that the peak-to-peak rotation speed of the damper is barely changed as shown in Figure 16, therefore the crank angle can be regarded as the rotation angle of the motor rotor. CSPC can thus be transferred to the control of the motor rotor to meet the designed target curve of the crankshaft, and the torque transferred from the damper to the rotor can be treated as a disturbance.
Peak-to-peak rotation speed of the damper.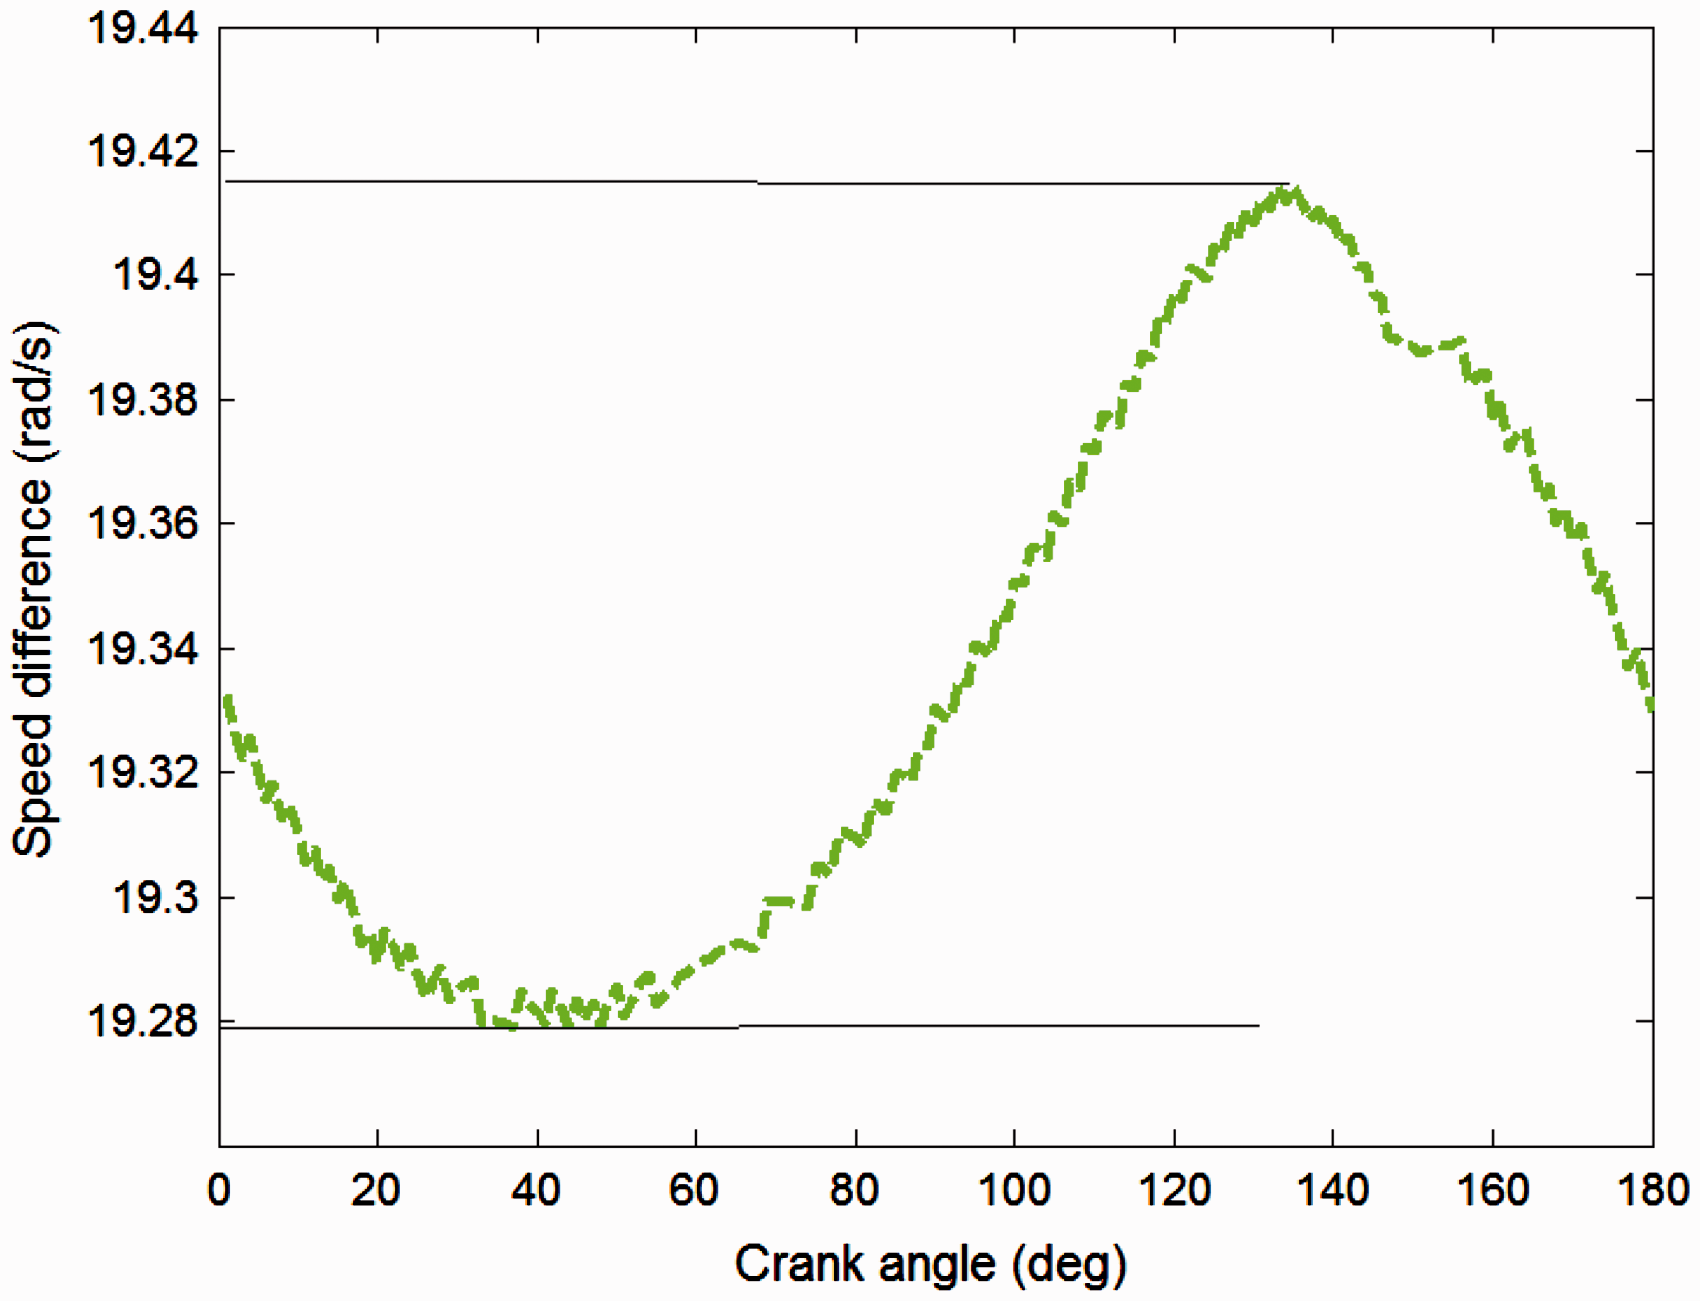
The motor position control can be realized through a cascade control, as shown in Figure 17. The inner loop is the speed control and the outer loop is the position control. The inner loop transfer function is
Block diagram of the cascade control system.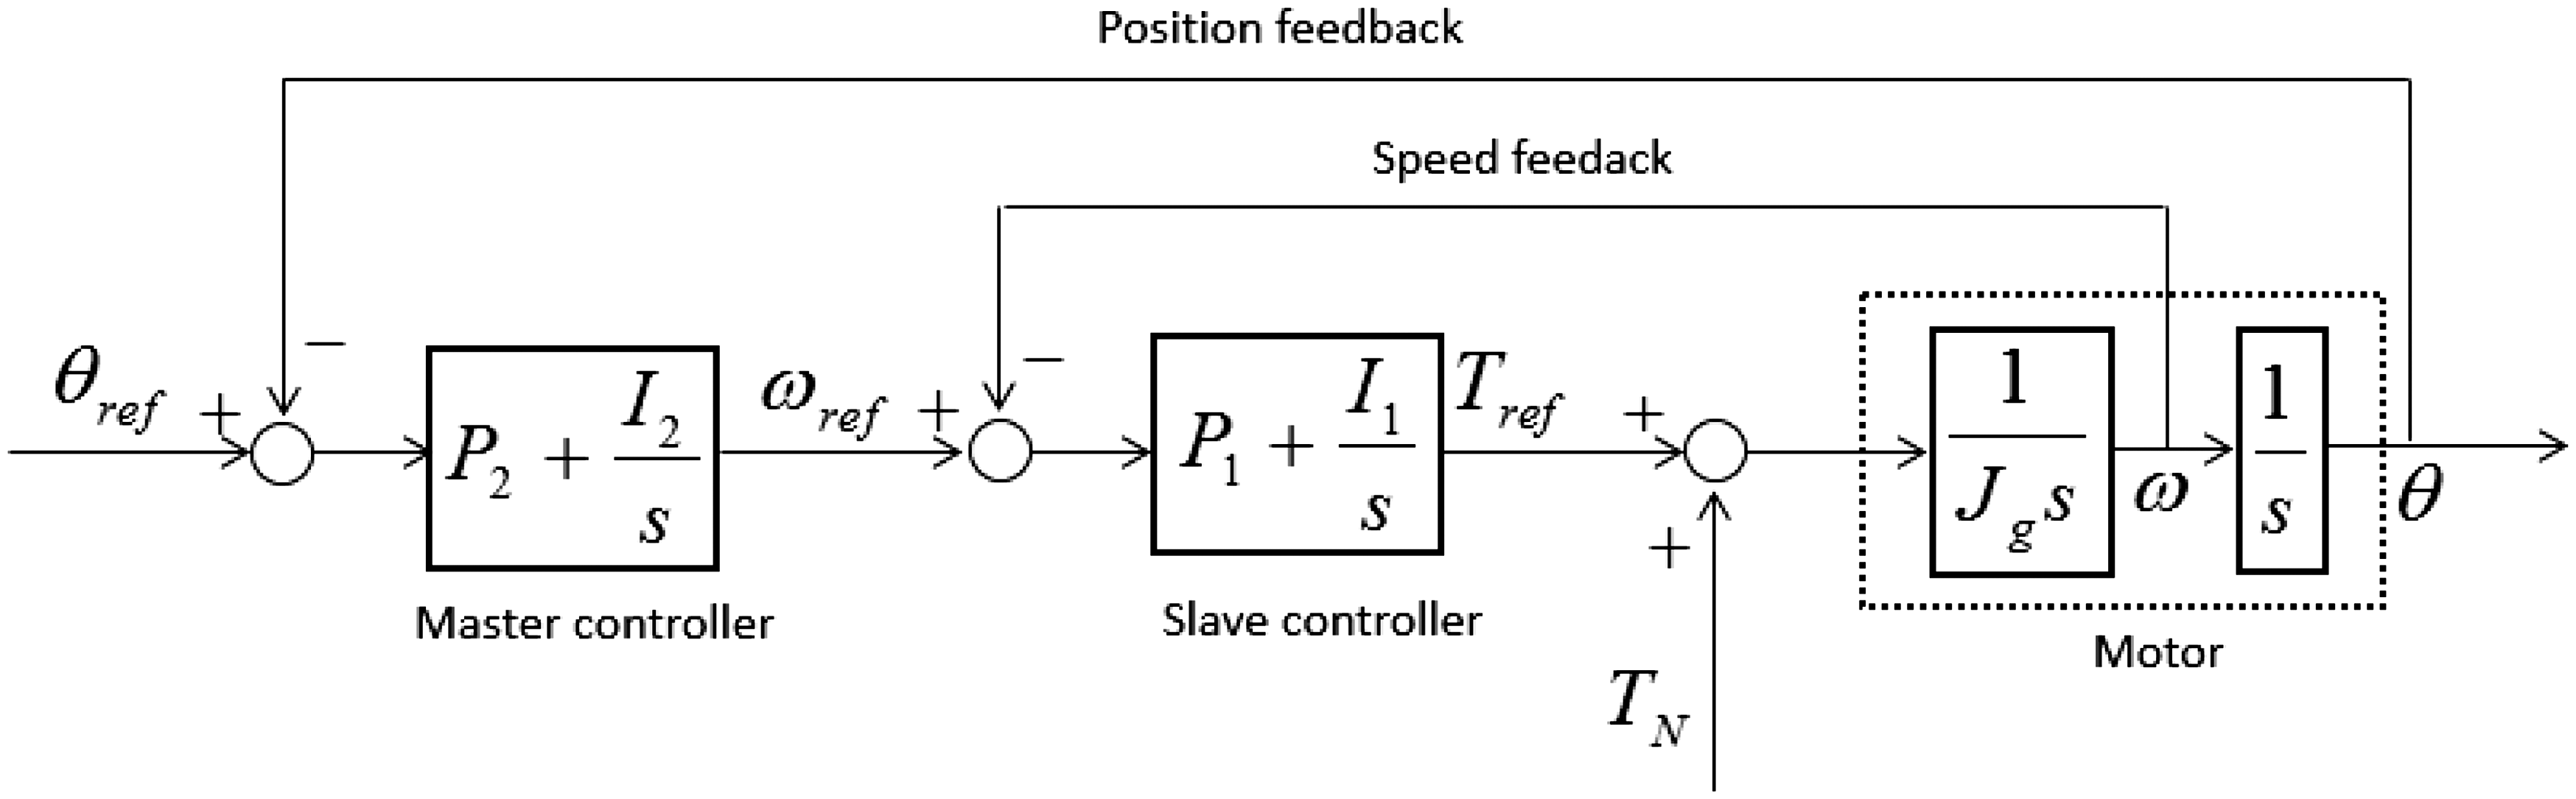

And the outer-loop transfer function for position control is

Here the disturbance TN is the torque transferred from the damper to the motor rotor as shown in Figure 16. The transfer function of the position output to the disturbance TN is

The offset for the cascade control with a unit step change in TN is

Simulation results
In order to evaluate the control effectiveness of CSPC, it is applied in the RE start–stop vibration analysis model built in “Model development” section.
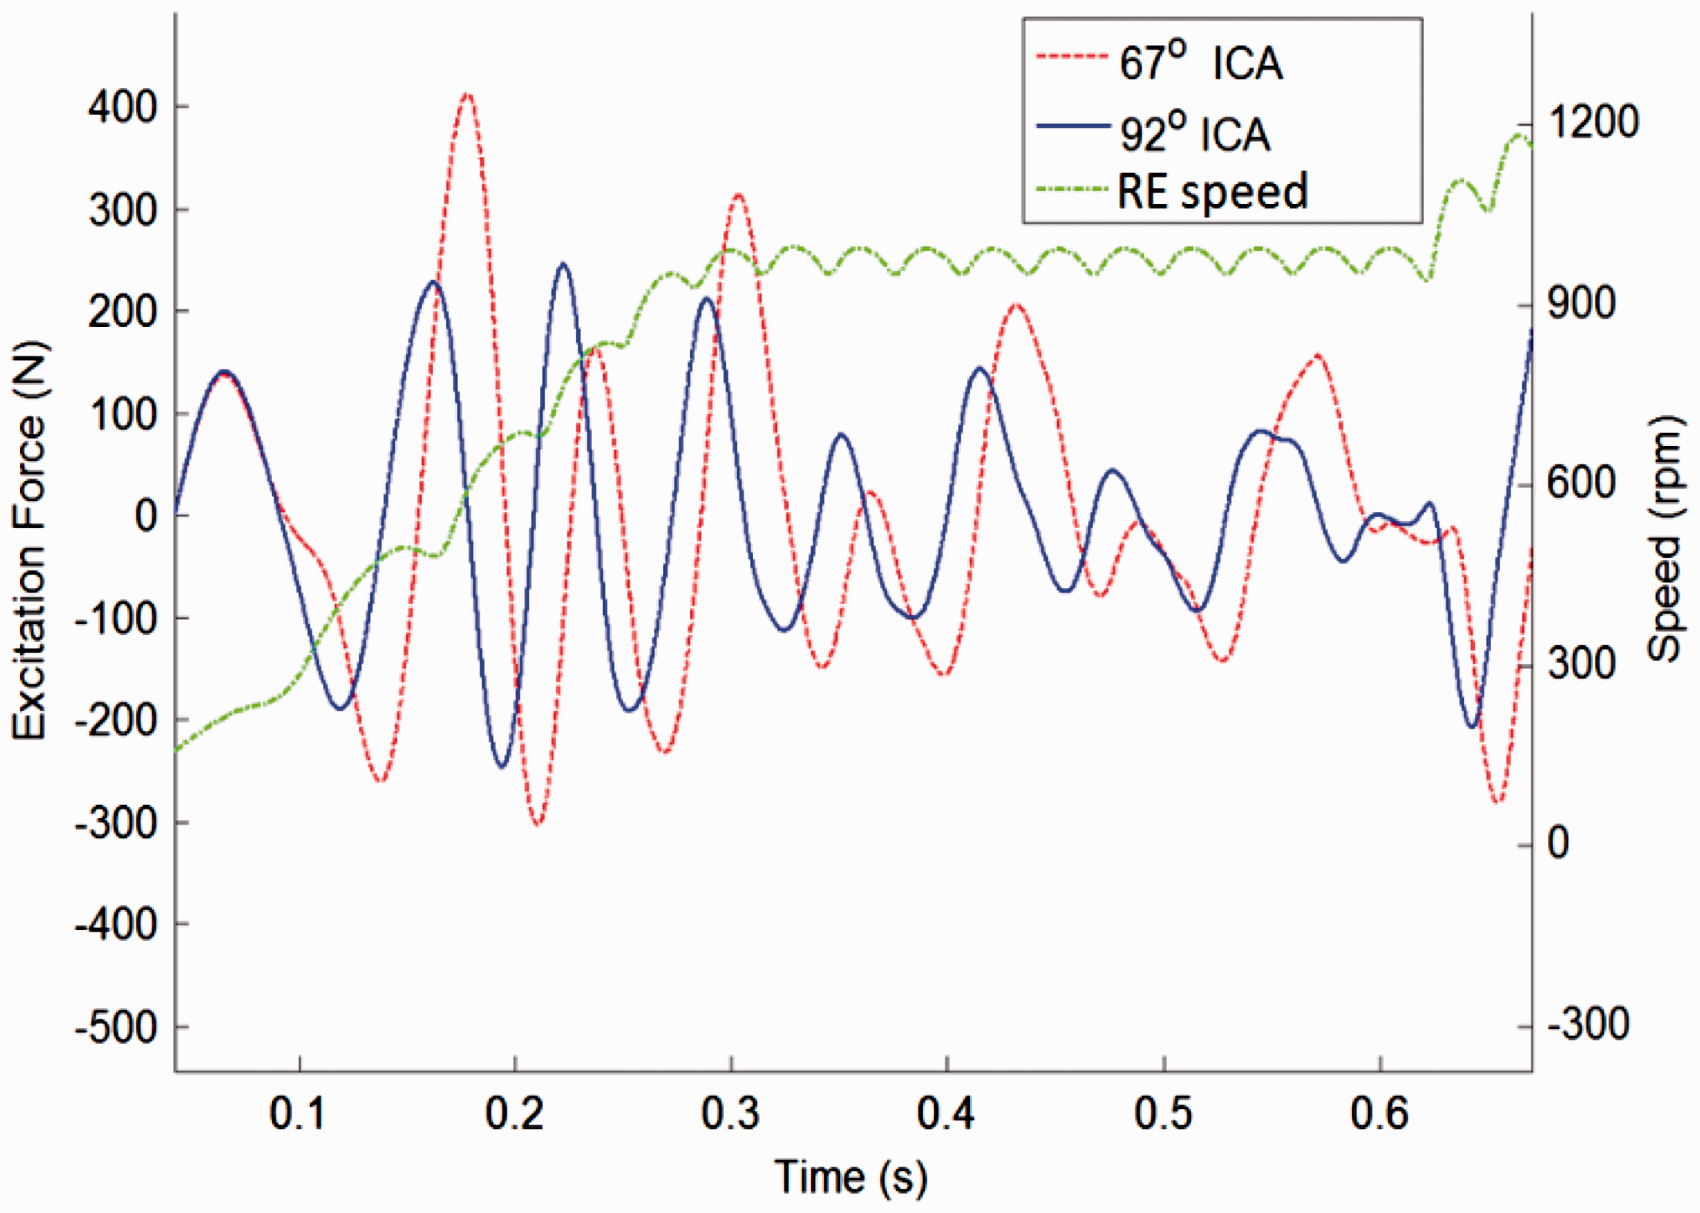
As shown in Figure 18, the crankshaft finally stops at an expected position (92°) when CSPC is implemented. The difference between the target curve and its real movement is mainly caused by the torsional damper between the crankshaft and motor rotor. However, without the control, the crankshaft stops at 67°. Moreover, the peak-to-peak excitation force during the cranking phase in the next RE starting time is decreased by 31.6%, from 711.7 N to 487.0 N (as shown in Figure 19). Therefore the conclusion can be drawn that CSPC can suppress the RE start vibration effectively.
Cranshaft movement during the stop phase. Excitation of the RE block on vehicle body in the x-direction during cranking in the next starting time.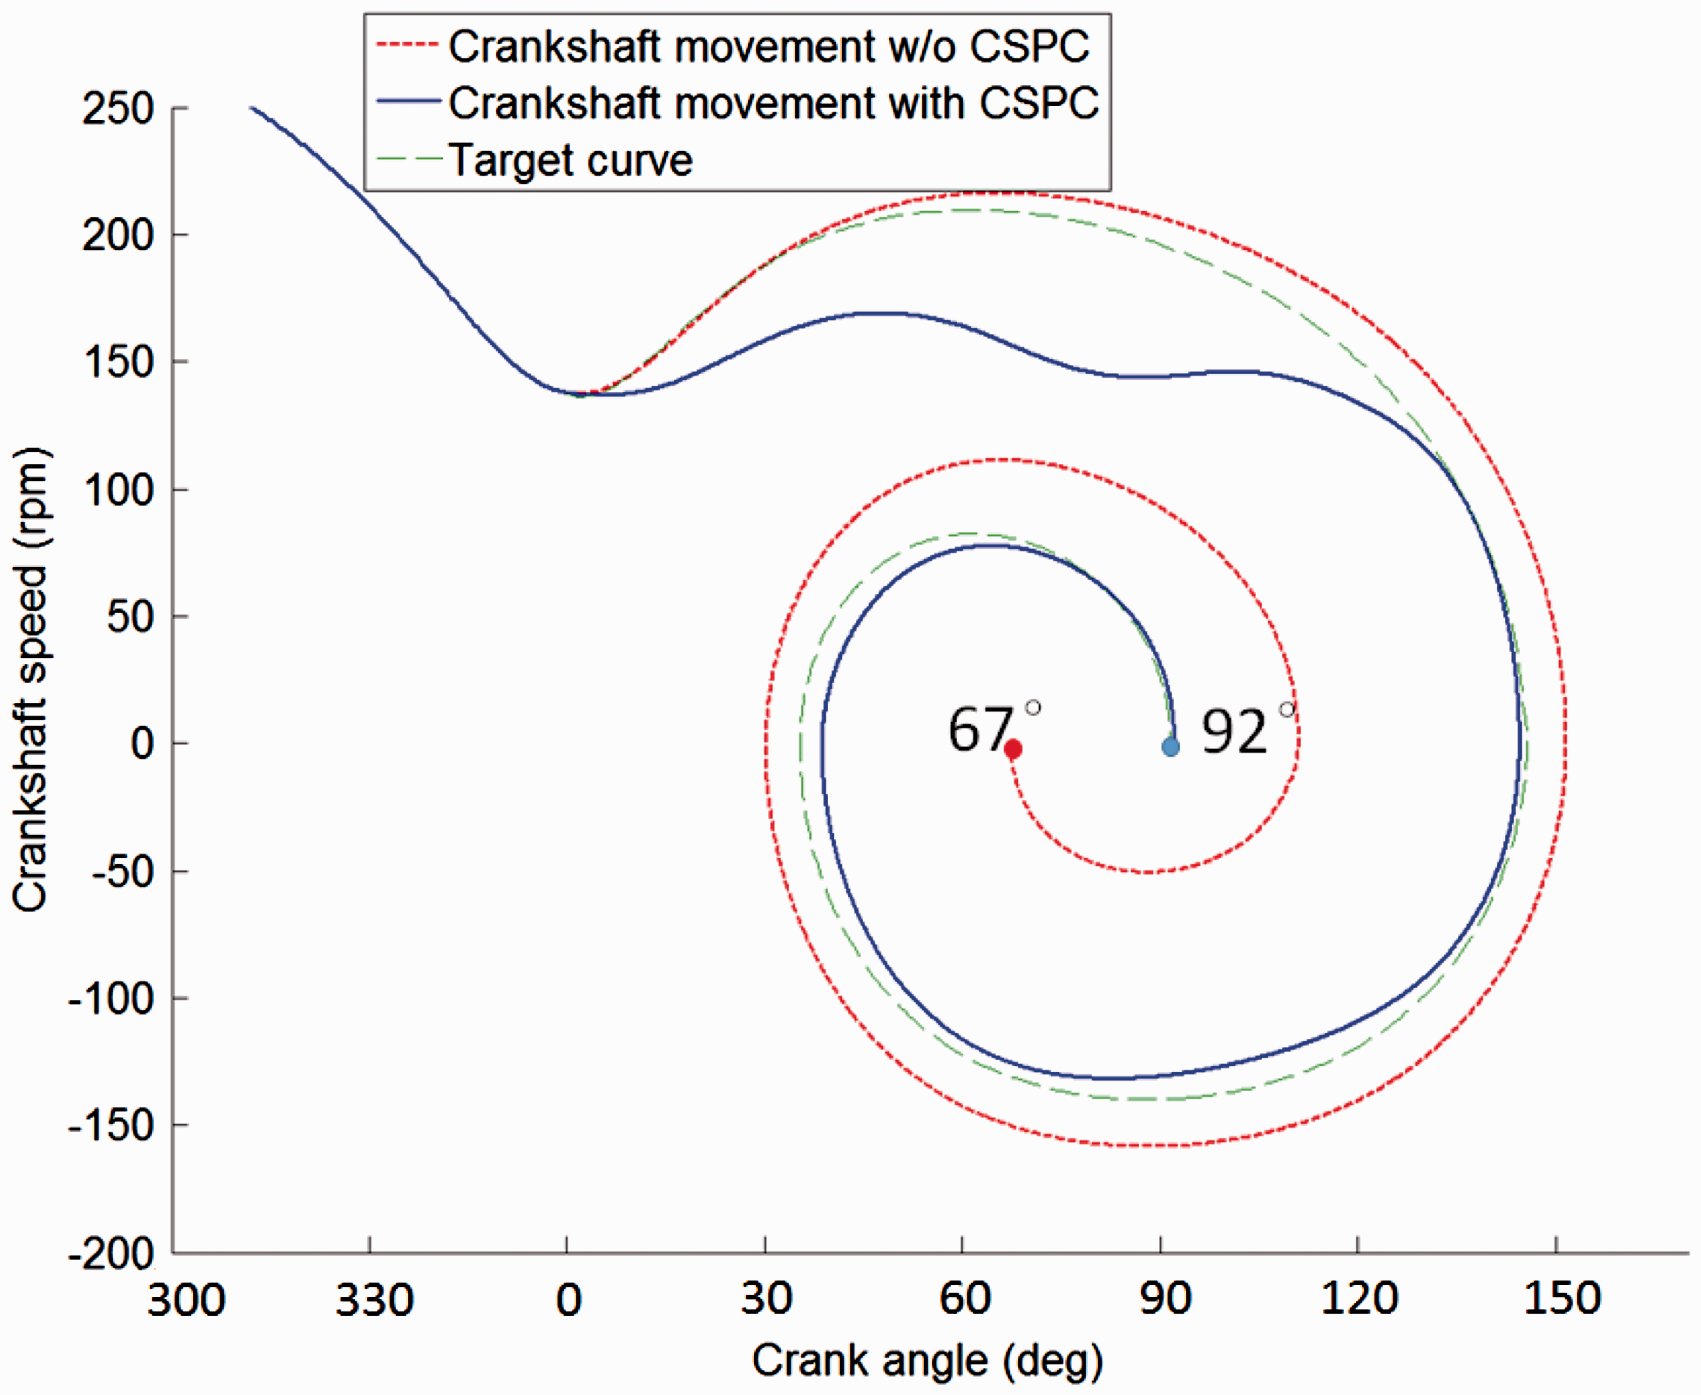
Conclusions
Uneven engine start–stop transitions can cause vibration, which affects car riding quality. Effective control methods are thus essential to customer satisfaction. In this study, an active control strategy, CSPC, is investigated to minimize the mount system vibration during the RE start phase in a ReEV. The key contributions are summarized as:
A theoretical model for RE start–stop vibration analysis is built. The calculation process of GT is simplified where the ICA is considered. By comparison the estimated values after simplification are highly consistent with the ones before simplification. An analysis of the crankshaft stop position is carried out. Through the simulation, the optimal ICA necessary to reach the minimum vibration of the mount system is found and the target curves for the crankshaft movement during the stop phase are designed to achieve the expected stop position. CSPC is applied through a cascade control of the motor to evaluate the control effectiveness. The simulation results demonstrate that with the implement of CSPC, the crankshaft finally stops at the desired ICA to minimize the mount vibration. Furthermore, during the next cranking phase, the peak-to-peak excitation force of RE block on vehicle body in the x-direction is attenuated by more than 30%.
Footnotes
Declaration of conflicting interests
The author(s) declared no potential conflicts of interest with respect to the research, authorship, and/or publication of this article.
Funding
The author(s) received no financial support for the research, authorship, and/or publication of this article.