
Abstract
Noise pollution is considered as one of the effective factors affecting people’s quality of life in urban areas throughout the world. Traffic is a major source of noise in urban areas with wide ranging effects on human. The present study aims to determine the mean of noise levels in old and new urban fabric and their relationship with the traffic flow. Acoustic survey was performed during one week in each month of the summer in assigned stations. In this investigation, using a sound level meter and BS 7445-1-2003, BS 7445-3-1991, Leq10 min was measured and the percentage of highly annoyed people was estimated. The data were analyzed by using statistical tests and SPSS software. The results show that the mean of noise levels measured in all stations during the three months of the summer was higher than the standard limit. The relationship between the mean of noise level and the traffic flow in areas in new fabric was significant but not in those in old fabric. Higher rates of noise pollution in old fabrics and lack of significant relationship with the traffic flow in those points show that noise pollution can be reduced in the city to a great extent by considering effective traffic rules, widening crowded streets, and improving those conditions that govern urbanization. Of course, the amount of the porosity of asphalt, bumpy streets, and even technical defect of motor vehicles should not be ignored.
Introduction
Noise is an important problem that should be paid attention to in relation with public health. High-quality work is one of the main factors in the growth of benefit from labor force which is affected by environmental factors such as noise that, by causing premature tiredness in individuals, will decrease their efficiency and their quality of work. 1 Noise ruins one’s performance and so controlling its effects will be of great importance. 2 Physiological and mental effects of noise on human often appear gradually and, in the long run, directly affect the nerve system and its negative consequences show up. Increase in adrenalin secretion, change in heart beat and blood pressure, 3 headache and migraine, imbalance in the body, digestion disorder, 4 temporary or permanent change in hearing threshold level, 5 and tinnitus 6 are other effects of noise.
The results of a study in Malaysia showed that noise pollution in urban highways can cause disorder in sleep and speech, anxiety, and sometimes damage to hearing. 7 Noise is almost one of the harmful agents for citizenships; therefore, many countries have introduced noise emission limits for vehicles and issued other legislations to reduce road traffic noise. 8 It is a tiring factor and decreases human’s working capacity in jobs that need thinking and precision. In addition, noise influence people’s mental and mood status and causes disorder in their adaptation with workplace and even with family members and society. 9 Study in Varanasi in India showed that the rate of noise has so heightened that has annoyed 85% of the residents. 10 In a study on noise pollution in Valladolid, Spain, it was revealed that 40% of the individuals had sleep disorder and 59% of them markedly suffered from traffic noise. 11 The results of a study in Sweden showed that there were many relations between traffic noise and sleep disorder and daytime drowsiness. 12
Various studies indicate the extension of noise pollution into big cities and the role of traffic in its increase that should be decreased by tremendous planning and controlling pollutant sources. The circumstances of advancement and developments of today’s societies, growth in technology, evolution in industry, mechanized life, population growth, and expansion of cities all together put forward the necessity that the issue of noise pollution should be taken seriously. As noise pollution has less urgent and short-term consequences; it is some how neglected, particularly in Iran. Traffic is a major source of noise in urban areas with wide ranging effects on humans and technical defect of motor vehicles moving along a street can be an effective factor in generating noise pollution. Yearly technical inspection can be a great help in solving this problem. With the increase in the number of vehicles and population, much more people have been affected by the noise from year to year.
So far, investigation has been performed in relation with noise pollution across Birjand city in Iran. Noting the day by day increase in noise pollution and complaint of exposed residents, the present study was conducted with the aim to measure the mean of noise levels in old and new urban fabrics as well as to determine the relationship of those noise levels with the flow of traffic. Also, the percentage of “highly annoyed” (%HA) people was measured.
Materials and methods
In this study, which was performed in two old and new fabrics of Birjand (Iran), an acoustic survey was carried out in eight randomly selected stations. The survey was conducted during one week (four times in daytime and twice at night) in each month of the summer (1 July–21 September 2010). After checking and reviewing the city map, eight streets including stations of Taleghani St., Motahari St., Montazeri St., and Shohada St. in old fabric, and the stations of Jamaran St., Mahallati St., Avini St., and Ghaffari St. in new fabric were selected for this study, according to their applicability (commercial–residential areas). The measurement was taken at four stations separately in both old and new fabrics (i.e.). By using a class 450/490 CEL sound level meter and BS 7445-1-2003 & BS 7445-3-1991 standard method, equivalent noise levels “Leq10 min,” were measured in decibel (dBA). Before taking the measurement, the instrument was calibrated using a 110.1, 110.2 CEL calibrator. To avoid the intervening echoes, the microphone was kept well away from the body, walls, and corners. The measurement was performed in two durations, one from 7:00 am to 22:00 pm for the day average noise level (DL in daily A-weighted equivalent noise level from 07:00 to 22:00), the second procedure was from 22:00 to 7:00 to measure the night average noise level (NL in A-weighted equivalent noise level from 22:00 to 7:00). So the day–night average noise levels (Ldn) were logarithmically measured and calculated using:13,14

Then, the function of day–night average noise level was estimated as %HA among the residents using:
15

The traffic flow in the assigned stations was recorded by tally method by measuring the amount of traffic according to the type of vehicles passing over the imaginary line in a 10-min time interval. This was then extended to 1 h. After performing calculations in Excel, the data were coded and analyzed using the SPSS (version 16.5) software. Also, Geographical Information System (GIS) was used to produce the Ldn, %HA, and traffic flow map zonations.
Results
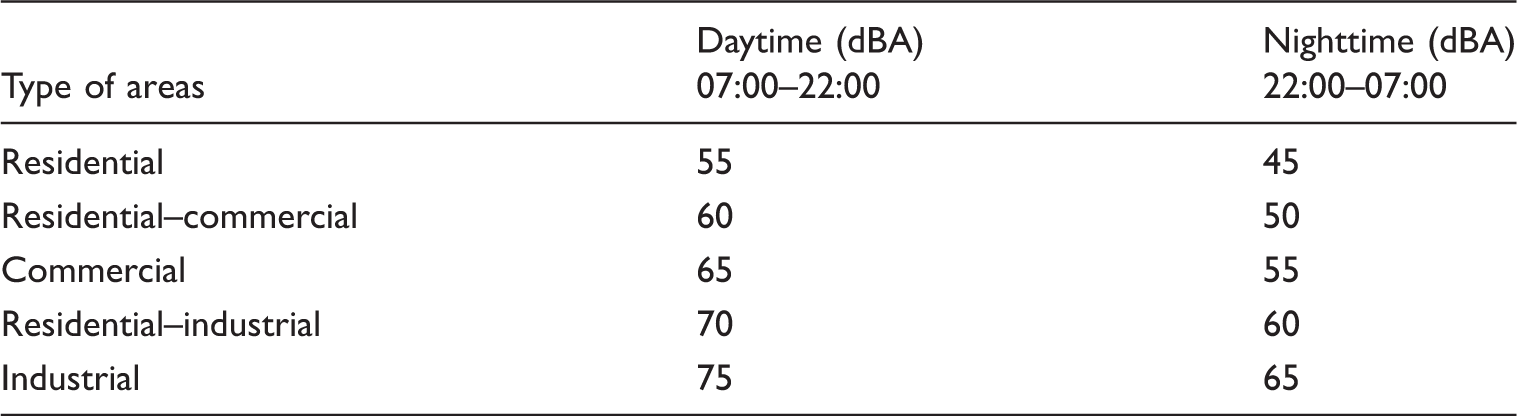
As noted in Figure 1(a), the mean of noise pollution indices was higher than the standard limit in all stations. Table 1 shows the environmental noise exposure standards for free field established by Iranian Government.
16
Enhanced visualization of Ldn (dBA) (a), %HA (b), and traffic flow (veh/h) (c) maps using GIS was shown in Figure 1.
Enhanced visualization of Ldn (dBA). (a) %HA (b) and traffic flow (veh/h) and (c) maps using GIS. Environmental noise exposure standards for free field in Iran.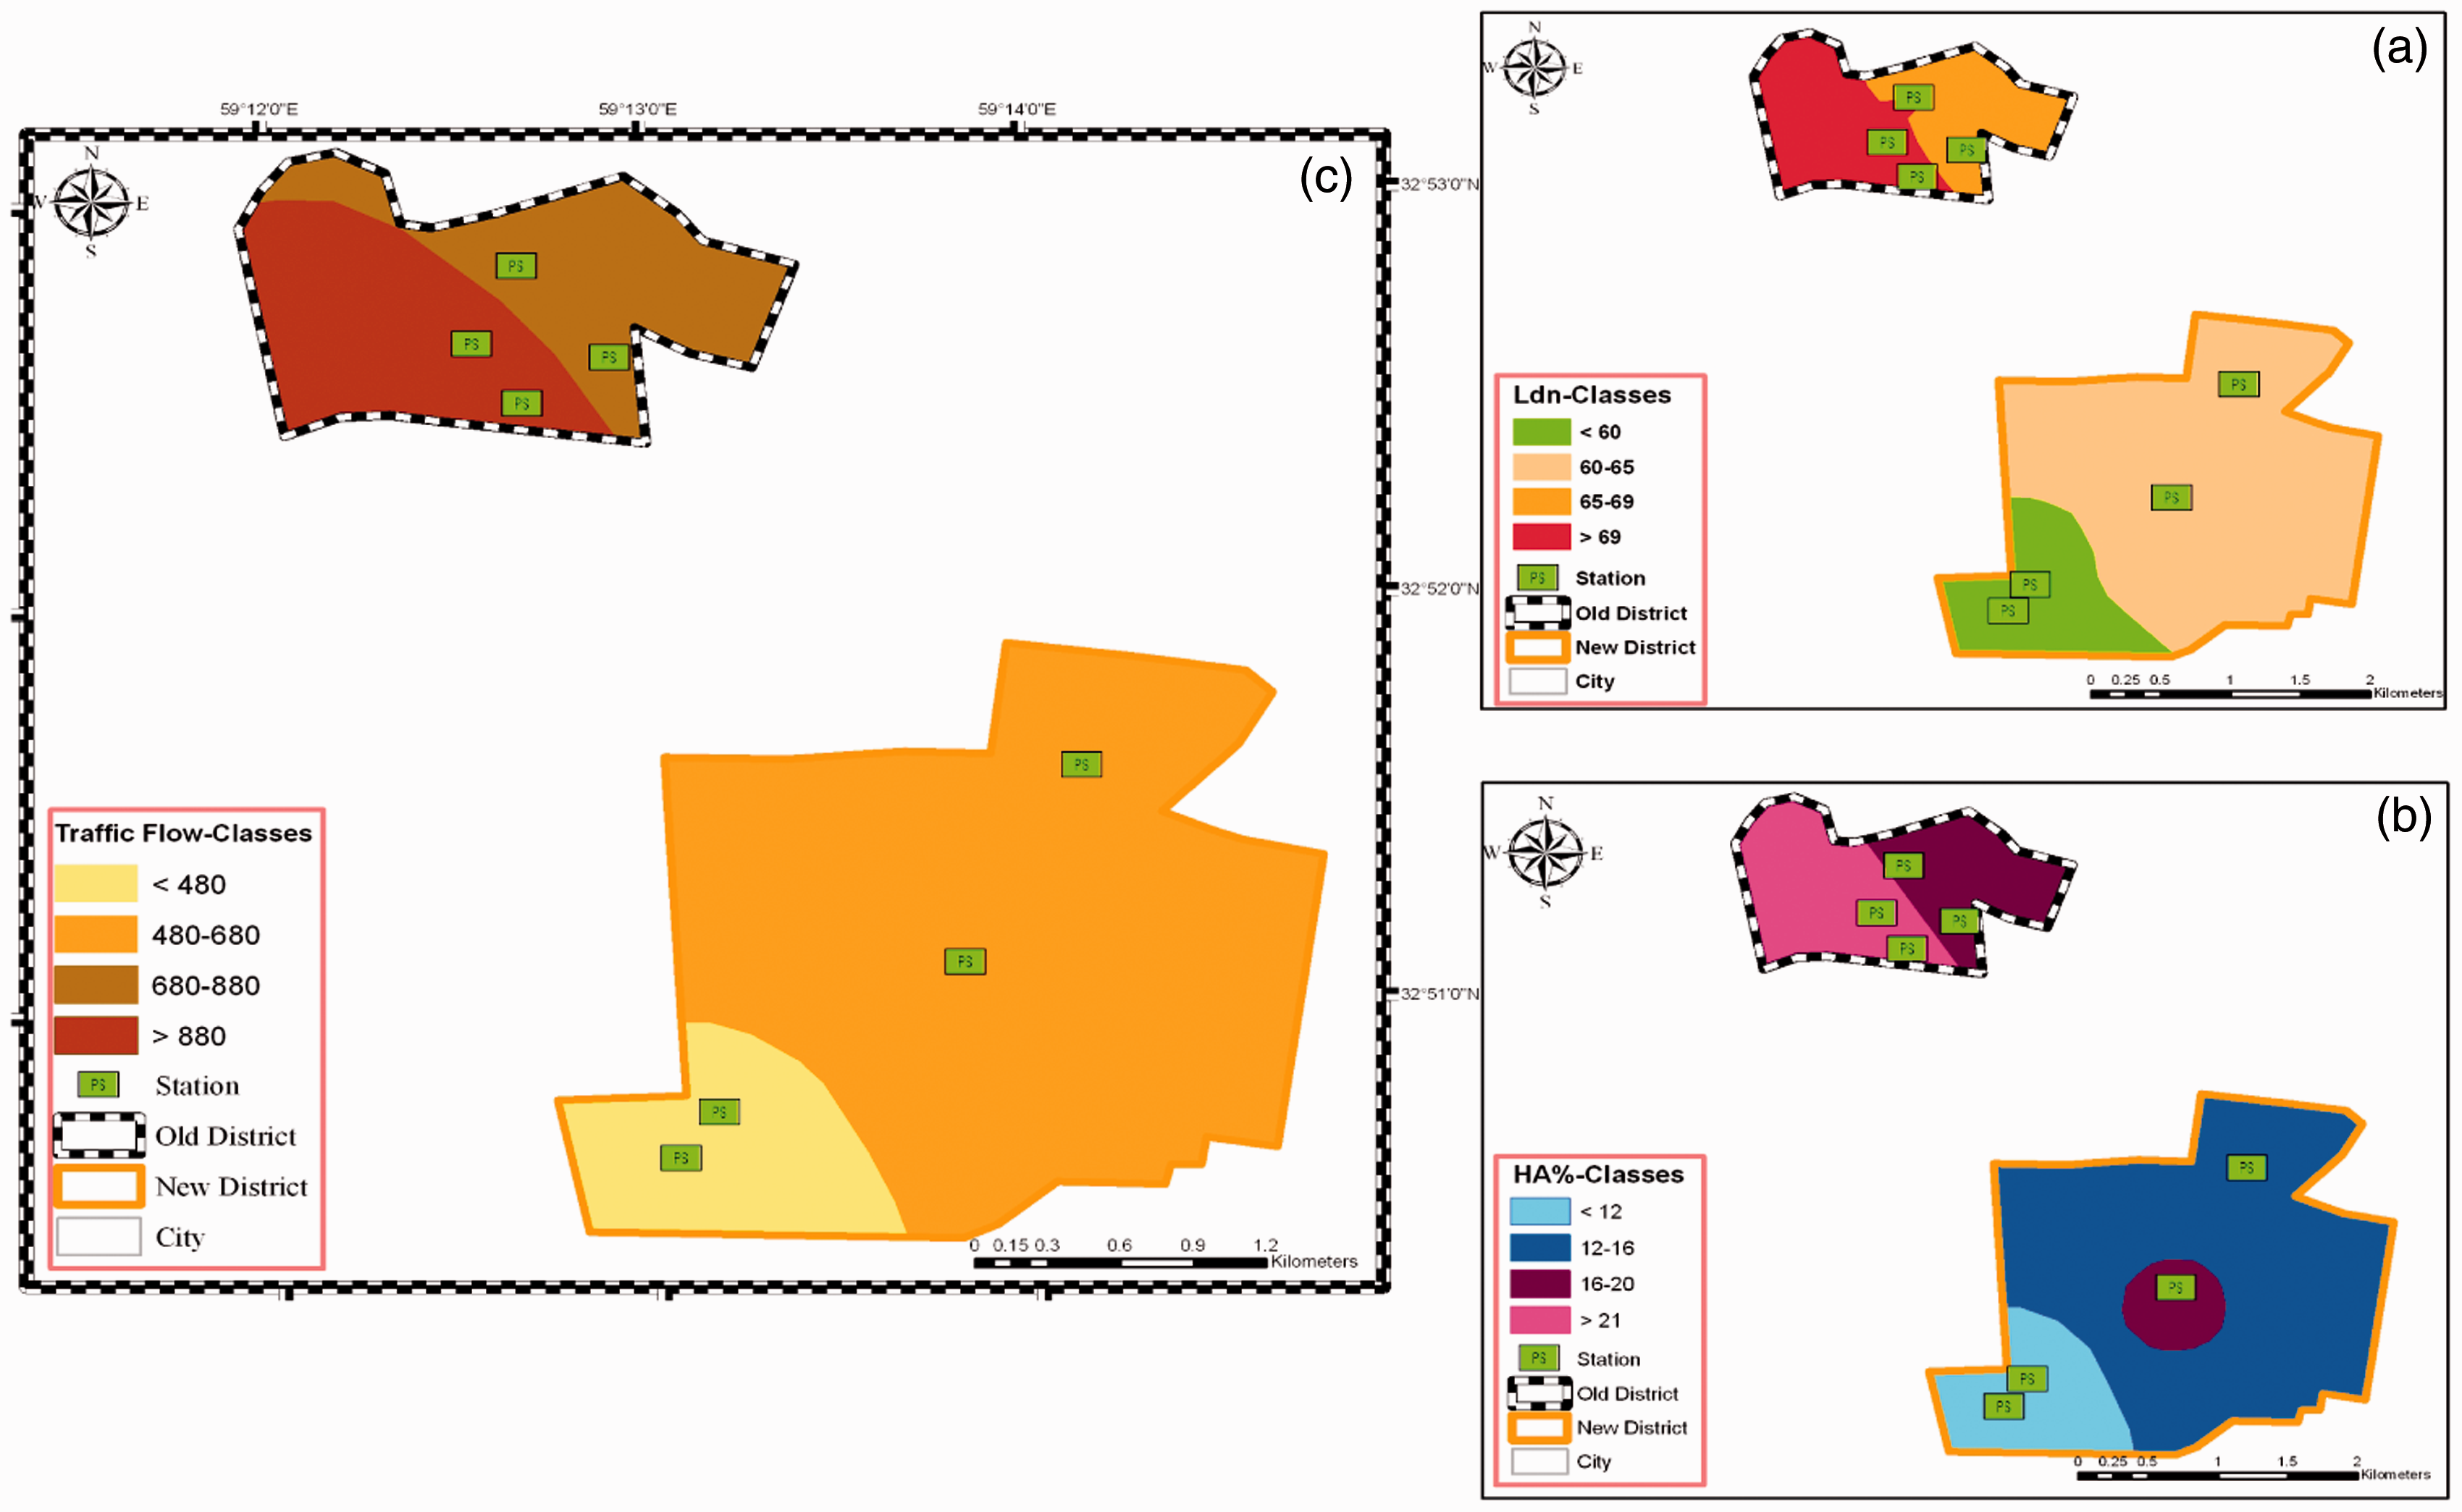
The mean of indices measured in old and new fabrics.
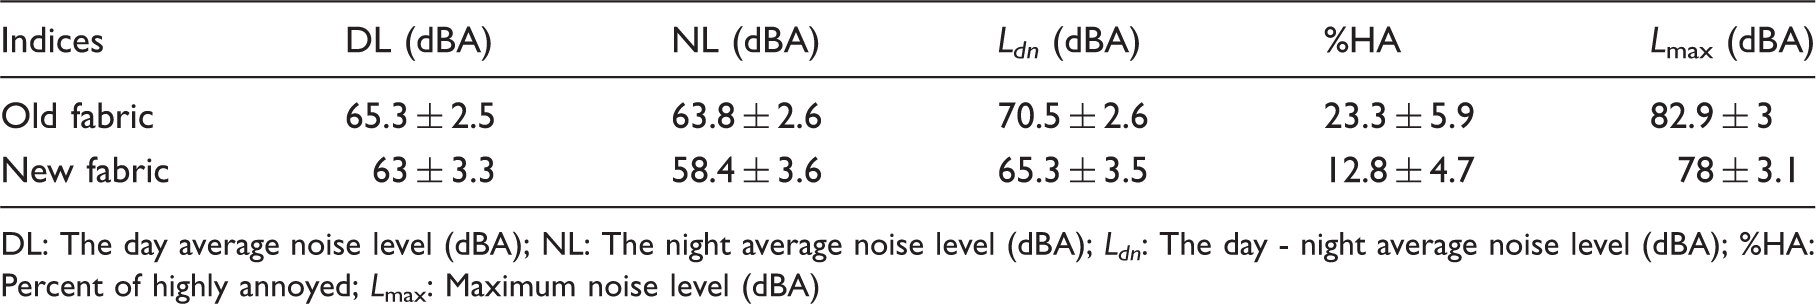
DL: The day average noise level (dBA); NL: The night average noise level (dBA); Ldn: The day - night average noise level (dBA); %HA: Percent of highly annoyed; Lmax: Maximum noise level (dBA)
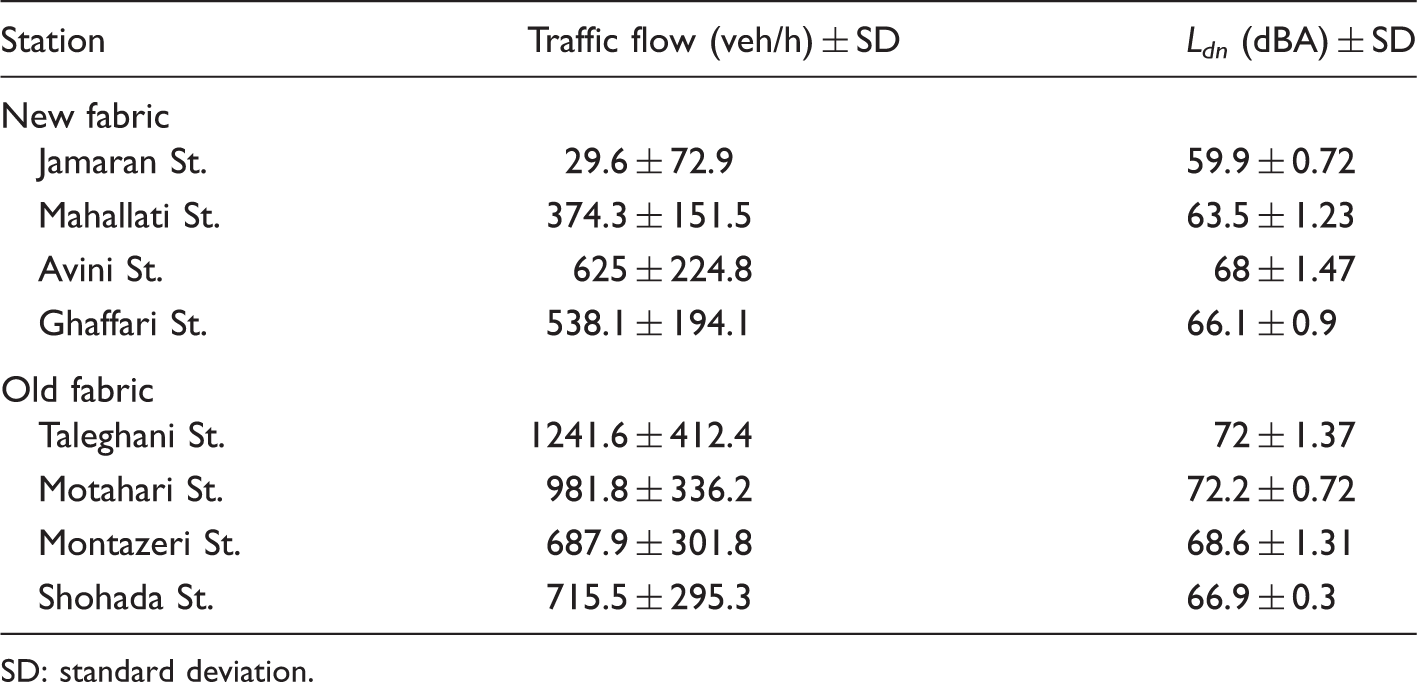
T-test showed that the difference between the mean Ldn (day–night average noise level) in the old and new fabrics was significant (p < 0.05). In this survey, Motahari St. station in the old fabric with 72.2 dBA and Avini St. station in the new fabric with 68 dBA showed the highest Ldn value (Table 3). The assessment of traffic flow, considering types of vehicles in the studied stations showed that the greatest amount of traffic belonged to passenger cars and motorcycles. The traffic flow in Taleghani St. station (with the highest noise level) was higher than other stations (Table 3), and Pearson statistical test also showed that there was a significant relationship between the mean of noise level and flow of traffic in this station with p = 0.04 and r = 0.82, see Figures 1(a), 1(c), and 2.
The correlation between changes in the mean of noise level and traffic flow in Taleghani St. station. Mean statistics of traffic flow and noise pollution in old and new fabrics. SD: standard deviation.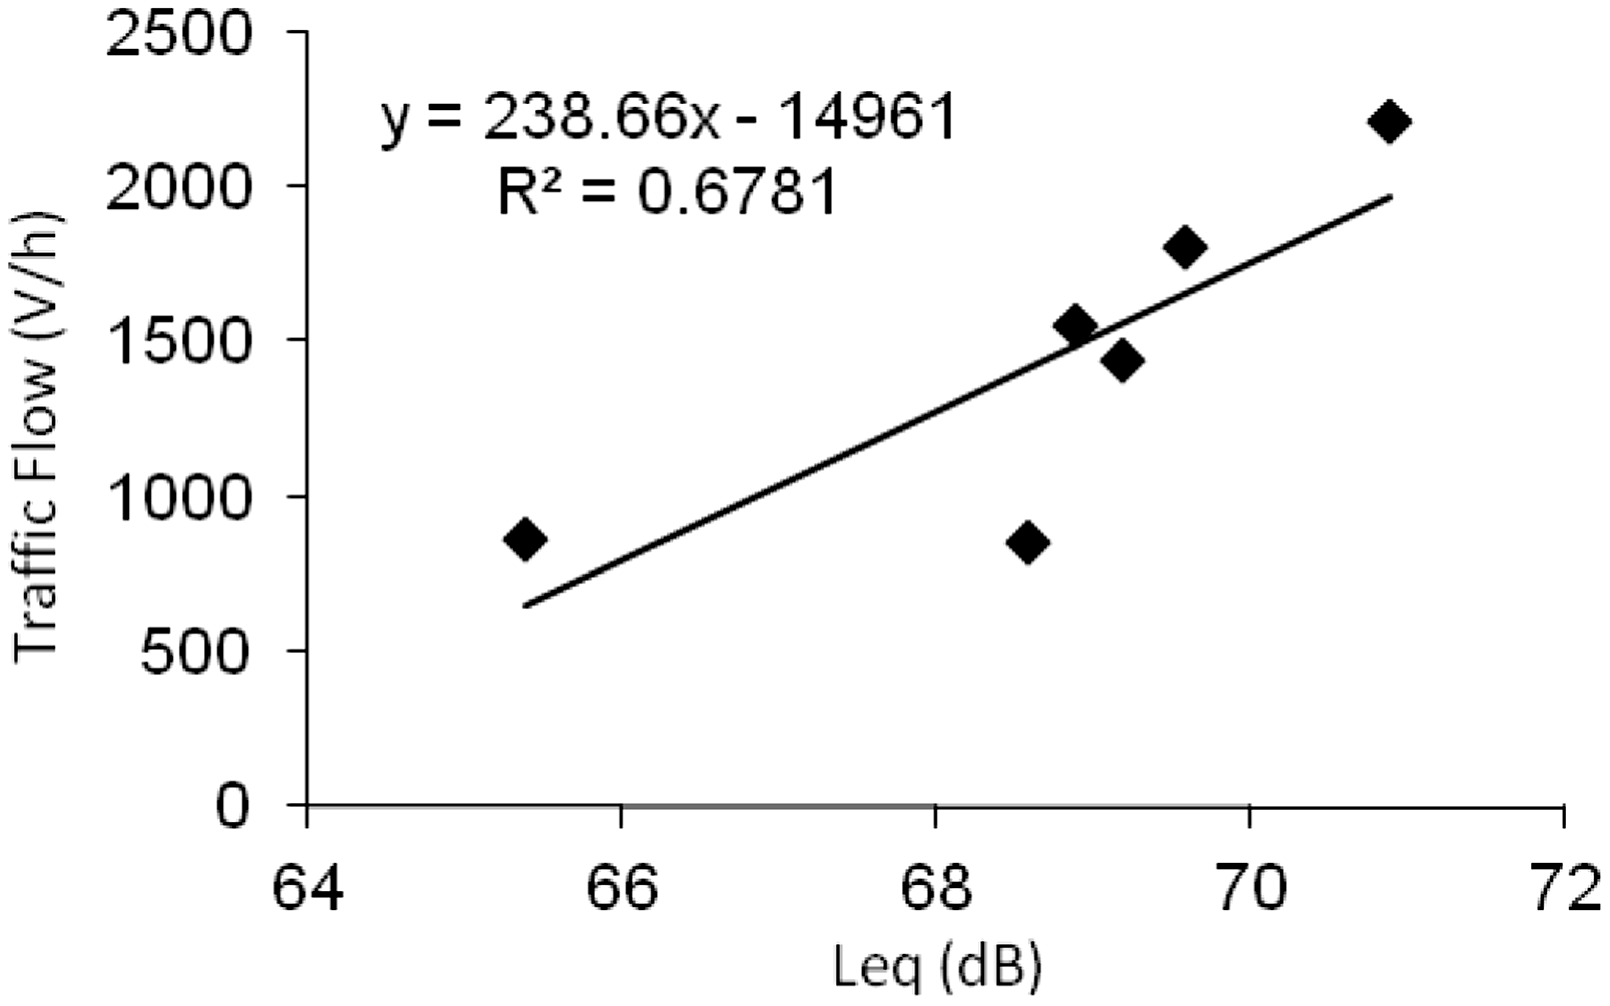
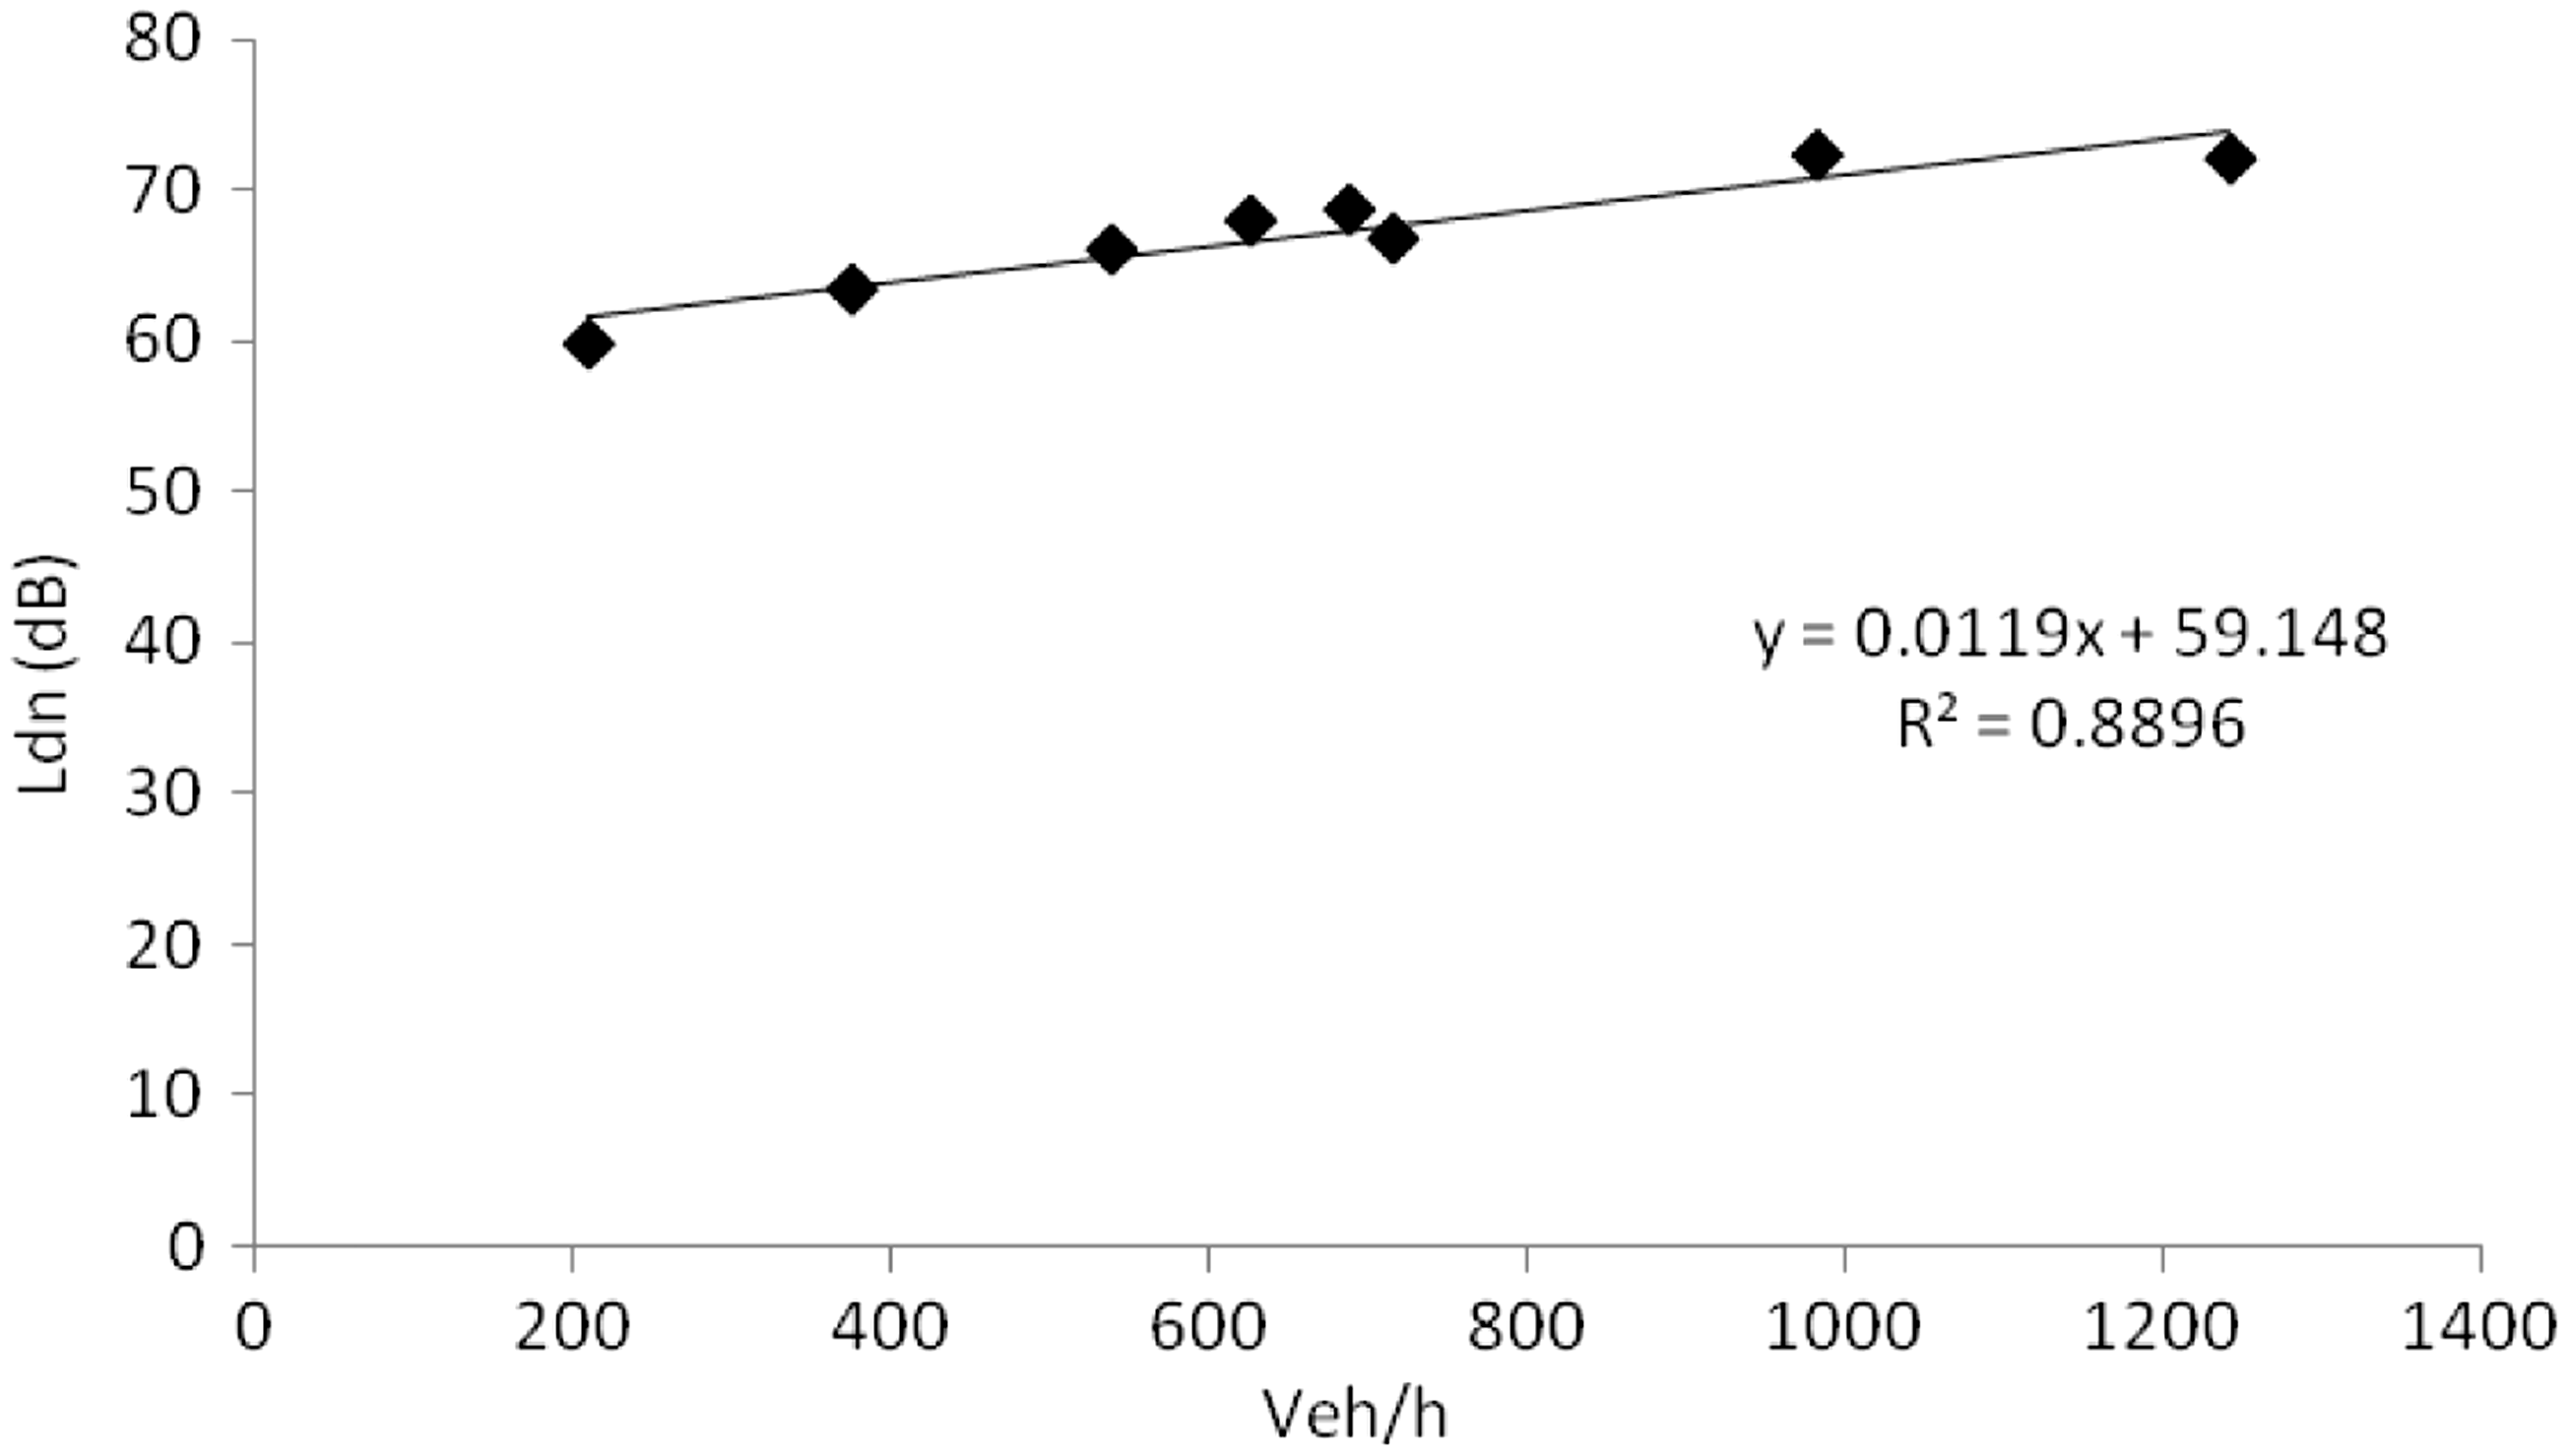
The acoustic survey performed during the three months in all the stations indicated that the highest Ldn value belonged to August, and the lowest to September (Figure 3). In comparing various time measurements, it was revealed that the greatest amount of traffic flow in all stations belonged to early hours of evening (From 7:30 pm to 9:30 pm). The highest mean of noise level also was recorded in this time interval. Also, according to Figure 4, Pearson statistical test showed a significant relationship between the mean Ldn and traffic flow in all stations, with p < 0.001 and r = 0.94. The results of this study thus revealed a significant relationship between %HA and traffic flow.
The mean of Ldn value in old and new fabrics during the three months of summer. The correlation between changes in the mean of Ldn and traffic flow in studied stations.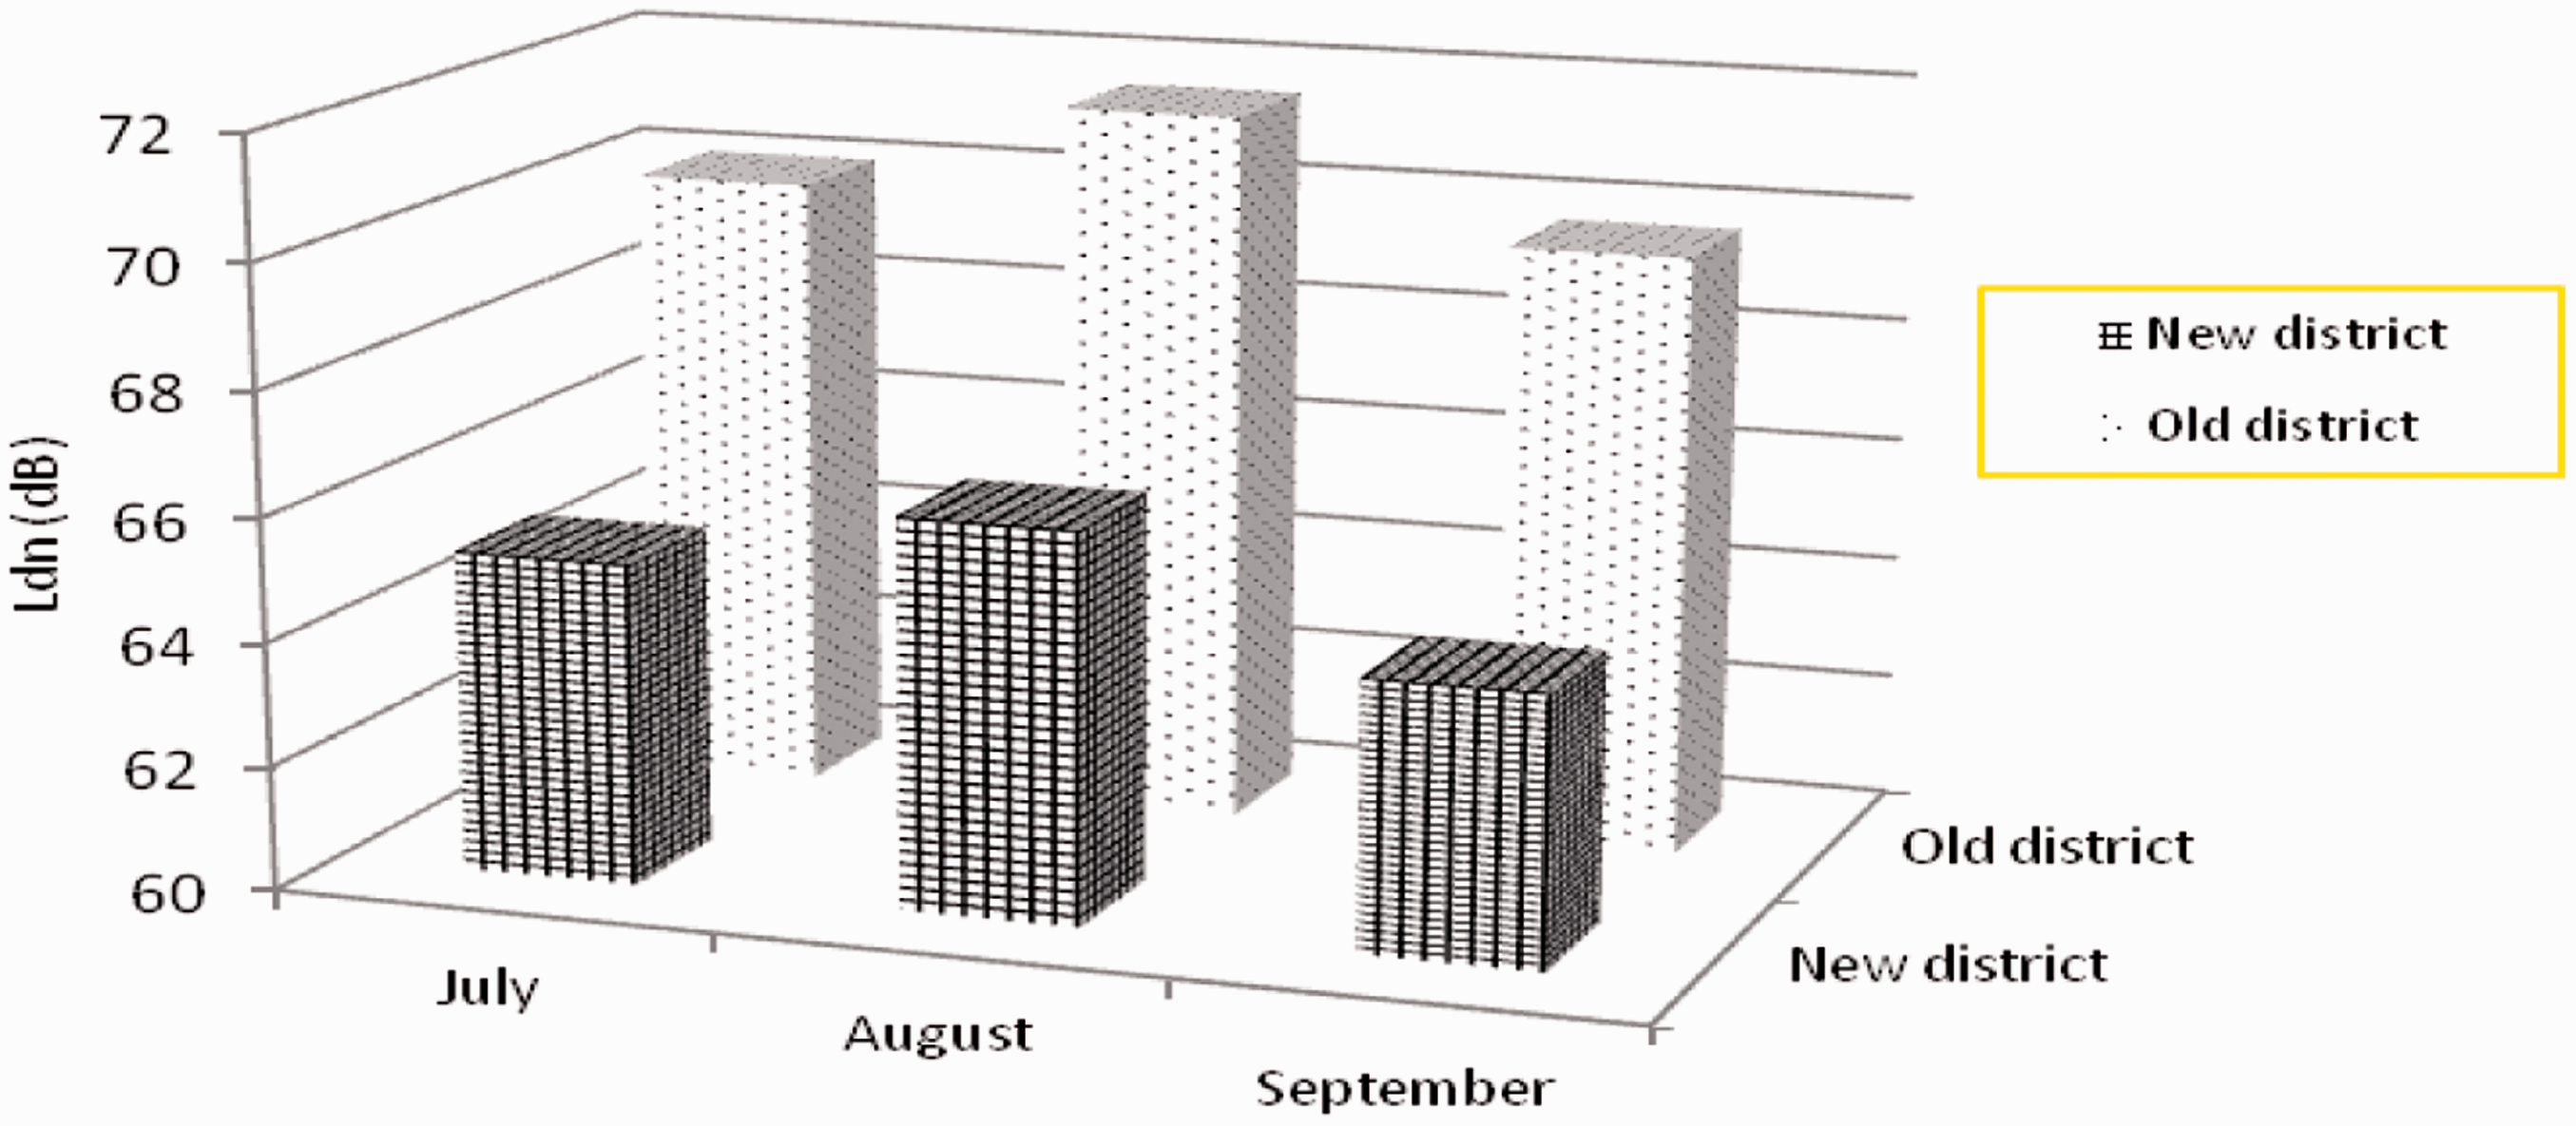
Discussion
According to the measurements of the noise levels and traffic flow, it was determined that the noise levels in Birjand are more than the acceptable standard levels. Although the noise pollution seems to be the problem of big cities, it is in the first rows among the environmental problems of the newly developing cities, such as Birjand. In other similar studies conducted in other cities of Iran, the sound pollution levels were above standard limits. Golmohammadi et al., 17 in their study in Hamadan, Iran, conducted that the mean noise level was 69.04 dBA. According to the results of the study by Alizadeh et al., 18 in Sari, Iran, the mean of noise level in daytime was 75.5 dB, indicating that the obtained noise level was higher than standard. In a study Jafari et al. 19 in Isfahan, observed that, in most cases, noise level was higher than “Environmental Protection Agency” (EPA) standard. Matlabi Kashani et al. 2 in their study in Kashan performed from 08:00 to 12:00 and 16:00 to 20:00 showed that the noise level across the city had been higher than the standard rate. In the studies by Li et al., 20 Brown and Bullen et al., 21 and Ali, 13 the mean noise levels were above standard acceptable levels. In another study in the city of Messina, Italy, noise level in the city were 75 dBA, and more than 25% of the residents were distressed because of traffic noise pollution. 22
According to the results of the study by Abbaspour et al., 8 in Hamadan, Iran, the results indicated that the Leq in the studied roads were exceeding the allowable levels of urban noise pollution and there was a meaningful deviation between equivalent levels during a 24-h period, traffic load, and various vehicle speeds. In a study by in Sanandaj, Iran, they observed that the highest mean value of LAeq (15 min) was recorded as 74.05 dBA. It was found that minibus-vans and truck-buses were mainly responsible for producing traffic noise in these roads. 23
In the present study, the day–night average noise level in the old fabric was higher than that in the new fabric. The highest noise level was observed in Motahari St. in the old fabric and the highest %HA was also recorded in that area. In the study by Abolhasannejad et al. 24 in Birjand, Iran, the results indicated that the rate of noise annoyance in the old fabric was higher than that of the new fabric. Investigations showed that the streets in the old fabrics had slender width than those in the new fabric. Motahari St. being narrow and two ways had a great volume of traffic in some hours of day and night. Moving direction from south to north in this street, using low gear and louder sound of vehicle’s engine have caused increase in noise level.
On the other hand, fast moving of motor vehicles from north to south because of the gradient of the street has caused decrease in the sound of engine and increase in the sound of vehicle’s tire. However, in spite of this fact, other factors such as defect in sewage trapdoors, rough surface of asphalt pavement, and potholes 25 probably have caused increase in noise pollution in this area, in addition to pine trees with needle reflections. Pine trees are the only covering in Motahari St. According to the results of the study by Ozer, Akif Irmak, and Yilmaz, the reduction by pine trees can be observed year round since they are evergreens. Although the pine trees reduced noise, they did not reduce the value to the target acceptable level. 26 This street, because of its business situation leads to shopping centers as well as long length and lack of main branches leading to it has been the cause of increased traffic flow. In this survey, the largest traffic flow belonged to Taleghani St. in the old fabric and that is justifiable because most of the clinics and treatment centers are located in that area.
The results show that in the old fabric, in all the stations, increase in traffic flow has not led to increase in noise level and no relationship between them has been observed, while the highest noise levels are recorded in this station with great traffic flow. So, this result shows the effect of other environmental factors in increase on noise pollution; these environmental factors include the quality of asphalt, green spaces, types of buildings and their applicability (mostly commercial in the old fabric), and unnecessary use of horn while driving. In the study by Nassiri et al., 27 it is concluded that the vehicle horn noise may be responsible for the considerable difference between equivalent sound pressure and maximum sound pressure levels.
Steenberg 28 in his study has named agedness as an effective factor in the noise of traffic. Various studies have shown that such a result is predictable due to population growth and day by day increase in production of heavy and light motor vehicles. In the present study, measurements in stations in the new fabric showed a direct relationship between noise level and traffic flow. As stated above, in these stations, less noise pollution than the old fabric has been reported indicating different conditions in both fabrics. Regarding the residential applicability of the new fabric with extended green spaces and wider streets, one can consider the sound of tires of motor vehicles with high speed as the most important source of noise pollution. Of course, the amount of the porosity of asphalt, bumpy streets, and even technical defect of motor vehicles should not be ignored. The standard asphalt and concrete surfaces may have reflected both of tire and engine noise, rather than absorbing it. Reduction of noise with plants when sufficient area is provided in the urban ecosystems is of great importance, but is not an advantage for the cities like Birjand, where relatively limited number of plant species can grow due to the hard climatic features.
Generally, regarding the strong relationship between mean of noise level and the %HA with traffic flow over the city, it can be claimed that noise pollution in this city has a tight relationship with traffic factors in the studied areas. Therefore, it is recommended that by considering effective traffic rules, widening crowded streets, and improving those conditions that govern urbanization, noise pollution can be reduced in the city to a great extent.
Footnotes
Acknowledgements
The authors would like to thank the officials and those dear ones who provided their best cooperation in the project.
Declaration of conflicting interests
The author(s) declared no potential conflicts of interest with respect to the research, authorship, and/or publication of this article.
Funding
This study was conducted in the framework of plan No.368 (Ir.bums.1394.321) with the financial support of research deputy of Birjand University of Medical Sciences.