
Abstract
Noise pollution is a growing concern of majority of people around the world. Accordingly, the present study was carried out to analyze, for the first time, traffic noise indices and to introduce an optimal noise index for road traffic noise. For this purpose, the District 14 of Tehran Metropolitan City was selected as a case study wherein a total number of 91 stations were selected so as to cover noise susceptible areas. The measurements were performed at three occasions of morning, noon, and evening. In order to estimate the traffic noise index, noise pollution level, and noise impact index, the L10, L50, and L90, were recorded at each station with 40 replicates. According to the obtained results, among different land uses in the study area, the maximum and minimum traffic noise index values of 113.7 dBA and 50.1 dBA were reported from educational land use. The highest noise pollution level of 96.8 dBA was measured at the educational land use while the lowest noise pollution level of 65 dBA was recorded at the medical land use. The noise impact index value was estimated at 1.5 for the entire region indicating noise level is much higher than the acceptable threshold for residents. Overall, noise pollution level would be a better index when the objective is to measure the overall noise pollution condition in the study area, whereas it gives much more weight to the difference between the ambient and peak noise levels. However, in situations where traffic-induced noise measurement is required, the traffic noise index seems more appropriate. Further, the noise impact index would be more useful to quantify the effect of noise pollution on exposed people.
Introduction
Noise is considered as one of the most important environmental pollutants caused by uncontrolled population growth and unsustainable development of metropolitan cities.1–4 Road traffic noise is one of the major environmental issues affecting human health in urban areas.5–9 Given the importance of this issue, many studies have been reported by many researchers around the world on noise pollution. As such, Olayinka 10 conducted a study in Ilorin metropolis, Nigeria and found that the highest traffic noise index (TNI) and noise pollution level (NPL) were 122 dBA and 106 dBA at a station adjacent to the road junction, respectively. 7 Chowdhury et al. 11 revealed through an analysis of daytime traffic noise level in Kolkata, India revealed that the fluctuation of noise levels (NC) was higher in non-peak traffic hours. Besides, the average of TNI and NPL was equal to 103.7 ± 4.56 dBA and 96.25 ± 2.76 dBA in peak traffic hours, respectively. Banerjee et al. 12 assessed road traffic noise in Asansol, an industrial town in India. He concluded that the highest TNI during day- and nighttimes occurred in the industrial areas (107.1 dBA) and in the commercial land use (136.9 dBA), respectively. 9 In a survey of road traffic noise by Marathe 13 in Gwalior City, the highest L10 (83 dBA) and TNI (92.6 dBA) were recorded in industrial areas. Moreover, commercial areas were exposed to the highest L90 (72.2 dBA) while the highest LAeq (78.3 dBA) and NPL (90.9 dBA) were reported from semi residential areas. Marale 14 conducted a noise pollution analysis in a pilgrimage city (Maharashtra) in India and showed that the noise impact index (NII) values were equal to 0.45 dBA and 1.23 dBA in two regions Dehu and Alandi, respectively. Xia-Lin and Ming 8 performed a dynamic simulation of road traffic noise by integrating traffic micro-simulation technology, noise emission, and propagation calculation. They also accomplished the dynamic rendering of traffic noise distribution based on Paramics platform. Lin-hua et al. 15 presented a comprehensive evaluation of traffic noise pollution in Guangzhou Higher Education Mega Center based on population exposure. Dai et al. 16 developed a traffic noise prediction model on inland waterway of China using the Federal Highway Administration (FHWA). Nega et al. 17 modeled the propagation of traffic noise over the landscape and analyzed its impact on the structure and configuration of protected areas in Twin Cities Metro Region, Minnesota. They found that at higher levels of noise, patch shape index increased, while mean patch size decreased. Ramírez and Domíngue 18 developed a stochastic dynamic traffic noise prediction model based on noise curves for vehicle classes and their speed. The model was tested on urban two-lane roads in the city of Bogotá and established on the basis of the fit of single Li, 17 sec noise functions for different types of vehicles. They concluded that the model could show a slightly better fit than was found in four deterministic models.
The origin of noise pollution in Tehran City is due to either natural features or social factors. The natural feature is a 10% north–south gradient of the city as the main natural factor exacerbating noise pollution in the city while stationary and nonstationary noise sources such as motor vehicles, car alarms, airports, and noisy crowds on the passages are among the main artificial sources of noise in Tehran. 19 The District 14 with an area of 23.64 km2 is located on eastern Tehran City which accounts for 3.2% of the total area of the city. Despite its small area, the district is one of the most densely populated areas in Tehran. According to the 2006 census, the six sub-districts total population of this area was approximately 445,138 people. The district is comprised of six sub-districts. With a population of nearly 130,047 people, the sub-district 2 accounts for the largest share of the total population in the District 14. 20 Locating on a military area, there is no data available about the sub-district 6. In addition, schools and residential areas in this sub-district are located in towns that are far from the main streets where noise pollution is not that much significant. Accordingly, the sub-district 6 was excluded from the analysis process.
There have been many studies on noise pollution majority of which address equivalent sound level rather than traffic noise indices. As such, Maruyama et al.,21,22 Givargis and Karimi, 23 Gaja et al., 24 Chang et al., 25 and many others used equivalent sound pressure level to address noise pollution issue. Zuo et al. 26 revealed temporal and spatial variability of traffic-related noise in the City of Toronto (Canada) using equivalent sound pressure. Fiedler and Zannin 27 mapped noise pollution in urban traffic hubs in a Latin American metropolis based on equivalent sound pressure level. Cai et al. 28 measured equivalent sound pressure level to map spatiotemporal variation of noise pollution in Guangzhou, South China. Despite the large number of noise pollution studies by using equivalent sound pressure, there is only a limited number of relevant studies investigating the correlation between traffic noise indices and traffic flow. In addition, a few studies conducted on this issue have mainly addressed the correlation between traffic indices and traffic flux. Accordingly, the present study is carried out to investigate for the first time traffic noise indices and to introduce an optimal noise index for road traffic noise. This will provide the opportunity to assess other aspects of traffic noise pollution.
This study seeks to determine the sensitivity of TNI and NPL indices to changes in equivalent sound pressure levels. This has not been considered comparatively in analysis of response sensitivity. In other words, this article can provide practical advice on the use of different noise indices for different purposes. Further, the NII, integrating equivalent sound level and exposed population, is also introduced in this research. Overall, this research introduces supplemental parameters to the Leq for environmental noise assessment.
Materials and methods
In this research, a total number of 91 measurement stations were selected at District 14 of Tehran City distributed in a way to cover all land uses in the study area, including residential, recreational, educational, commercial, and commercial-residential land uses, as well as noise sensitive areas such as hospitals, and different passage types including highways, main streets, bystreets, and crossroads. In order to measure traffic-induced noise pollution during rush hours, a sound level meter was used in each station in working days (from Saturday to Wednesday) at three occasions of morning (7–9 a.m.), noon (1–3 p.m.), and evening (5–8 p.m.). The Sound Level Meter of B&K2230 type sound level meter was set in slow mode based on the standard recommended by EPA in 1999 and SPL values were recorded in dBA by 40 replications. Subsequently, the values of L10, L50, L90, TNI, 29 NPL, 30 and NII 31 were calculated.
It is worth mentioning that in order to develop a new noise traffic index, it was required to first measure different traffic noise indices of TNI, NPL, and NII and second, to compare them to identify the constraints and strength points of the indices. By identifying the strengths and weaknesses of the indices, it would be possible to develop a new index containing the strengths and be devoid of weaknesses.
Subsequently, a table was created in Excel Software in which descriptive information of the stations including name and code, longitude and latitude, TNI, NPL, L10, L50, and L90 were recorded to precede spatial analysis process using Arc GIS. Finally, the noise map was developed using Arc map and interpolation method of Inverse Distance Weighted. At the same time, while measuring the equivalent sound pressure level, the geographic coordinates of the measurement points at each station were recorded using GPS (model VISTA Garmin—HCX) to create the point map in GIS. In order to meet the standard conditions, measurement devices were installed in free field situations in front of the receiver. For this, the device was deployed on a stand with a height of 5.1 m above ground level at a distance of 3 m from the edge of the sidewalk. Further, the device sensor was protected by foam protector to minimize the impact of air flow. Distribution of the noise measurement stations in District 14 is shown in Figure 1.
Distribution of the noise measurement stations in separation of different land uses.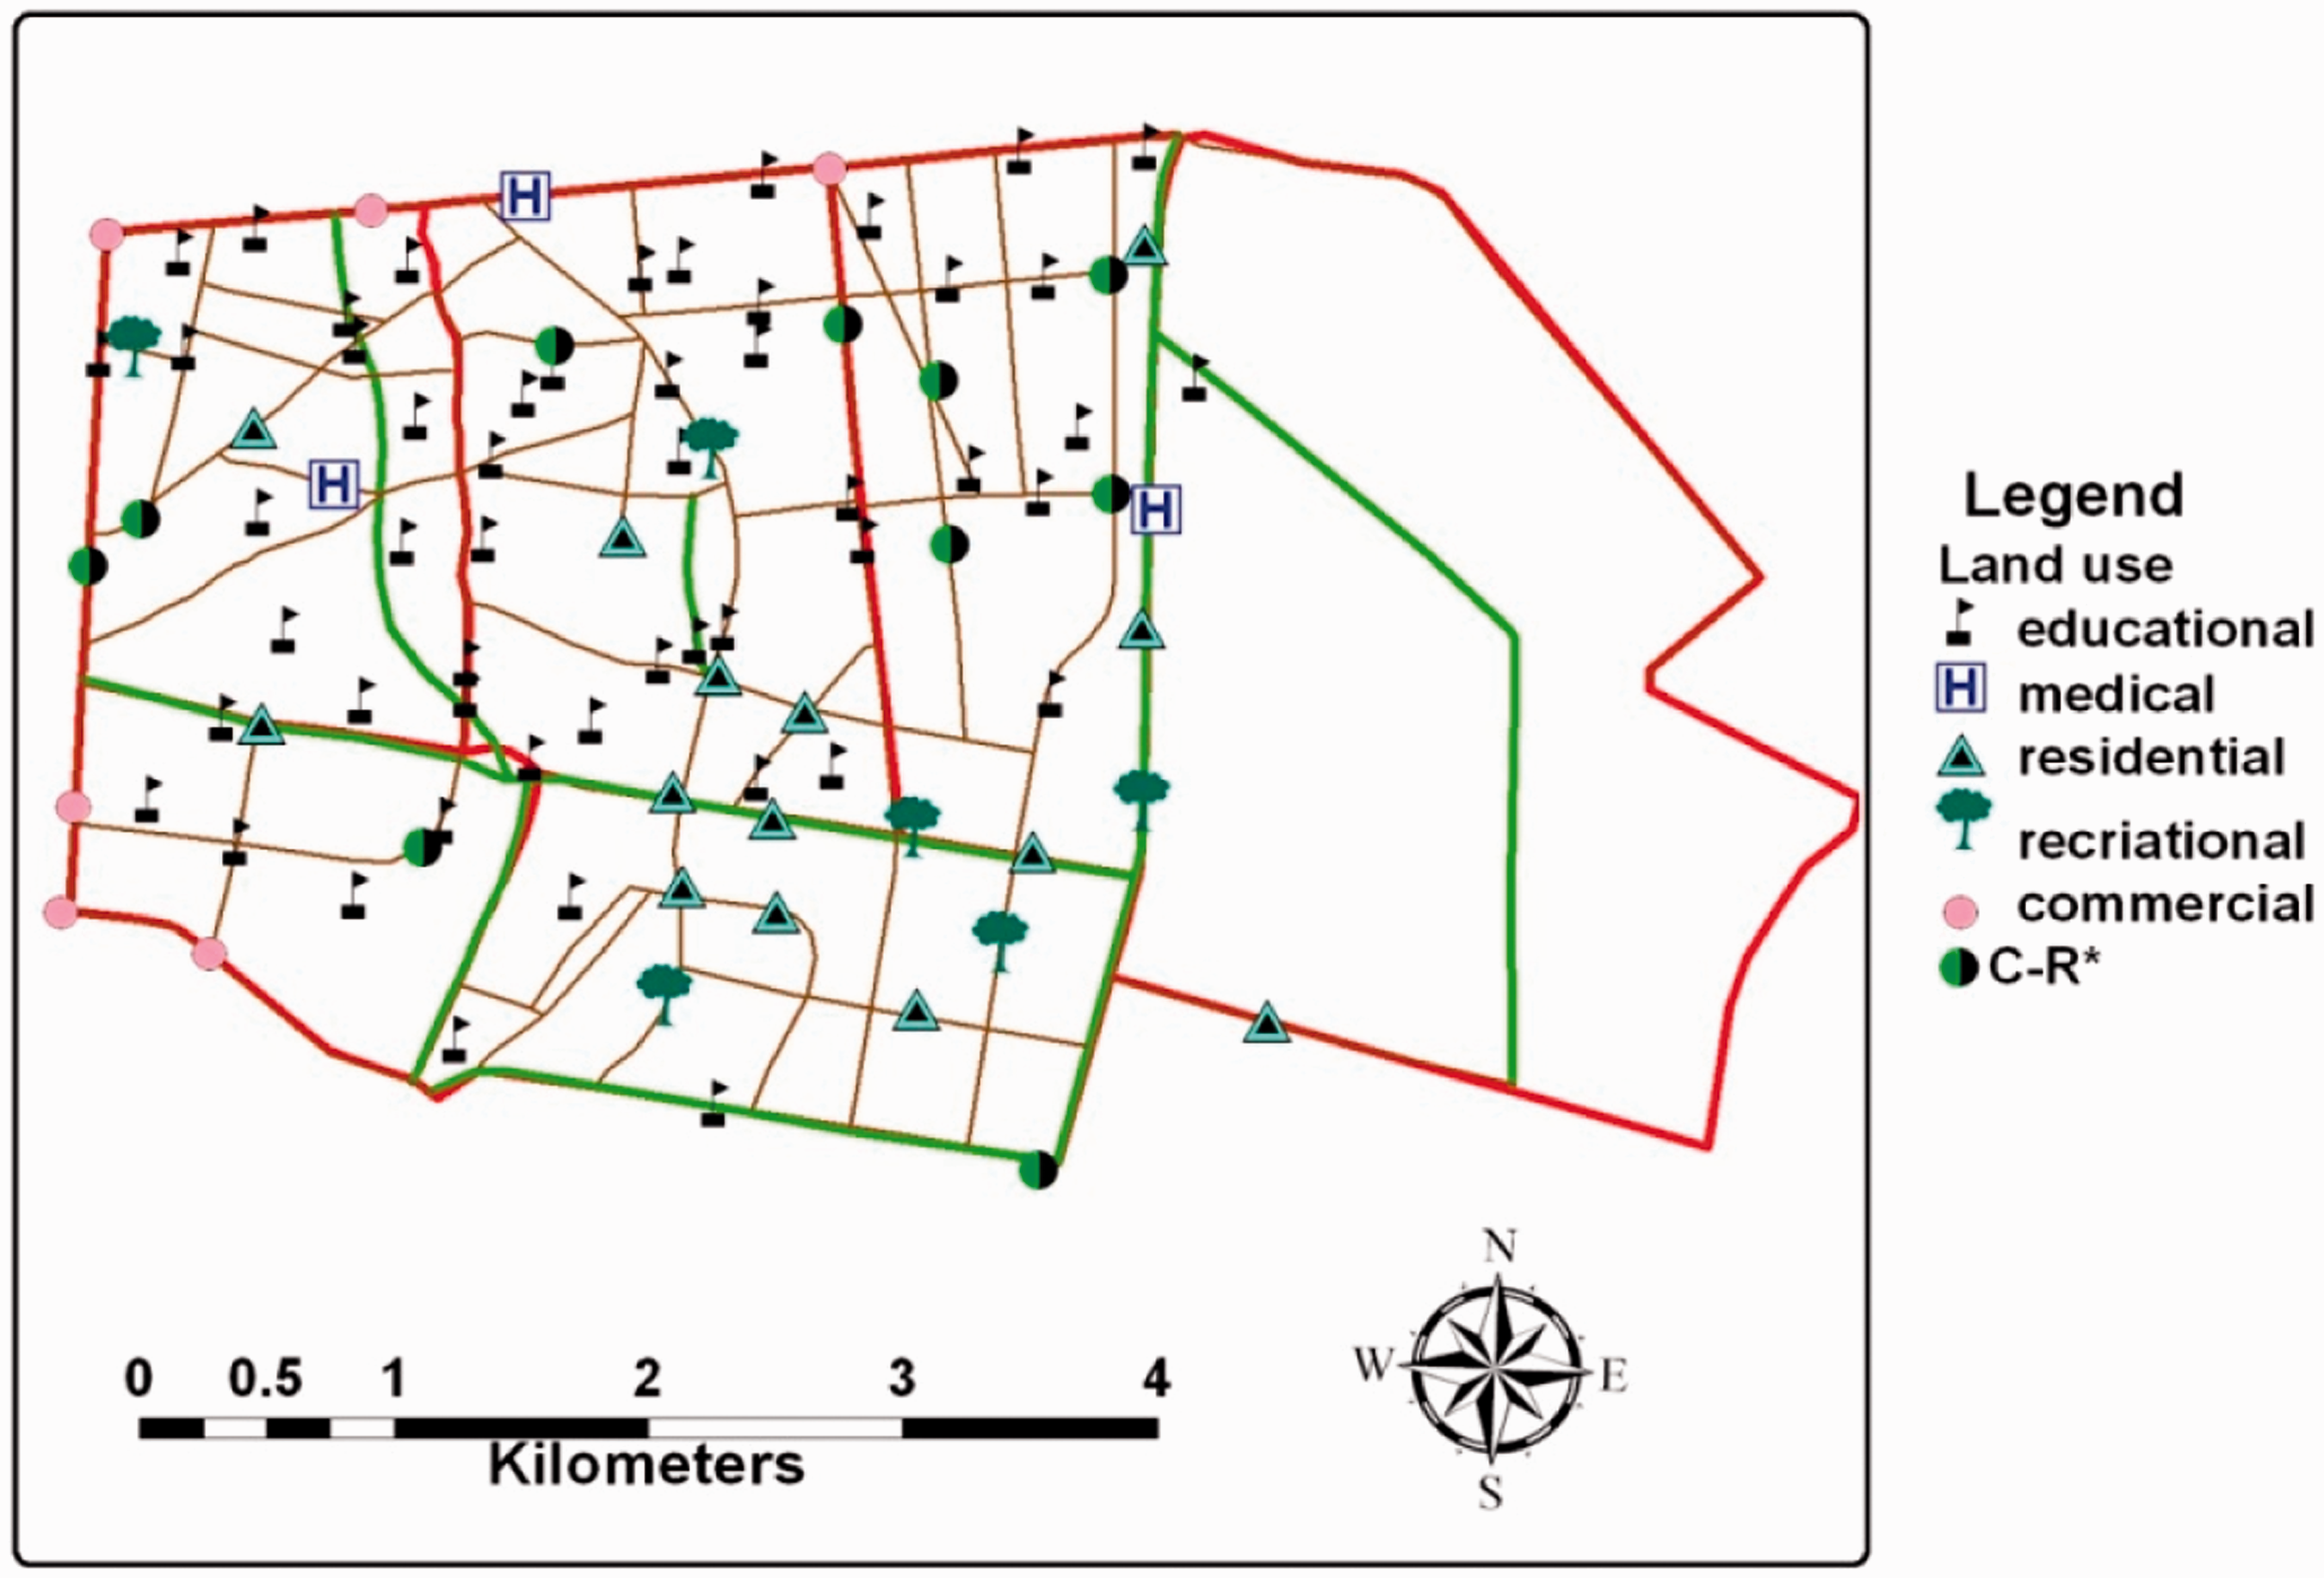
Results and discussion
Results of the equivalent sound pressure parameters
Average statistical equivalence values at different land uses.
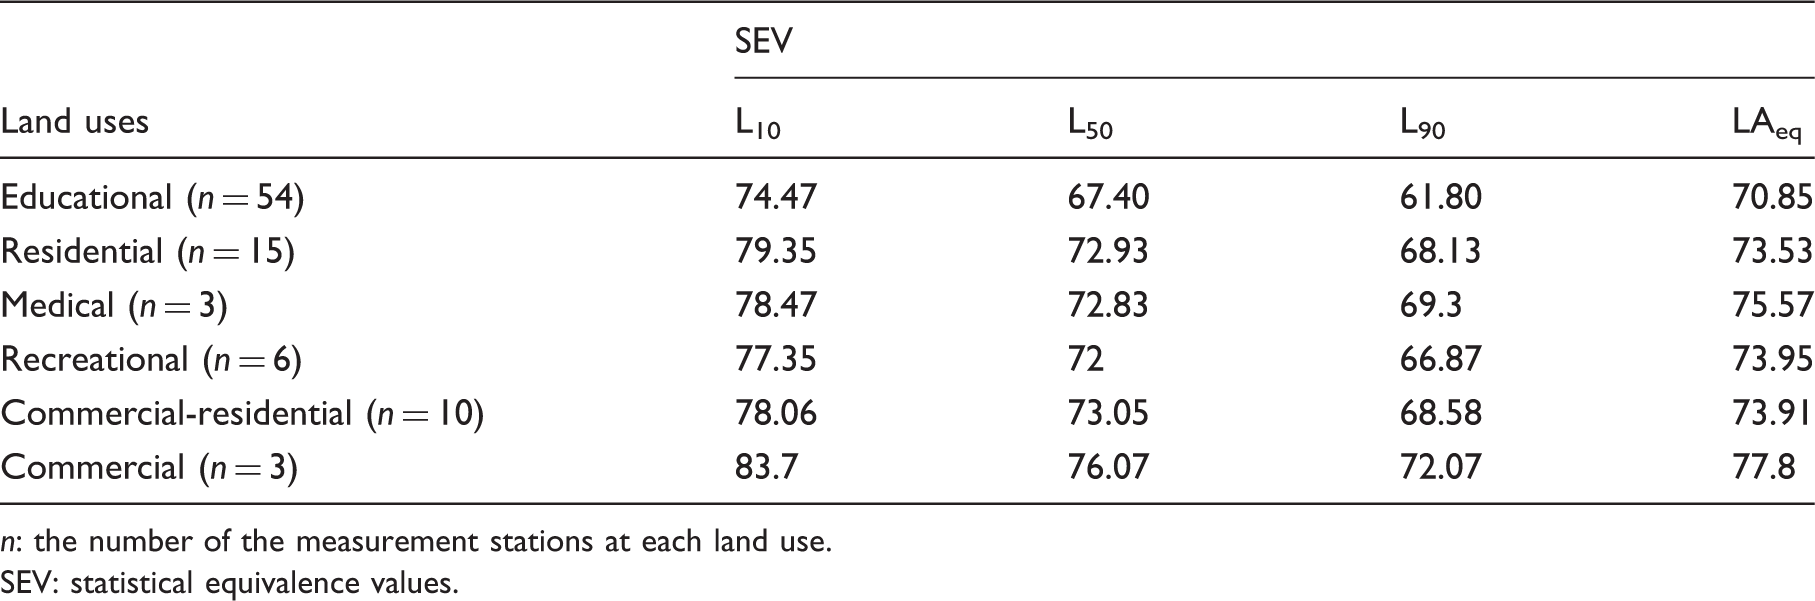
n: the number of the measurement stations at each land use. SEV: statistical equivalence values.
According to the correlation analysis between LAeq and L50, the equivalent sound pressure level has a strong positive correlation with L50 (Figure 2). Since L50 is a representative of average values, the R2 of 0.76 could well support the accuracy of the measurements. In other words, correlation between Leq and L50 was tested to ensure greater confidence in the analyses.
Correlation between LAeq and L50.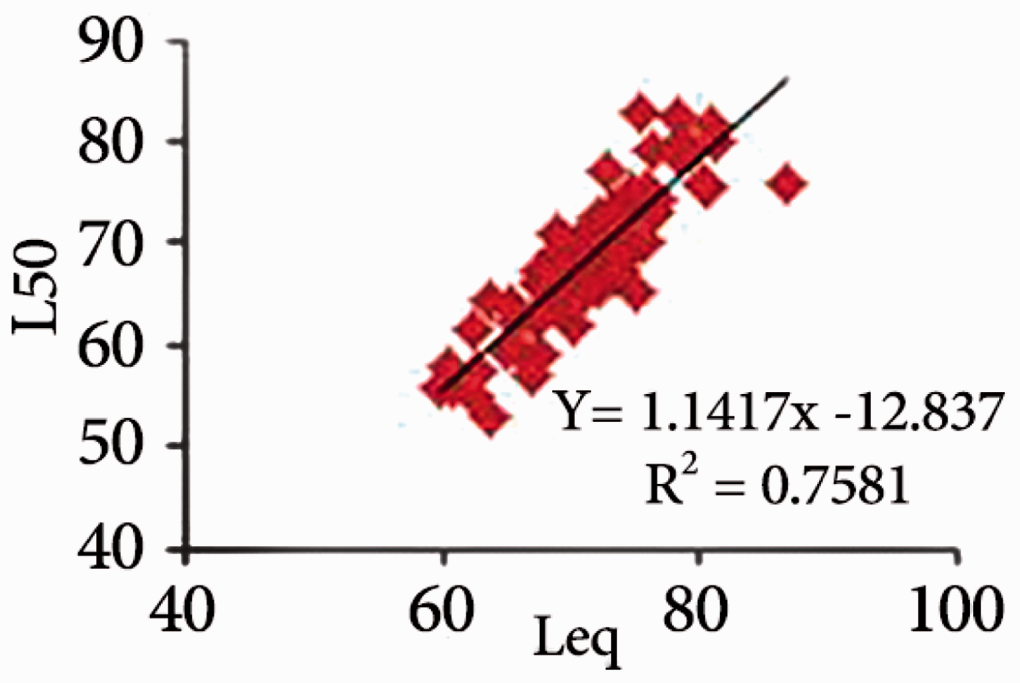
Traffic noise index
Unlike the LAeq, the difference between maximum and minimum sound pressure levels (L90−L10) in the center is further compared to the edge of the expressways and the surroundings of the district (Figure 3). According to the results, although the equivalent sound pressure level is high, NPL is almost constant during daytime. The difference between maximum and minimum sound pressure levels is high in the center of the district due to more crowded urban fabric with dense residential areas and narrow streets where heavy vehicles contribute to raising the instantaneous equivalent sound pressure level and L10. This in turn increases the TNI.
TNI values in District 14, Tehran.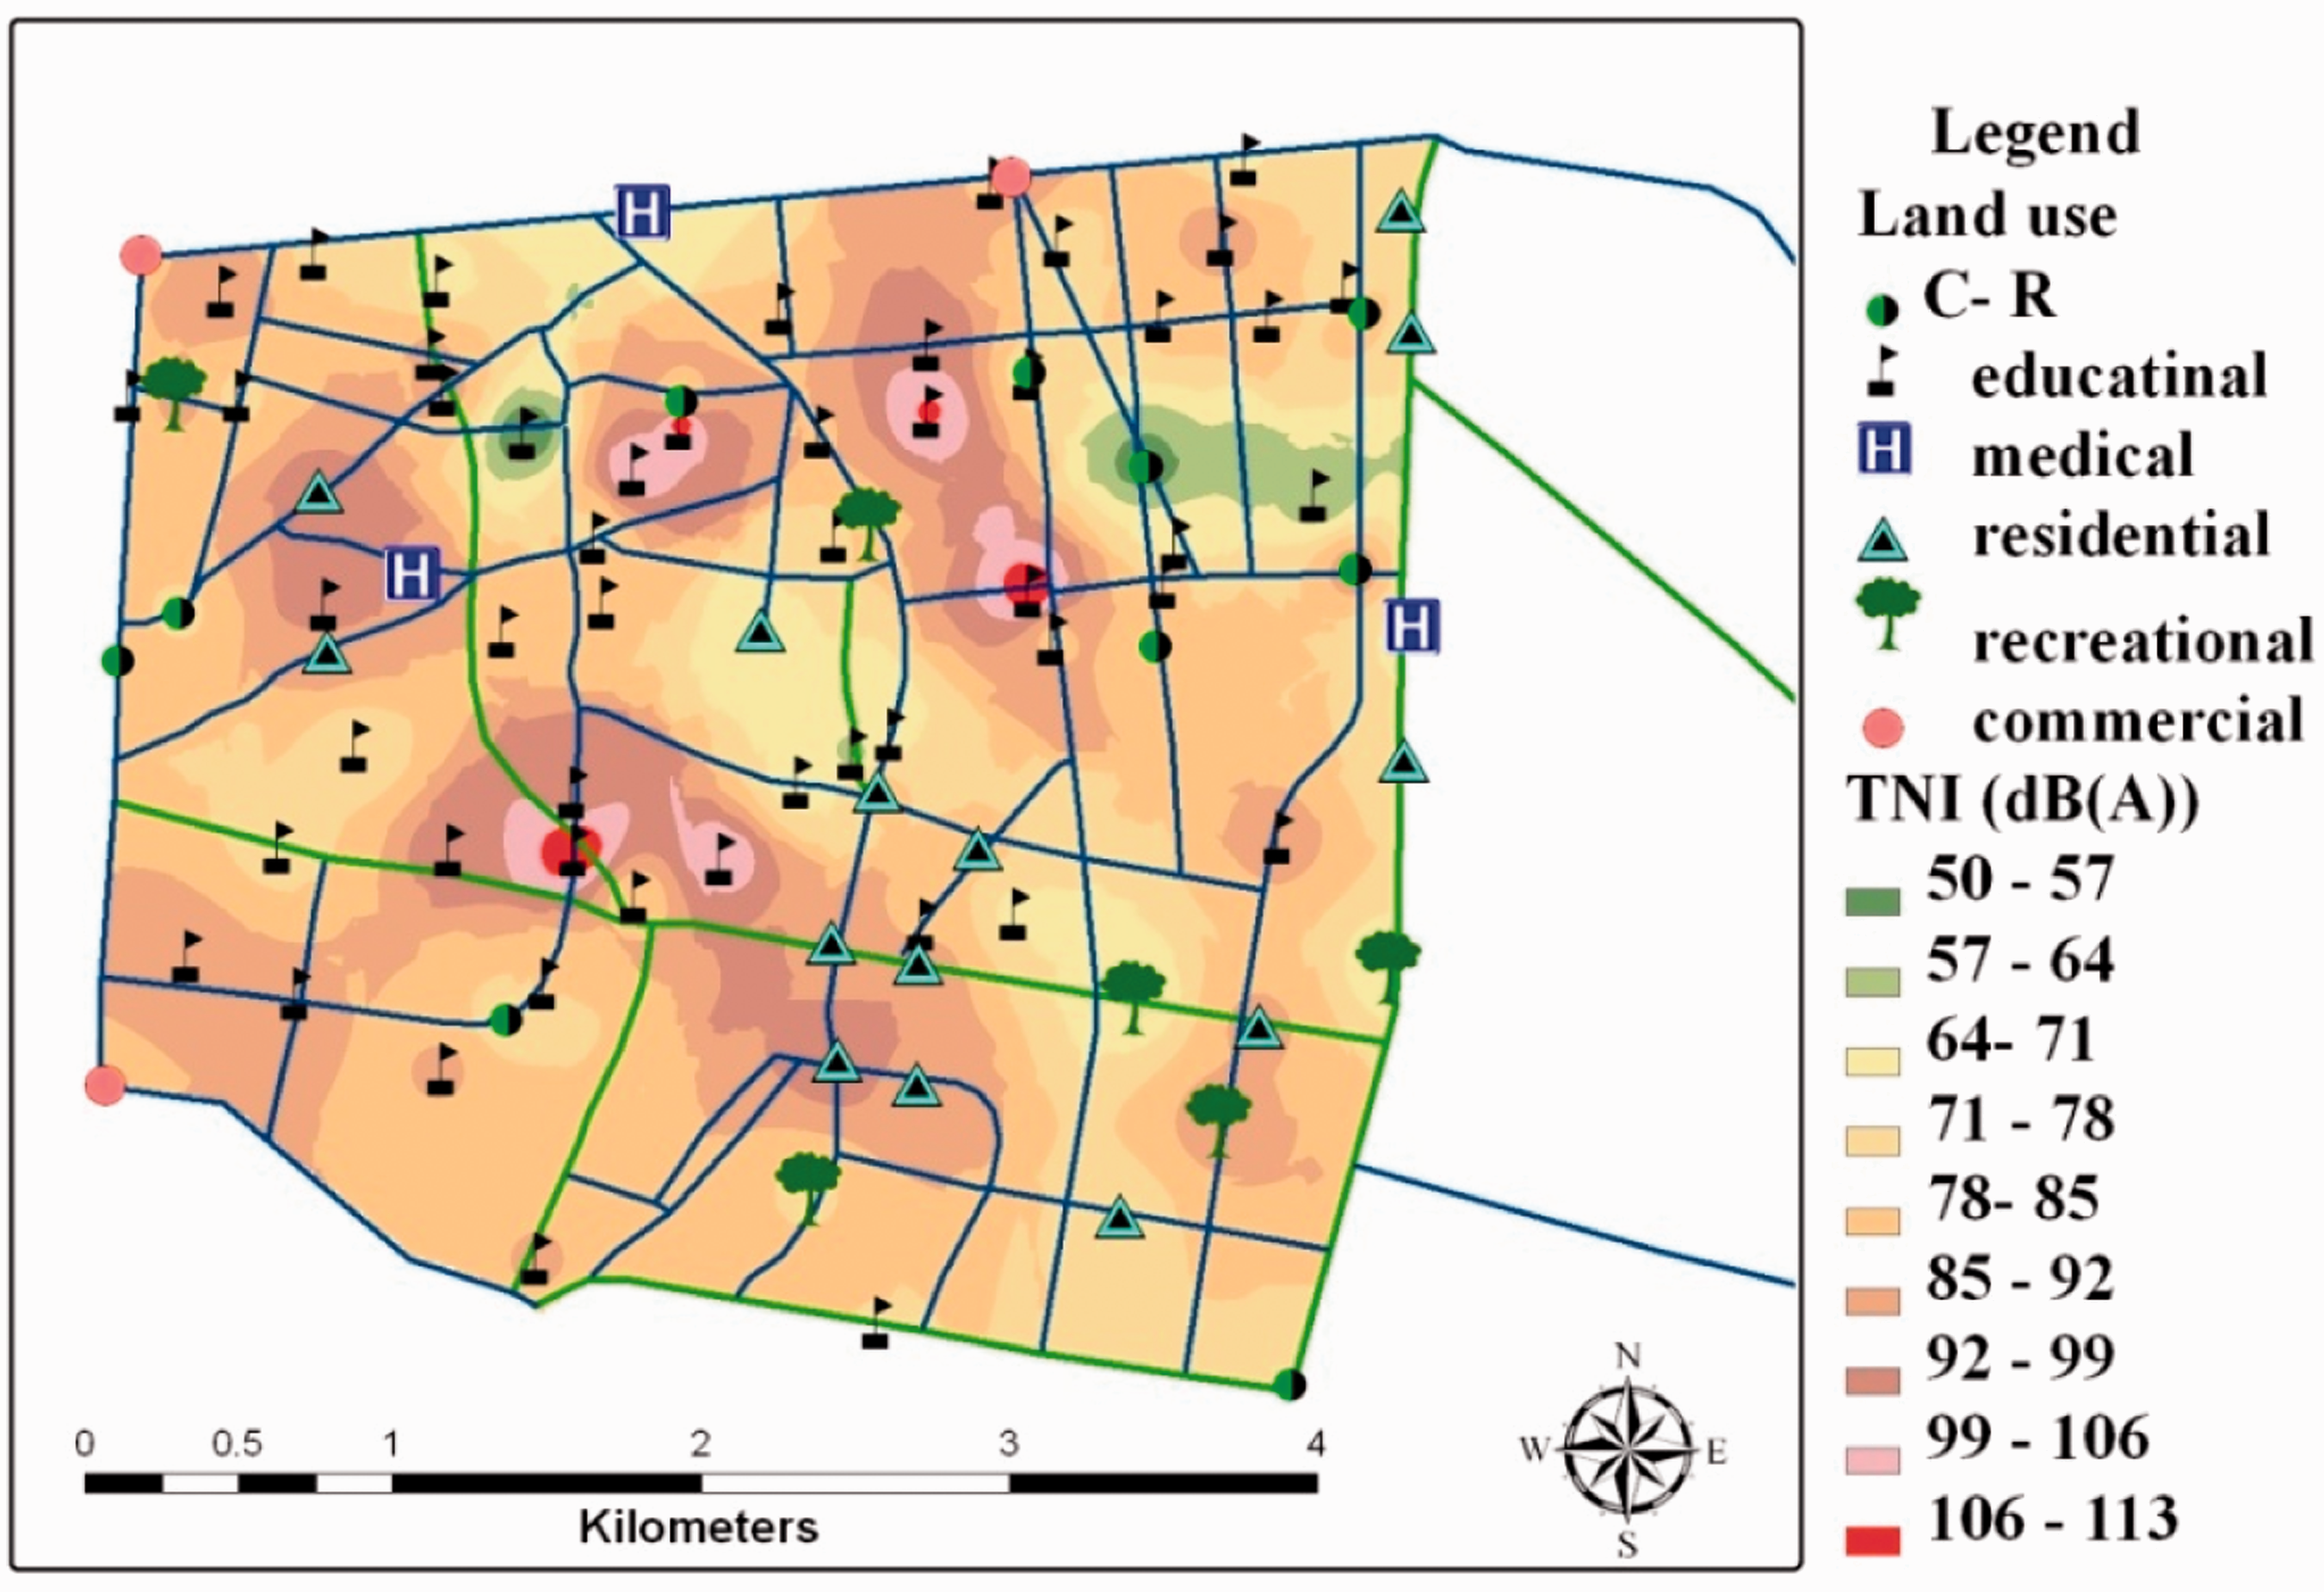
The maximum TNI values in the morning, noon, and evening were respectively 98.6 dBA, 113.7 dBA, and 112.9 dBA observed in the proximity of the educational land use. In addition, the lowest TNI of 50.1 dBA was recorded in the morning in the educational land use. However, the lowest TNI value was 67.54 dBA during noon and 64.2 dBA in the evening as measured in the vicinity of the recreational land use. The average TNI was 81.09 dBA, which exceeds the threshold index value of 74 dBA. 32 Clearly, less TNI value does not mean lower NPL; it denotes fewer fluctuations in the average equivalent sound pressure level. According to the TNI results, the difference between the L10 and L90 at different land uses reaches its peak at the educational land use. As a result, the influence of traffic on NPL reaches the maximum level.
Noise pollution level
The NPL values at different land uses are displayed in Figure 4. As observed on the map, NPL is higher around the main streets and expressways. These zones are demonstrated as red and purple spots. These spots are at low density in the center because of different urban fabrics with multiple bystreets, dense and old residential buildings. This is in contrast to the changing trend of TNI.
Noise pollution level in District 14, Tehran.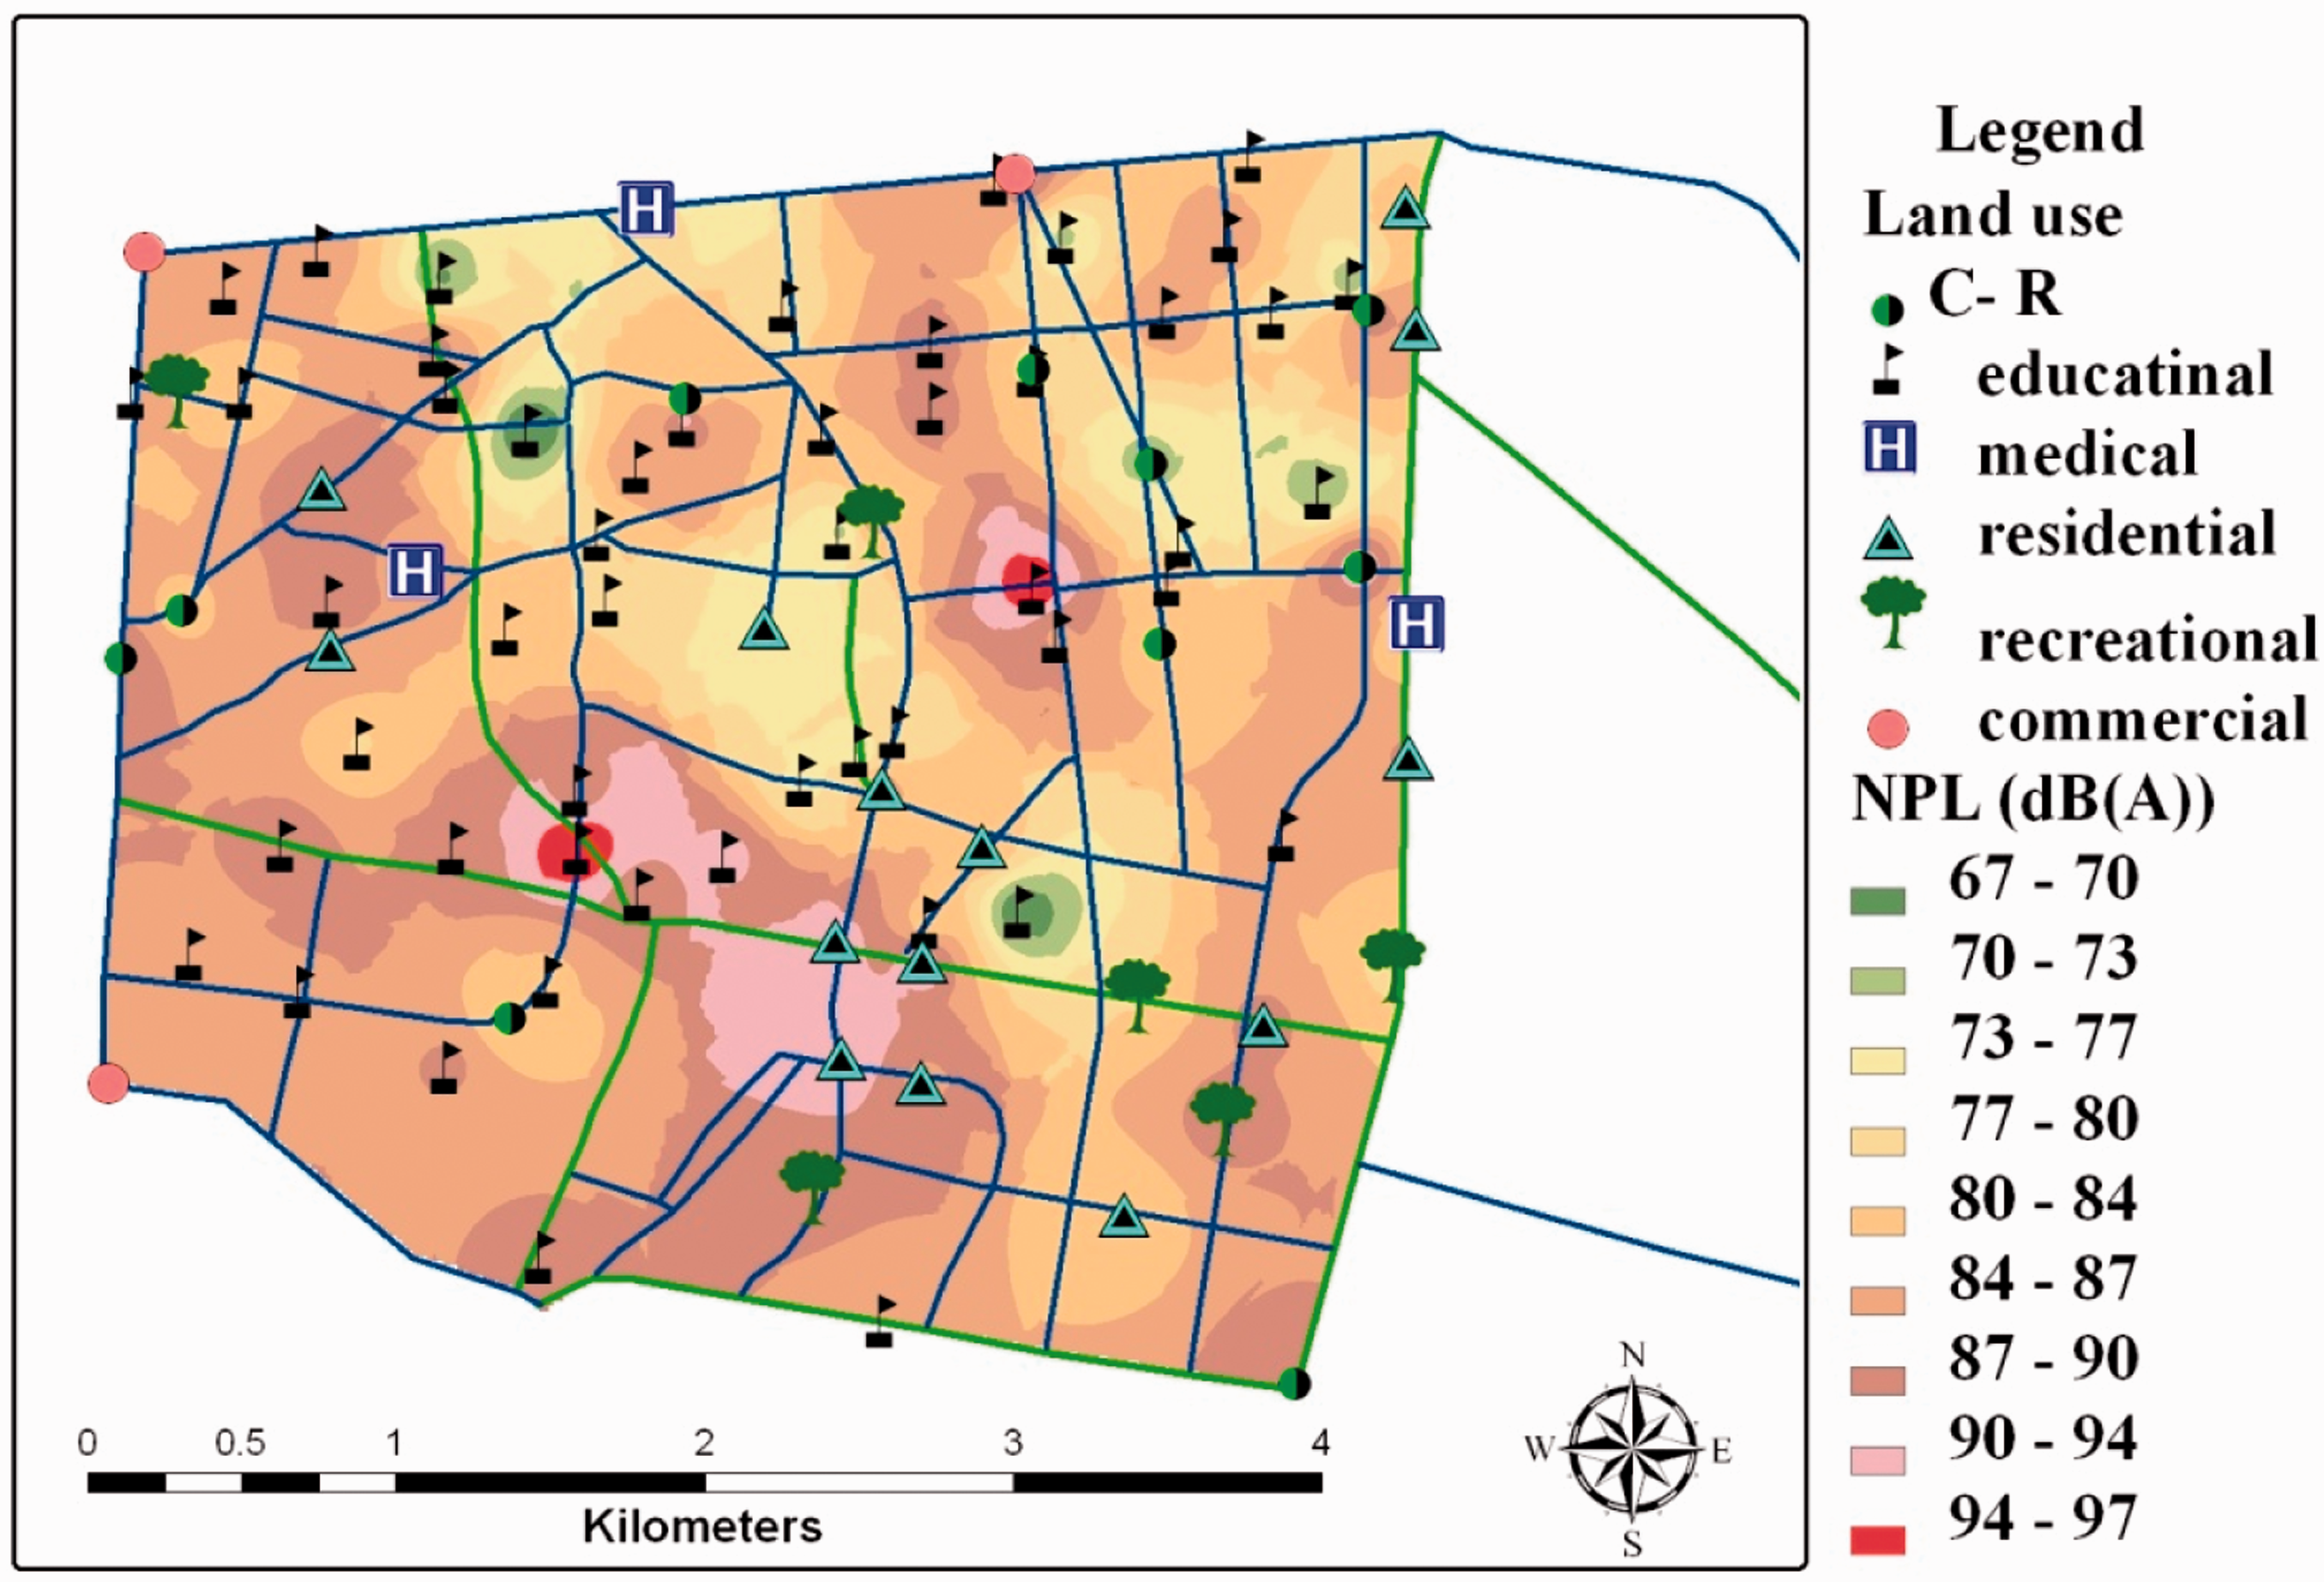
Noise pollution analysis results revealed that the maximum NPL of 96.80 dBA was observed at the educational land use while its lowest value of 65 dBA was reported from the medical land use. The maximum NPL in the morning, noon, and evening was 93.34 dBA at commercial-residential land use, 97.80 dBA at educational land use, and 96.06 dBA at commercial land use. The lowest NPL was 67.05 dBA in the morning and 67.54 dBA at noon measured at the educational land use. The lowest NPL in the evening was 78.07 dBA reported from the commercial-residential land use. The average NPL of the 91 measurement stations was 83.66.
Average values of traffic indices at different land uses of District 14, Tehran.
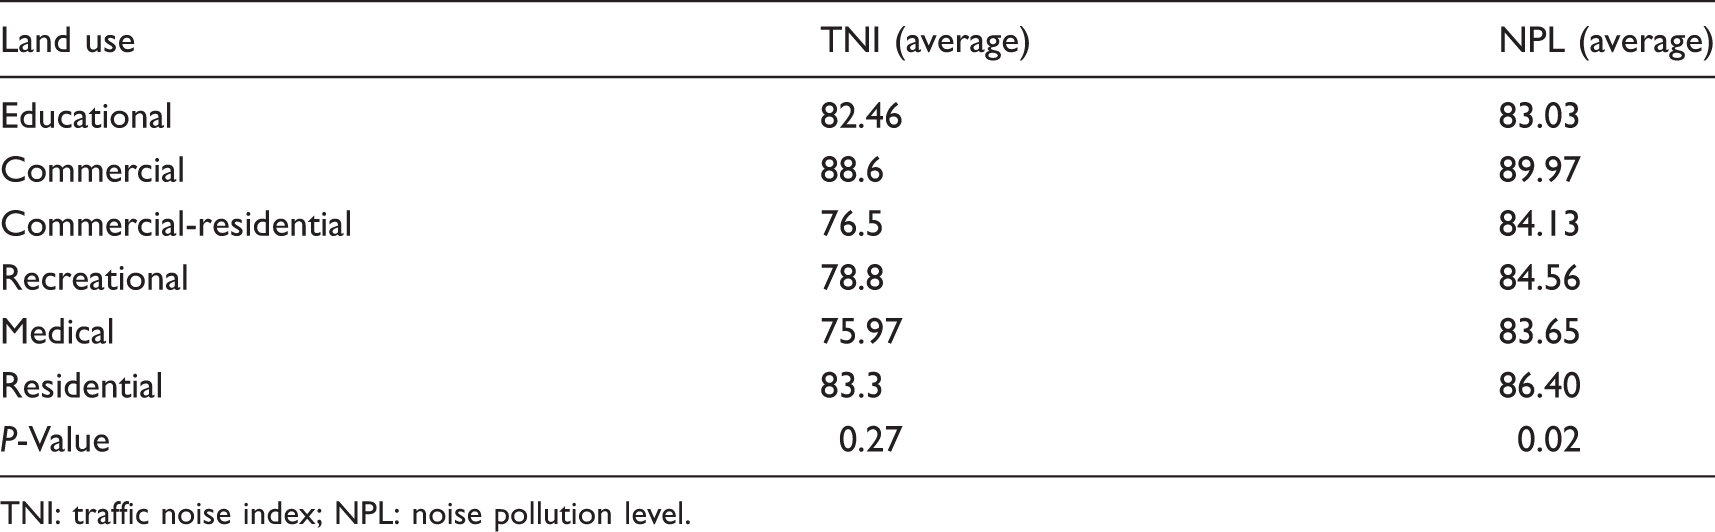
TNI: traffic noise index; NPL: noise pollution level.
Average values of the traffic indies at different types of passages in District 14, Tehran.
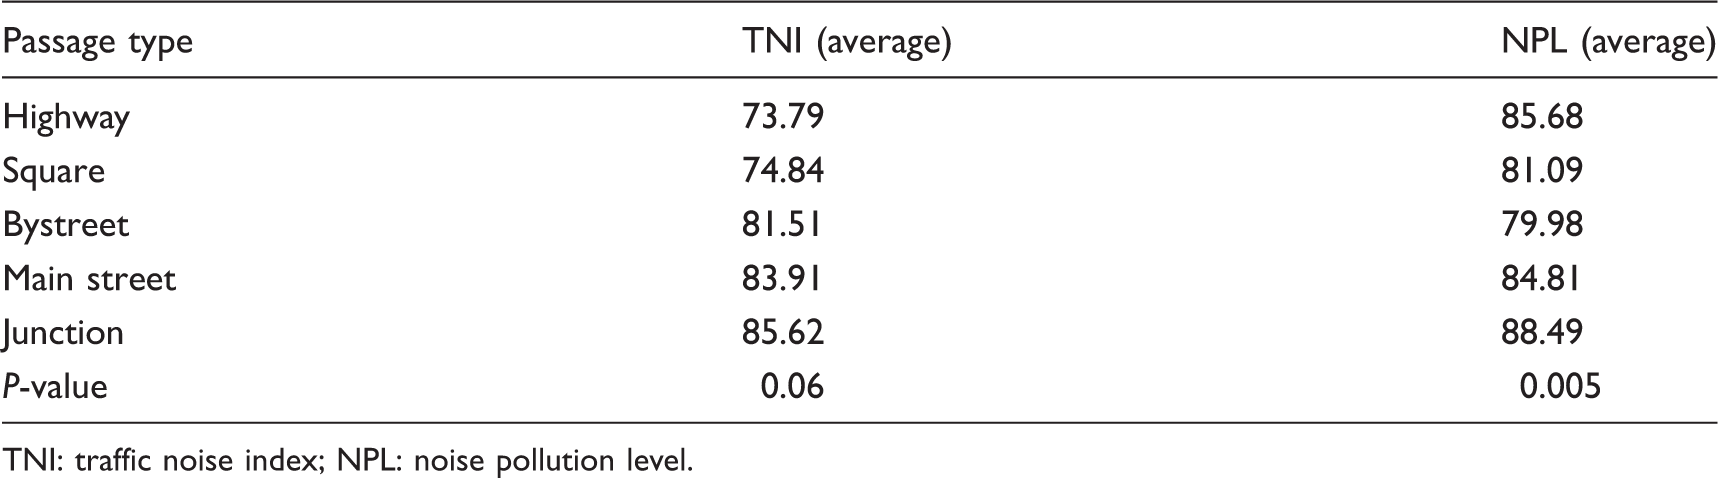
TNI: traffic noise index; NPL: noise pollution level.
Average values of traffic indices at different occasions.
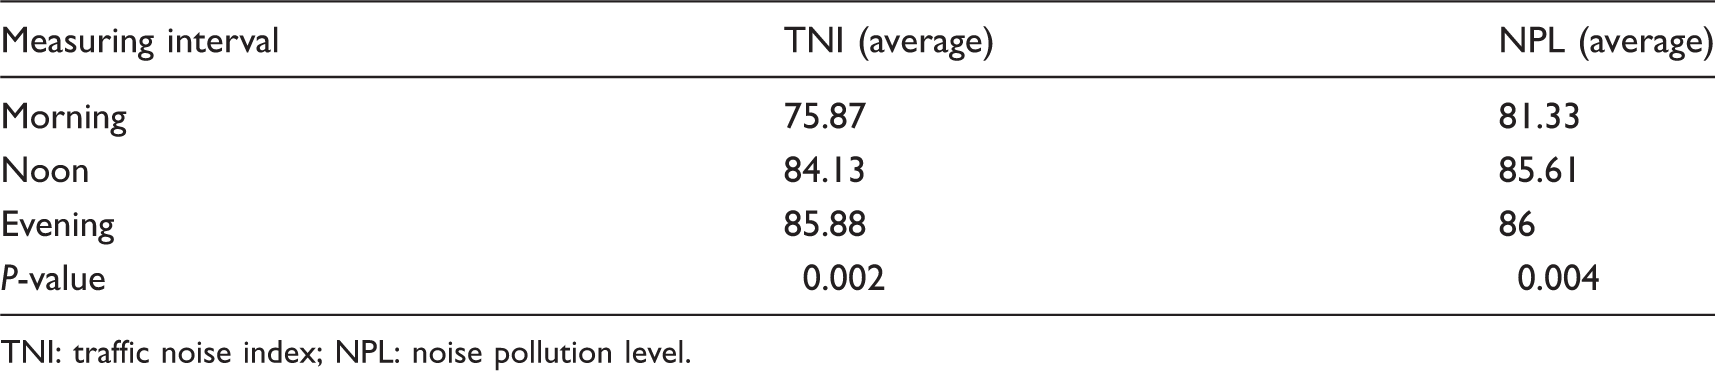
TNI: traffic noise index; NPL: noise pollution level.
As Table 4 suggests, there was a significant relationship between NPL values recorded in the morning, noon, and evening (P-value = 0.004). The difference between TNI values of morning, noon, and evening was also significant (P-value = 0.002). The statistical comparison confirms no significant difference between the equivalent sound pressure levels at different occasions. 33 This indicates the importance of the statistical parameters.
Average values of traffic indices at different sub-districts of the District 14, Tehran.
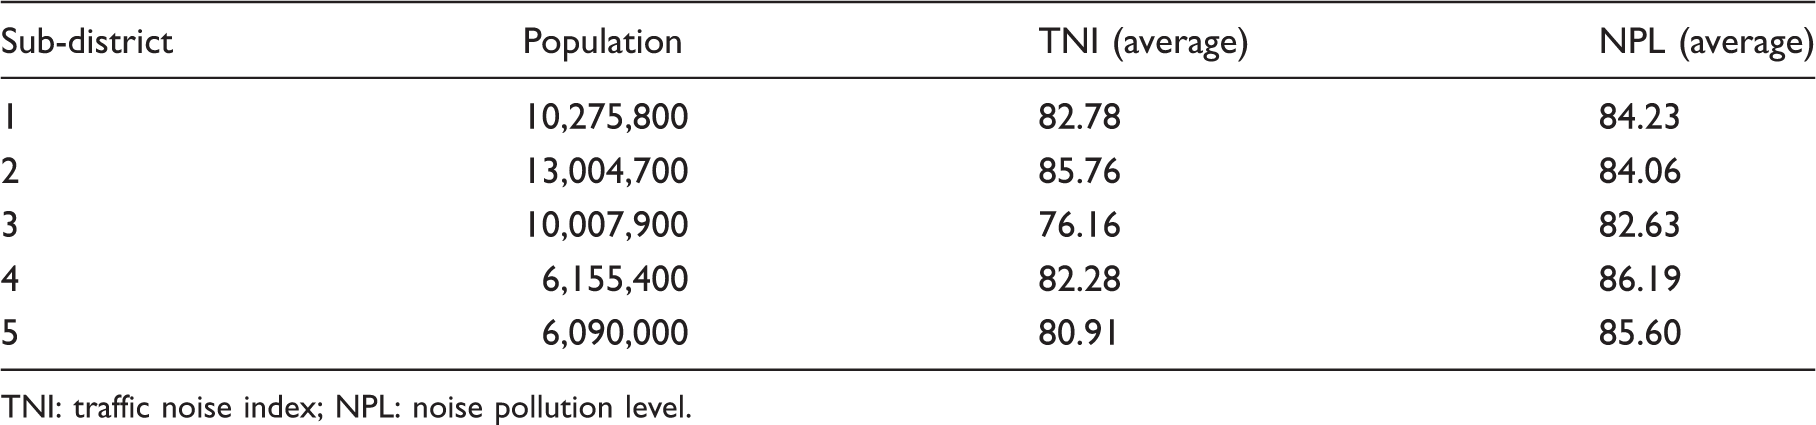
TNI: traffic noise index; NPL: noise pollution level.
The general linear model-univariate was used to compare the NPL and TNI values in different land uses at three occasions of morning, noon, and evening. TNI and NPL with P-values of 0.47 and 0.39 showed no difference at the three occasions. The indices (TNI and NPL) also did not show any significant difference when compared between various streets at three occasions of morning, noon, and evening (P-value for TNI = 0.33, and P-value for NPL = 0.17). The NPL, however, showed a difference when the indices were compared in various streets without involving the influence of three occasions of morning, noon, and evening. As observed, there is no significant difference in each time period; however, the difference was observed in the entire time period. In this case, changes of any period increasingly combined with the changes of land uses and displayed the changes. It seems that the influence of land use is higher than that of the time period, although the impact of both parameters is influential.
Noise impact index
NII values at different sub-districts of the District 14, Tehran.
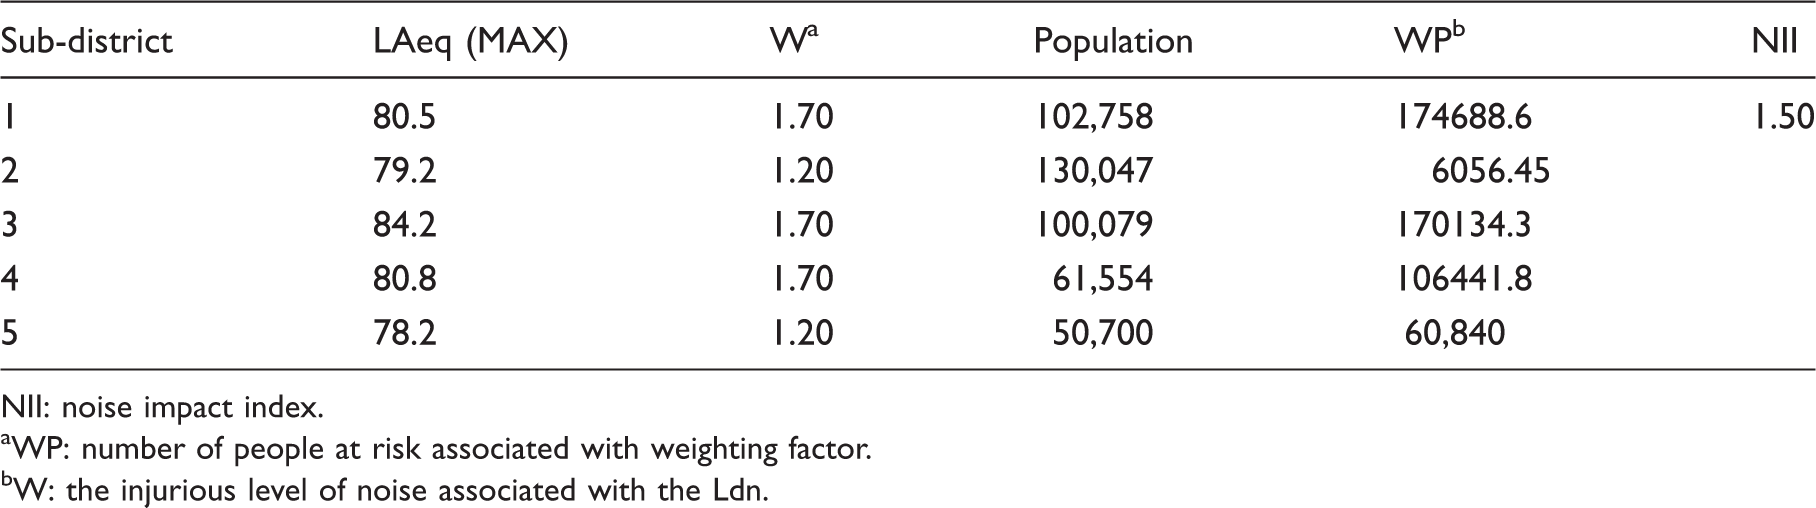
NII: noise impact index.
WP: number of people at risk associated with weighting factor.
W: the injurious level of noise associated with the Ldn.
According to the statistical analyses, NPL and TNI values have no significant difference between various passages and land uses. This is in contradiction with the results of Marathe 13 Gwalior City in 2012 that reported a significant difference between TNI values at various land uses and recorded the highest TNI values at the industrial land use as a result of high traffic speed.
The NPL in this research shows a significant difference with the highest value of 89.97 dBA in commercial land use. This is in contrast to Marathe 13 who found the highest NPL in the semi-residential land use (91.1 dBA). The NPL was further optimized by including the L50 factor, which addresses noise level. The optimized NPL seems appropriate for noise pollution assessment in residential zone or any other recipient environment that are of vital importance in terms of noise pollution. The index considers not only the traffic noise sources, but also all of the noise sources. Accordingly, it overestimates total noise level when considering the overall situation of noise pollution in a region. On the contrary, TNI including two factors of L10 and L90 which almost indicate peak and background noise levels would be more suitable for places such as crossroads where the L10 level is peak due to the noise of vehicle horn and high speed car passing sound effect. In conclusion, the use of this index is recommended for studies that are concerned with measuring traffic noise. It is worth noting that for greater difference between L10 and L90, the TNI will increase even more and subsequently, noise nuisance to the recipient environment becomes more. This is in line with the results of Chowdhury et al., 11 who reported the highest fluctuation rate in non-peak traffic hours in Kolkata City.
Comparing the traffic indices, it was found that either TNI or NPL has a significant difference at three occasions of morning, noon, and evening. Olayinka 10 obtained the same results in Nigeria in 2005. According to Olayinka, TNI and NPL both indices increased during the day, reached its peak in the afternoon, and fell down in the evening. 7
Equivalent sound pressure level shows the highest positive correlation with L50 factor. Similarly, Golmohammadi 34 achieved to the same results in Hamadan City in 2005. The NII value of 1.50 confirms that NPL exceeds residents’ tolerance threshold causing citizens’ complaints. Marale 14 in a similar investigation in two pilgrimage cities of India revealed that the 0.45 dBA-NII value in Dehu City was the reason for 6.6% of noise-induced complaints. This value was reported equal to 1.23 in Alandi City, which accounts for 28.33% of noise-induced complaints.
Conclusion
This research compares applicability of road traffic indices for the first time in the world. According to the research findings, it is highly recommended to use an optimal traffic index, instead of using multiple indices. This can lead to savings in time and budget. NPL is advised when it is required to assess general status of noise pollution in a region. The TNI is preferred for detailed assessment of noise impacts and for comparing the noise level at different passages and land uses. In addition, when the effect of noise on human as a recipient and/or source of noise is considered, then, NII would be a better choice. This research was performed to show noise pollution status in an urban area at different land uses and to measure sensitivity of traffic noise indices to the equivalent sound pressure level parameters. This research is a starting point for discussing and explaining the issue and identifies the need for the research. Definitely, further research is required to confirm the obtained results.
Footnotes
Acknowledgements
The authors are grateful to Mrs. Hosseini at GIS Department of Municipality of Tehran, District 14 for her sincere contribution towards implementing the present study. Special thanks to Mr. Kaveh Aghamiri and Dr. Amir Hossein Javid who helped the authors in this project.
Declaration of conflicting interests
The author(s) declared no potential conflicts of interest with respect to the research, authorship, and/or publication of this article.
Funding
The author(s) received no financial support for the research, authorship, and/or publication of this article.