
Abstract
Using videotaped interviews of beginner, intermediate, and native English speakers, we examined whether observers’ perceptions of linguistic measures of accentedness, temporal fluency, lexicogrammar, and comprehensibility influenced their deception detection. We found that observers could detect differences in speech characteristics between proficiency levels, and that they were less able to detect deception among beginner speakers compared to intermediate and native speakers. Beginner speakers were also afforded more of a truth bias compared to intermediate, but not native speakers. Interestingly, observers’ backgrounds, including prior exposure to non-native speech, did not influence their judgments. Rather, observers’ discrimination and response bias appeared to be most affected by speakers’ fluency and comprehensibility, respectively. This study is one of the first to separate and directly compare perceptions of linguistic characteristics and their role in deception detection. Findings raise questions about equitable deception detection in legal settings.
Introduction
Over the past several decades, the proportion of the United States population that uses a language other than English has grown substantially. In 2019, 67.8 million people—over one-fifth of the population—reported speaking a language other than English at home (Dietrich & Hernandez, 2022). Along with this increase comes a greater likelihood that legal decision-makers such as customs officers, police officers, judges, and jurors will be tasked with observing, interviewing, and making deception detection decisions about people who speak English with varying levels of proficiency. Of those who use a language other than English at home, many report speaking English very well (62.4%), while the remaining one third speak English either well (18.5%), not well (13.3%), or not at all (5.8%; Dietrich & Hernandez, 2022). Despite the volume of speakers with limited English proficiency, relatively little is known about how observers’ impressions of these speakers’ linguistic competencies influence deception detection.
Veracity judgments can be based on factors such as how plausible information sounds (DePaulo et al., 2003) or how credible a person appears (e.g., Miller & Hewgill, 1964). Linguistic characteristics, and attitudes toward them, can also strongly influence observers’ perceptions of speakers (Dragojevic et al., 2021; Hansen et al., 2017) and contribute substantially to impression formation (Vrij & Winkel, 1994). As such, it is possible that some variations in accent, speech fluency, vocabulary, grammar, and comprehensibility that are often associated with non-native speech could similarly affect deception detection. In fact, there is evidence that observers are less likely to believe non-native speakers than native speakers (e.g., Castillo et al., 2014; Da Silva & Leach, 2013; Evans & Michael, 2014). We examined whether information in the speech signals of limited proficiency English speakers affected observers’ impressions and could account for the disadvantageous proficiency effect.
Accentedness
Accented speech has received significant empirical attention regarding its impact on impressions of others. Observers can detect nonstandard speech characteristics that indicate a foreign accent in as little as 30 ms, suggesting that accents are instrumental to impression formation (Baus et al., 2019; Flege, 1984; Flege & Hammond, 1982). From as early as five months of age, children exhibit sensitivity toward dialectal differences (Nazzi et al., 2000). By 5 years, their evaluations of accentedness can be more sensitive than those of race (Kinzler et al., 2009). Accents can alert listeners to the presence of geographic or social outsiders (Lippi-Green, 1994) and are sometimes associated with negative qualities (e.g., Fuertes et al., 2012; Gluszek & Dovidio, 2010; Mai & Hoffmann, 2014). In English-speaking countries, accents have been shown to encourage stereotypes and discrimination against non-native speakers (Bouchard Ryan & Bulik, 1982). Perceptions of stronger accents have also been associated with negative attitudes (Callan et al., 1983; Lev-Ari & Keysar, 2010), distraction, and annoyance (Fayer & Krasinski, 1987). A preference toward native over non-native accents has been demonstrated across diverse linguistic backgrounds (DeJesus et al., 2017; Scales et al., 2006; Tsurutani & Selvanathan, 2013) and even in children as young as 5 years old (DeJesus et al., 2017; Souza et al., 2013).
It has been suggested that the negative qualities ascribed to non-native accented speakers may contribute to biases (Brennan & Brennan, 1981; Romero-Rivas et al., 2021). For instance, stereotypes based on accented speech can lead to evaluations of lower trustworthiness (Bouchard Ryan et al., 1977). Speakers with accents can also be perceived as less accurate and credible than native speakers (Frumkin, 2007; Lev-Ari & Keysar, 2010). In mock trials, speaking English with an accent has been associated with increased guilty verdicts (Kurinec & Weaver, 2019) and harsher sentences (Romero-Rivas et al., 2021). Importantly, the relationship between accent and comprehension may be bidirectional (Kennedy & Trofimovich, 2008): speakers may be perceived as more accented if observers find their messages confusing or as less credible if their accents render them difficult to understand. Overall, speaking with an accent may negatively impact the perceived credibility of people who do not speak English as a native language.
Fluency
If perceptions of accentedness can affect credibility ratings, so might perceptions of other speech qualities. For instance, there exists a negative correlation between accent and speech fluency, such that the stronger the perceived accent, the lower the ratings of speech fluency (e.g., Anderson-Hsieh & Koehler, 1988; Derwing et al., 2004; Munro & Derwing, 1998, 2001). Speech fluency is commonly operationalized in terms of the temporal aspects of speech production (e.g., speech rate, pauses, repetitions, hesitations, false starts, and spontaneous corrections; Derwing et al., 2004; Kormos & Dénes, 2004; Lennon, 1990). When observers judge speakers with varying levels of language proficiency, reduced speech fluency may create processing difficulties for the observer (Lev-Ari, 2015) and, thus, influence their impressions. For example, Buller et al. (1992) demonstrated that speech rate could affect perceptions of a speaker's character. Similarly, when observers experience difficulty processing a message, they assign lower truthfulness ratings to that message (Reber & Schwarz, 1999).
Temporal speech fluency characteristics such as fewer spontaneous corrections, more repetitions and hesitations, decreased response length, and increased response latency have also been associated with deception, irrespective of language proficiency (Boltz et al., 2010; DePaulo et al., 2003; Zuckerman et al., 1981). Observers may also interpret the presence of some characteristics, such as fillers (e.g., “uh”) and pauses, as deceptive (Global Deception Research Team, 2006). As a result, if non-native speakers exhibit disfluencies, observers may be prone to labeling them as lie-tellers.
Lexicogrammar
A speaker's use of lexis (i.e., vocabulary) and grammar may also affect observers’ veracity judgments. Vocabulary errors can undermine observer comprehension (e.g., Politzer, 1978; Trofimovich & Isaacs, 2012)—which affects perceived truthfulness—as well as grammatical accuracy (e.g., Crowther et al., 2015; Munro & Derwing, 1995; Rossiter, 2009). Grammatical errors occur more frequently in deceptive accounts than truthful ones (Sporer & Schwandt, 2006), whereas first-person pronoun use is associated with honesty (Hancock et al., 2007; Moberley & Villar, 2016; Newman et al., 2003; but see Matsumoto & Hwang, 2015). In addition, observers use the ease of lexical retrieval as a metacognitive cue to truthfulness (Newman et al., 2015). Again, this might be disadvantageous for non-native speakers: they can make speech errors when the inhibition of their native language vocabulary and grammar fails (Guo et al., 2011), which may impact their lexical retrieval. These lexical or grammatical errors may be interpreted as deceptive by observers, which could explain why less proficient speakers are often less likely to be judged as truthful than native speakers.
Comprehensibility
Observers’ attitudes towards non-native speech are related to their overall ability to understand the speaker's message (Anderson-Hsieh & Koehler, 1988; Bresnahan et al., 2002). Researchers have linked accentedness (specifically, prosodic patterns of intonation and stress), temporal fluency, and lexicogrammar to the ability to comprehend non-native speech (Hansson, 1985; Saito et al., 2016a; Saito et al., 2016b). Indeed, in legal settings, testimony delivered with an accent can hinder comprehension (Wingstedt & Schulman, 1984). This phenomenon has been explained in terms of observers’ processing fluency (i.e., the ease of processing information; Alter & Oppenheimer, 2009). Specifically, the fluency principle states that the ease with which observers process speech is used as a metacognitive cue to language attitudes, such that disruptions in observers’ processing fluency (e.g., due to a speaker's accent) can negatively bias their attitudes toward speakers (Dragojevic et al., 2017).
The impact of certain linguistic variables on comprehensibility has also been found to vary based on the speaker's proficiency level. For example, among beginner speakers, speech rate, prosody, and vocabulary were the strongest correlates, whereas segmental accuracy, prosody, and grammar were the most important for intermediate and advanced speakers (Saito et al., 2016a).
Comprehensibility has also been linked to deception. In one study, low comprehensibility led to low credibility ratings (Hansson, 1985). In another, low comprehensibility reduced observers’ ability to detect deception accurately (Burgoon et al., 2016). Thus, observers’ perceptions of how well they understand native and non-native speakers may contribute to their biases and the accuracy of their judgments.
Observers’ Linguistic Backgrounds
Observers’ perceptions of non-native speech may also depend on their own linguistic backgrounds. Early speech perception work suggested that familiarity with accented speech could improve its comprehensibility (e.g., Gass & Varonis, 1984); however, subsequent research yielded mixed results. Some have found that exposure enhances comprehensibility (Tauroza & Luk, 1997; Tsurutani & Selvanathan, 2013), while others have not (Babel & Russell, 2015; Munro et al., 2006; Powers et al., 1999). However, observers can perceive accents differently depending on their language teaching history (Kang et al., 2016). In some studies, lay observers rated non-native speech more harshly than trained language assessors (Barnwell, 1989) and language teachers (Kang & Rubin, 2009); in others, language teachers felt more lenient than did non-teachers when rating non-native speech (Huang, 2013). Therefore, observer factors should be considered when examining the influence of language proficiency on social processes such as deception detection.
The Present Research
Do observers’ impressions of speech characteristics affect deception detection? Evidence across multiple fields suggests that they might; however, the roles of each component have not been tested explicitly. We synthesized work from the deception detection and linguistics literatures to investigate how observers’ perceptions of speakers’ accentedness, temporal fluency, lexicogrammar, and comprehensibility affected their veracity judgments. First, we collected videotaped interviews of a diverse sample of native and non-native English speakers who were asked to lie or tell the truth about witnessing a scene. Second, we showed the video clips to native English-speaking observers who made deception and speech perception judgments about the speakers. We aimed to replicate previous findings (e.g., Elliott & Leach, 2016) regarding how proficiency levels, as determined by standardized language proficiency assessments, affected deception detection. Then, we examined the ability of speech dimensions to predict observers’ ability to discriminate between lie- and truth-tellers, as well as their response bias.
Hypotheses
Method
Phase 1: Speakers’ Lie and Truth Production
A 2 (Veracity: lie vs. truth) × 3 (Proficiency: beginner vs. intermediate vs. native English) between-subjects design was used. Speakers from three proficiency groups were randomly assigned to lie or tell the truth in English.
Non-native English speakers were recruited from the Ontario Tech University English Language Center and other language training centers in the area that participate in Language Instruction for Newcomers to Canada (LINC) or English as a Second Language (ESL) programs. These programs use standardized English testing known as the Canadian Language Benchmarks (CLB; Centre for Canadian Language Benchmarks, 2012). Thus, all non-native speakers’ proficiencies were determined by their language instructors’ assessments. Non-native English speakers from the University's language center were awarded 3% credit toward their weekly Language Workshops in exchange for participation, and speakers from other language centers were paid $15 as compensation. Native English speakers were recruited from the psychology participant pool at Ontario Tech University and received course credit in exchange for participation.
The speaker sample was predominantly female (64.81%), and the mean age was 23.06 years (SD = 6.84). Speakers self-identified as Latin American (28.70%), Chinese (18.52%), Black (14.81%), Arab/West Asian (10.19%), South Asian (10.19%), Southeast Asian (5.55%), White (3.70%), Filipino (2.78%), Hispanic (1.85%), Japanese (0.93%), and Other (2.78%). Within this sample, beginner speakers were mainly female (66.67%) with a mean age of 23.42 (SD = 5.77), and self-identified as Latin American (44.44%), Chinese (22.22%), Black (11.11%), Arab/West Asian (8.33%), South Asian (5.56%), Southeast Asian (5.56%), and Hispanic (2.78%). Intermediate speakers were also mostly female (61.11%), with a mean age of 25.53 (SD = 9.30), and self-identified as Latin American (36.11%), Chinese (22.22%), Arab/West Asian (16.66%), Black (11.11%), South Asian (5.56%), Southeast Asian (2.78%), Hispanic (2.78%), and Japanese (2.78%). The native speaker sample was similarly female (66.67%), though slightly younger than the intermediate sample with a mean age of 20.25 (SD = 2.98), and somewhat more ethnically diverse than the non-native groups. Native speakers self-identified as Black (22.22%), South Asian (19.45%), Chinese (11.11%), White (11.11%), Southeast Asian (8.33%), Filipino (8.33%), Latin American (5.56%), Arab/West Asian (5.56%), and Other (8.33%).
Materials
Stimuli. Previous research has shown that deception detection performance does not significantly differ when observers are presented with audiovisual or audio-only stimuli (e.g., Akehurst et al., 2018; Bond & DePaulo, 2006; George et al., 2018). Thus, to maximize ecological validity, we selected an audiovisual paradigm for our speaker video stimuli. In the suspicious event paradigm, speakers watched one of two videotaped events: the Innocuous or Suspicious event. The videos for both events displayed a computer desk with various office supplies and personal belongings. The camera zoomed in on various areas of the desk and wall, revealing pictures, newspaper clippings, a map, and a calendar. In the Innocuous event, these items were meant to replicate a standard office setting; in the Suspicious event, the items indicated a potential bomb plot. Each video event showed an equal number of items, with the critical Suspicious items (e.g., bomb-making instruction manual) substituted with comparable Innocuous items (e.g., exhaust vent installation manual). The Suspicious and Innocuous event videos were 53 and 60 s long, respectively.
Interview questions. Speakers were asked open- and closed-ended questions about what they saw in the video that grew increasingly specific throughout the interview (e.g., “What did you see on the wall?”, “Where was the gun?”).
Demographics questionnaire. Speakers were asked to provide their age, gender, race, and English language proficiency (e.g., “What language[s] do you consider your native [or first] language[s]?”, “How many years have you been speaking English?”).
Experimental questionnaire. 1 Speakers completed a 19-item questionnaire that assessed cognitive load, emotionality, and motivation. In addition, speakers indicated whether they thought that the interviewer believed their account and whether they would prefer to be interviewed in their native language or their non-native language (i.e., English). Finally, speakers completed an attention check to ensure that they attended to the critical items in each video.
Procedure. Sessions were conducted in a private testing room at the University or language center. Speakers were individually greeted by a female experimenter who was blind to condition and then seated at a computer. After the experimenter explained the requirements of the study, she began the MediaLab program (Jarvis, 2014, 2018), entered a randomly assigned participant number, and left the room. Speakers were randomly assigned to watch either the Innocuous or Suspicious video. They were given on-screen instructions to testify that they viewed a typical office scene. That is, half of the speakers were asked to tell the truth, as they had seen the Innocuous video, and half were asked to lie, as they had seen the Suspicious video. The instructions stated that if the participant convinced the experimenter about what they had seen, they would be entered into a draw to win $50. In fact, all speakers were entered into the draw. After 2 min, the experimenter returned to conduct the interview. Then, the speaker completed the demographics and experimental questionnaires. The entire experiment lasted between 30 and 60 min, depending on the speaker's level of English proficiency.
Attention check. To ensure that speakers attended to the videos, we conducted a one-way analysis of variance (ANOVA), with proficiency as the independent variable, on the number of critical items that speakers correctly identified as present in the video. There was a significant proficiency effect, F(2, 105) = 5.07, p = .008, ηp² = .09, 95% CI [.01, .19]. Pairwise comparisons using a Bonferroni correction revealed that native speakers performed slightly better than intermediate speakers, p = .006, d = .72, 95% CI [.05, 1.39]. There were no differences between beginner speakers (M = 4.44, SD = 1.05) and intermediate (M = 4.08, SD = 1.13), p = .560, d = .33, 95% CI [−.33, −.99] or native speakers (M = 4.94, SD = 1.26), p = .272, d = −.43, 95% CI [−1.09, .23].
Phase 2: Observers’ Deception Detection
As in Phase 1, we used a 2 (Veracity: lie vs. truth) × 3 (Proficiency: beginner vs. intermediate vs. native English) mixed-factors design, with veracity as the within-participants measure. Observers were randomly assigned to watch a series of 12 videotaped interviews of truth- and lie-tellers from one of the three proficiency groups.
The observer sample was limited to participants who had no history of a hearing or speech disorder, identified English as their first and native language, and rated their English proficiency, including listening and speaking abilities, as the highest possible on a prescreen measure (i.e., 5 out of 5). Those who failed to meet these criteria (n = 77) were excluded from analyses, as were those who did not adhere to instructions during the experiment (n = 8) or experienced technical errors (n = 4). After exclusions, data from 122 observers were analyzed. Because the participant pool requires students to sign up for sessions in advance, all registered students were permitted to participate as per ethical guidelines, and our final sample size was slightly larger than that specified by the power analysis.
Observers were predominantly female (61.48%), and their mean age was 20.40 years (SD = 4.43). Observers self-identified as White (49.18%), South Asian (16.39%), Black (11.48%), Multiracial (6.56%), Arab/West Asian (4.92%), Southeast Asian (3.28%), Indigenous (2.46%), West Indian (2.46%), Chinese (0.82%), and Latin American (0.82%), and Other (0.82%).
Materials
Speaker videos. The 108 videotaped interview clips from Phase 1 were used to generate nine randomized sets of 12 clips (six truth-tellers and six lie-tellers), with three sets per English proficiency category. The video sets ranged from 31 min and 26 s to 55 min and 47 s. Speakers were matched for demographic characteristics across proficiency categories where possible, rather than by clip length, so the length of the video sets differed from one another, Welch's F(8, 40.96) = 3.89, p = .002, est. ω² = .18. Notably, the mean clip length (in seconds) for one of the intermediate speaker sets (M = 157.17, SD = 58.89) was significantly shorter than one of the other intermediate sets (M = 263.08, SD = 127.12), p = .034, as well as one of the beginner sets (M = 278.92, SD = 109.46), p = .007. One native speaker set (M = 160.50, SD = 37.56) was also significantly shorter than the beginner set. There were no other differences in length between the remaining sets of clips.
Deception detection. After watching each video clip, observers were asked whether they believed the speaker was lying or telling the truth. They were also asked to indicate their confidence in each judgment (0% = not at all confident, 100% = extremely confident). 2
Speech ratings. Observers were asked to rate their perceptions of each speaker on four speech dimensions. Using 9-point Likert-type scales (1 = not at all, 9 = very), observers were asked, “How strong was the speaker's accent?”, “How fluid was the speaker's speech?”, “How correct was the speaker's use of vocabulary and grammar?”, and “How easy was it for you to understand the speaker?”. Preliminary analyses revealed that these four speech variables demonstrated high multicollinearity (see Table 1). This was unsurprising, as previous work established that these variables are related (Derwing & Munro, 1997; Kang, 2010; Munro & Derwing, 1995). Thus, we created a composite dependent variable of overall speech score, representing the mean of all scores assigned to a speaker by observers who viewed that speaker.
Descriptive Statistics and Intercorrelations for Speech Characteristics, Discrimination, and Bias.
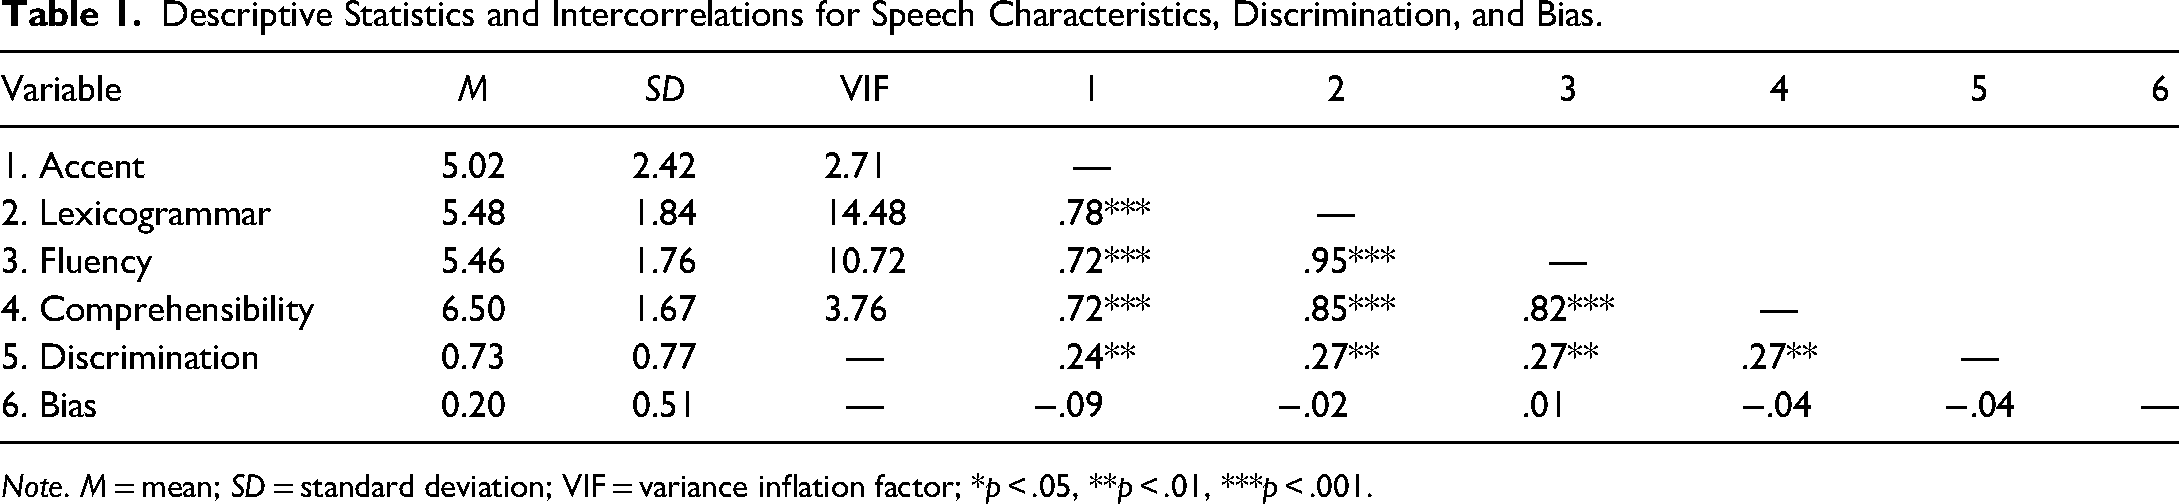
Note. M = mean; SD = standard deviation; VIF = variance inflation factor; *p < .05, **p < .01, ***p < .001.
Demographics questionnaire. Observers completed the same questions as in Phase 1.
Language experience questionnaire. We asked observers to indicate any experience teaching English, its duration, and the native language(s) of the learners. Finally, we asked how often observers used another language with native or non-native speakers of that language (1 = daily, 2 = several days a week, 3 = weekly, 4 = bi-weekly, 5 = monthly, 6 = every few months,; 7 = once or twice a year, 8 = less than once or twice a year).
Procedure. Observers were seated at computer stations in the lab. A female experimenter explained the study, entered randomly assigned participant and condition numbers into MediaLab (Jarvis, 2014), and began the program. Next, on-screen instructions were presented. Then, each observer watched 12 videos (i.e., six truth-tellers and six lie-tellers from one proficiency category). After each video, observers made a dichotomous deception judgment and four speech ratings about the speaker. The task order was counterbalanced. Finally, observers completed the demographics questionnaire. The study took approximately 1.5 h to complete.
Results
Preliminary analyses included observers’ age, gender, and race as potential covariates. These variables have been non-significant in previous research examining proficiency and deception detection (e.g., Elliott & Leach, 2016; Leach et al., 2017), and we expected the same pattern here. For all analyses but one, demographic variables were non-significant; however, gender appeared to affect discrimination. The following results include gender in analyses conducted on discrimination, and data are collapsed across age, race, and gender for all other analyses.
Signal Detection Analyses
Signal detection theory (Green & Swets, 1966) allows deception detection accuracy to be separated into measures of discrimination (i.e., d′) and response bias (i.e., criterion c). Discrimination is the ability to correctly detect the presence of a signal (e.g., a lie) and reject the absence of the signal (e.g., the truth),
3
whereas bias is the tendency to select one response over another (e.g., those who select truth more often than lie would be said to show a ‘truth bias’).
4
Per Macmillan and Creelman (2005), discrimination was calculated as
One-sample t-tests were also conducted to compare d′ to 0 (i.e., no sensitivity) to determine whether discrimination ability differed from chance. Observers’ discrimination was above chance for beginner, t(41) = 3.51, p < .001, d = 0.54., 95% CI [0.22, 0.86], intermediate, t(40) = 7.97, p < .001, d = 1.24, 95% CI [0.83, 1.65], and native speakers, t(38) = 7.69, p < .001, d = 1.23, 95% CI [0.81, 1.64].
Using one-sample t-tests, we compared c to 0 (i.e., no bias). Observers exhibited a significant truth bias when viewing beginner speakers, t(41) = 5.10, p < .001, d = 0.79, 95% CI [0.44, 1.13], and no bias when viewing intermediate speakers, t(40) = 1.22, p = .229, d = 0.19., 95% CI [−0.12, 0.50] or native speakers, t(38) = 1.52, p = .138, d = 0.243., 95% CI [−0.08, 0.56].
Speakers’ Linguistic Differences
We examined whether observers reported perceptible differences in speakers’ accentedness, fluency, lexicogrammar, comprehensibility, and overall speech scores across proficiency levels. Accentedness scores were reverse coded so that, for all variables, a score of 1 indicated the least native-like characteristic and 9 represented the most native-like characteristic. Proficiency had a significant effect on how observers perceived speakers’ accentedness, F(2, 104) = 322.03, p < .001, ηp² = .86, 95% CI [0.81, 0.89], fluency, Welch's F(2, 66.69) = 109.46, p < .001, ηp² = .77, 95% CI [.66, .82], lexicogrammar, F(2, 65.02) = 194.95, p < .001, ηp² = .86, 95% CI [.79, .89], comprehensibility, F(2, 61.77) = 159.82, p < .001, ηp² = 0.84, 95% CI [0.75, 0.88], and overall speech score, F(2, 64.41) = 249.99, p < .001, ηp² = 0.88, 95% CI [0.83, 0.91]. Significant differences between beginner and intermediate speakers, intermediate and native speakers, and beginner and native speakers were found across all categories except beginner and intermediate speakers’ accentedness (Figure 1).
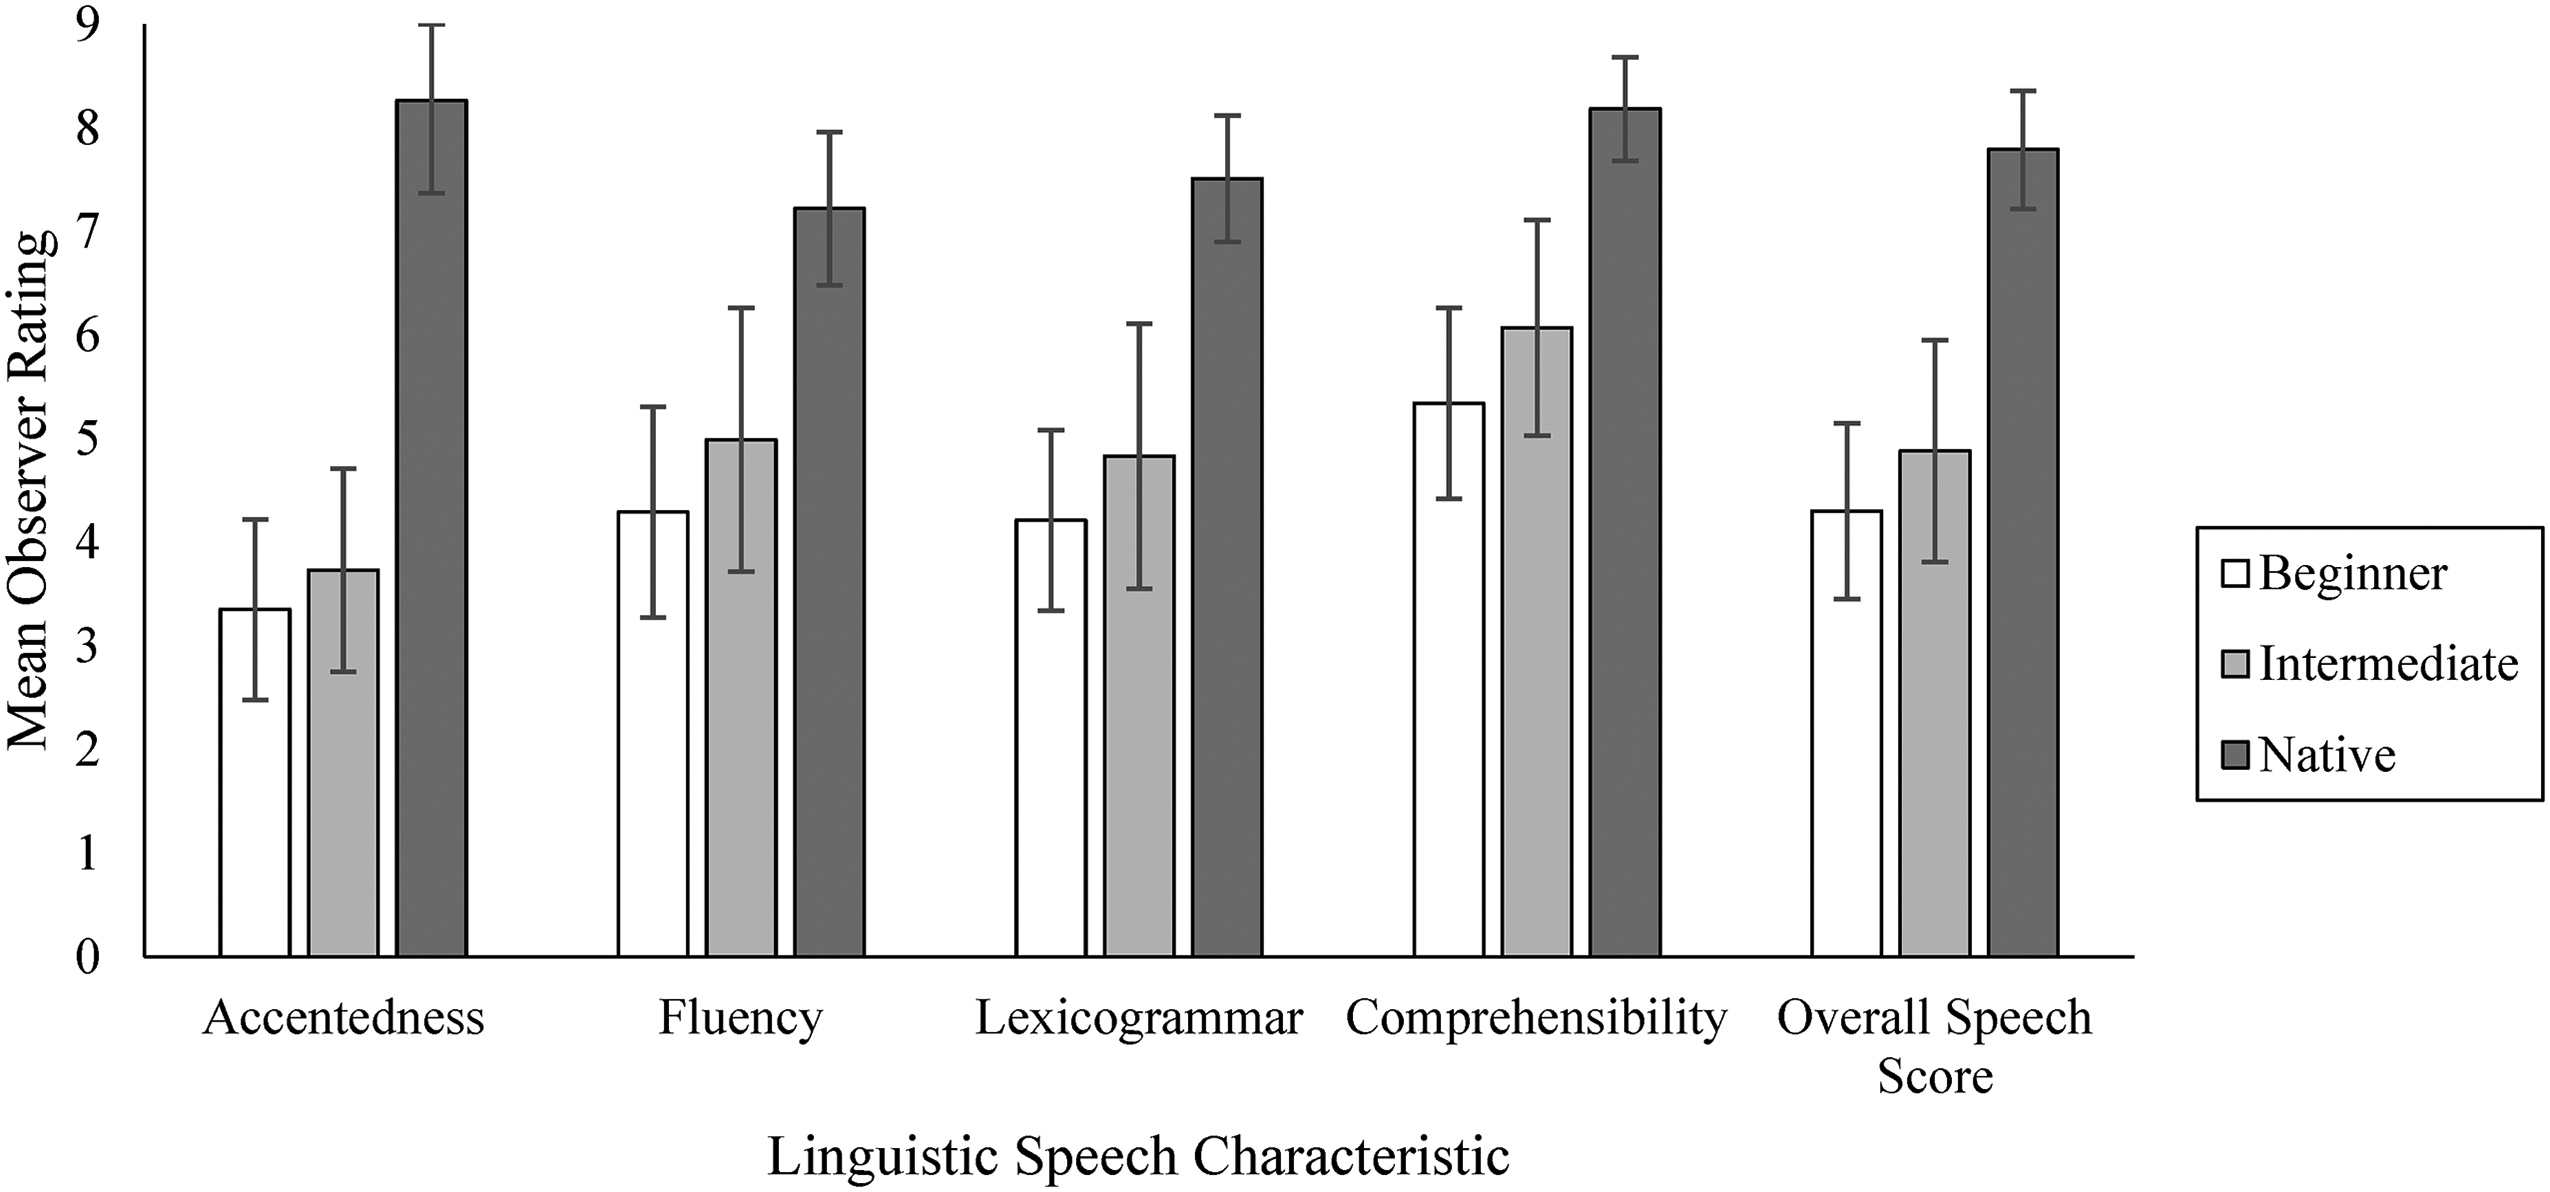
Speech characteristics as a function of proficiency.
Standardized proficiency levels (i.e., assignment to proficiency level using Centre for Canadian Language Benchmarks [2012]) captured some, but not all, of the variability in linguistic speech characteristics. Thus, we chose to explore the effects of the characteristics independently rather than artificially constraining the data by examining characteristics within each proficiency level. The speech variables demonstrated high multicollinearity, and two had variance inflation factors that exceeded 10 (Shrestha, 2020). As such, we used ridge regression (Hoerl & Kennard, 1970) to examine the unique variance in observers’ discrimination and response bias that could be accounted for by perceptions of speakers’ accentedness, fluency, lexicogrammar, and comprehensibility (see Table 1 for descriptives and intercorrelations). We split the dataset into random training (70%) and test groups (30%). Two ridge regressions were run on discrimination and bias, respectively. Using the
Model Coefficient Estimates of Speech Characteristics and Gender for Discrimination and Bias.
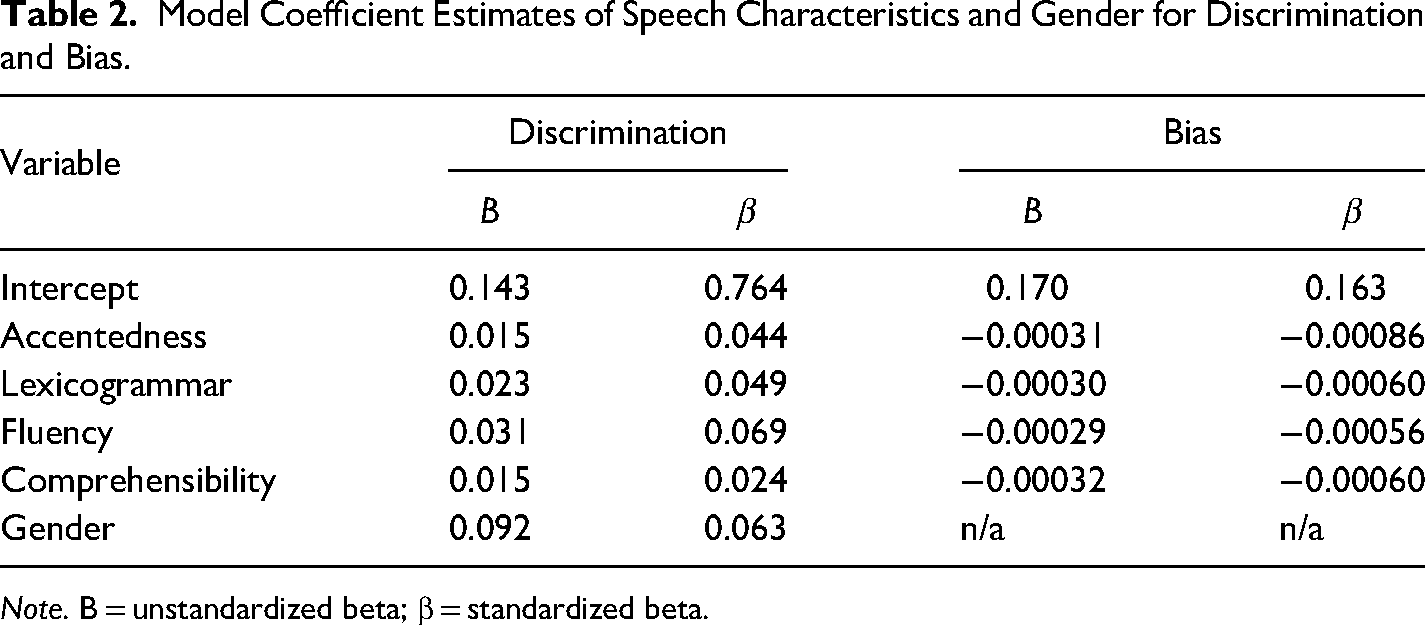
Note. B = unstandardized beta; β = standardized beta.
The ridge trace plots are shown in Figure 2. These plots visualize how β estimates change with increasing λ, such that the faster a coefficient shrinks toward 0, the less important it is in predicting the outcome. In the discrimination model, the coefficient for lexicogrammar shrunk the fastest, despite having a larger B coefficient. Lexicogrammar was followed by comprehensibility, then accentedness. The strongest linguistic predictor was fluency. Overall, the slowest shrinking, or strongest predictor in the model, was gender.
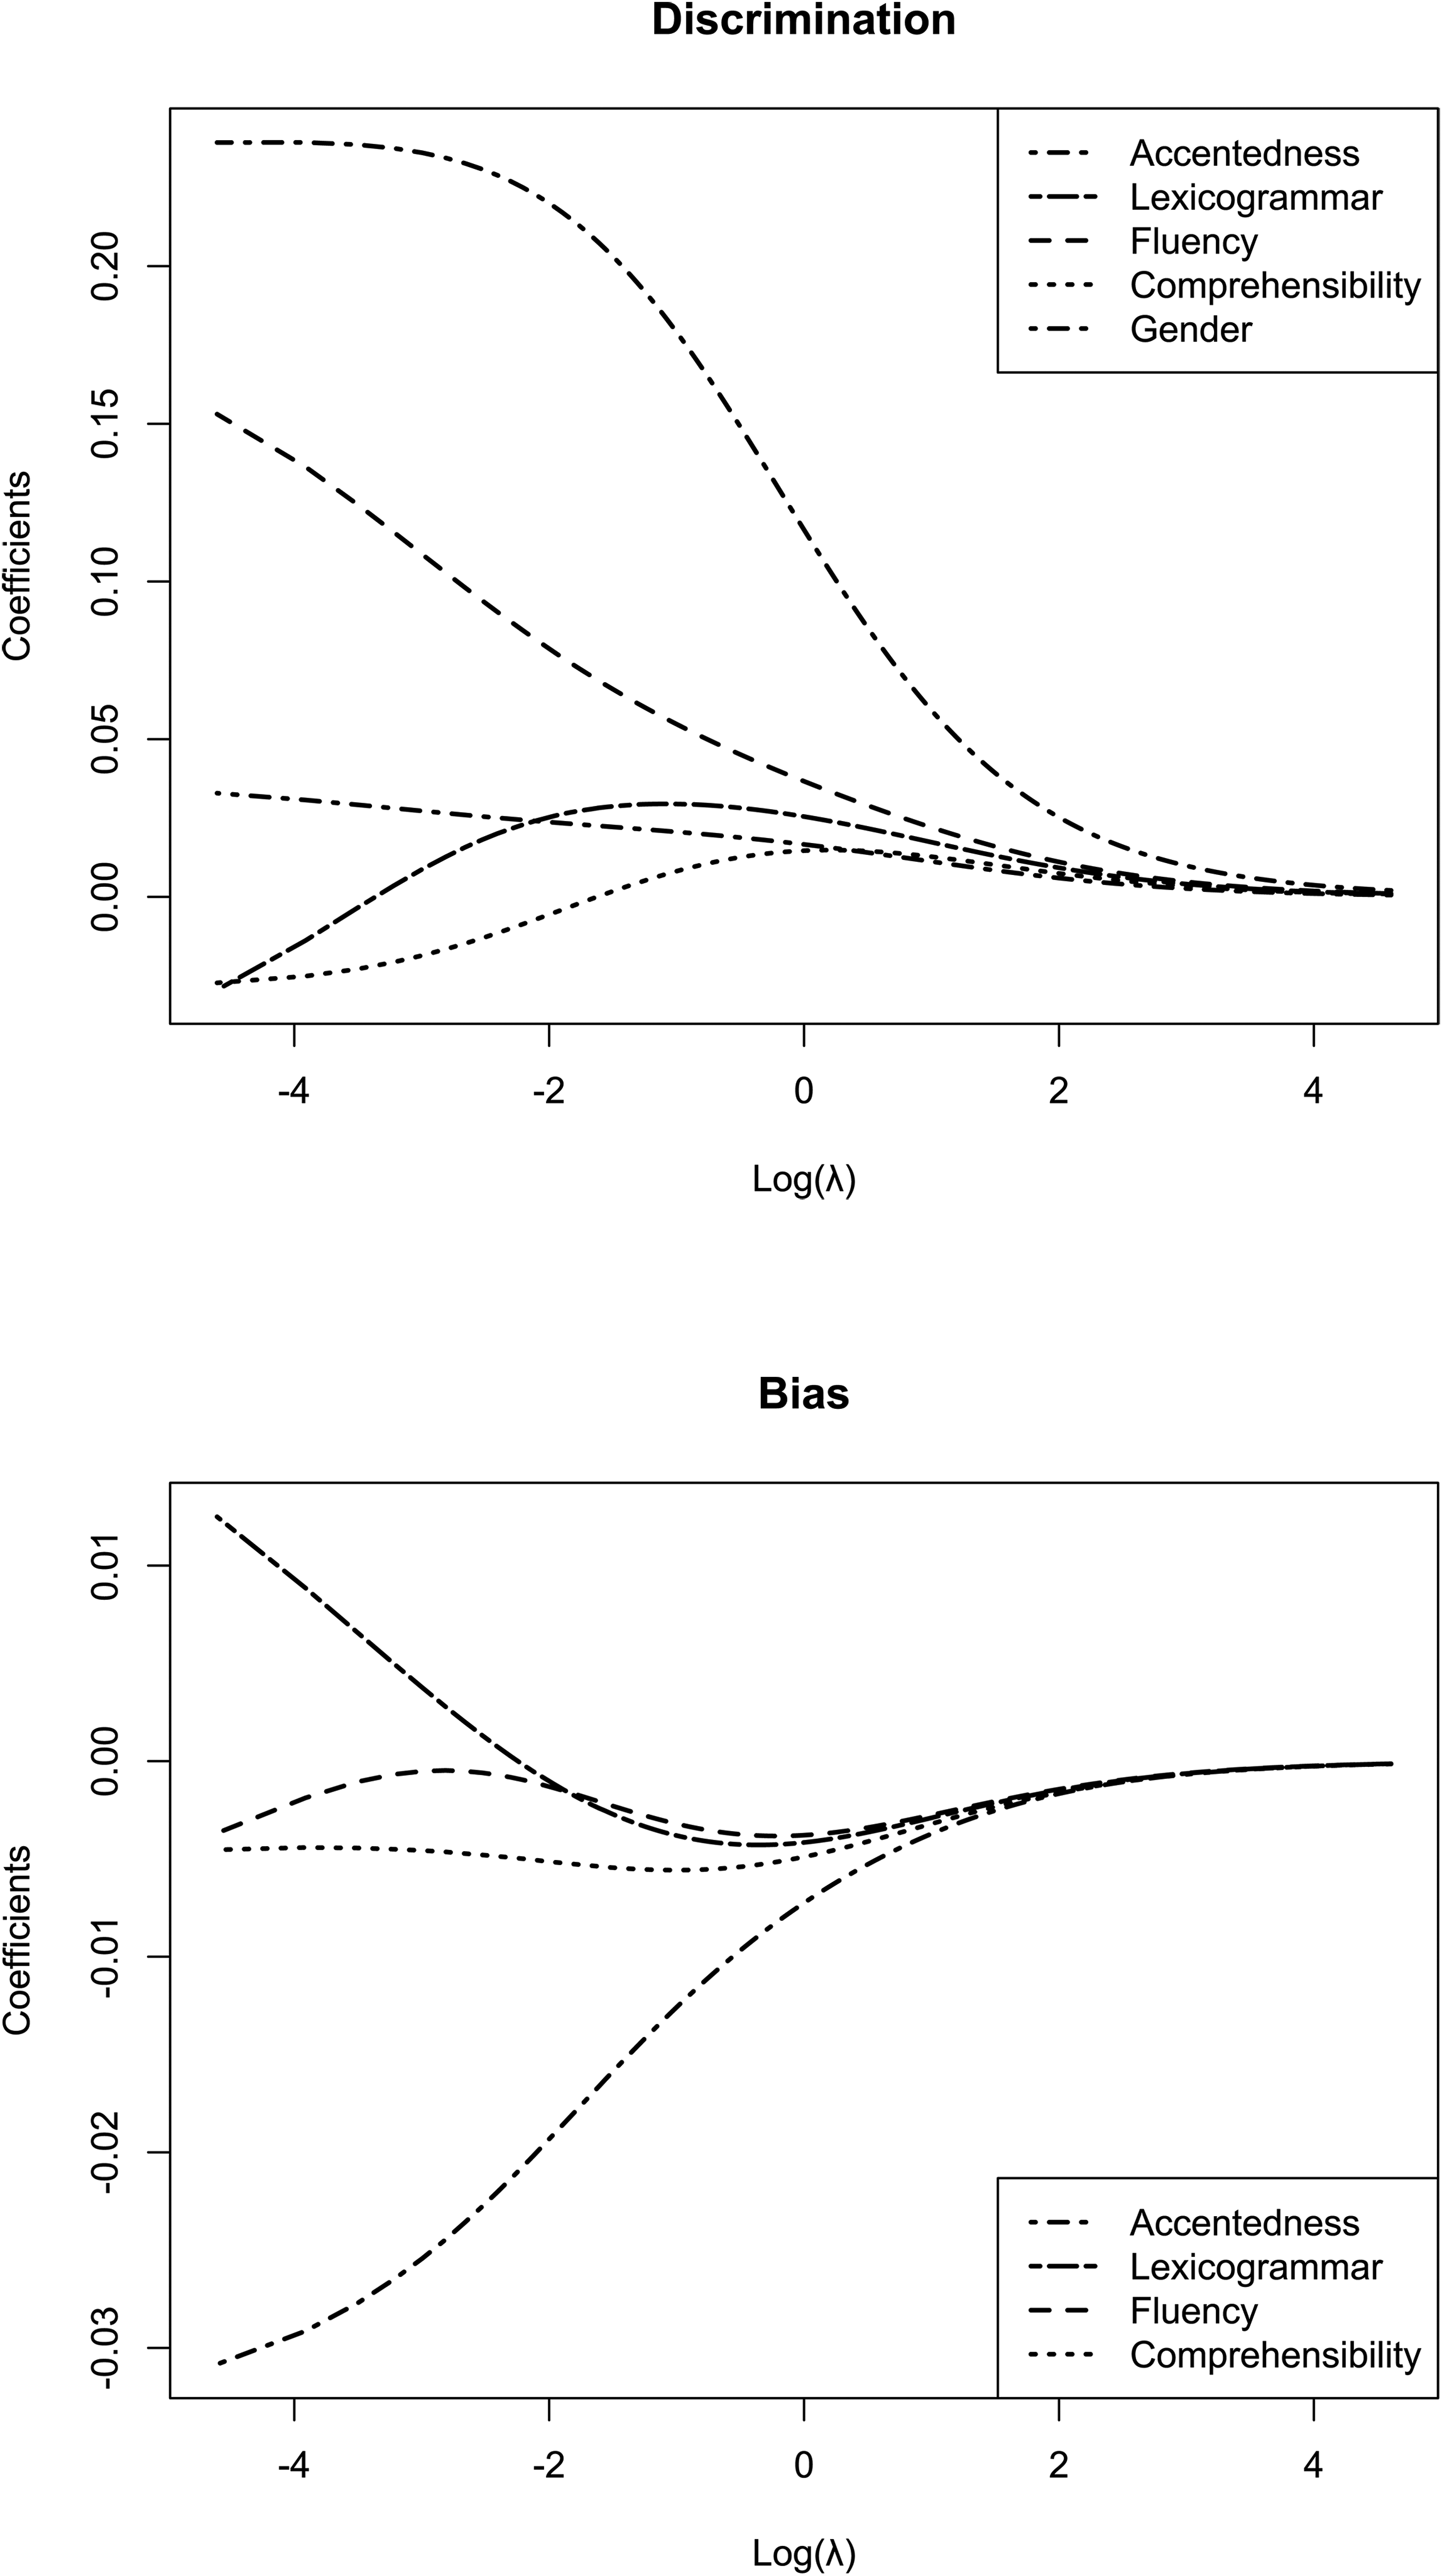
Ridge trace plots of changes in standardized coefficient estimates as a function of λ.
The R2 value and root mean squared error (RMSE) for the training data were 0.099 and 0.718, respectively. Thus, the model did not fit the data particularly well: slightly less than 10% of the variance in discrimination was explained by observers’ perceptions of speakers’ linguistic characteristics. Comparatively, the test data R2 and RMSE were 0.051 and 0.771. Ideally, the test RMSE should be lower than the training RMSE, which would suggest that the model generalized well from the training data to the test data. However, it increased, indicating poor model fit. The test RMSE was lower than the SD of d′ (0.80), indicating that the model's predictions were slightly more accurate than a naïve prediction based on the mean of d′. Overall, the pattern of results for the coefficient estimates showed support for our hypotheses. When observers perceived greater temporal fluency, more lexicogrammatical correctness, less accentedness, and more comprehensible speech, they could better discriminate between lie- and truth-tellers. However, the relative size of the coefficients for gender combined with the overall weak model fit suggest that linguistic facets of speech were not especially strong predictors of deception detection.
In the bias model, the R2 and RMSE values for the training data were 0.001 and 0.506, respectively. This means that the model could only explain a meager 0.1% of the variance in response bias. The test values were −0.067 and 0.524. A negative R2 value and a test RMSE greater than the SD (0.51) indicate that the predictions made by the model were less accurate than one based on the mean of criterion c. Overall, the poor model fit did not support the hypothesis that perceptions of speakers would predict observers’ degree of response bias.
Observers’ Linguistic Backgrounds
We included three predictors from the language experience questionnaire in a multiple regression on observers’ ratings of speakers’ comprehensibility: degree of exposure to non-native English, familiarity with non-native English speakers, and experience speaking a non-native language with other native speakers of that language. Responses for each variable were recoded into three equal-sized bins (i.e., 1 = low, 2 = medium, 3 = high). The regression model was not significant, F(3, 118) = 0.042, p = .988, ηp² = 0.001, 95% CI [0.00, 0.01].
We also conducted an exploratory analysis examining the influence of prior English teaching experience on observers’ perceptions. We performed a one-way MANOVA, with experience teaching English as a second or foreign language as the independent variable, on observers’ perceptions of speakers on the four dimensions of accentedness, temporal fluency, lexicogrammar, and comprehensibility. The results only approached significance, F(4, 117) = 1.80, p = 0.058, Wilks’ Λ = 0.942, ηp² = 0.06, 95% CI [0.00, 0.13].
Finally, ANOVAs were performed on observers’ discrimination and bias. First, a two-way ANOVA was conducted, with gender and English teaching experience as the independent variables, on discrimination. As expected, the effect of English teaching experience on discrimination was not significant, F(1, 118) = 0.594, p = .442, ηp² = 0.005, 95% CI [0.00, 0.06]. The effect of gender was also not significant, F(1,118) = 3.64, p = .059, ηp² = 0.03, 95% CI [0.00, 0.11], and there was no significant interaction, F(1,118) = 0.37, p = .545, ηp² = 0.003, 95% CI [0.000, 0.05]. Contrary to expectation, neither was the effect on bias, F(1, 120) = 1.08, p = .301, ηp² = 0.01, 95% CI [0.00, 0.07].
Discussion
We explored whether observers’ perceptions of speakers’ linguistic characteristics could account for the proficiency bias disadvantage that non-native speakers often experience during deception detection. Observers readily perceived differences between all proficiency groups on measures of temporal fluency, lexicogrammar, and comprehensibility. They also detected differences between native and non-native speakers in terms of accentedness. This suggests that these elements of non-native speech characteristics can be identified not only by using specialized equipment or coding but also by untrained laypeople in real time.
Indeed, as we predicted, there was a significant decrease in observers’ discrimination ability when viewing beginner compared to intermediate and native speakers. Interestingly, discrimination was above chance for all proficiency groups. While past research has shown that observers can perform above chance when judging low-proficiency speakers (Evans et al., 2017) or native and intermediate speakers (e.g., Elliott & Leach, 2016), it is unusual for observers to exceed chance for all proficiency levels in a single study. That said, our results showed that observers discriminated between intermediate and native speakers equally well but were less able to detect beginner speakers’ deception, demonstrating that proficiency differences did affect detectability.
Several possibilities have been proposed. First, the negative qualities ascribed to people who speak with a stronger accent may contribute to why they are perceived less fairly than those who do not (Brennan & Brennan, 1981). Our results, however, suggest that observers did not perceive a difference in accent between beginner and intermediate speakers, despite exhibiting differences in discrimination ability. In other words, it is unlikely that accent alone accounted for observers’ reduced discrimination when judging beginner speakers. Second, observers might have struggled to accurately judge stimuli that were more difficult to understand (e.g., Lev-Ari & Keysar, 2010; Podlipský et al., 2016). It is possible that, upon encountering comprehension difficulties, observers misattributed them to deception rather than standard non-native speech production (which would be less salient to a native speaker). Third, according to the cognitive complexity theory, lying is more cognitively demanding than telling the truth (Vrij et al., 2008). Speaking in one's non-native (vs. native) language also uses more cognitive resources (e.g., Perani & Abutalebi, 2005; Service et al., 2002; Ullman, 2001). Given that performing two cognitively demanding tasks at once can increase cognitive load (Broadbent, 1957), it is possible that simultaneously speaking in a non-native language and lying may have created cognitive overload that affected beginner speakers’ ability to deceive.
Contrary to our hypotheses, however, observers showed a more significant truth bias toward beginner English speakers compared to intermediate speakers but not native speakers. In other words, beginner English speakers were judged differently relative to their more proficient counterparts. Although we expected native observers to judge native speakers more favorably, our results partially replicated Bond and Atoum (2000) and Elliott and Leach (2022), who found that observers demonstrated a truth bias toward non-native speakers. Bond and Atoum attributed this finding to observers automatically giving low-proficiency speakers the benefit of the doubt, resulting in lower discrimination ability. Indeed, this explanation aligns with our finding that discrimination was poorest among beginner speakers.
Because observers associate native accents with trustworthiness (Fuertes et al., 2012), find non-native accents and decreased fluency distracting (Fayer & Krasinski, 1987), and associate perceived disfluency with decreased competence (Dragojevic & Giles, 2016), it stood to reason that perceptions of speakers’ linguistic characteristics would influence their judgments. Although the combined linguistic characteristics did not predict bias in our study, they did weakly predict discrimination: the more speakers’ speech reflected native-like ability, the more observers’ discrimination ability increased.
Our findings suggest that it was not merely the presence of an accent but the associated lack of temporal fluency and comprehensibility that affected deception detection. While all predictors were positively associated with discrimination and negatively associated with bias, lower perceived temporal fluency was most strongly associated with poor discrimination. This is consistent with Akehurst et al. (2018), who found that when auditory information was available to observers (vs. visual information only or transcript only), they were less able to detect non-native (vs. native) speakers’ deception, suggesting that aspects of the speech signal can interfere with deception detection. Low comprehensibility was most strongly associated with a diminished truth bias, which is in line with the theory that when processing fluency is hindered (e.g., by speakers’ strong accents, low temporal fluency, or incorrect lexicogrammar), observers may experience negative attitudes toward speakers (e.g., Dragojevic et al., 2017). However, the poor fit of our bias model precludes us from drawing conclusions about this relationship relative to proficiency categories here.
We also examined whether observers’ linguistic backgrounds affected their judgments. Surprisingly, perceptions of speaker comprehensibility were neither affected by the frequency with which observers were exposed to non-native English, their degree of familiarity with non-native English speakers, nor their experience using a language other than English with other native speakers of that language. Although our prediction was informed by the literature, the null finding is also supported by several studies. For example, Powers et al. (1999) found no effect of observers’ linguistic background on their understanding of non-native speech, and Munro et al. (2006) found that observers provide similar judgments of accentedness and comprehensibility irrespective of observer background. Most recently, Wetzel et al. (2021) found that accent familiarity did not affect observers’ ratings of speaker credibility.
One aspect of observers’ linguistic backgrounds that might have affected their ratings of speech characteristics was their experience teaching English. Our results only approached significance. It is unclear whether that was because teaching English did not afford sufficient opportunities to learn how to identify nonstandard speech characteristics as separate from cues to deception, or their knowledge was specific to the characteristics of the native language group they taught and did not generalize to speakers in this study (who spoke a variety of native languages). Kang (2012) did find that experience as a language teacher accounted for some of the variance in observers' ratings of speaker performance, but less so than the linguistic factor of speaker prosody. This may explain why variables other than observer characteristics were more impactful here.
Limitations and Future Directions
Although there is a tendency in the deception detection literature to equate language proficiency with nonoverlapping category membership, assessing linguistic competence is incredibly complex. We took a novel approach by examining perceived accentedness, temporal fluency, lexicogrammar, and comprehensibility. Each of these components, however, has a multifaceted composition. Because our models did not fit the data particularly well, there may be complex relationships or interactions between variables requiring the inclusion of more relevant features. For instance, fluency can be separated further into breakdown fluency (e.g., hesitation phenomena), speed fluency (e.g., speech rate), and repair fluency (e.g., false starts, spontaneous corrections; Skehan, 2003; Tavakoli & Skehan, 2005). It is also possible that the relationship between observers’ perceptions of speech is mediated, directly or indirectly, by comprehensibility or the related concept of processing fluency (see Dragojevic, 2020). Conversely, there may be a moderated mediation path (i.e., from linguistic speech characteristics to response bias mediated by comprehensibility and moderated by level of proficiency). Because the factors that facilitate or impede processing fluency could exert opposing influences on observers’ judgments, future work should incorporate quantitative measures of individual linguistic variables and compare the various models to explore these possibilities.
An unexpected finding was a gender difference in discrimination. Limited research has found that female observers with higher emotional intelligence are better able to detect deception (Wojciechowski et al., 2014); our findings are consistent with this suggestion. Yet, gender effects are uncommon within the deception detection literature (Aamodt & Custer, 2006; Lloyd et al., 2018; Vrij, 2008). This may be because many studies do not incorporate signal detection to examine the effects of gender on discrimination and bias separately. Additional research may be required to determine whether the gender effect is replicable or an idiosyncrasy of our study.
We also noted that our native speaker sample was somewhat younger and more ethnically diverse than our non-native speaker samples. We endeavored to match speakers across demographic characteristics as much as possible; however, native speakers were recruited from an undergraduate participant pool and tended to be younger than speakers recruited elsewhere. Given that we found a significant difference in observers’ discrimination ability between beginner and native speakers, there is a possibility that observers responded differently to the native speakers because they were more diverse or younger in age. However, most research has shown that detection accuracy is comparable across speakers, irrespective of age (Aamodt & Custer, 2006) and race or ethnicity (Bond & Atoum, 2000; Bond & DePaulo, 2006; Matsumoto et al., 2015). Thus, it is more probable that observers were influenced by speakers’ linguistic differences between proficiency levels than their demographic characteristics. Future work would benefit from exploring observers’ affective reactions toward speakers’ accents, and whether perceived solidarity or accent prestige influences deception judgments (e.g., Dragojevic, 2020; Dragojevic et al., 2021).
Finally, the results of the attention check suggest that intermediate speakers performed differently on this task than native speakers. While statistically significant, this difference was less than one item and may not be meaningful. Although there is no clear explanation for why this happened, speakers in all groups identified four items correctly.
Implications
Our work indicates that speech characteristics contribute to observers’ decreased sensitivity to non-native (vs. native) speakers’ deception. To date, researchers have explored several explanations for proficiency effects, including speakers’ cognitive demands (e.g., Evans et al., 2013) and emotionality (e.g., Elliott & Leach, 2016), and observers’ language histories (e.g., Leach et al., 2017). However, none have consistently accounted for differences in judgments of native and non-native speakers. We argue here that it may be the information contained in speech that affects deception detection. There has been limited prior work on the topic, and it primarily focused on speakers’ accents only (e.g., Lev-Ari & Keysar, 2010). Our study is the first to examine and compare multiple types of linguistic information, including temporal fluency, lexicogrammar, and comprehensibility, in addition to accentedness. More importantly, it suggests that these characteristics are highly related, and it is not solely accentedness but the entirety of the speech signal and its overall coherence that likely contributes to performance.
The existence of some proficiency effects in our study raises questions about legal decision-makers’ abilities to detect deception fairly. Our findings suggest that non-native speakers may be systematically disadvantaged. In the laboratory, observers made incorrect attributions, partly because their lack of understanding impeded their ability to reach appropriate conclusions. The same is likely to occur in legal settings, where the consequences of errors are profound. Approaches are urgently needed to restore equity by correcting misattributions of non-standard characteristics, improving familiarity with non-native accents, and facilitating overall comprehensibility (e.g., Bradlow & Bent, 2008; Gass & Varonis, 1984; Tauroza & Luk, 1997).
Conclusion
We compared how native and non-native speech characteristics were evaluated by observers and the extent to which observers’ perceptions influenced their abilities to detect deception. Observers tended to perceive beginner non-native English speakers differently than native speakers: they experienced more difficulty detecting their deception and were more likely to assume they were telling the truth. Considering the diversity of our speaker sample, this appeared to be a cross-linguistic phenomenon whereby judgments toward low-proficiency non-native speakers were less accurate when observers rated speakers based on linguistic speech characteristics, including accent, fluency, lexicogrammar, and comprehensibility.
Understanding the challenges involved in making decisions about non-native speakers is vital to improving precision when assessing non-native speakers’ deception. By examining the speech characteristics underlying language proficiency and how they are interpreted by observers in a forensic context, this study has important implications for identifying, interpreting, and accommodating language differences within and outside the legal system. This work not only contributes to growing experimental research on language and deception detection but also emphasizes how linguistic differences can contribute to disparity within the justice system.
Footnotes
Acknowledgments
The authors wish to thank two anonymous reviewers and Howie Giles for feedback that enhanced the manuscript. We also wish to thank Matthew Devlin and the English Language Centre for their support, and Megan Booth, Kaitlyn Bowman, Suba Cheliyan, Jayde De Brito, Spencer Elliott, James G. Hillman, Sarah Kirkpatrick, Jenissa Lad, Carly McDonald, Taylor Pagniello, and Katrina C. Villeneuve for their assistance in completing this research.
Declaration of Conflicting Interests
The author(s) declared no potential conflicts of interest with respect to the research, authorship, and/or publication of this article.
Funding
The author(s) received no financial support for the research, authorship, and/or publication of this article.