
Abstract
Can a set of Linguistic Inquiry and Word Count (LIWC) indicators differentiate between the UN speeches from higher-income and lower-income countries? Based on 34 years of 6,095 speeches (14,300,539 words) and dynamic income grouping, an elastic net analysis selects 18 such categories. The hypothetical explanations are discussed with four theoretical perspectives: gender-neutral language, politeness, scarcity mindset, and expectation states theory. The findings on cross-group LIWC variation provide UN-setting linguistic evidence for the theories and insights into the language of global income inequality between countries.
Keywords
The psychological reflections of cross-country income inequality are rarely discussed, and this study seeks to explore the psychological categories that can distinguish between lower-income and higher-income countries with a Linguistic Inquiry and Word Count (LIWC) analysis of 34-year linguistic samples in a UN setting. By “income inequality,” this study refers to the global wealth inequality between countries but not the wealth inequality within countries. The focus is not to compare the countries with different levels of wealth inequality, but the countries with different levels of wealth. The lower-income and higher-income countries are defined with the income categorization of the World Bank.
The rationale for selecting the UN context, a language approach, and elastic net analysis is as follows:
Concerning the understudied impact of income inequality between countries, the UN setting is chosen as the subject. Even within the United Nations, whose Sustainable Development Goal 10 is Reduced Inequalities (United Nations, 2022), inequality can be pervasive. The language approach is chosen because language styles can “reflect and reinforce” social inequalities (Hollander & Abelson, 2014, p. 186) in this context where it may be difficult to directly interview or survey the national leaders that deliver speeches. The elastic net analysis is used due to its ability to operate with no preliminary assumptions, select the categories that can best differentiate between income groups, and deliver a tested model of multidimensional indicators of national income. This is helpful for understanding the multiplicities of stylistic variation (Giles, 2001).
Focused on the United Nations General Debate (UNGD), this study seeks to use LIWC linguistic analysis to explore a set of psychological categories that can distinguish between lower-income and higher-income countries. The categories are then analyzed, and six patterns are identified and discussed with four theoretical perspectives related to social psychology: gender-neutral language, politeness, scarcity mindset, and expectation states theory. The following section displays the corpus, the measures, and the procedures of the LIWC analysis.
Data and Methods
The LIWC method is adopted for naturally occurring speech as it may avoid observer bias or interviewer effect. The following sections introduce the linguistic material (corpus), the measurements of linguistic variables (LIWC-22) and the socioeconomic variable (income group), and the procedures of statistical analysis.
Corpus
The linguistic material is from an existing corpus: United Nations General Debate Corpus (Jankin Mikhaylov et al., 2017), a publicly available dataset comprised of the speeches delivered by the member countries at the UNGD from 1970 to 2020. The UNGD statements are used by delegations to “set forth its general thinking on the topics before the conference, highlight any particular national concerns, and give advance notice of any initiative or other course of action it intends to pursue at the conference, to explain the reasons for this intention and why others might support it” (United Nations, 2012).
This corpus meets two criteria for this study's purpose. First, the speeches are representative of the countries’ diplomatic talk. The UNGD is a formal and important diplomatic setting, and as multiple speakers are covered in the corpus, the impact of individual styles is reduced. Second, the speeches are comparable between different countries. The national representatives deliver the speeches in the same context (at the UNGD) and with similar focuses in content (the important issues to the countries). The influence of these irrelevant variables is thus reduced.
As the income categorization of the World Bank started since 1987, the subjects of the analysis are the 6,095 speeches delivered from 1987 to 2020 (altogether 14,300,539 words). Among them, 2,733 speeches (6,313,579 words) are from higher-income countries, and 3,362 speeches (7,986,960 words) are from lower-income countries.
Measures
LIWC Categories
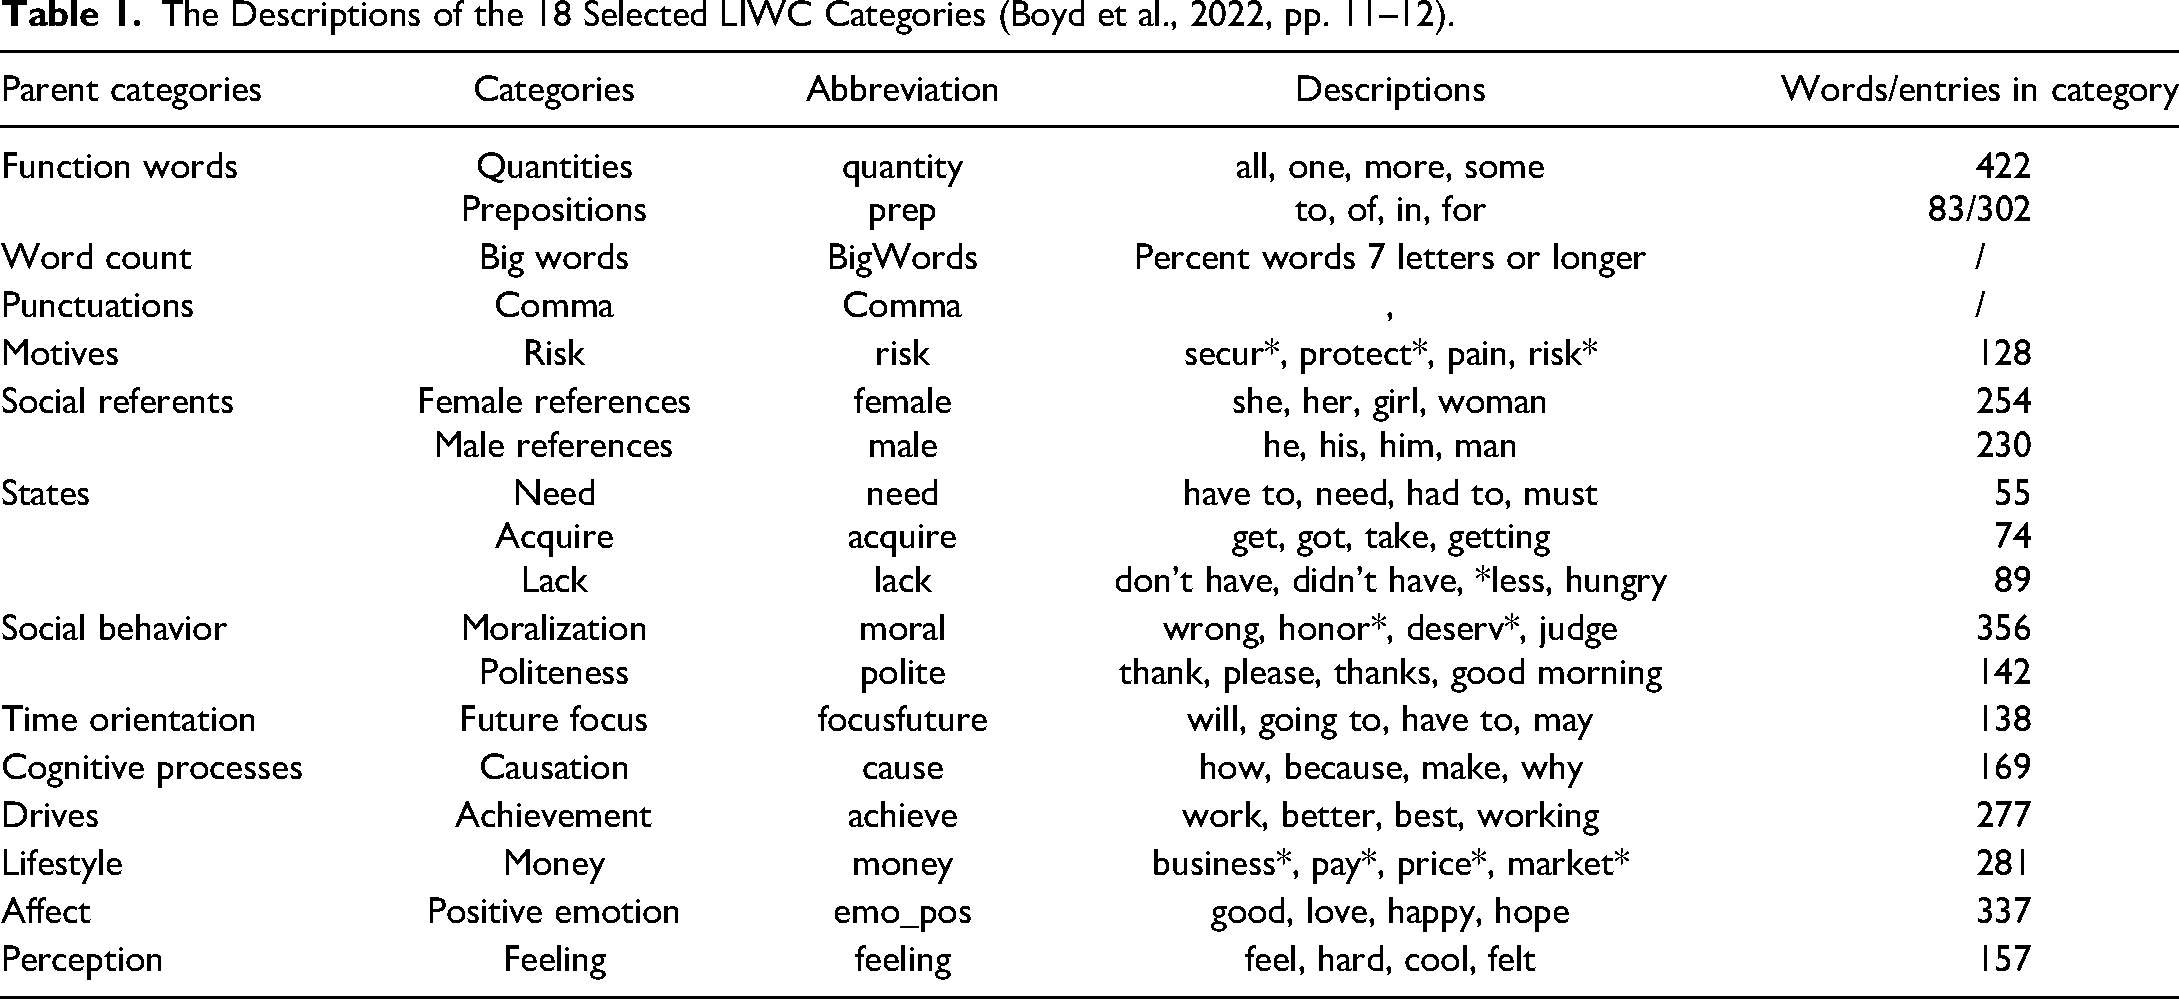
This study adopts a language approach, LIWC, to explore the psychology of verbal behavior. This approach is based on the naturally occurring data and useful for uncovering subtle differences unconsciously created by social groups (Hollander & Abelson, 2014). LIWC is based on the premise that words can tell people's psychological states. It consists of software and a dictionary, “a map that connects important psychosocial constructs and theories with words, phrases, and other linguistic constructions” (Boyd et al., 2022, p. 2). The group of words that describe a particular domain, such as risk, are referred to as “categories.” The dictionary now contains “over 12,000 words, word stems, phrases, and select emoticons” (Boyd et al., 2022, p. 5). The consistency and reliability of the dictionary have been verified by multiple studies (Robinson et al., 2013; Tausczik & Pennebaker, 2010). This study uses the latest version, LIWC-22, for analysis. Due to the limit of space, the descriptions of only the 18 selected categories are provided in Table 1, and the complete descriptions of the 117 categories can be found in the manual (Boyd et al., 2022, pp. 11–12). The normalized frequencies of the 117 categories for 6,095 speeches are available in the research data.
The Descriptions of the 18 Selected LIWC Categories (Boyd et al., 2022, pp. 11–12).
Income categorization by World Bank
The World Bank's categorization of countries by income level started in 1987, and the income groups are categorized according to gross national income (GNI), an index that is more robust than other integrated indexes such as human development index. GNI is defined as “the sum of value added by all resident producers plus any product taxes (less subsidies) not included in the valuation of output plus net receipts of primary income (compensation of employees and property income) from abroad” (World Bank, 2015). The methods to determine the threshold for each income group receive general consensus. The income grouping for each country is dynamic; for example, China was grouped among the lower-income countries from 1987 to 2009, but since 2010, its categorization has changed to higher income. This study accommodates the dynamic changes by focusing on year/country-specific income grouping, rather than just country-specific grouping. According to the World Bank, there are four income groups. As the binary categorization, better supported by the elastic net approach, can increase the number of samples in each group and improve statistical efficiency, this study combines the low income and lower middle income into the “lower-income group” and the upper middle income and high income into the “higher-income group.” The potential consequences are examined with the ordinal logistic regression.
Research Procedures
The following statistical analysis is conducted with R software (version 3.6.3).
The elastic net regression. To avoid multicollinearity, 21 parent categories among the 117 categories are deleted, and two semiredundant categories (WPS and periods) are deleted. The third-person pronouns in the male and female categories that are shared with the “shehe” category are also removed. This study adopts the elastic net regularization that combines the L1 and L2 penalties of the least absolute shrinkage and selection operator (LASSO) and ridge methods and shows better performance in correlated variables. The elastic net method with the lambda (λ) of 0.055690 is used to select the most useful predictive categories from the 94 LIWC categories. The alpha (α) is set at 0.5. This pair of λ and α is selected after multiple cross-validation runs to achieve the optimal balance between parsimony and model error.
Backward stepwise logistic regression. The categories identified by the elastic net are entered into the backward stepwise regression. The statistically significant categories are included in the final model. P < 0.05 is considered as significance.
Nomogram plotting. The nomogram is plotted to predict the individual probability of income level according to LIWC categories.
Model evaluation. An receiver operating characteristic (ROC) curve is plotted to illustrate the diagnostic ability of the model.
Ordinal logistic regression. The regression with four income levels is conducted to examine the impact of combining four income levels into dichotomous groups.
Mixed effects model. The clmm function is used to investigate the impact of time with the Ljung-Box test for autocorrelation. The diachronic changes are visualized with the ggplot2.
Results
The results of general differences tested with Mann–Whitney U tests are in Supplementary material in the online version, and the P value is false discovery rate adjusted with the limma package. Twenty potential predicators (WPS, BigWords, prep, quantity, achieve, cause, emo_pos, polite, moral, female, male, money, need, acquire, lack, risk, feeling, focusfuture, Period, and Comma) were selected from 94 categories by the elastic net regression. The backward stepwise regression is further conducted to select 18 predicators (BigWords, prep, quantity, achieve, cause, emo_pos, polite, moral, female, male, money, need, acquire, lack, risk, feeling, focusfuture, and Comma), and the odds ratio, the regression coefficient (β), and the P value are reported in Table 2.
The 18 Categories Selected by Backward Stepwise Logistic Regression.
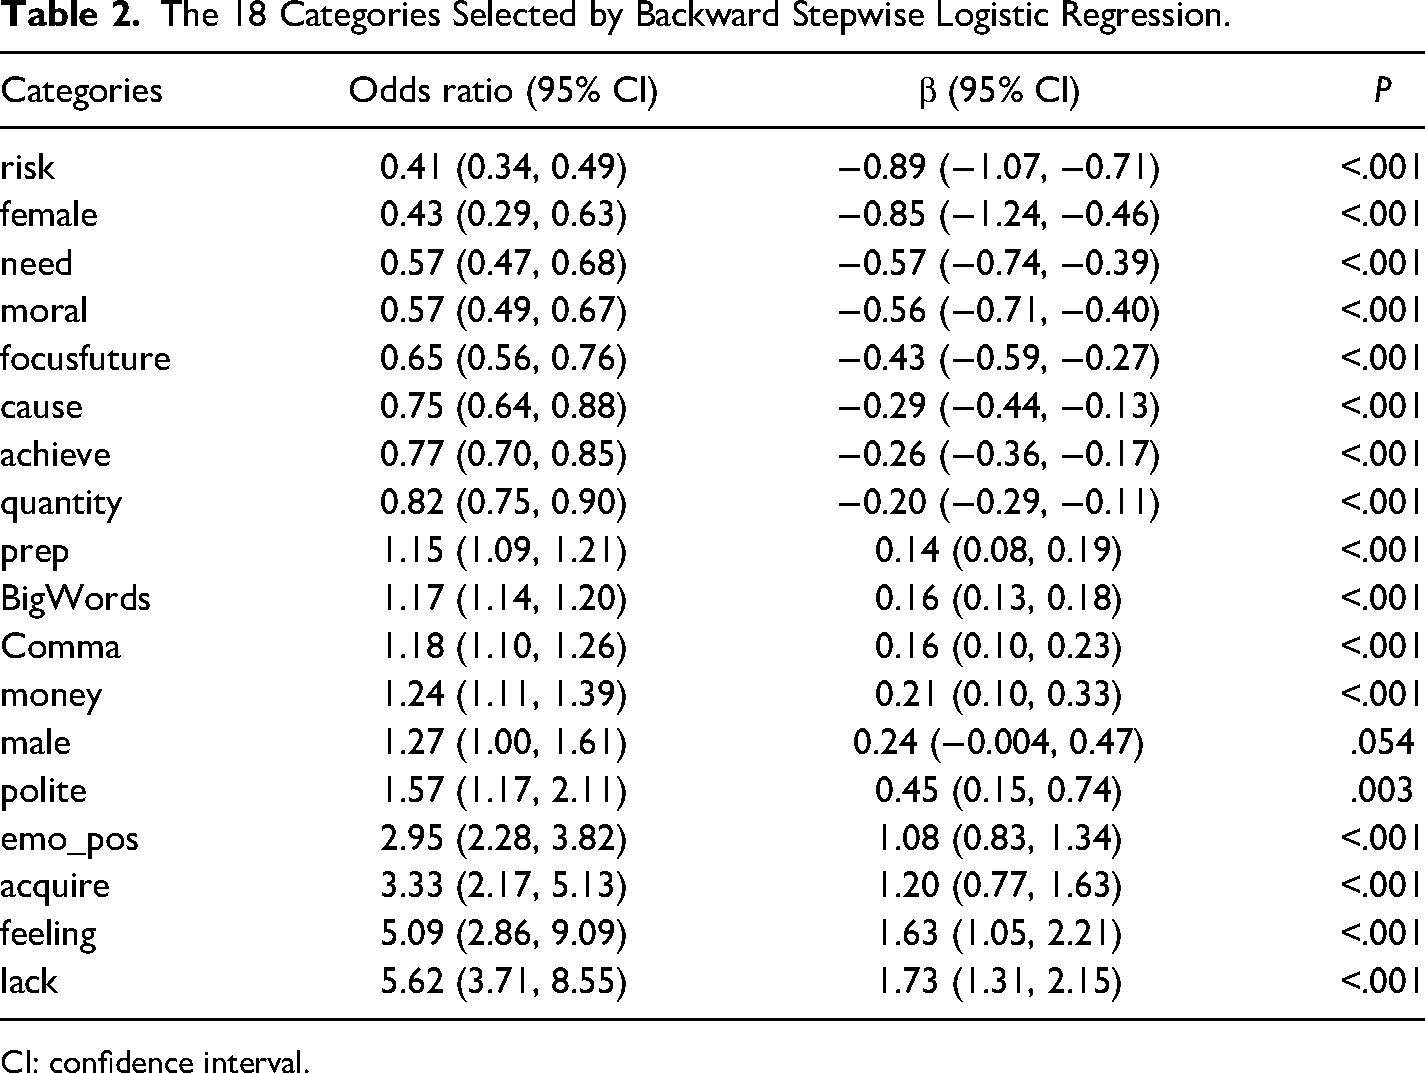
CI: confidence interval.
Lower-income countries were higher in 10 categories: prepositions, big words, commas, money, male, polite, positive emotion, acquire, feeling, and lack. Higher-income countries were higher in eight categories: risk, female, need, moral, future focus, cause, achieve, and quantity.
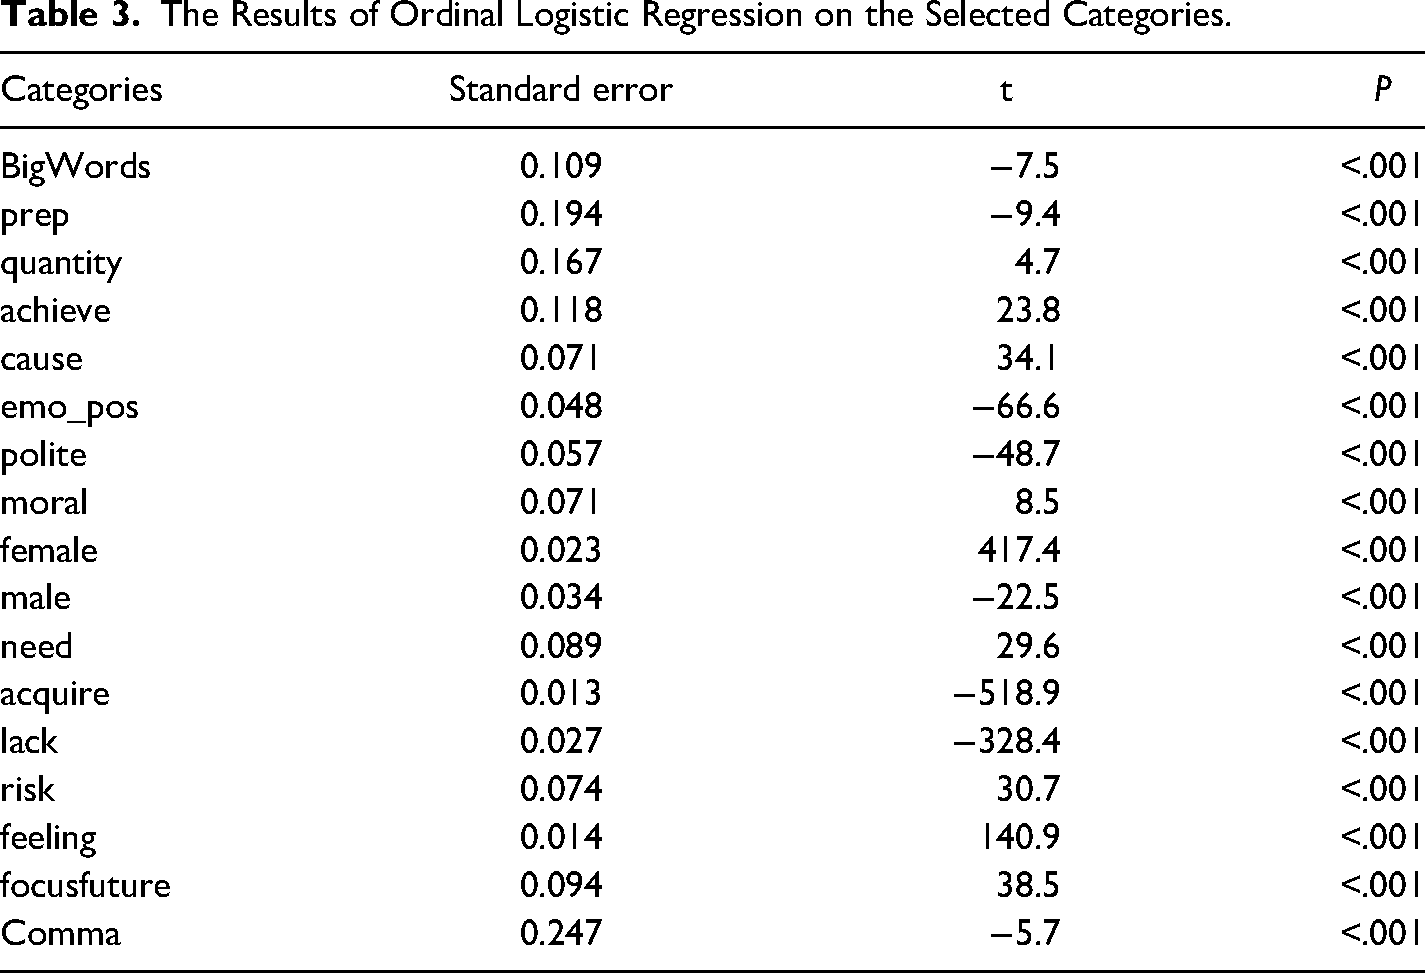
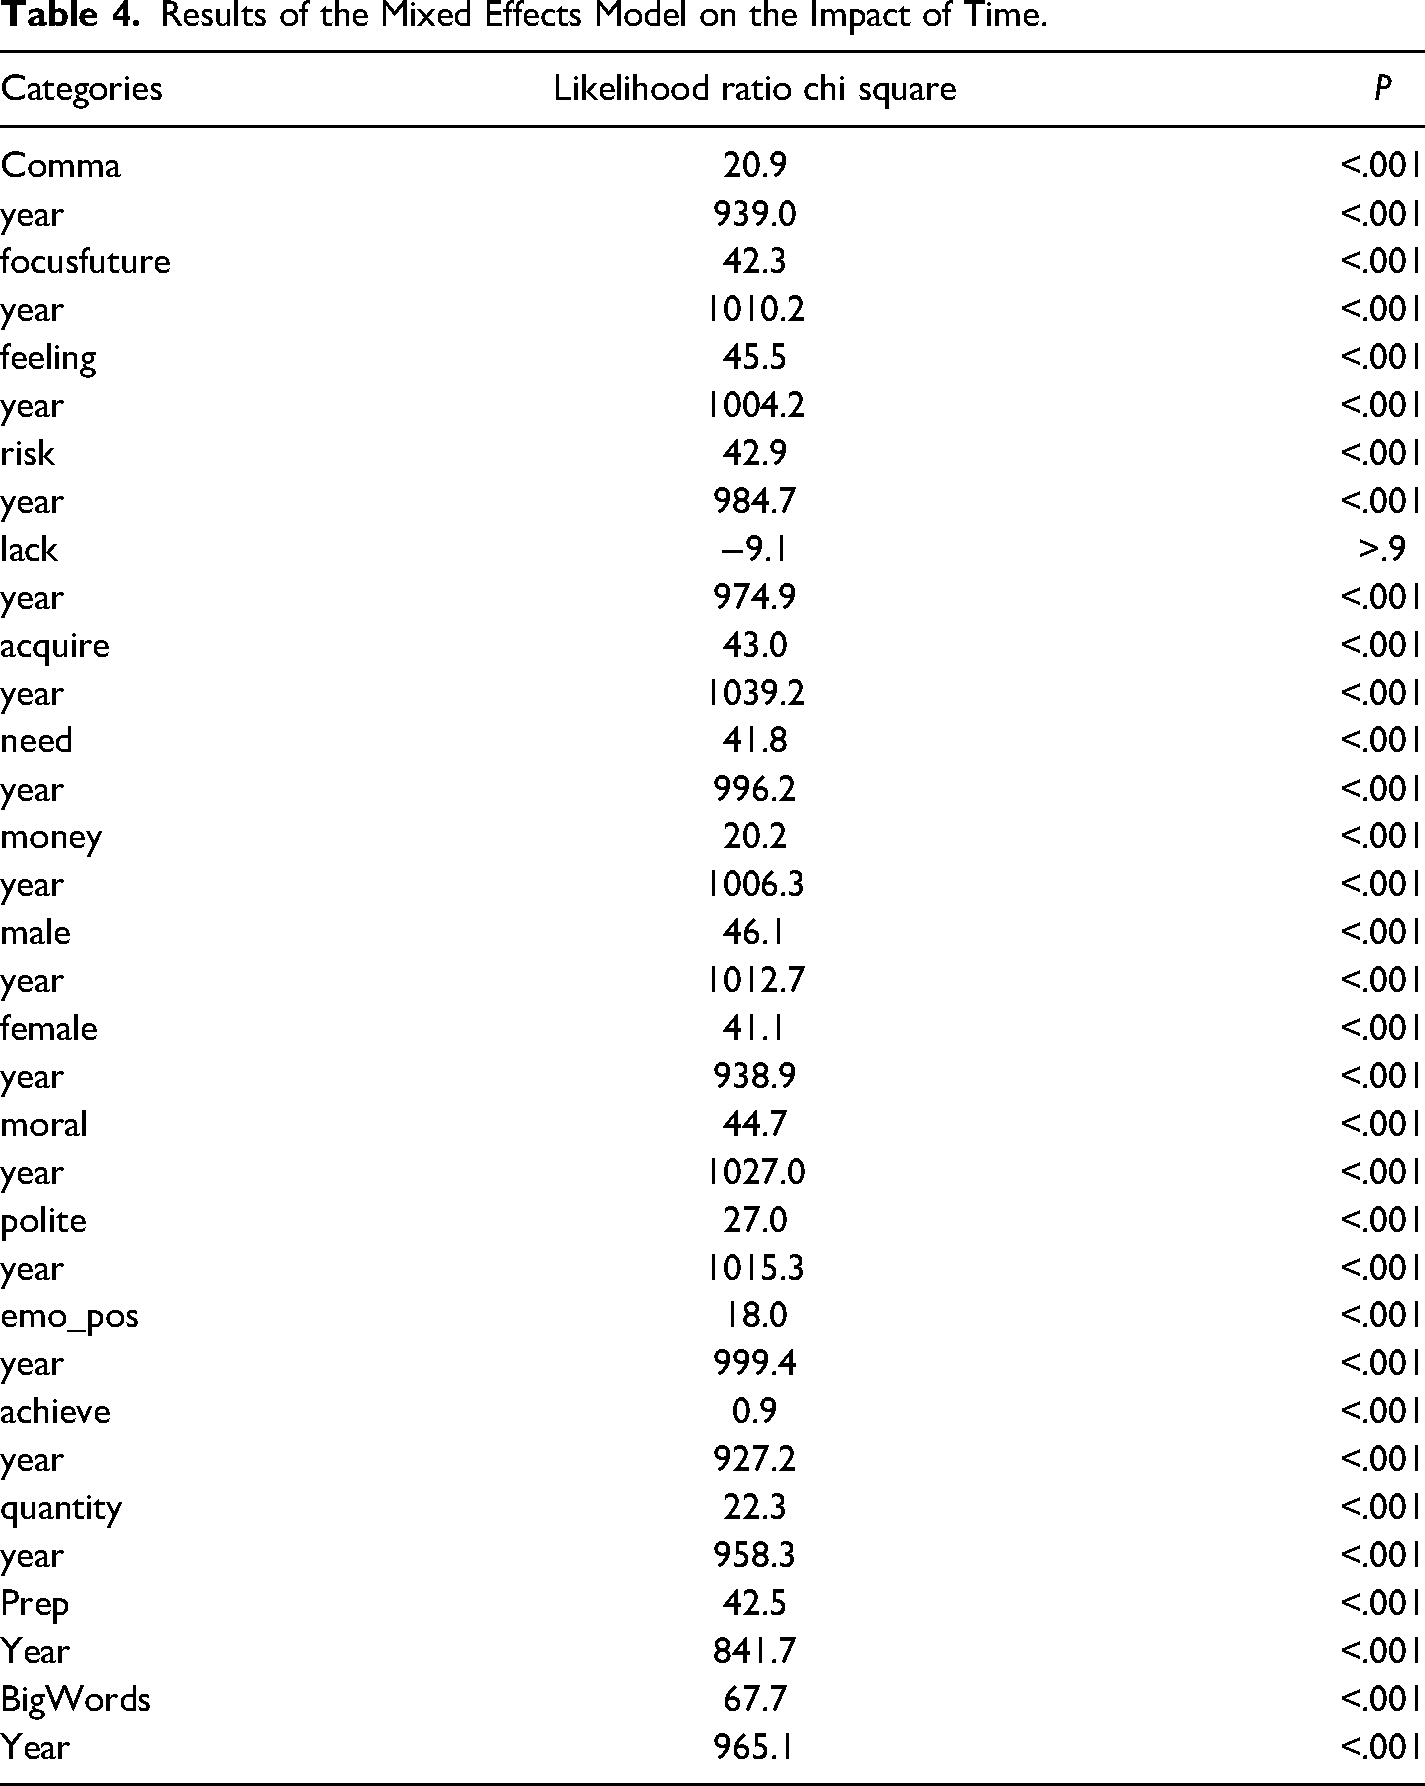
As shown in Figure 1, the area under the ROC curve is 0.761, and the 95% confidence interval is 0.7491–0.7731 (DeLong), indicating a fair and acceptable measure of separability. The nomogram is presented as a case study (Figure 2), and the selected case is the United States. According to the model, the scores generated by the model is −1.33, and the probability for the United States to be categorized among the lower-income group is 0.248, indicating correct prediction of the country's income categorization. The ordinal logistic regression suggests that 17 out of 18 categories selected by the elastic analysis show significant association with national wealth (Table 3), and it indicates that the impact of combining four income levels into dichotomous groups may be moderate. The mixed effects modeling suggests that time has a significant impact in general (P < .001) and in 17 categories (Table 4), and the Ljung-Box test suggests no evidence of autocorrelation. The lower-income and higher-income countries display notably different patterns of changes over time in nine categories (Supplementary Figure 1).
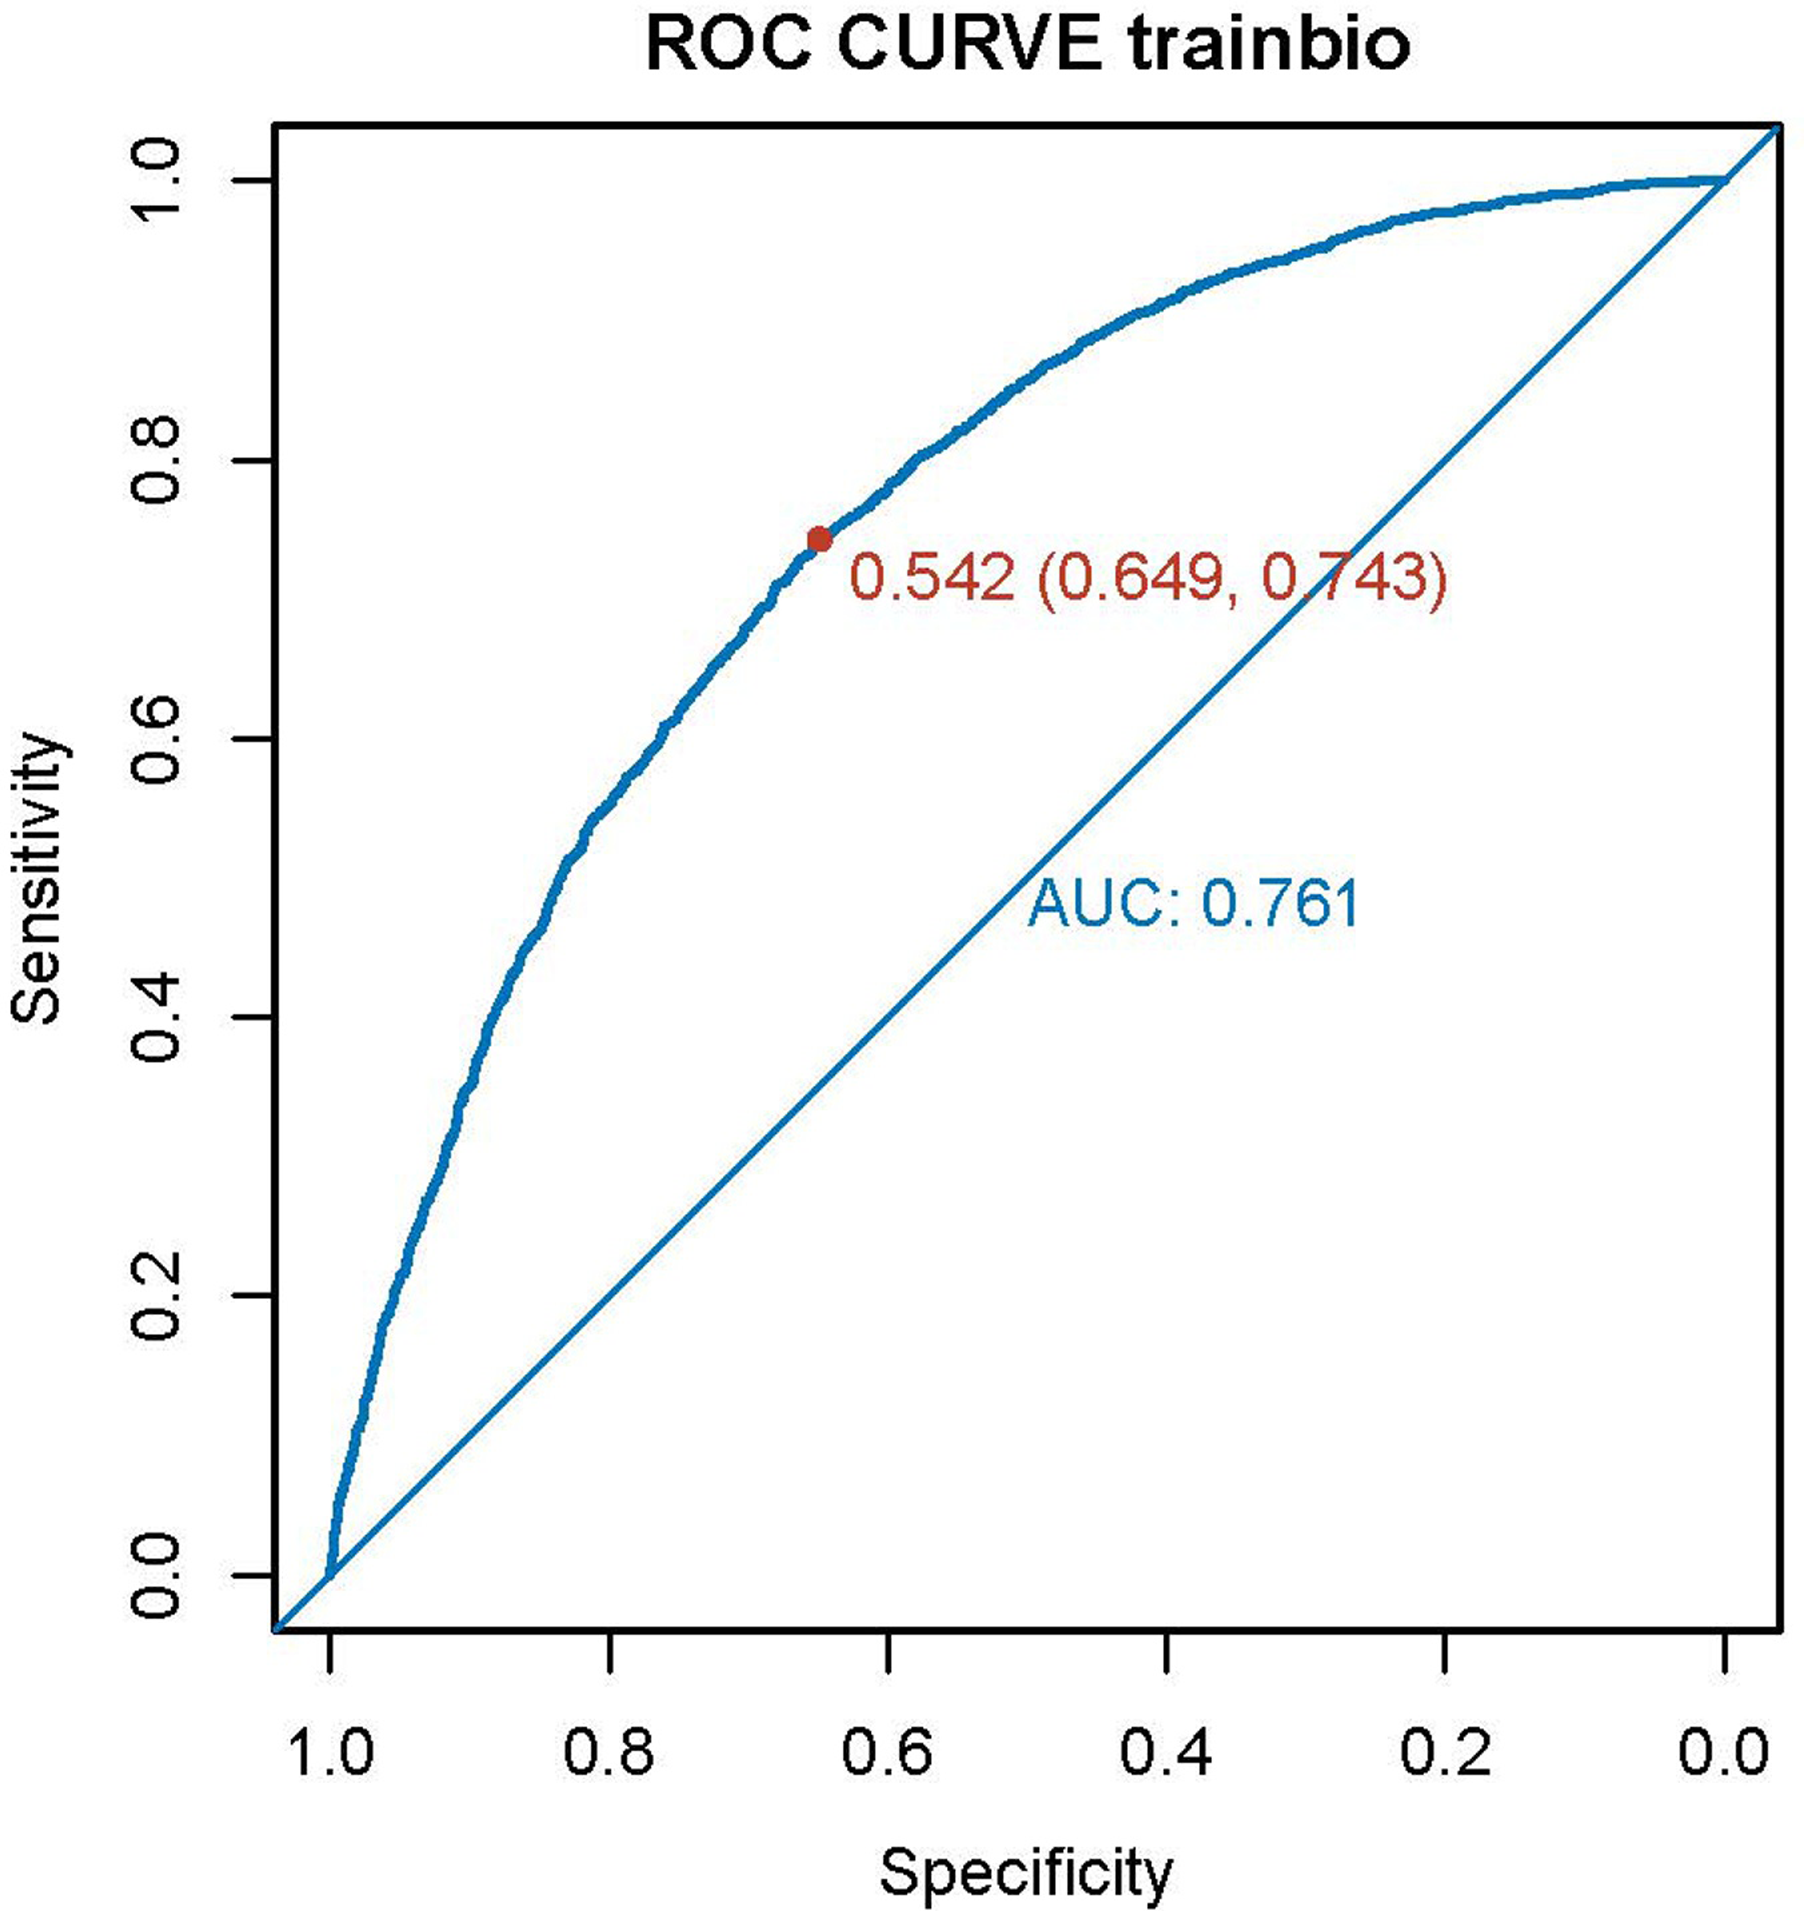
The ROC curve of the model. ROC: receiver operating characteristic.
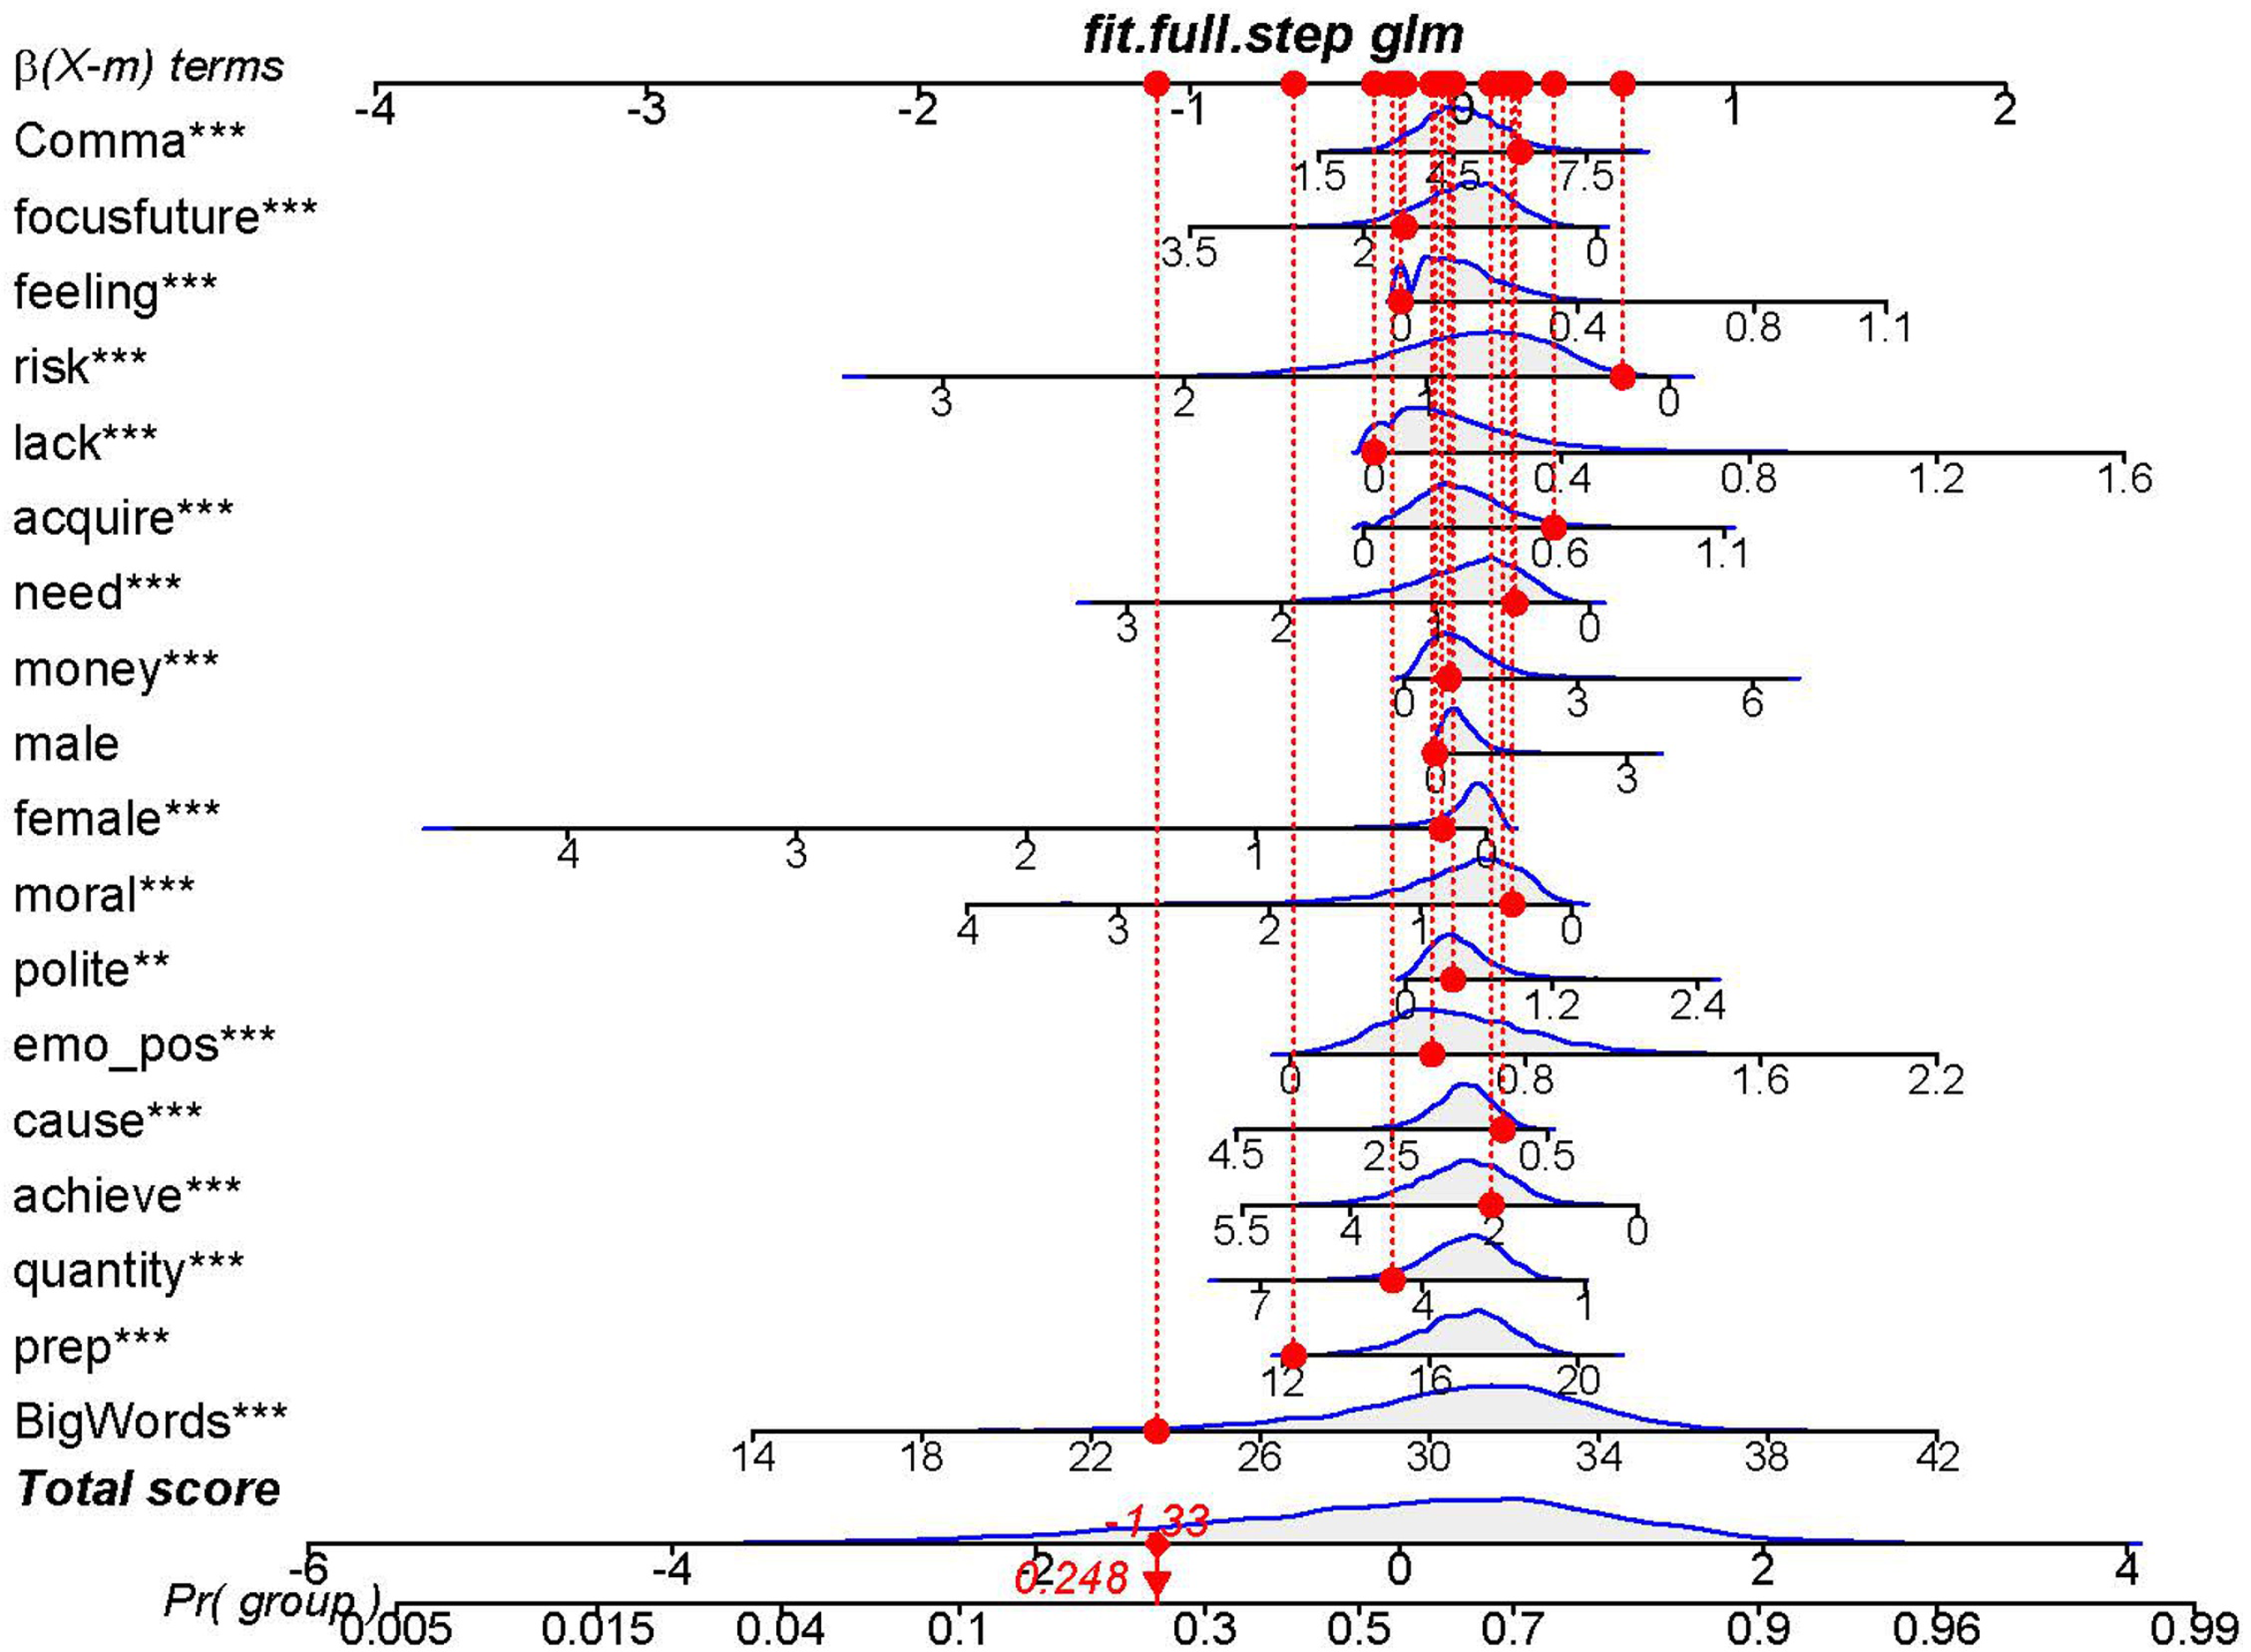
The nomogram of the United States as an example.
The Results of Ordinal Logistic Regression on the Selected Categories.
Results of the Mixed Effects Model on the Impact of Time.
Discussion
The number of the factors is admittedly large and may indicate overfitting, but they may also reflect the multiple, complex, and interconnected dimensions of social psychology of cross-country income inequality. This section discusses four hypothetical explanations for the selected categories.
The findings show that the higher-income countries use fewer “male” categories but more “female” categories than lower-income countries. The difference in gender references might be explained by increased women's political involvement with economic development (Pampel & Tanaka, 1986), but recent research suggests no significant correlation between national wealth and women's political participation (Sundström et al., 2017; United Nations, 2003).
For the lower-income countries, the more frequent use of “male” categories may be due to a lower level of consciousness of gender inequality (Jayachandran, 2015). Studies have shown a correlation between gender inequity and masculine generic language (Bailey et al., 2022; Gastil, 1990), which may explain a higher prevalence of the “male” categories, which include masculine generics such as “man” and “brother”, among the lower-income countries. The lack of professional speechwriters in lower-income countries may also be a contributing factor. The lower access to education can limit the access to qualified speechwriters, and the leaders might be hesitant to invest in the speechwriting services due to a lack of funds. Without the guidance from professional speechwriters, it would be more difficult to write in gender-inclusive language, which can be a time-consuming and resource-intensive task as the writers need to be careful with the word choice and well versed with the UN speech norms.
For the higher-income countries, the “female” categories may be more frequently used to show gender-inclusivity. But it may also indicate more depiction of females as people in need of help. This can be supported by a previous corpus-based study on the language of gender inequality at the UNGD (Brun-Mercer, 2021), which reveals that women are more frequently described as a group needing protection and support, as shown in the common collocates of “women” such as “vulnerable women and girls” and “violence against women.” The feminine forms may need to be further neutralized.
Lower-income countries tend to use politeness more, which may be due to higher status of the addressee (Brown & Levinson, 1987) and increased social distance (Stephan et al., 2010). This distance may stem from both lower status and historical factors, as the lower-income countries are often later to participate in the international forum. This unfamiliarity may partly contribute to the more frequent use of politeness. Also, poorer countries may be motivated to impress UN organization and wealthy countries for support, whereas wealthier countries may feel less such pressure.
The lower-income countries use the “money” category more often than higher-income countries. A possible explanation is the scarcity mindset (Mani et al., 2013). They find that the poorer people's cognitive capacity is more often occupied by the lacking resources. The salience of the economic dimension (Shah et al., 2018) may be manifested as “money” category in speeches.
Also, the lower-income countries use more “lack” and “acquire” categories, and higher-income countries use more “future focus” and “achieve” categories. This difference may be due to the scarcity mindset, which is more prevalent in lower-income countries and leads to anxiety over lacking and obsession with acquiring (Mani et al., 2013). The more affluent countries, less impacted by scarcity, may focus more on future opportunities to make achievements, which is reflected in their language through the frequent use of “future focus” and “achieve” categories.
Another possible explanation is that wealthier and poorer countries may differ in their goals. As they differ in lacking resources, their attention is occupied by different categories. The poorer countries may aim to call for more funds, policy changes and other forms of assistance that they lack to address their challenges. For example, the Zimbabwe's speech in 2010 emphasizes what “the developing world” suffers from and what it “yearns for.” The wealthier countries often emphasize their own initiatives and achievements to show their dedication to global prosperity. It can be exemplified by the United States’ focus on “what we have done” and “what kind of world we are trying to build” in 2010.
The analysis reports more frequent use of positive emotion, big words, commas, and prepositions in lower-income countries, and the higher-income countries talk about causes, risks, and needs more frequently. This pattern is discussed with the expectation states theory (Berger et al., 1972). According to this theory, the higher-income countries, often with greater economic and other resources, tend to have higher statuses, as the resource differences can be ingrained as status beliefs. The beliefs can associate the higher-income group with better qualities such as leadership (Ridgeway & Bourg, 2004) and contribute to inequality (Ridgeway, 2014).
The relation between emotion and status is an integral issue for the theory as well (Ridgeway, 2006). The lower-income countries, often with lower statuses and expected as followers, may show more positive emotion for positive outcomes according to the previous findings on emotional expectations (Tiedens et al., 2000).
The higher-income countries use the cause, risk, and need categories more frequently. It may be interpreted as evidence of their frequent use of cause-effect reasoning and appeals to potential risks and what needs to be done. As they are often regarded as more competent global leaders with generally higher rankings on soft power (Brand Finance, 2022), their thoughts are more likely to be seriously or favorably considered (Giles & Sassoon, 1983; Kalkhoff et al., 2020; Lundeberg et al., 1994). As the higher-status actors, they may thus express more opinions. In addition, it may be motivated by their greater need to maintain their international standing as the world leaders and to show leadership in international affairs.
Lower-income countries tend to use more complex language, which is indicated by the frequent use of big words, commas, and prepositions. Big words are associated with higher intelligence (Spearman, 1904); commas indicate turns in the thought (Salisbury, 1939, p. 797), and more turns may suggest complexity; prepositions indicate more references to complexly organized concepts (Pennebaker et al., 2014). Such language might be purposedly used to save and boost the face of poorer countries’ leaders. Under the status beliefs that the higher-income countries are often more reliable, the lower-income countries may feel compelled to use complex language to shield their speeches from refutation and to appear more learned (Pennebaker & King, 1999), as such language is more difficult to understand. Despite counter-evidence that big words impede processing fluency (Oppenheimer, 2006), the notion that big words demonstrate intelligence is still pervasive. Another explanation may be that the promotion of plain English (Stoll et al., 2022) has yet to reach lower-income countries. The absence of insight from professional speechwriters may also play a role. It could lead to a lack of resources to provide solid evidence and a shortage of knowledge on the general speech norms that encourage clear and concise language. The discussion of six patterns is preliminary; future research can delve deeper into each pattern and advance theory development to build systematic knowledge in the psychology of cross-country income inequality. For example, more linguistic correlates of politeness such as connectives and quantifiers (Holtgraves & Bonnefon, 2017) can be studied in further experimental research. Authorship analysis and qualitative analysis of political leaders’ purposes in speeches are also promising directions for further research. Additionally, future diachronic analysis could examine the impact of time-related factors on the narrowing or widening gap between lower-income and higher-income countries across 18 categories.
Conclusion
Generally, the lower-income countries use more polite, complex, and abstract language, refer to men more frequently, focus more on what they lack and acquire, and show more positive emotion, while the higher-income countries refer to women more frequently, display more achievements and future initiatives, use more cause-effect reasoning, and talk more about risks and needs. While this study focuses on cross-group variation, the aim is to better understand the language of inequality to reduce it through language policies or alternative measures and to promote intergroup accommodation (Giles, 2023).
Supplemental Material
sj-docx-1-jls-10.1177_0261927X231190861 - Supplemental material for LIWC Indicators of Cross-Country Income Inequality at the United Nations General Debate (1987-2020): An Elastic Net Analysis
Supplemental material, sj-docx-1-jls-10.1177_0261927X231190861 for LIWC Indicators of Cross-Country Income Inequality at the United Nations General Debate (1987-2020): An Elastic Net Analysis by Lin Shen in Journal of Language and Social Psychology
Supplemental Material
sj-csv-2-jls-10.1177_0261927X231190861 - Supplemental material for LIWC Indicators of Cross-Country Income Inequality at the United Nations General Debate (1987-2020): An Elastic Net Analysis
Supplemental material, sj-csv-2-jls-10.1177_0261927X231190861 for LIWC Indicators of Cross-Country Income Inequality at the United Nations General Debate (1987-2020): An Elastic Net Analysis by Lin Shen in Journal of Language and Social Psychology
Footnotes
Acknowledgements
I would like to thank the editor for their valuable advice and insightful comments on the manuscript.
Declaration of Conflicting Interests
The author(s) declared no potential conflicts of interest with respect to the research, authorship, and/or publication of this article.
Funding
The author(s) received no financial support for the research, authorship, and/or publication of this article.
Supplemental Material
Supplemental material for this article is available online.
Author Biography
References
Supplementary Material
Please find the following supplemental material available below.
For Open Access articles published under a Creative Commons License, all supplemental material carries the same license as the article it is associated with.
For non-Open Access articles published, all supplemental material carries a non-exclusive license, and permission requests for re-use of supplemental material or any part of supplemental material shall be sent directly to the copyright owner as specified in the copyright notice associated with the article.