
Abstract
Universal consideration and group-specific norms have been recommended to address the underrepresentation of historically marginalized groups in gifted education programs. The current study evaluated these methods with 7,148 first through sixth-grade students from a single district in the Midwest who were administered academic achievement and cognitive ability measures. Representation indices (RIs) were calculated to measure the impact of local-building norms and different score combination methods. Black and Hispanic students were underrepresented relative to their proportion in the sample for all identification methods (RI <0.80). Asian and White students were well-represented or overrepresented using all identification methods. However, using local-building norms or different score combination methods resulted in meaningful increases in RIs for Black and Hispanic students, without corresponding decreases in RIs for Asian and White students.
Introduction
The underrepresentation of historically marginalized students in gifted education is an ongoing issue in the field (Gentry et al., 2019; Peters et al., 2021). Gifted and talented students come from all races, ethnicities, cultural and linguistic backgrounds, socioeconomic status (SES), disability status, and social-emotional and behavioral skills. Nevertheless, there is a long-documented history of racial/ethnic disproportionality in gifted education programs in the United States. White and Asian students are well-represented or over-represented, and Black, Hispanic, and Native American students are disproportionately underrepresented relative to their proportion in school (Gentry et al., 2019; Peters, 2022). The complex intersection of factors influencing gifted identification has led to calls to action to increase traditionally underrepresented groups in gifted education (e.g., Peters, 2022). Some of the efforts to reduce disproportionality in gifted identification include universal consideration, local-building norms, and different score combination methods. These practices can significantly improve the representation of historically underrepresented groups in gifted education (Card & Giuliano, 2016; Carman et al., 2018). The impact and limitations of these practices are discussed, followed by an empirical examination.
Universal Consideration for Giftedness
All students are screened or evaluated for gifted and talented programs in universal consideration (Peters, 2022). This framework recognizes that a broader range of individuals may need curriculum modification than those traditionally nominated by teachers and parents (Peters, 2022). In practice, standardized academic achievement or cognitive ability tests are administered to an entire grade of students (e.g., Card & Giuliano, 2016; Peters et al., 2019). Card and Giuliano (2016) examined universal screening of third-grade students as part of the referral process with the Naglieri Nonverbal Ability Test. The researchers found that automatic referrals from universal screening resulted in a 74% increase in the odds for Black students and a 118% increase in the odds of Hispanic students being identified in the district’s gifted program. A concern with the Card and Guiliano study, while increasing the representation of Black and Hispanic students, had a different cut score for students from disadvantaged groups (i.e., English Language Learners and students on free or reduced-price lunch). Students from disadvantaged groups were eligible at a standard score of 115, compared to a standard score of 130. This different standard disproportionately impacted Black and Hispanic students. Instead, researchers have suggested using different group-specific norms rather than different standards (Peters, 2022).
Local-Building Norms
Local-building norms are a form of group-specific norms, in which the performance of an individual is relative to other individuals in the same group (i.e., others in the same grade at the same school building; Peters, 2022). Local-building norms may better align with the National Association of Gifted Children’s (NAGC, 2019) definition of giftedness, which states that performance is relative to age, experience, and environment. Local-building norms can be instrumental in addressing relative performance when schools vary significantly from a nationally normative sample (Lohman & Gambrell, 2012). The highest performing individuals at each school and grade, who likely have more similar experiences and environments, are in the most need of curriculum modification offered by gifted programming (Peters, 2022).
Researchers have utilized local-building norms, thereby altering the representativeness of gifted students identified across different racial and ethnic groups (e.g., Carman et al., 2018; Peters et al., 2019). Local-building norms are described here in comparison to other norming methods (e.g., district norms and state norms) because research has found the most significant impacts on representation when using local-building norms (Carman et al., 2018; Peters et al., 2019). For example, Peters and colleagues (2019) used math and reading achievement data and found that using local-building norms increased the representation index (RI) of African American students by 238% compared to using national norms, and found an increase in the RI of Latinx students by 170%; however, Asian and White students still had greater representation than their proportion in the sample. The sustained, although mitigated, disproportionality in identifying gifted students may be partially explained by the racial/ethnic demographics of the schools and the extent of mean score differences between groups (Warne & Larson, 2022).
Local-building norms will be more effective in increasing the representation of historically marginalized students in gifted education when the school is primarily composed of students from traditionally underrepresented backgrounds (Peters et al., 2019). There is an inverse relationship between school racial/ethnic integration and the racial/ethnic composition of the gifted programs when mean differences existed between racial/ethnic groups (Warne & Larson, 2022). The studies mentioned here used a single score to identify students for gifted programs (Carman et al., 2018; Peters et al., 2019; Warne & Larson, 2022). Gifted identification practices recommend using multiple measures (Gentry et al., 2019).
Multiple Measures to Identify Gifted Students
Researchers recommend using multiple measures as best practice for identifying gifted students (Johnsen, 2018; McBee et al., 2014). Using multiple psychometrically sound assessment tools provides a more comprehensive picture of students in which to make identification decisions (Johnsen, 2018). These measures can provide information on a wider range of constructs (e.g., intelligence and specific academic abilities). However, the way multiple measures are combined when making identification decisions will significantly impact the number and types of students identified (Lakin, 2018; McBee et al., 2014). There are three primary methods to combine scores: AND, OR, and MEAN rules (Lakin, 2018). In the AND method, the individual must meet a minimum threshold on each criterion. In the OR method, one score must meet minimum competency. The average of scores must meet a minimum threshold with the MEAN method. The different combination methods result in different numbers of individuals identified, except the MEAN method, because scores are reduced to a single metric (Lakin, 2018). The AND method identifies the least number of students, but those students will be more homogenous because all students will have similar scores across identification measures (Lakin, 2018). Higher correlations between different measures will identify more individuals with the AND method. Alternatively, the OR method identifies more students than the AND method, and lower correlations between measures will identify more students. However, the students identified will be more heterogeneous because there will be more score variability on the identification measures. Therefore, the AND and OR methods of score combination may be used to increase or decrease the number of students identified and increase or decrease the heterogeneity of those students.
Increasing the number of historically marginalized students identified for gifted programming as a function of using the OR or AND method would occur if the relationship between multiple measures were different across groups (e.g., differential predictive and concurrent validity). For example, Scheiber (2017) found that cognitive abilities predicted that Black and Hispanic students would score higher on academic achievement tests than their observed scores. Alternatively, differential predictive or concurrent validity may only occur at specific ability levels. For example, Konold and Canivez (2010) examined the relationship between cognitive abilities and academic achievement. The researchers found that only at the highest levels of cognitive ability (i.e., two or more standard deviations above the mean) were there significant differences in predicting writing scores for Hispanic students.
Taken together, using different score combination methods with different norming methods may have a significant impact on the proportion and number of individuals identified. Schools and districts that are diverse by race/ethnicity with mean differences between groups on multiple measures used to identify students for gifted programming may turn to universal assessment, group-specific norms, and score combinations to address disproportionality. However, this practice depends on the measures used, the mean differences between groups, and the presence or absence of differential predictive validity.
Purpose of the Study
The studies mentioned here examine the use of universal assessment for a single domain (i.e., cognitive abilities or academic achievement; Card & Giuliano, 2016; Peters et al., 2019), score combinations for a single domain (i.e., Lakin, 2018), or describe simulation studies (e.g., McBee et al., 2014; Warne & Larson, 2022). The present study aimed to examine an empirical application of universal assessment of multiple measures, local-building norms, and different score combinations on diversifying gifted identification. Universally administered academic achievement and cognitive abilities data from a single district were used to investigate the impact of different norming methods (i.e., national and local-building norms) and score combination methods (i.e., MEAN, AND, and OR methods) on the representation of gifted identification across race/ethnicity. In addition, we examine the use of academic achievement tools typically used as part of a response to intervention universal screening process. Universal assessments may be prohibitively expensive (Worrell et al., 2019). For example, in the Card and Guiliano study (2016), the universal screening practice had to discontinue the practice due to the high costs, and the proportion of Black and Hispanic individuals reverted to levels similar to before implementation. Researchers have suggested that assessment tools already employed for other purposes could also be used in the gifted identification process (e.g., achievement tests; Worrell et al., 2019). Over 90% of elementary schools and almost 70% of secondary schools already conduct universal academic screening (Briesch et al., 2021). Additionally, computer-adaptive academic screening tools have been developed, enabling all students the opportunity for above-level testing. These tools are used to answer the following research questions.
Does using local-building norms with multiple identification measures result in more equitable identification of historically marginalized students for gifted programs relative to national norms when using data from a diverse district with mean score differences between racial/ethnic groups?
What is the effect of the MEAN, AND, and OR score combination method when controlling for the number of individuals identified?
Method
Participants
Percentage of Each Race/Ethnicity in the District and Across Schools
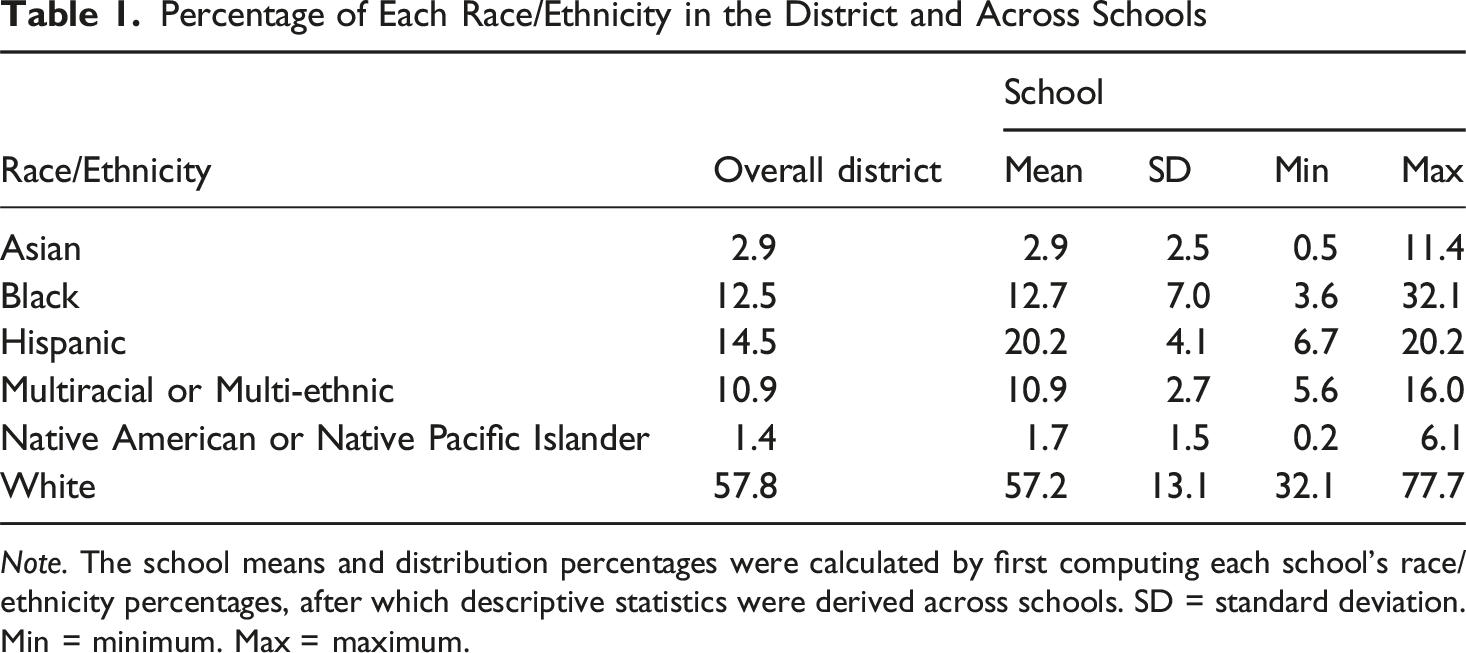
Note. The school means and distribution percentages were calculated by first computing each school’s race/ethnicity percentages, after which descriptive statistics were derived across schools. SD = standard deviation. Min = minimum. Max = maximum.
Measures
Cognitive Abilities Test Form 7 (CogAT)
Distribution of Academic and Cognitive Scores by Race and Ethnicity Using National Norms
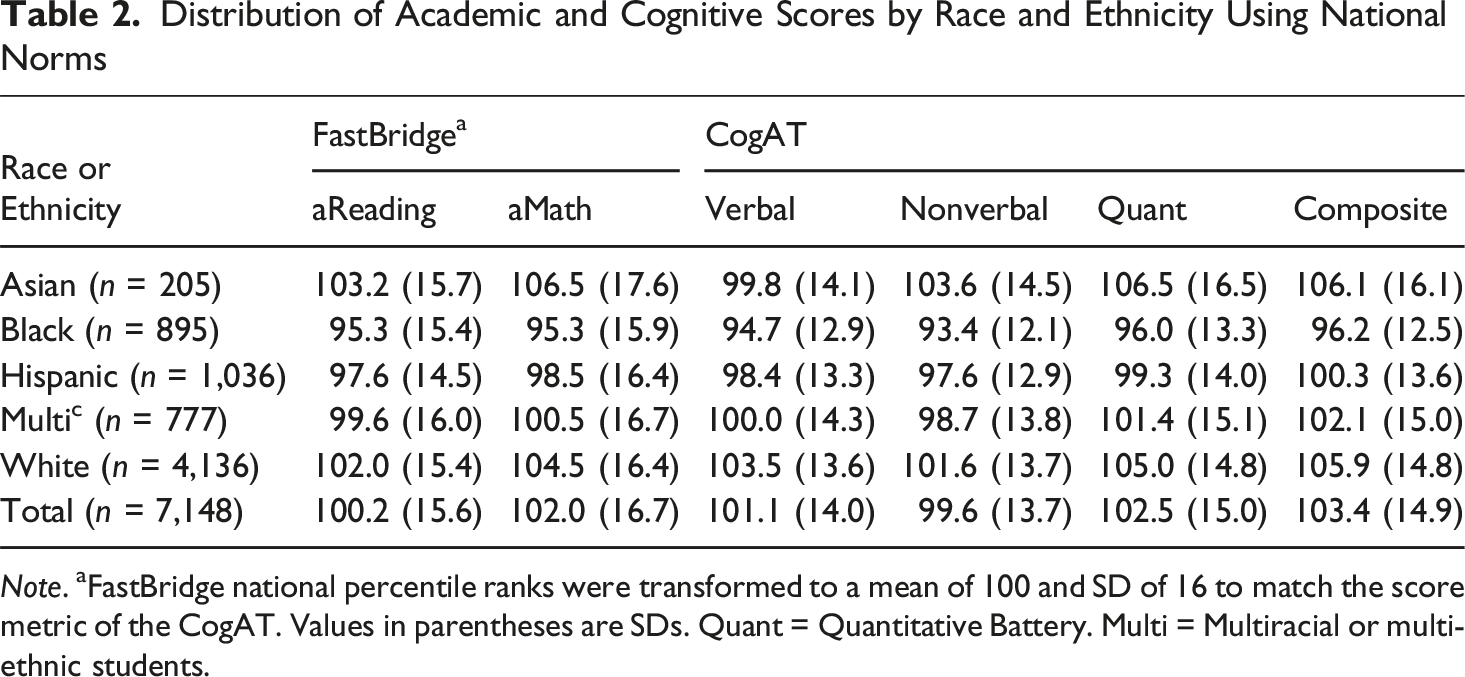
Note. aFastBridge national percentile ranks were transformed to a mean of 100 and SD of 16 to match the score metric of the CogAT. Values in parentheses are SDs. Quant = Quantitative Battery. Multi = Multiracial or multi-ethnic students.
FastBridge aReading
aReading is a test that measures a broad range of reading abilities from kindergarten through 12th grade (Illuminate Education, 2021). aReading is a multiple-choice formative assessment tool that can be used as a screener for general reading achievement (Illuminate Education, 2021). aReading measures six domain areas: (1) concepts of print, (2) phonological awareness, (3) phonics, (4) orthography and morphology, (5) vocabulary, and (6) comprehension. aReading is a computer-adaptive test. Therefore, students received different sets of questions depending on their response patterns. The computer-adaptive nature of aReading allows students to receive questions well above grade level standards. The test takes about 10 to 30 minutes to complete. Percentile ranks are provided for each student’s score, corresponding to nationally normed data for the grade and season (i.e., fall, winter, or spring). Descriptive statistics for the current sample across race/ethnicity are provided in Table 2. For these data, national percentile ranks were transformed to z-scores and then converted to SAS with a mean of 100 and SD of 16 to match the score distribution of CogAT scores. Additional descriptive statistics and reliability information for aReading are provided in Supplemental Materials.
FastBridge aMath
aMath is a test that measures a broad range of math abilities from kindergarten through 12th grade (Illuminate Education, 2021). Like aReading, aMath is a formative assessment tool used to screen students on their overall math proficiency. aMath measures six domains: (1) counting and cardinality, (2) operations and algebraic thinking, (3) numbers and operations in base ten, (4) number and operations, (5) measurement and data, and (6) geometry. aMath is also computer-adaptive. The test takes about 15 to 30 minutes to complete. Like aReading, aMath provides nationally normed percentile ranks corresponding to the grade and season in which the student was tested. Descriptive statistics for aMath with the current sample are provided in Table 2 across race/ethnicity. In the table, aMath percentile ranks were z-scored and transformed to SAS with a mean of 100 and SD of 16 to match the score distribution of the CogAT. Additional descriptive statistics and reliability data are provided in Supplemental Materials.
Procedures
Institutional review board determined that this study was not human subjects research. The de-identified data included a school identification number, student race/ethnicity, biological sex, grade, and scores including aReading national percentile ranks, aMath national percentile ranks, and national percentile ranks and nationally normed SAS for the CogAT Verbal, Nonverbal, Quantitative, and Composite Batteries. The data also included local-building percentile ranks for FastBridge and CogAT scores; however, no information was available to ensure that the methods used to create local-building norms for each measure were the same. Therefore, local-building norms were created. The data were grouped by school and grade, then each individual was rank ordered. To rank order students, the total number of scores less than the individual’s score was counted and divided by the number of observations minus 1. This was done using the percent_rank() function in the dplyr package (Wickham et al., 2023) in R. All assessment data were collected before any COVID-19 restrictions. aReading and aMath assessments were collected between January and February 2020. The CogAT was administered once a year to all first and fourth-grade students in the fall; therefore, CogAT data were collected over three years. In the dataset, 86 students had missing aReading scores and 284 students had missing aMath scores. No students were missing both aReading and aMath, and no students had missing CogAT scores. The data were assumed to be missing not at random due to the nature of the missingness. Multiple imputation or other algorithmic methods to fill in missing data were not conducted because there were low amounts of missing data, and the data were missing not at random. Students with missing data were retained because it was possible for all students to be identified.
Number of Individuals Identified With Each Method of Identification
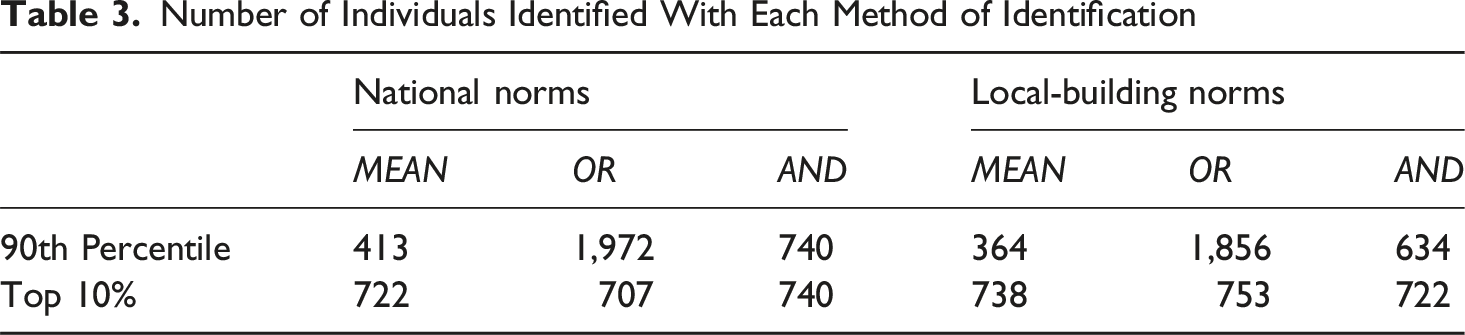
A second set of cut scores was created so that each score combination method would result in a similar number of individuals identified with each method. To do this, cut scores were set for each method to identify the top 10% of the sample (Table 3 displays the number of individuals identified with each method). For national norms, the 85th percentile was used for the MEAN, the 89th percentile was used for the AND, and the 97th percentile was used for the OR method. For local-building norms, the 84th percentile rank was used for the MEAN, the 89th percentile was used for the AND, and the 97th percentile rank was used for the OR score combination method. Therefore, a
Correlations and Fisher’s z Transformation Values by Race/Ethnicity
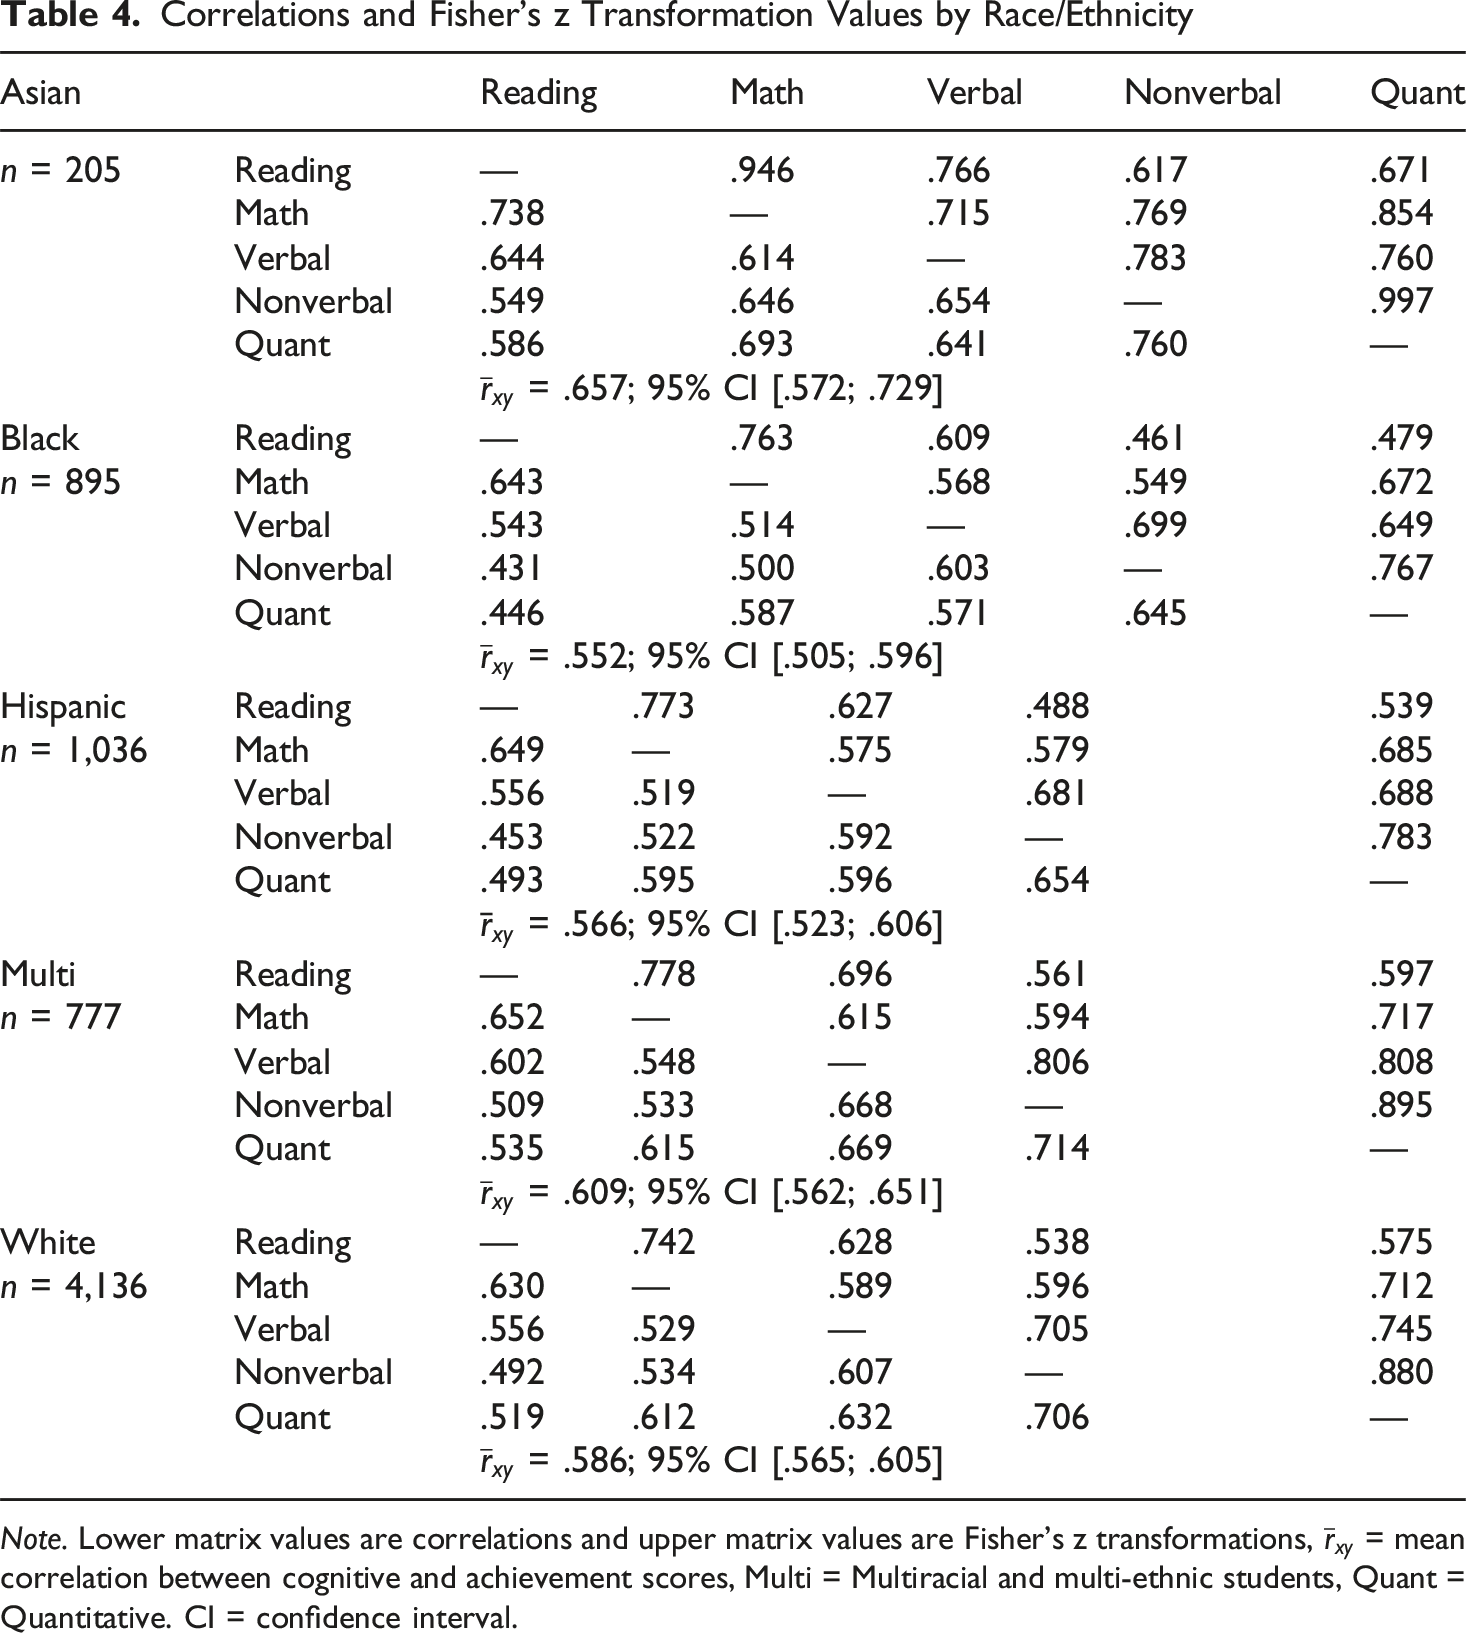
Note. Lower matrix values are correlations and upper matrix values are Fisher’s z transformations,
Data Analysis
Research Question 1
The racial/ethnic representation of students who would be identified using different eligibility criteria was examined between national norms and local-building norms. Representation indices (RI) were calculated for each racial/ethnic group. The RI was calculated by the following:
The RI indicated the degree of representation of subgroups relative to their proportion in the population. Bootstrapped CI were calculated for RI for all methods of identification to show the robustness of the results and to examine significance. Bootstrapped CIs were calculated by resampling the data with replacement. Each resampling had 7,148 individuals to match the current study population size. The data were resampled 10,000 times. These calculations were all completed in R version 4.5.2.
Each of the 12 different identification methods was compared to equitable representation (RI = 0.8-1.0; Gentry et al., 2019). If the upper bound of the 95% CI was below 0.8, then the identification method resulted in underrepresented outcomes. If the upper or lower bound of the 95% CI was between 0.8 and 1.0, then the group was not significantly different from equitable representation. If the lower bound of the 95% CI was above 1.0, then the group was well represented. If the lower bound of the 95% CI was above 1.2, then the method overrepresented the group. The RIs and CIs were not created with the Native American and Native Pacific Islander students because there were too few students, which would result in unreliable estimates.
The relative change in RIs was calculated for each method. This was done to indicate the extent to which changing norming methods impacts RIs (i.e., national norms vs local-building norms). The percent change in RIs can be calculated with the following equation.
The percentage change in RI represents the increase or decrease in RI when using local-building norms instead of national norms. Previous research has used a 20% change to indicate a meaningful change in RI when using different identification methods (Peters et al., 2019). Bootstrapped 95% CIs were calculated for each
Research Question 2
Next, to answer the research question on the effect of the MEAN, AND, and OR score combination methods on equitable identification, different cut scores were created that identified similar numbers of students across the scoring methods. Next, RIs were calculated for each identification method, and bootstrapped CIs were calculated. The same interpretations were applied to this research question as in Research Question 1. Relative change was also examined to indicate the extent changing score combinations impacted RIs. For these comparisons, the same norming methods were compared to each other to isolate the impact of different score combinations. The percentage change here represents the increase or decrease in RI when using the OR or AND score combination instead of the MEAN score combination method. For example, the percent change in RI for local-building norms when going from the MEAN method to the OR method, when the number of individuals identified is similar across methods.
Results
The effects of different norming and score combination methods on the representation of historically marginalized students who would be identified for gifted programming from a single district were examined in this study.
Research Question 1
Representation Indices for Each Score Combination and Norm by Race/Ethnicity
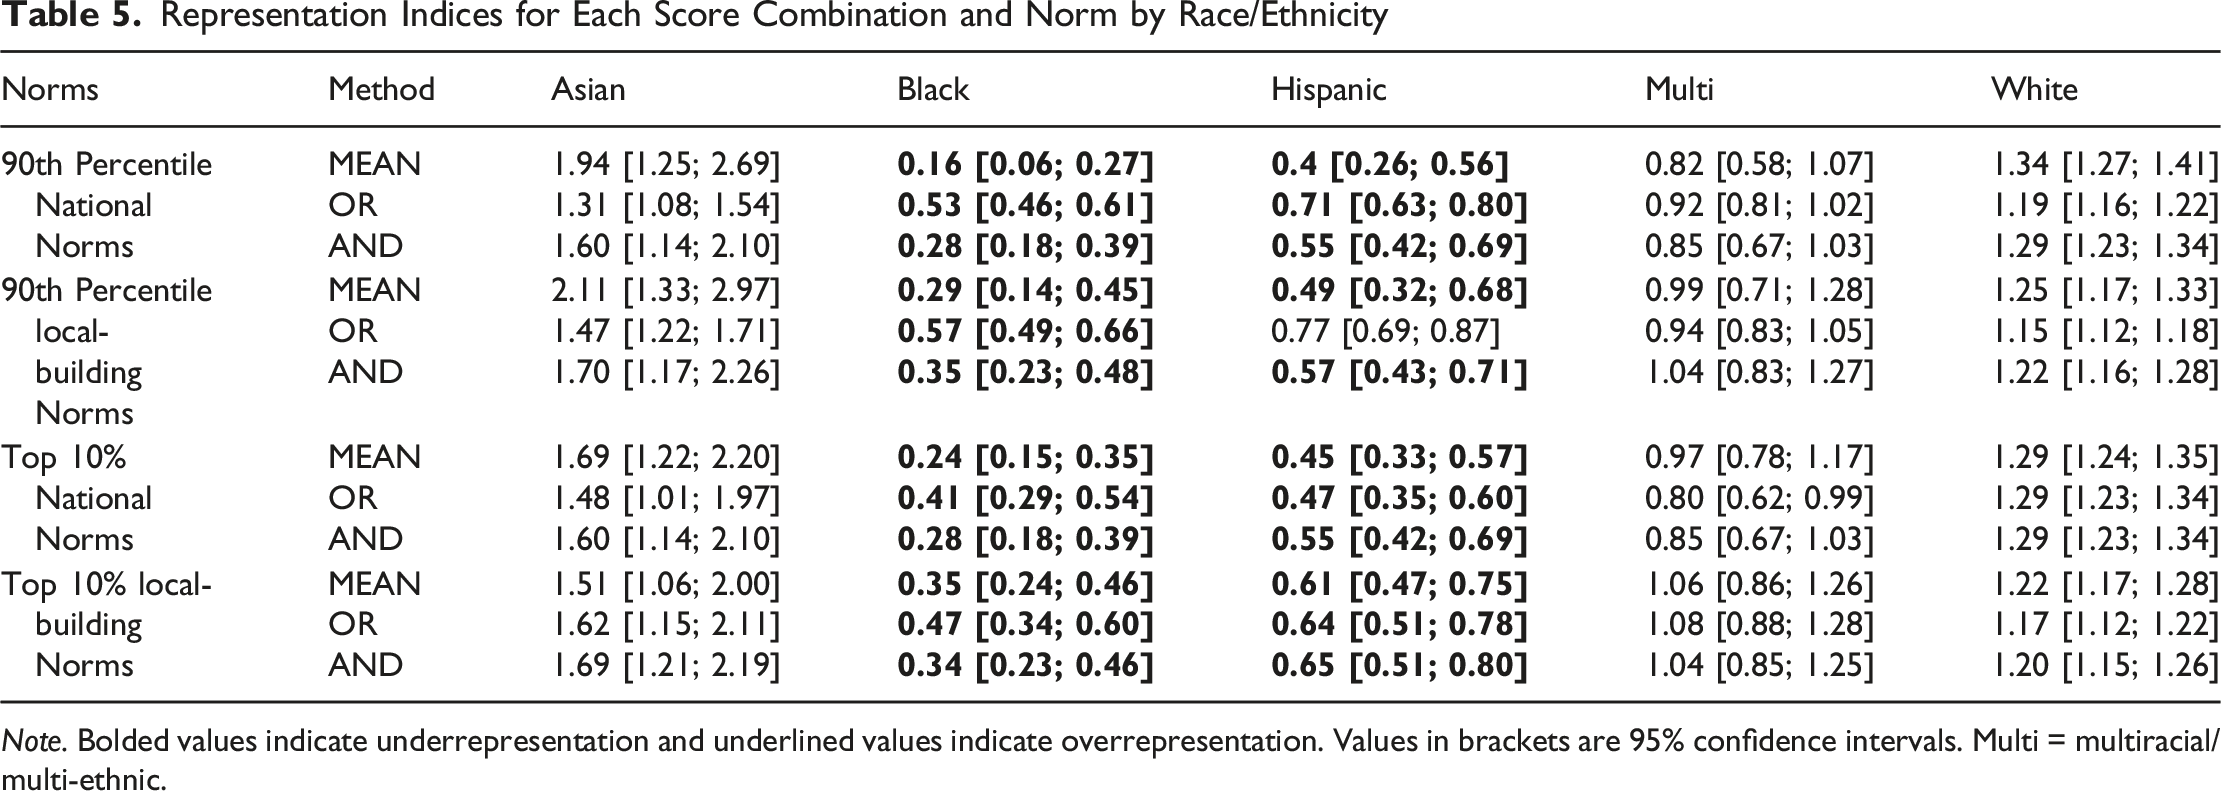
Note. Bolded values indicate underrepresentation and underlined values indicate overrepresentation. Values in brackets are 95% confidence intervals. Multi = multiracial/multi-ethnic.
Percent Change in Representation Indices When Using the 90th Percentile as the Cut Score
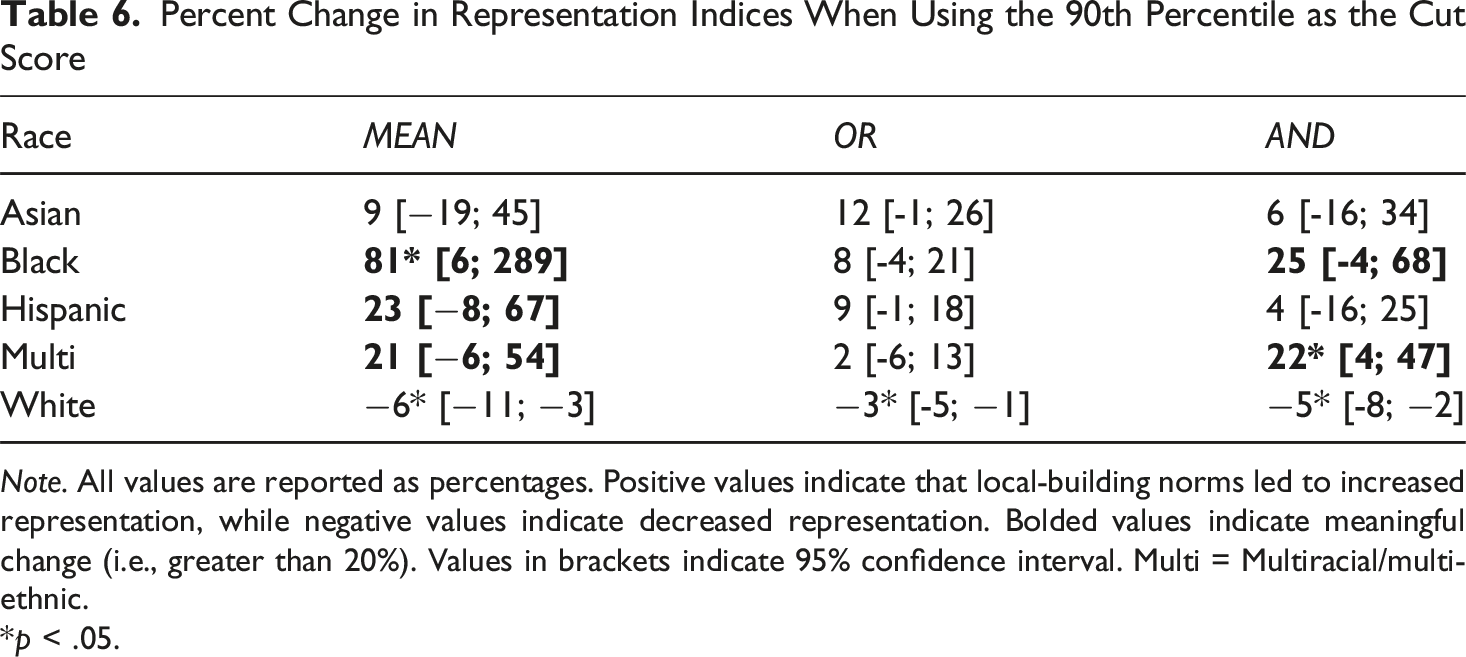
Note. All values are reported as percentages. Positive values indicate that local-building norms led to increased representation, while negative values indicate decreased representation. Bolded values indicate meaningful change (i.e., greater than 20%). Values in brackets indicate 95% confidence interval. Multi = Multiracial/multi-ethnic.
*p < .05.
Research Question 2
The second research question examined the effects of score combination methods on identifying historically marginalized students for gifted programs when controlling for the number of individuals identified. The data from the current study identified more students using the OR score combination method (n = 1,972) compared to the AND (n = 740) and MEAN (n = 413) score combination methods, when employing a fixed cut score of 90th percentile and national norms. Similarly, the OR score combination method identified more students (n = 1,856) than the AND (n = 634) and the MEAN (n = 364) score combination methods when using local-building norms. A different cut score was used for each method, resulting in approximately 10% of the top student performers being identified. The number of individuals using national norms ranged from 707 to 740, and 722 to 753 using local-building norms (Table 3).
First, the mean RIs for all racial/ethnic groups were more similar when identifying the top 10% of students compared to using a fixed cut score of the 90th percentile, regardless of the type of score combination or norm used. In other words, there was less variability in the mean RI between score combination methods. Second, no score combination method for Black or Hispanic students resulted in RIs not significantly different from equitable representation. Instead, all score combinations resulted in the two groups being significantly underrepresented. White students were overrepresented when national norms were used for all score combination methods. Asian students were significantly overrepresented when national norms were used with the MEAN score combination method. No group was overrepresented when using local-building norms.
Percent Change in Representation Indices When Identifying the Top 10% of Students
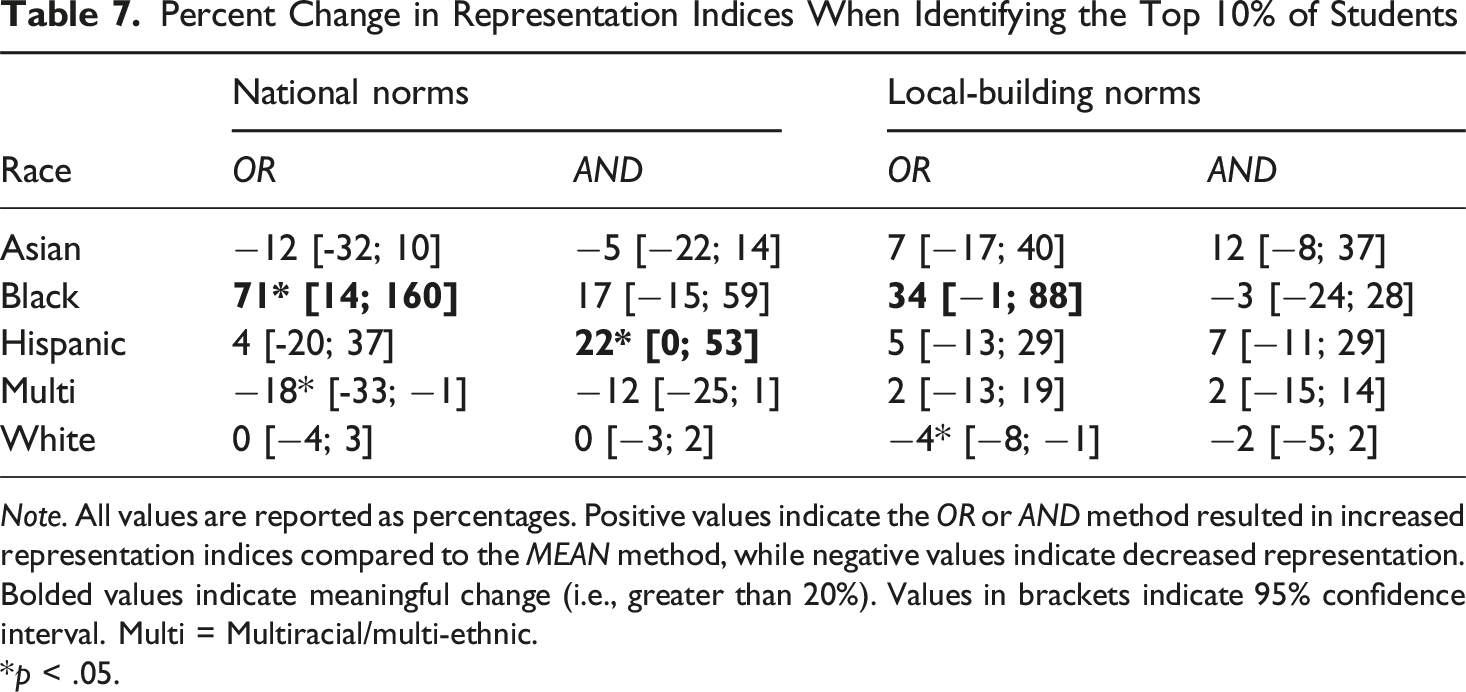
Note. All values are reported as percentages. Positive values indicate the OR or AND method resulted in increased representation indices compared to the MEAN method, while negative values indicate decreased representation. Bolded values indicate meaningful change (i.e., greater than 20%). Values in brackets indicate 95% confidence interval. Multi = Multiracial/multi-ethnic.
*p < .05.
Discussion
In this study, data were examined from universally administered assessments of academic achievement and cognitive abilities on racial/ethnic identification for gifted programming using different score combinations and norms. The effects of score combinations and norming methods on gifted identification were examined. It was hypothesized that there would be a minimal effect of local-building norms, given the mean differences between racial/ethnic groups and the diverse racial/ethnic makeup of the schools (Warne & Larson, 2022). The results from this study indicate that Black and Hispanic students, students with lower mean scores, continue to be underrepresented in gifted identification, even when using local-building norms. However, there were meaningful and statistically significant increases in Black and Hispanic student RIs when using local-building norms instead of national norms. These changes in RIs were smaller than those previously reported (Peters et al., 2019). Previous research found a change in RI of up to 238% for Black students and up to 170% for Latinx students when using local-building norms rather than national norms. The researchers examined the use of state-wide data. The researchers used a single metric for identification purposes, which would be most similar to the MEAN method in this study. The RIs with the MEAN method for Black students in this study (RI = 0.16 and 0.24) were similar to the results from Peter and colleagues study with national norms (RI = 0.22 and 0.15); however, the RIs with local-building norms were much smaller in this study (RI = 0.29 and 0.35) compared to the Peters and colleagues study (RI = 0.76 and 0.60). The current study of a diverse school district, comprising similarly diverse schools with mean differences between racial/ethnic groups on identification measures, yielded similar inequitable RIs as previously reported (Peters et al., 2019). However, meaningful and statistically significant increases in RIs are obtained when using local-building norms rather than national norms. White students had statistically significant decreases in RIs when using local-building norms rather than national norms, but these decreases were not meaningfully lower.
Second, it was hypothesized that there would be minimal effects of different score combination methods when a similar number of individuals are identified because there were no significant differences in average correlations between groups. This was partially supported. It was expected that lower correlations would increase RIs for the OR score combination method (McBee et al., 2014). This occurred for Black students, who had the lowest average correlation between measures, but did not occur for Hispanic students, who had the second lowest average correlation. Similarly, there were no trends with the RIs for Asian students. Asian students had the highest correlation between measures, but there were no meaningful or significant changes in RIs with the AND method. In addition, the results here are similar to previous research, indicating that the OR score combination results in higher RIs, partially due to the increase in the number of students identified (Lakin, 2018). The OR score combination method identified four to five times as many individuals as the MEAN method, and almost three times as many individuals as the AND method. RIs tended to move closer to 1 when the method increased the number of individuals and moved further away from 1 when the method decreased the number of individuals identified. For example, the 90th percentile with national norms had an RI of 0.16 for Black students with the AND method (total of 413 students identified), and increased to 0.24 when the top 10% (total of 722 students identified). Similarly, RI for Hispanic students using the 90th percentile with national norms for the OR method had an RI 0.71 (total of 1,972 individuals identified), but decreased to 0.47 when selecting the top 10% (total of 707 individuals identified). The correlation between measures would have to be substantially smaller for the OR score combination to have a significant impact on RIs.
The MEAN score combination resulted in the fewest students identified when a fixed cut score was used, compared to previous research indicating that the AND score combination method would identify the fewest students (Lakin, 2018). On the MEAN identification method, the scores are reduced to a single metric, which is not sensitive to the number of measures used or the correlations between measures (McBee et al., 2014). However, in the current study, there was a regression toward the mean with the averaging of five scores. For example, post hoc analysis of the achievement and cognitive ability scores had a mean of 101.21 and a standard deviation of 12.32. The mean was similar to the expected SAS of 100, but the standard deviation was less than the expected distribution of 16. Another reason the MEAN method identified fewer students is that the AND score combination in the current study had an OR method nested within it. That is, an individual needed either the math or reading achievement score above the cut score, and they needed either the verbal, nonverbal, or quantitative score above the cut score to be identified. Significantly fewer individuals would be identified if they needed all five scores above the cut score.
Implication for Practice
Schools and districts are looking for ways to address equity issues within their gifted education programs. They may look to universal assessment with multiple identification measures to address this issue. In this study, a district that was diverse by race/ethnicity with mean differences between racial/ethnic groups was examined. Meaningful and statistically significant increases in RIs for Black, Hispanic, and multiracial/multi-ethnic students can still be obtained when switching to local-building norms. However, districts may expect smaller increases in RI, similar to those observed in the current study, than those reported in previous studies (Peters et al., 2019). Districts with higher proportions of individuals from historically underrepresented groups (e.g., Black and Hispanic students in this study) would likely see larger impacts of using local-building norms than found in this study (Warne & Larson, 2022). In addition, districts may look to different score combination methods. The impact of the AND and OR score combination methods on increasing RIs is related to the correlation between measures (McBee et al., 2014). Districts and schools would need to examine the correlation between measures for different groups to determine the effect of the AND or OR score combination method. In this study, the correlation between measures for each race/ethnicity were different, but did not result in expected patterns of RIs changes. However, using the AND or OR score combination increased RIs for Black and Hispanic students compared to using the MEAN method, even when the number of individuals remained constant. Using an overall average correlation may not accurately represent the relationship between measures and identification, given the numerous ways scores can be combined to identify a student for gifted programming. Districts may consider methods that increase the number of students identified, as the current study and previous research demonstrated that increasing the number of students who are identified will increase the RIs for Black and Hispanic students being identified, even when mean differences exist between groups (Lakin, 2018). However, using different score combination methods or norms produced equitable RIs for Black or Hispanic students. Instead, districts look to other methods of increasing representation from historically marginalized groups such as frontloading experiences to address some of the inequities that result from unequal opportunities to learn (Peters, 2022).
Limitations and Constraints on Generality
First, the data came from a single district in the Midwest. Although the sample was diverse in terms of race/ethnicity, the results may not generalize to other districts, especially those with different student populations. Second, the CogAT and FastBridge measures were provided in a group setting on a computer or tablet device. Teachers were instructed to ensure that students provided their best effort, but it is unknown if this occurred. Third, CogAT screening took place once a year for first- and fourth-grade students only. The district followed this process for sustainability purposes. Data from previous years were used for students in other grades. This means that CogAT data would not be available for students who transferred into the district after the screening date for their respective grade. This would disproportionately impact transient students. In the dataset, no students had missing CogAT scores, 86 students had missing aReading scores, and 284 students had missing aMath scores. There is an unknown number of students who had missing scores but were not provided. It is unknown what effect this would have on the results. The current study used FastBridge aMath and aReading as measures of academic achievement. These measures were designed to be used within a response to intervention framework, not as measures for identifying giftedness, and may not align with the services provided in the program. Likewise, although aReading and aMath are intended to measure overall reading and math achievement, their primary purpose is to identify students at risk for reading and math delays, respectively, and to provide recommendations for intervention (Illuminate Education, 2021). Lastly, there are other constructs within the definition of giftedness (e.g., creativity or leadership); however, these constructs were not investigated.
Future Research
In the current study, there were mean differences between groups that resulted in different rates of gifted identification across race/ethnicity. Mean differences on academic achievement and cognitive abilities may occur due to unequal distribution of life experiences across racial/ethnic groups or test bias (i.e., measurement invariance; Peters, 2022). In this study, measurement invariance was not examined and its effect on the results are unknown. In addition, students from different racial/ethnic groups had different correlations between academic achievement and cognitive ability scores, in addition to mean differences. These results show the presence of some differential criterion validity. Additional research is needed on how other measures correlate with each other across racial/ethnic groups and their impact on the identification of gifted students using different score combination methods. Lastly, mean differences between groups had the largest impact on gifted identification in the current study. Tools that measure other constructs might have similar means and correlations across racial/ethnic groups; therefore, changing identification rates when using different score combination methods. Additional research is needed on different measures and their ability to identify racially/ethnically diverse students for gifted programs.
Conclusion
The current study highlights the importance of schools and districts to examine their data to support the claims they make when using different identification procedures. If the purpose of using different norms and score combinations is to reduce the disproportionate representation of identified gifted students across race/ethnicity, then schools and districts must examine their own data to determine whether their methods yield the expected outcome. The results of the current study showed that in a racially/ethnically diverse district with mean score differences between racial/ethnic groups, meaningful and significant increases in RIs were observed when using local-building norms or different score combination methods. However, different identification methods did not result in equitable representation for all groups. Higher mean scores for Asian and White students resulted in their groups being well-represented or overrepresented, regardless of the score combination and norms used. Black and Hispanic students had lower mean scores, resulting in the underrepresentation of the group in gifted identification. Methods that increased the number of individuals identified increased RIs for Black and Hispanic students. Schools and districts that are diverse by race/ethnicity with mean differences on identification measures may consider adding other methods of reducing disproportionate racial/ethnic gifted identification in addition to using local-building norms or different score combination methods.
Supplemental Material
Supplemental Material - Using Universal Consideration and Group-Specific Norms to Identify Students for Gifted Programming: An Empirical Investigation
Supplemental Material for Using Universal Consideration and Group-Specific Norms to Identify Students for Gifted Programming: An Empirical Investigation by Jared Izumi in Gifted Education International.
Footnotes
Funding
The authors received no financial support for the research, authorship, and/or publication of this article.
Declaration of Conflicting Interests
The authors declared no potential conflicts of interest with respect to the research, authorship, and/or publication of this article.
Supplemental Material
Supplemental material for this article is available online.
Author Biography
References
Supplementary Material
Please find the following supplemental material available below.
For Open Access articles published under a Creative Commons License, all supplemental material carries the same license as the article it is associated with.
For non-Open Access articles published, all supplemental material carries a non-exclusive license, and permission requests for re-use of supplemental material or any part of supplemental material shall be sent directly to the copyright owner as specified in the copyright notice associated with the article.